Article

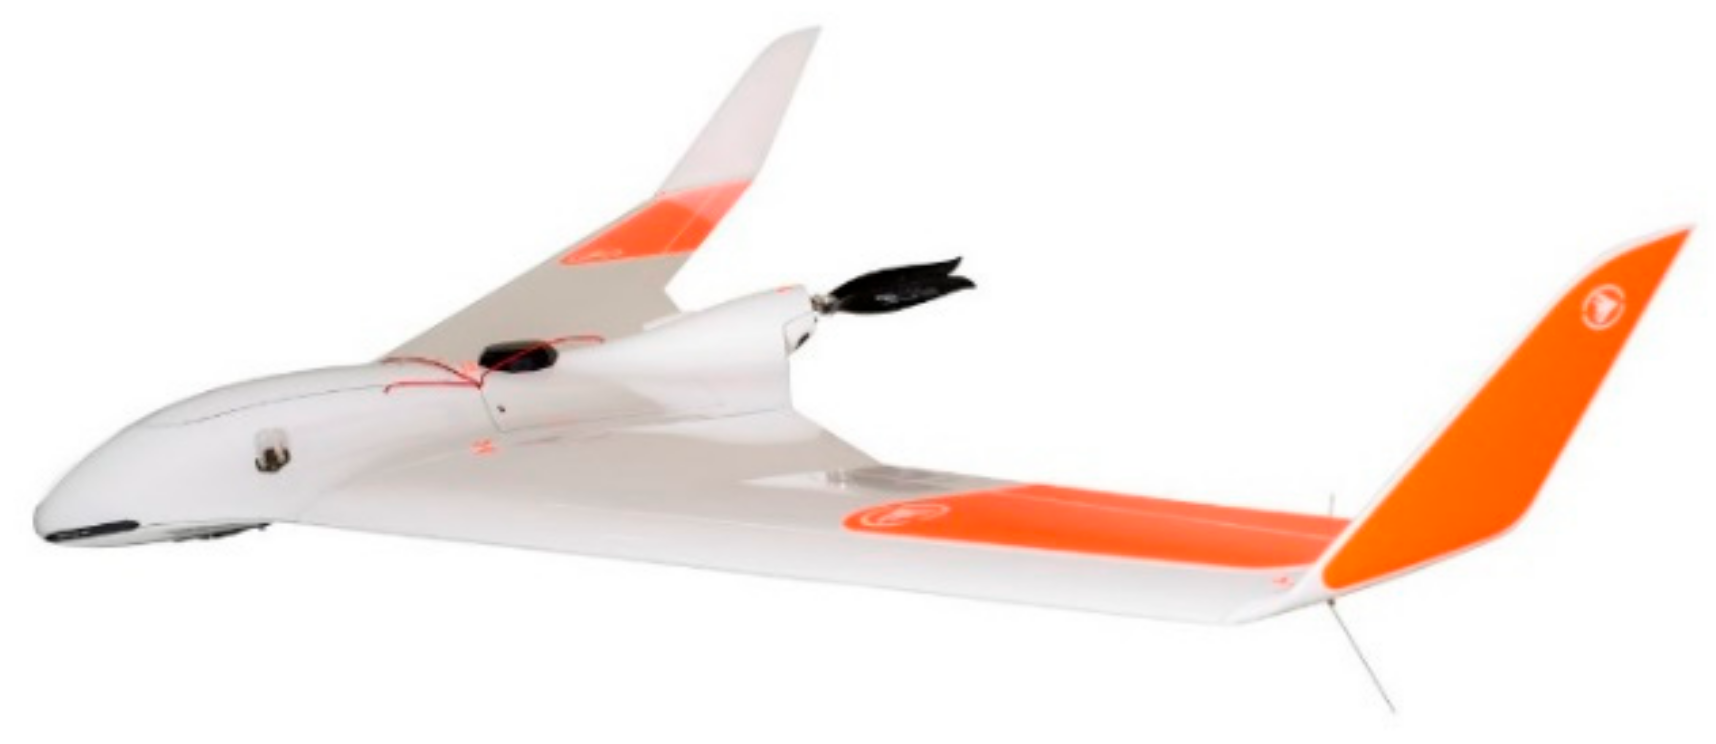
Exploiting Solar Energy during an Aerial Mapping Mission on a Lightweight UAV

1
C-Astral Aerospace, Ltd., 5270 Ajdovscina, Slovenia
2
Faculty of Electrical Engineering, University of Ljubljana, 1000 Ljubljana, Slovenia
*
Author to whom correspondence should be addressed.
Electronics 2021, 10(22), 2876; https://doi.org/10.3390/electronics10222876
Submission received: 26 October 2021 / Revised: 10 November 2021 / Accepted: 18 November 2021 / Published: 22 November 2021
(This article belongs to the Special Issue Drones and UAVs Energy Management Progress and Challenges)

Abstract

:
In this study, we present options for extending the endurance of a lightweight unmanned aerial vehicle (UAV), along with their advantages and disadvantages. We present a developed solution based on the use of gallium–arsenide (GaAs) solar modules installed on a UAV and connected to a custom-made maximum power point tracker (MPPT) with an integrated perturb and observe (P&O) algorithm. The mathematical behavior required to calculate the electrical energy production from solar energy on the UAV from known UAV angles of rotation, the position of the sun in the sky, solar irradiance measurements, the solar module area and the solar modules efficiency is presented. A comparison of the calculated and actual measured electrical energy production results during an aerial mapping mission is presented. We perform a number of aerial mapping mission flights and the experimental results confirm an energy efficiency value of more than 96.27% for the MPPT and extended flight endurance by up to 21.25%. In addition, onboard measurements and other data captured during flights confirm the proposed electrical energy production calculation.

1. Introduction

There are many different applications that call for greater unmanned aerial vehicle (UAV) endurance, one of which is aerial mapping. Globally, there are many interesting areas that can be scanned using this method. How long it takes to scan a desired area mostly depends on the area surface, camera type, flight settings, power consumption of the UAV and available electrical energy onboard. The available electrical energy is most often stored in a battery, which is usually used as a primary electrical energy source for lightweight UAVs, such as Bramor UAVs.
Bramor is a brand of electrically powered UAVs made by a company called C-Astral Aerospace, Ltd. [1]. This brand consists of different models that can perform different tasks. Some of them are intended for military uses and some are intended for civilian uses. The model that can be used for aerial mapping is called the ppX model (Figure 1). All Bramor models share the same type of fuselage, with a wingspan of 2.3 m, although they have different weights depending on the payload and camera type, among other factors. The mass of the ppX model is around 4.8 kg. Differing from other models, the ppX model also has a dual frequency GNSS receiver onboard, which is needed to achieve more accurate post-processing results. Bramor UAVs have an autopilot onboard for control, although there is also a communication link between the UAV and ground control station (GCS) intended for further UAV control. Bramor UAVs must be catapulted for takeoff and a parachute is used for landing.
The surface of the area to be scanned within one flight with a given camera type and flight settings [2] depends on the available amount of electrical energy saved in the batteries. If the area to be scanned is larger than the area that can be scanned during one flight, multiple flights are required. Multiple flights will require multiple takeoffs and landings. However, the takeoff and landing procedures are time-consuming, so it would be very advantageous to extend the length of each single flight in order to decrease the number of flights and the time taken to scan the desired area.
All Bramor models use a parallel connection between two four-cells LiPo batteries as a primary source of electrical energy. Each battery has a nominal charge capacity of 11 Ah, energy capacity of 162.8 Wh and mass of 820 g. The parallel connection provides a total nominal charge capacity of 22 Ah, total energy capacity of 325.6 Wh and total mass of 1.64 kg. This amount of energy is enough for up to 3 h of flight time in good weather conditions. However, there is a need for even greater endurance, with the question being how to achieve this.

1.1. Options for Extending the Endurance of Lightweight UAVs

We need to be aware that on any type of lightweight air vehicle, each additional gram of mass added onboard is significant. The heavier the air vehicle, the larger lift force is needed to maintain the air vehicle in the air. Therefore, greater motor throttle is required, which leads to greater UAV power consumption. Higher power consumption in combination with the same type of electrical energy source, for example batteries, results in lower UAV endurance.
The greatest extension in endurance normally comes from the option with the highest gravimetric density (ratio between provided electrical energy and mass (Wh/kg) of the system intended for endurance increase). However, we must also be aware that there is limited physical space onboard of lightweight UAVs, since they are small in size. Therefore, many options for extending endurance cannot be implemented since they require too much of space.
What options are available and what are their pros and cons?
Batteries with a higher gravimetric density than the battery already in use would definitely provide better endurance, although a market survey showed that the battery that is already in use has one of the largest gravimetric densities (around 200 Wh/kg) on the market for the time being. However, some types of Li-ion battery cells do exist with even higher gravimetric density levels (more than 240 Wh/kg) [4]. Regardless, one cell will not provide enough power, so it is necessary to connect multiple battery cells in series and parallel to make a battery pack following the required specifications. Since many metal connections between cells are needed, an additional mass is added. That additional mass reduces the gravimetric density of the battery pack, which is then around 10–15% lower than the gravimetric density of a single cell. The final result is only around 10% higher in gravimetric density than the battery already in use, which brings around a 10% increase in endurance. We also have to consider that Li-ion cells have a higher internal resistance compared to LiPo battery cells; consequently, a Li-ion battery with higher energy density at room temperature will last for a shorter time at lower temperatures with the same power consumption compared to LiPo battery. This is because the internal resistance is further increased by lowering the temperature, meaning the battery cut-off voltage will be achieved sooner.
There are some companies [5,6,7,8] around the world researching different battery options that promise gravimetric densities of more than 400 Wh/kg, although these technologies are still mainly in the research and development phase.
Internal combustion engines (ICEs) would provide the greatest extension in endurance, since the energy stored in a kilogram of gasoline is around 50× larger than the energy stored in a battery of the same mass [9]. However, the efficiency of ICEs is around four times lower than the efficiency of the three-phase synchronous motors already in use. However, there is still a huge difference in gravimetric density. Besides this, there would be less gasoline during the flight in the reservoir, meaning lower mass of the UAV over and consequently lower UAV power consumption. A serious problem with ICEs is the noise of the motor, in addition to ICEs not being synonymous with clean energy. Since the motor does not provide electrical energy, a small battery is still needed to supply the UAV electronics. Another negative side of ICEs is that a huge part of their energy is transformed into heat, which must be properly dissipated. Mainly because of the lack of usable space, this technology is not appropriate for small UAVs.
Fuel cell systems that produce electrical energy directly also provide greater gravimetric density than any battery currently available on the market. They are less noisy and more reliable than ICEs, since they consist of less moving parts [10]. Additionally, the electrical energy production process is clean in this regard. Fuel cells should be combined with a small battery, which is needed to provide extra power during high-demand phases of the flight. Since the ability of a fuel cell to produce power is limited, it is highly desirable to force the system to operate in conditions where maximum power is provided. This point is called the maximum power point (MPP), while the device that searches for this point is called the maximum power point tracker (MPPT). However, due to the lack of usable space, this technology is not appropriate for extending the endurance of small UAVs.
Solar energy is a source of a free energy that can be transformed into electrical energy with the use of solar cells. These solar cells are most commonly made from silicon and normally have efficiency rates of up to 20%. The record efficiency rate for a non-flexible silicon cell is 26.7% [11], although other materials also exist with better efficiency, such as gallium–arsenide (GaAs). Solar cells based on GaAs can provide more than 30% efficiency [12]. The downside is that such solar cells are very expensive, so they are most often used in space applications. There is also a requirement that solar modules, which consist of many solar cells, should be fitted on the wings of the UAVs, so they must be flexible, as shown in Figure 2. This is the only way that the modules can adapt to the wing shape. Basically, the drawback of using solar energy is that it can provide energy only under sunny weather conditions.
Solar modules exhibit current source behavior. The solar module is connected to the UAV battery via an electronic device called the MPPT. This tracker ensures that the maximum available electrical power is transferred from the solar modules to the battery under given conditions. The maximum power from the module can be retrieved if the module works at the MPP. Many different types of trackers with different MPP searching algorithms exist, although there are practically no off-the-shelf trackers intended for use on small UAVs. The trackers made by the Genasun company offer the best approximation, although they have a limited operating range for the input voltage, meaning they are not very appropriate for use with custom solar module variants [13].
Solar modules, despite certain limitations, can be exploited for use with small UAVs, since their assembly and installation is simple. Therefore, this technology was chosen to extend the endurance of the Bramor UAV. Additionally, the use of solar energy to increase autonomy could apply to the other types of vehicles, such as cars, buses and trucks [14,15,16].

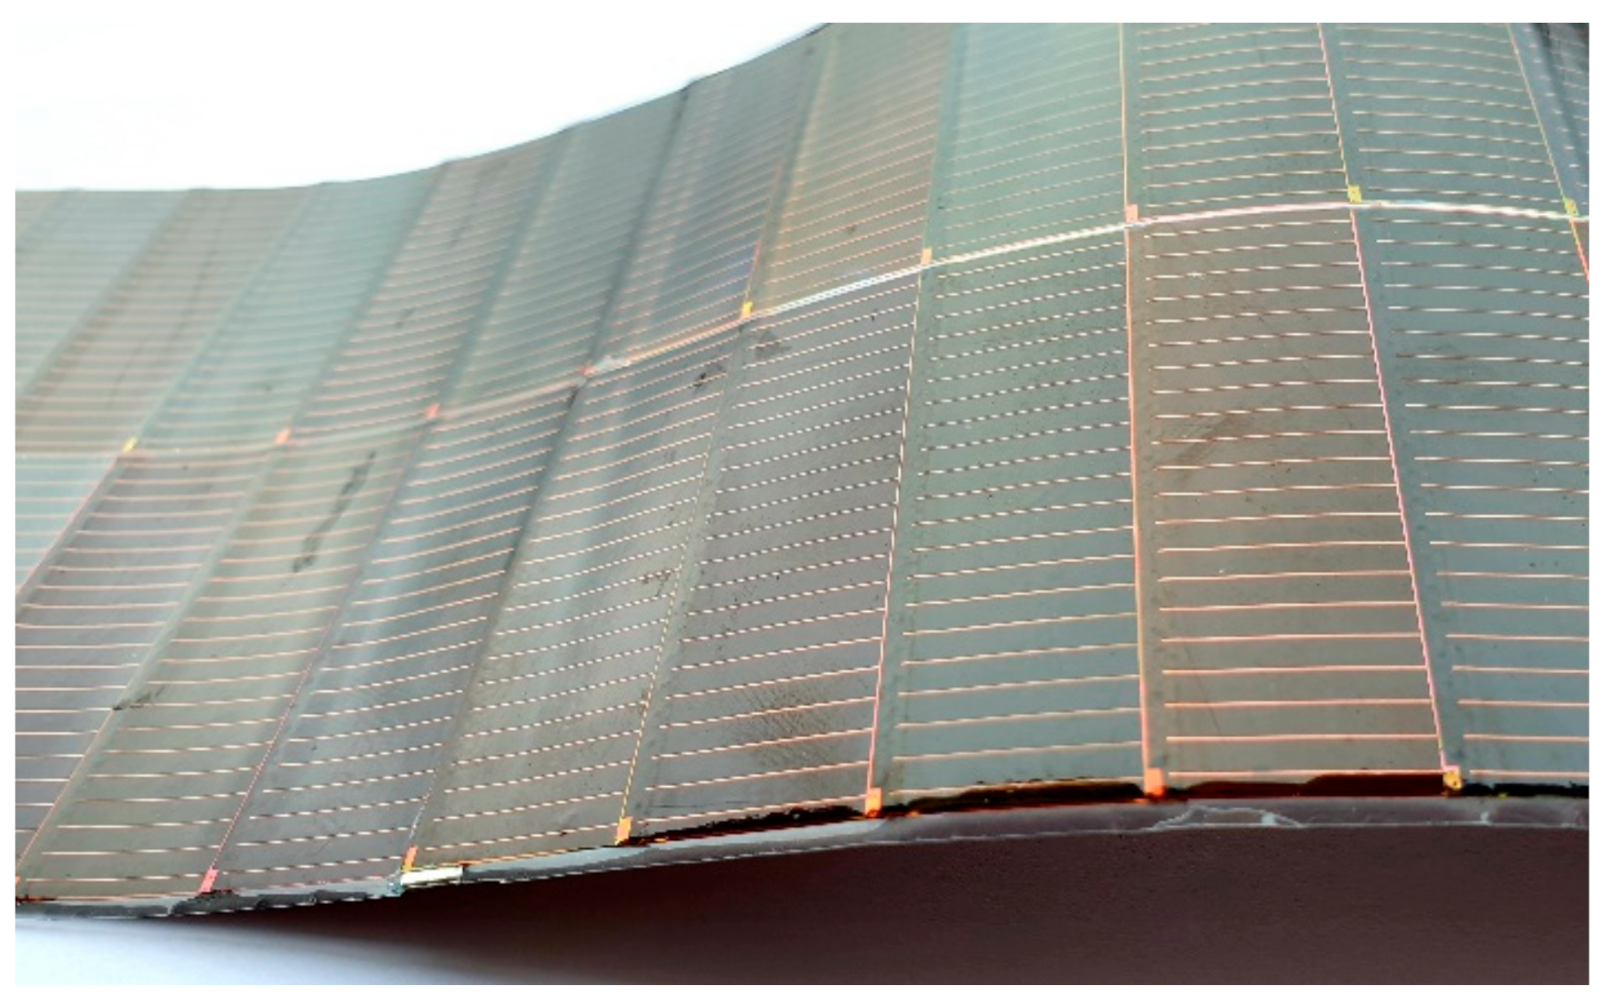
1.2. Overview of the Flexible Solar Modules Available on the Market

Globally, some companies are involved in the research, development and production of flexible solar modules. These modules differ in the materials they are made from and consequently in their technical specifications, with resulting price differences; however, there is no public information available regarding exact prices. Since there is also no detailed publicly available technical information about solar cells, it is very hard to select an appropriate product.
MicroLink Devices, Inc. [17], offers single-junction, dual-junction and triple-junction solar cells. Their cells are very efficient, with demonstrated efficiency rates of up to 31% at AM1.5. With a total thickness of less than 40 um, their cells are very flexible. The areal mass density of the cells is less than 250 g/m2, the power per unit area is greater than 250 W/m2 and the specific power is greater than 1000 W/kg. MicroLink Devices’ solar cells are very suitable for UAV applications because they their cells can be assembled into custom shapes.
Ascent Solar Technologies, Inc. [18], offers CIGS solar cells. Their cells have a specific power of more than 200 W/kg and areal mass density of less than 400 g/m2. There is no specific technical information about their solar cells available online.
Empa [19] is working on high-efficiency thin film solar cells based on chalcogenide (CIGS, CdTe, CZTS) and organometal peroskvite absorbers, both on rigid and flexible substrates. They developed a CIGS flexible solar cell with a record efficiency of almost 21.4% [11] in laboratory conditions. There is no additional technical information available about their solar cells.
SolAero technologies, Corp. [20], offers space-optimized solar cells that are also fully space qualified. Their solar cells are also used on the Ingenuity rover, which was the first aerial vehicle ever flown on another planet [21]. This manufacturer produces four junction solar cells with extremely high efficiencies rates of up to 33%.
Until the end of 2019, a company called AltaDevices, Inc. [22], were producing solar modules. This company fabricated highly efficient solar cells with a record for single-junction and dual-junction cell efficiency rates of 28.8% and 31.6%, respectively [23]. The areal mass density of their cells was 114 g/m2, the power per unit area was greater than 250 W/m2 and the specific power was greater than 1000 W/kg. This solar cell type was chosen to extend the endurance of the Bramor UAV.

1.3. Purpose, Goals and Innovative Aspects of this Study

The arguments discussed in Section 1.1 and Section 1.2 led us to the purpose of this study, which was to verify whether an efficient and space-saving technology exists that can be used to extend the endurance of lightweight UAVs. Greater endurance means that less time will be needed to finish scanning very large areas where multiple flights are currently required instead.
The main goal of this study was to develop an MPPT that fits the technical and physical requirements. The MPPT must be as efficient as possible. The additional goal of this study was to express a mathematical relation between the electrical energy production from solar modules and the airplane rotation, with the known location of the flight, time of the flight, indirectly known global horizontal irradiance (GHI) and diffuse horizontal irradiance (DHI) at that location.
The main innovative aspects of this study are the MPPT, which is suitable for use on small and lightweight UAVs, and the mathematical model, which enables UAV operators to calculate the electrical energy produced from the solar modules during a flight in advance. The mathematical model was tested on actually performed flight data, although the calculation process is the same if simulation data for the planned flight are used instead. To the best of our knowledge, this functionality has not been presented yet in any UAV application.

1.4. Structure of This Study

This paper is organized as follows. In Section 2, the scientific background and the related research work are presented. This chapter is divided in two subsections: electromagnetic radiation and photovoltaic effects, and solar cell characteristics and maximum power point tracking. Section 3 presents the research methods and materials used. In Section 4, the experimental results are presented and discussed. The conclusions and future research directions are outlined in Section 5.

2. Scientific Background and Related Research Work

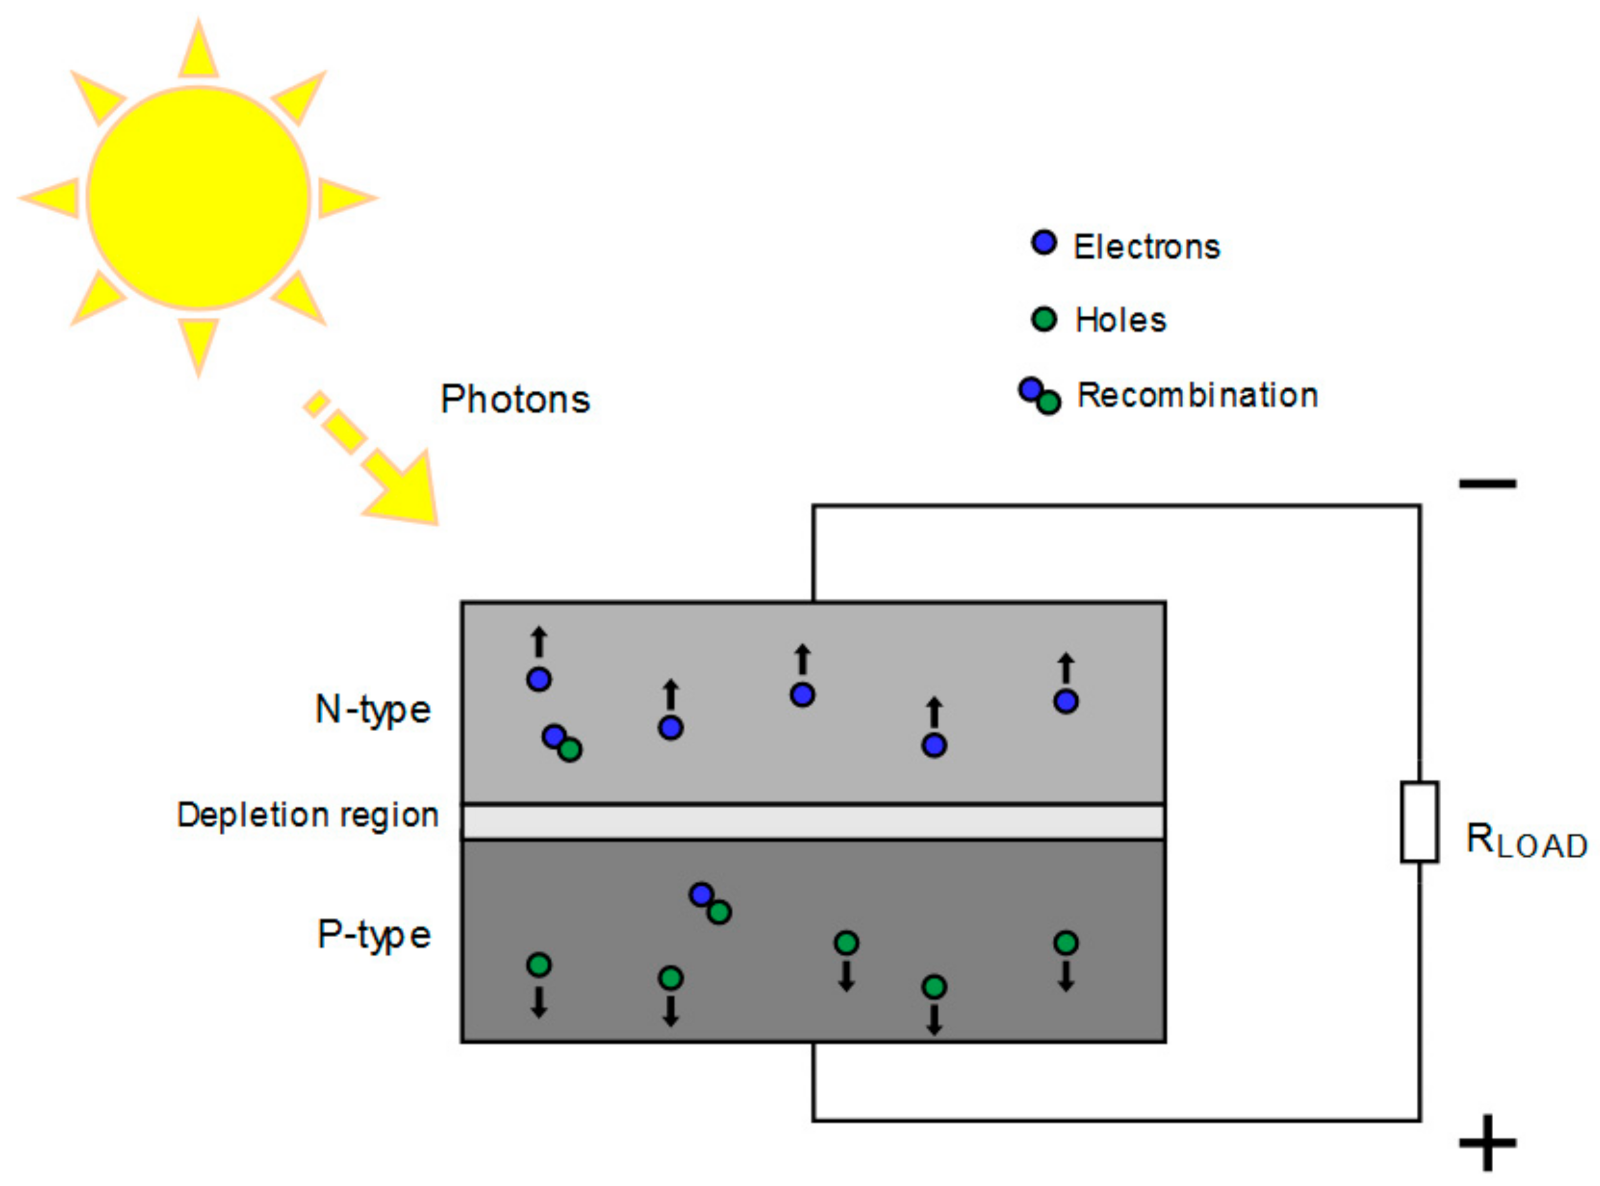
2.1. Electromagnetic Radiation and Photovoltaic Effect

Electromagnetic radiation emitted by the sun covers a very large range of wavelengths. It consists of radio waves, infrared light, visible light, ultraviolet light, X-rays and gamma rays. The spectrum consists mainly of 44.7% visible radiation, 6.6% ultraviolet radiation and 48.7% infrared radiation [24]. The total radiation emitted by the sun is practically constant throughout time, except for sunspots, solar flares and prominences. These variations are very small and can be neglected in solar applications. The radiation from the sun can be approximated as the emissions from the black body at a temperature of 5800 K [25]. Light emitted by the sun is quantized into particles called photons.
The conversion of solar energy into electricity is the called photovoltaic effect. This was discovered in 1839 by the French physicist Edmond Bequerel [26]. When a solar cell is under sunlight, the absorbed amount of light is transformed into electricity, while the remaining sunlight can be reflected or passed through [27]. Solar cells are normally connected in parallel and series to increase the current and voltage to the required values for a given load.
The simplified operation of a solar cell is shown in Figure 3.

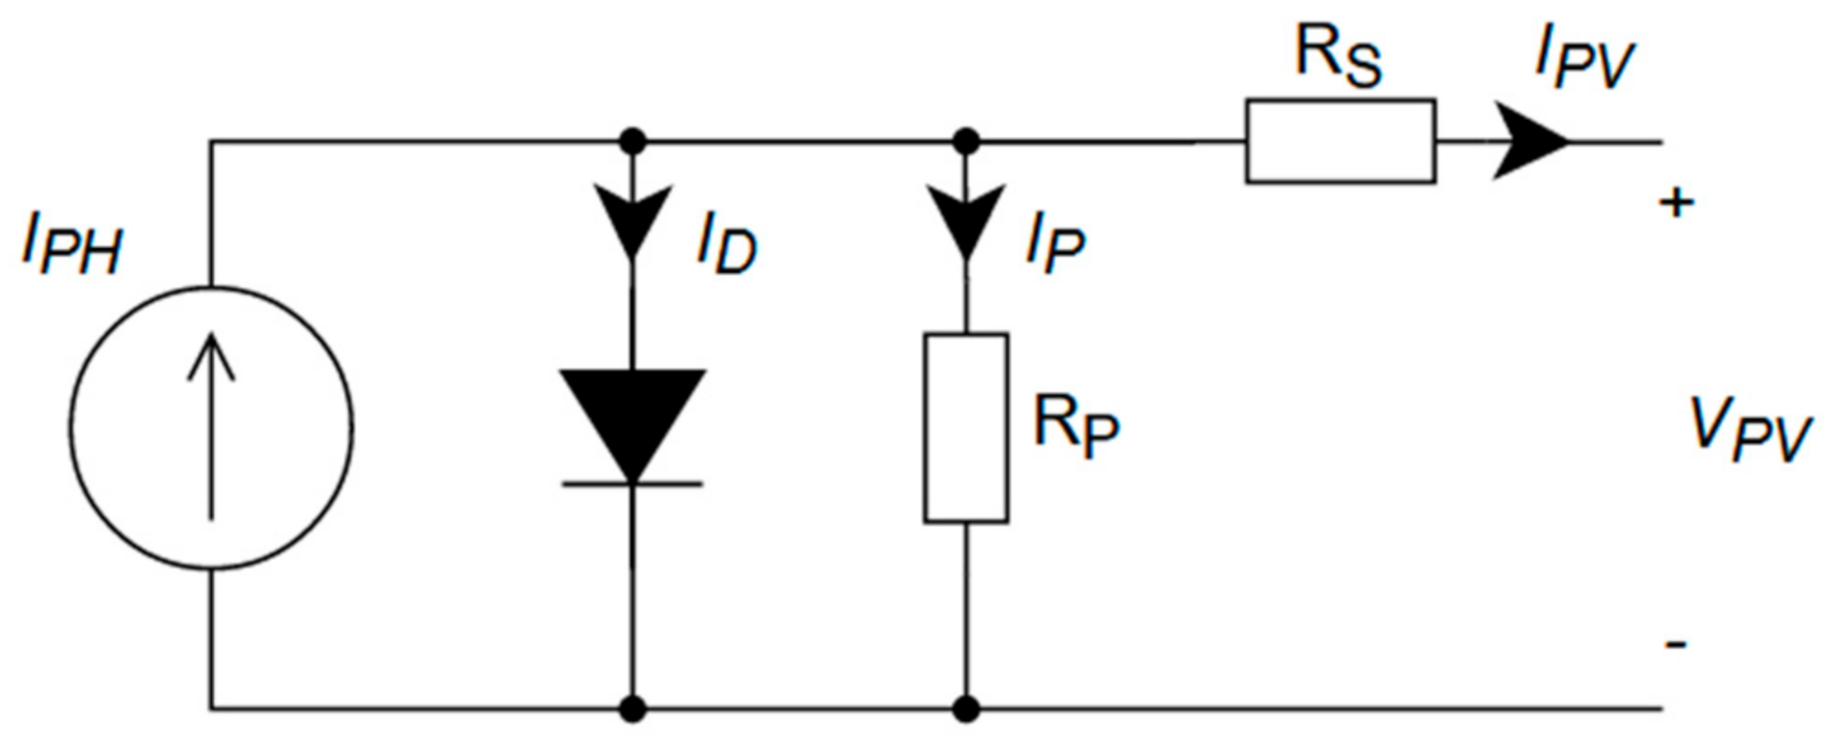
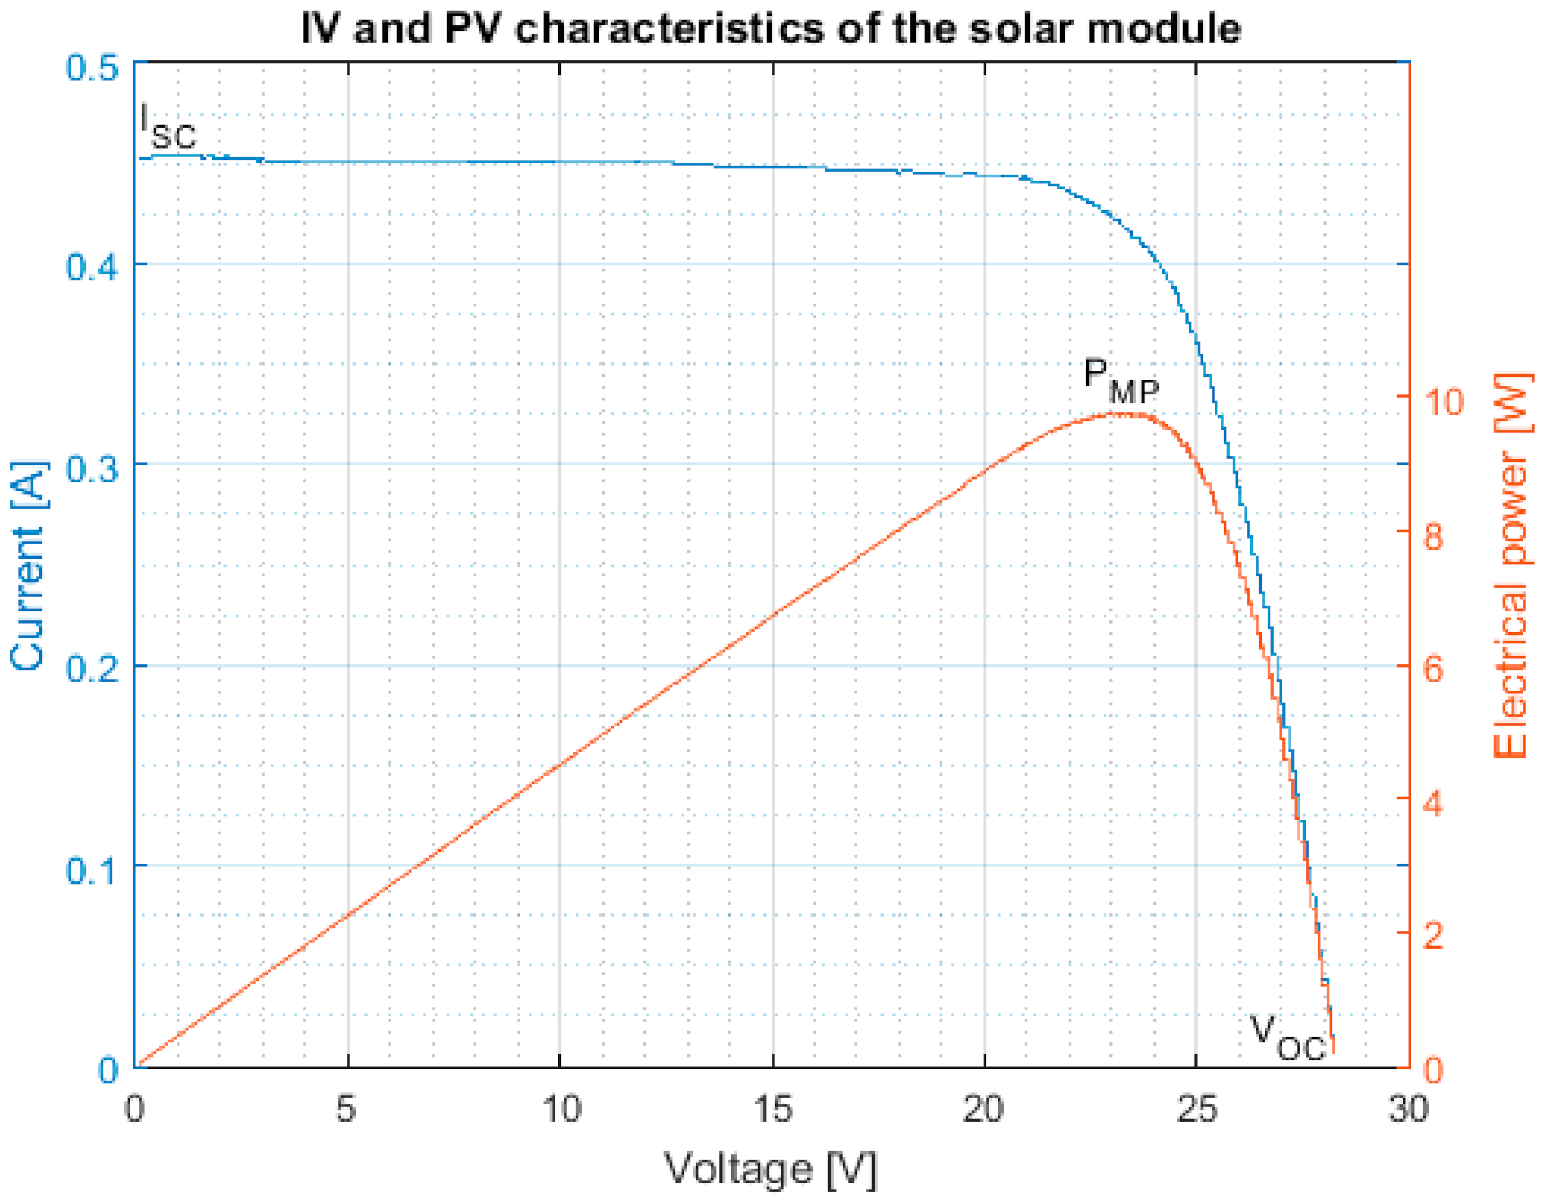
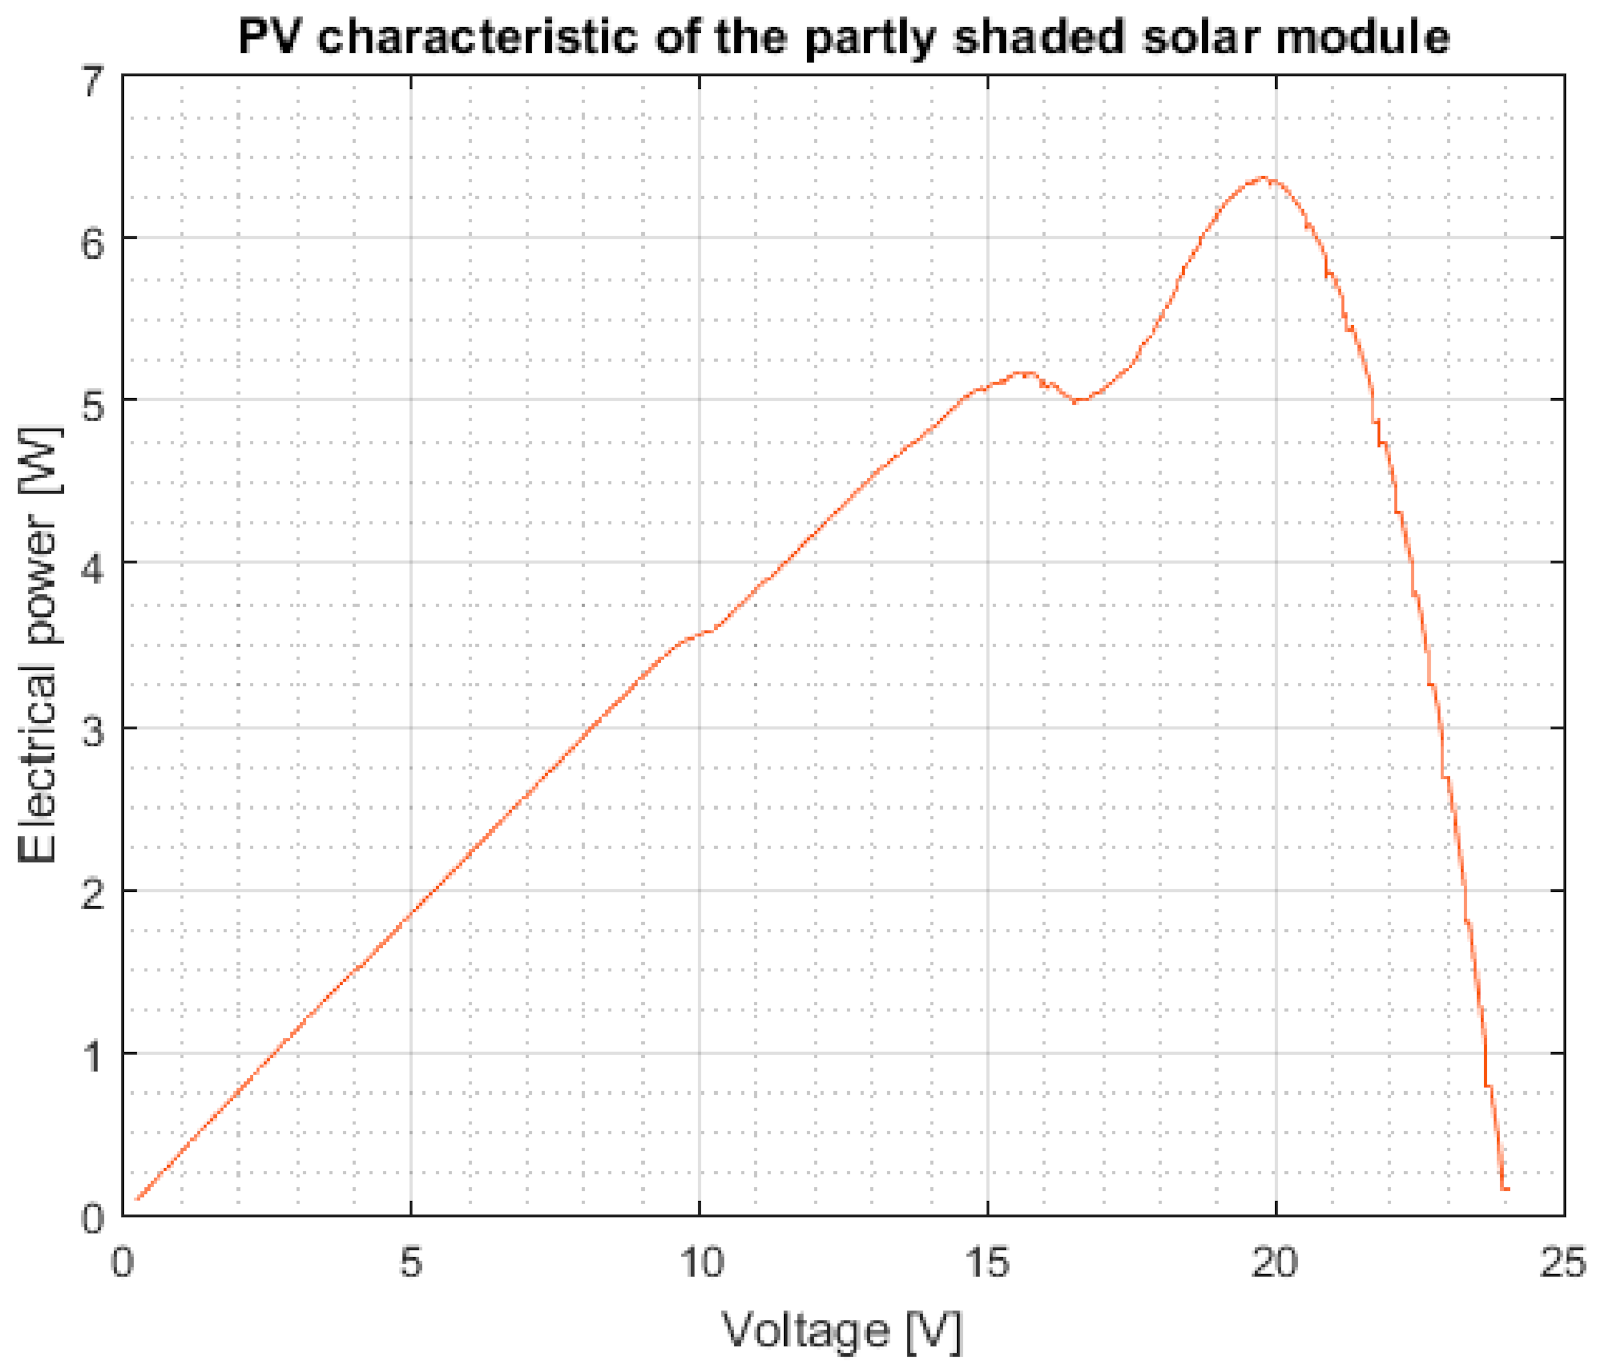
2.2. Solar Cell Characteristics and Maximum Power Point Tracking

Solar cells can be represented by using a simplified single-diode equivalent circuit [28], as shown in Figure 4. The amount of current produced by the source is directly proportional to the amount of illumination incident on the solar cell. The purpose of the diode shown in Figure 4 is to limit a current in one direction, so that the solar cell will not use energy when it is shaded or at night. A solar cell experiences parasitic resistances that limit the amount of power delivered by the device. These resistances define the quality of the electrical connection within the cells. A parallel resistance (RP) should be maximized to prevent the flow of the current through any circuit elements but the diode. The series resistance (RS) should be as low as possible to minimize unwanted power dissipation [29].
The highest possible current generated by the solar cell is called the short-circuit current (Isc). This is the current when the solar cell is in short-circuit mode. Another characteristic point is the open-circuit voltage (Voc), which is the maximum voltage on the cell when no load is connected to the cell. There are also two additional parameters that characterize a solar cell. The first one is the fill factor (FF), which in conjunction with the VOC and ISC determines the maximum power provided from the solar cell. The second one is efficiency (η), which is defined as the ratio of the output energy from the solar cell to the input energy from the sun. All four parameters can be determined from the input voltage (IV) [30]. The IV and the corresponding power voltage (PV) for the exemplary solar module, consisting of more solar cells, are shown in Figure 5.
To continuously obtain maximum power, the solar module must constantly operate at the maximum power point (MPP). Under uniform irradiance, IV and PV characteristics have a standard shape with one and unique MPP, which is shown as PMP in Figure 5. Finding the MPP under uniform solar irradiance is not a complex task. Problems arise when an array of solar modules is used and partial shading occurs. Partial shading can be caused by moving clouds, buildings, trees and other obstacles. The period of shading caused by clouds varies from seconds to hours. The value of the local MPP mainly relies on the value of the received solar irradiance. Therefore, different local maximum power point peaks (LMPPs) influence the PV, as shown in Figure 6. The question arises as to which LMPP is also the global maximum power point (GMPP). Partial shading also reduces the lifetime of the PV system due to the hotspot phenomenon. To avoid hotspot formation and reverse current flow, a bypass diode is integrated in the solar module [31,32].
The maximum power cannot be gained from the solar module without the use of the MPPT, which is located between the solar module and battery on the other side, as shown in Figure 7. The MPPT usually consists of a DC/DC switcher regulator in combination with an additional circuit or device with MPPT functionality.
MPPT functionality can be performed in analog, digital or most often digital–analog mode, where the core component of the MPPT functionality is a microcontroller unit (mCU) or other type of computing device that manages the duty cycle of the DC/DC switcher converter as a core component of the MPPT [33,34]. Changes to the DC/DC switcher duty cycle should be reflected in the different electrical power levels generated by the solar module. The goal of changing the DC/DC duty cycle is to find the MPP. The main task of the MPPT is to find the MPP rapidly, with less convergence time and less oscillation. Finding the MPP can be achieved via searching or calculation [32].
In such cases, an algorithm is run on a computing device intended to track the MPP. The efficiency of that type of MPPT depends on the algorithm efficiency and also on the efficiency of the hardware components, such as losses in transistors and inductors.
Algorithms differ mainly in the speed of tracking the MPP, the complexity of implementation, the type of sensors, for ex. temperature, whose measurements act as input data into the algorithm [35,36,37,38]. Algorithms are divided into indirect and direct [35,39]. Direct algorithms require current and voltage measurements of the solar modules, meaning the determination of the MPP position is independent of the non-electric quantities, such as solar irradiation and temperature. On the other hand, indirect algorithms determine the position of the MPP by known non-electric quantities. That type of algorithm is more complex and expensive in terms of integration. The most commercially widespread direct algorithms are perturb and observe (P&O) algorithms and incremental conductance (IC) algorithms [40,41,42]. Both algorithms are very effective under stationary conditions, although with faster changes in irradiance, their effectiveness can be lowered due to the loss of the tracking direction. However, most algorithms introduce a certain loss under stationary conditions, which depends on the voltage oscillation around the MPP [40,43,44].
In the literature, many algorithms have been proposed, most often as upgrades of basic P&O and IC algorithms [42,43,45,46,47]. These algorithms offer improved efficiency via faster tracking speeds and variable step sizes. When the duty cycle is near the MPP or GMPP, the step size is decreased, which results in a smaller voltage oscillation around the MPP. The problem is that most of the algorithms are not tested under the proposed standard for testing algorithms, EN50530 [48], but are verified under the test sequences proposed by the authors of various articles. Therefore, it is very difficult to compare algorithms with each other.
In the literature, it is also possible to find attempts at increasing the autonomy of UAVs with the use of solar technology [49,50,51,52,53,54,55,56]. This research area is of most interest to the aerospace industry and academics. We can state that the greatest extension of endurance of lightweight UAVs will be through the solar modules themselves. The efficiency of the algorithm is also very important, although without appropriate testing, usually involving the use of special laboratory equipment that can perform tests under the EN50530 standard, it is not possible to assess whether a new algorithm offers better performance.

3. Methods and Materials

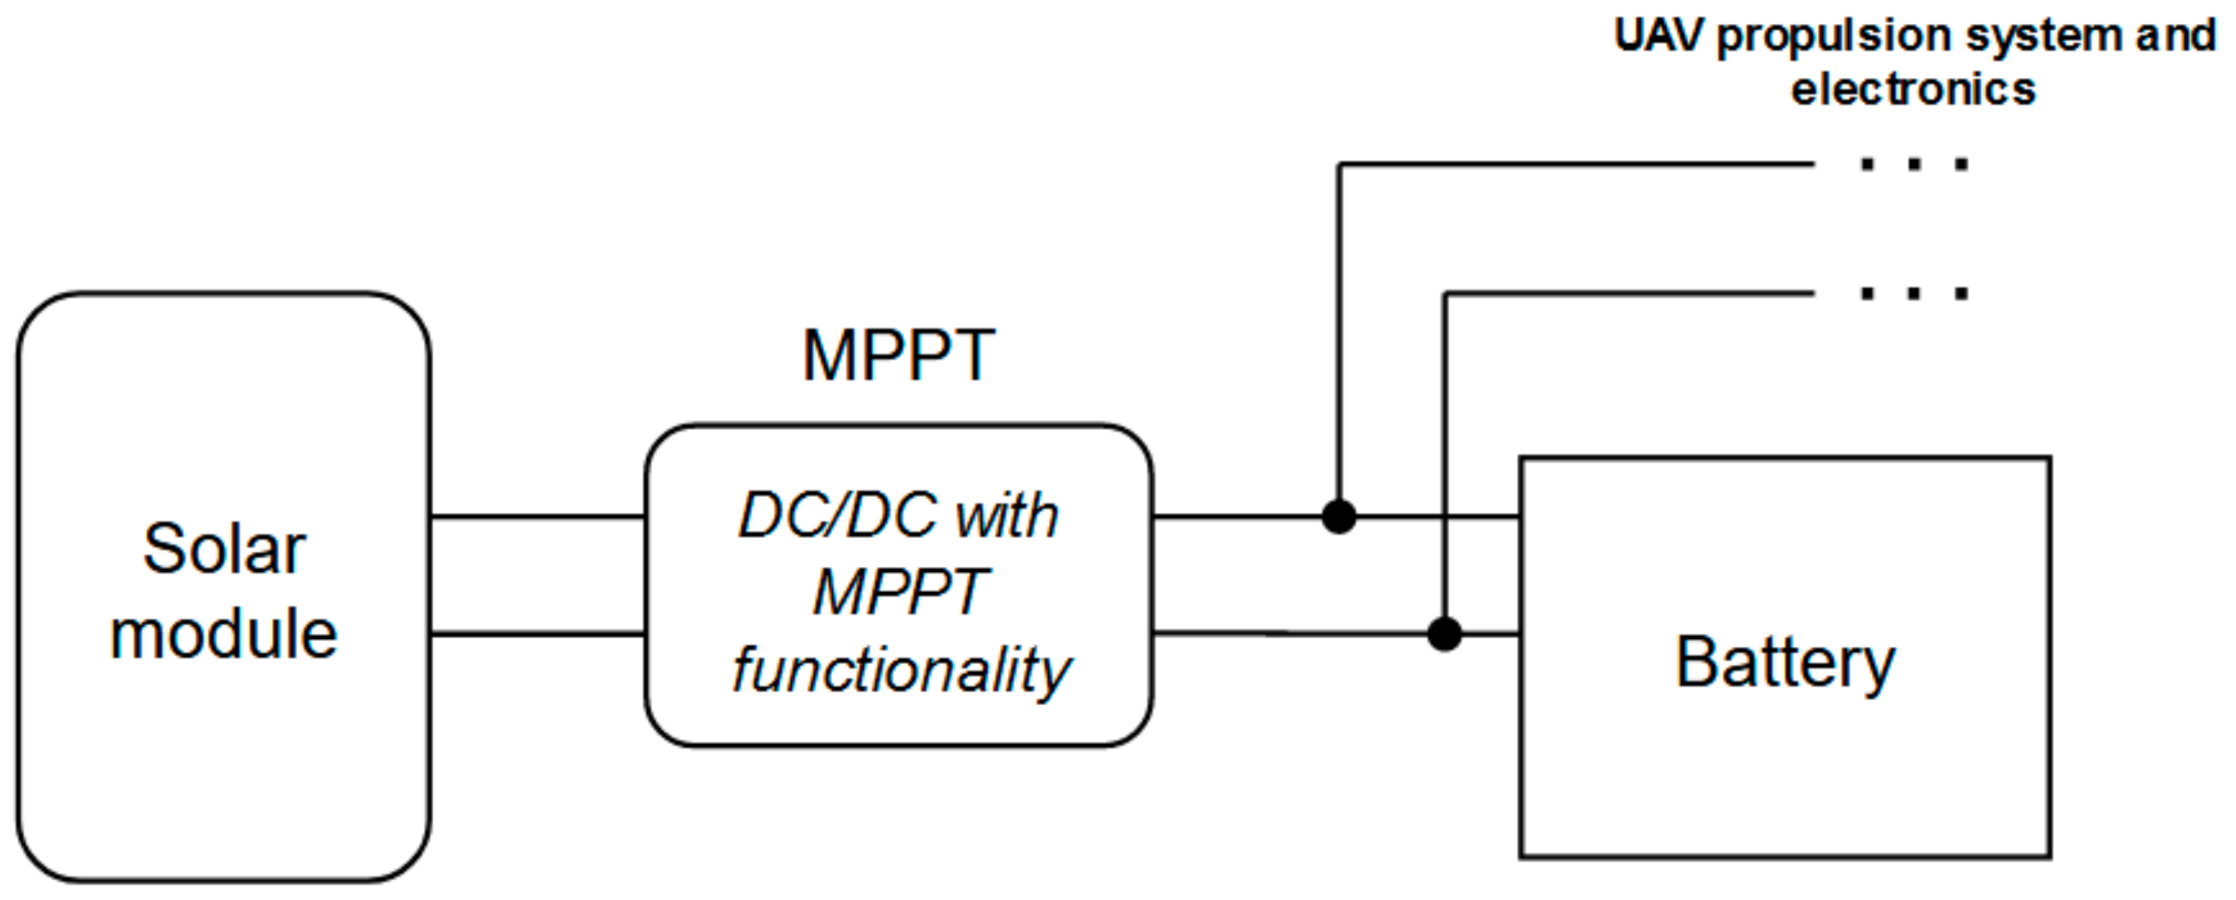
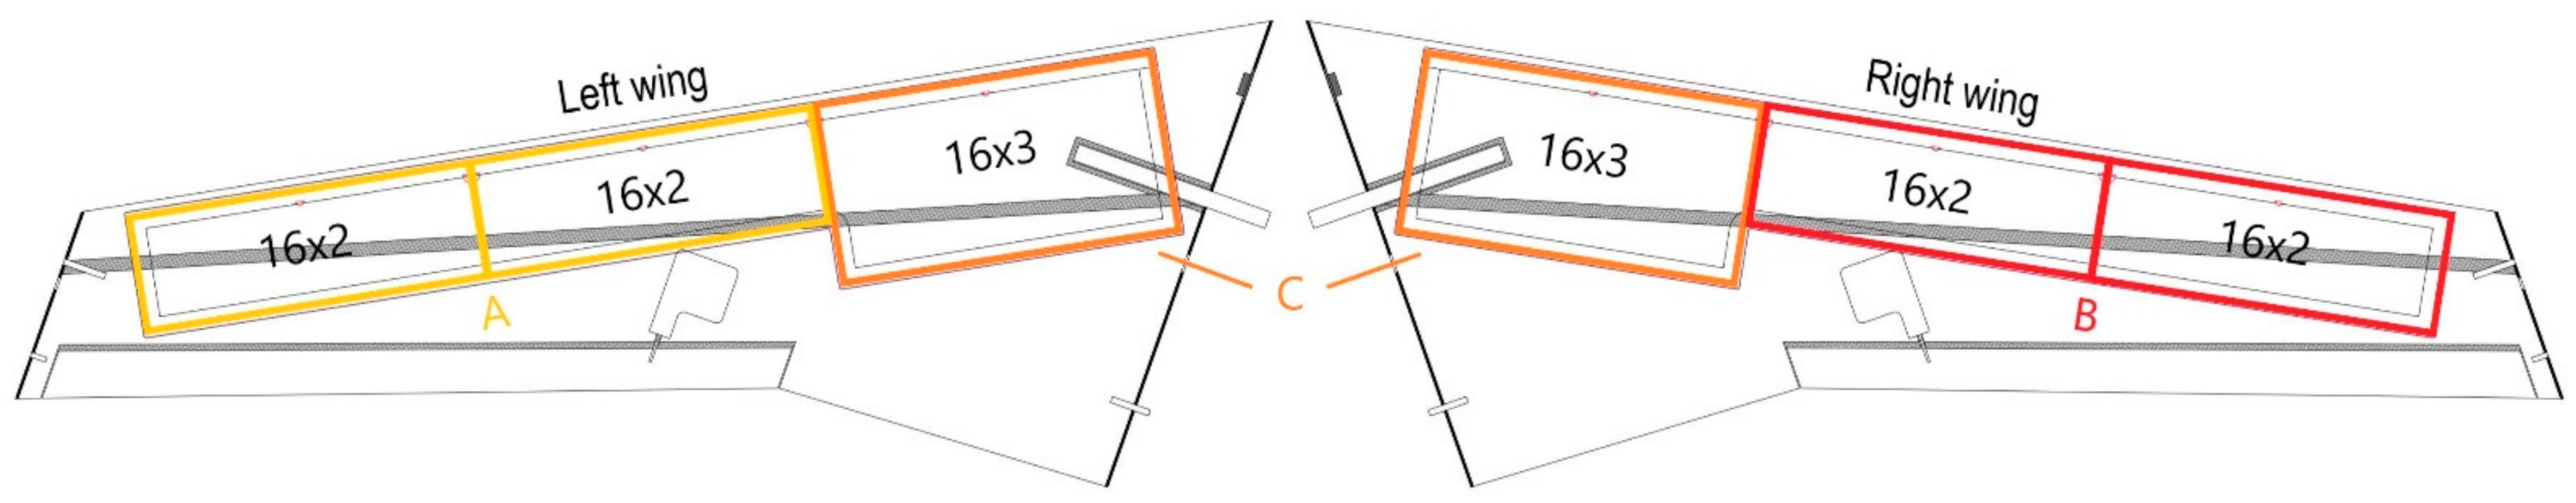
3.1. Solar Modules and MPPT

Six single-junction GaAs-type solar modules used for the endurance extension of the Bramor UAV were produced from Alta Devices, Inc. In the model, four modules consist of two parallel chains of sixteen solar cells (named 16 × 2) connected in series and two modules consist of three parallel chains of sixteen solar cells (named 16 × 3) connected in series (Figure 8). On each wing, both modules of the same size (16 × 2) are connected in series to achieve a higher voltage and consequently lower transmission losses. For the same reason, a 16 × 3 module on the right wing is connected in series with a 16 × 3 module on the left wing.
As shown in Figure 8, there are three separate solar module chains. The chain of two 16 × 2 modules connected in series on the left wing is assigned as chain A, the chain of two 16 × 2 modules connected in series on the right wing is assigned as chain B and the chain of 16 × 3 modules connected in series is assigned as chain C.
The modules were mounted on the Bramor UAV’s wings, as shown in Figure 9.
The optimal solution would be to connect each chain to its own MPPT, although since the space was very limited, all three chains were connected to the same input of the MPPT. The technical specifications of solar modules are shown in Table 1. The nominal values at room temperature (25 °C) and values at 10 °C and 60 °C are listed. The temperatures of 10 °C and 60 °C represent the minimal and maximal expected solar module temperatures under operating conditions. The values at these temperatures were calculated using given temperature coefficients.
Parallel connection of all three chains at the input of MPPT is not recommended, since the current can flow from the unshaded chain to the shaded chain when all chains are not under uniform irradiation. Therefore, each chain is connected to the input of the MPPT via a diode; specifically, a solution denoted the ‘ideal diode’ was used. The ideal diode replaces the ordinary diode but is actually an N-channel MOS transistor in combination with a dedicated driver LTC4359 [57] made by Analog Devices, Inc. The reason for using the ideal diode is to decrease power losses. This is achieved by using the lower forward voltage regulation technique on the transistor (30 mV), since the voltage drop on a Schottky diode is at least 10× higher at these current values.
As shown in Table 1, the maximal expected voltage at the input of the MPPT should be 36.06 V, which is the maximal VOC voltage at the lowest temperature (negative voltage temperature coefficient). The maximal current we can theoretically expect at the MPPT input is the sum of ISC currents of all three chains, which occur at the highest temperature (positive current temperature coefficient). The calculated sum is 1.65 A. The maximal input power is not the product of the maximal VOC voltage and the sum of all ISC currents, since these points are each on their own side of the IV characteristic (Figure 5). As shown in Table 1, the expected maximal power, PMP, is achieved at the lowest temperature and represents the sum of the maximum power of all three chains at 10 °C, which equals 48.02 W (13.72 W + 13.72 W + 20.58 W).
At the output side of the MPPT, we have to consider that the LiPo battery has a full battery voltage of 16.8 V or 4.2 V/cell. It has very little internal resistance, and since it supports a very high charge and discharge rate (a few hundred amperes), there is no current limit needed at the MPPT output side.
Since the power consumption of the UAV is much higher than the solar modules can produce, the battery still discharges during the flight. It is important that there is no fail-safe that can disable the functionality of the MPPT for this reason. A detailed schematic of the endurance extension system is shown in Figure 10.
As shown in Figure 10, each MPPT input line and output line has involves current and voltage monitoring. This brings about the possibility of monitoring the current and voltage to calculate the power on each chain with solar modules and the MPPT output during the flight. These measurements are performed using the INA233 [58] current, voltage and power monitor made by Texas Instruments, Inc.
As a core component of the MPPT, an LT8490 DC/DC buck–boost controller [59] with a P&O-type MPPT algorithm was chosen. The controller tracks the MPP every 180 s. If a new MPP with a higher yield is found, the controller continues with tracking around the new point.
A core component of the LT8490 controller is the LT8705 buck–boost switching regulator controller [60]. This can provide a voltage above, equal or below the input voltage and is appropriate for a wide range of input voltages with a maximum of 80 V. The same maximum also applies to the output voltage.
The internal A/D conversion value of the LT8490 controller is 10 bits of resolution, although the A/D resolution of the PWM signal needed to properly measure and modulate input and output voltages is 8 bits. The LT8490 controller also includes a battery charging algorithm denoted as the constant current/constant voltage (CC/CV) algorithm, which is most widely used for Li-ion and LiPo batteries. Battery charging is performed when the electrical energy production is higher than the power consumption of all potential loads connected to the battery at the same time. In our example, battery charging is usually performed when the UAV is on the ground. For a full battery voltage setpoint, 16.6 V is selected, which for safety reasons is 0.2 V lower than the value of a completely full battery.
All external components, such as inductors and transistors, must be calculated and chosen properly. The requirements of these components depend on the known input/output current and voltage ratios on the basis of the chosen switching frequency, which is 202 kHz. This frequency is a compromise between the physical size of the inductor and input/output capacitors on one side and switching losses on the other side [61].
The buck–boost switcher logic requires four transistors. One pair of transistors handles switching in buck operation mode, another pair of transistors handles switching in boost operation mode and all four transistors handles switching when the output voltage is similar to the input voltage. Transitions between modes depend on the ratio between the controller’s input voltage, output voltage and switching frequency. For two transistors, the main part of the power loss is caused by switching losses, while for another two transistors the main part of the power loss is caused by ohmic losses. It is, therefore, important to make a compromise between transistor RDSON resistance and CRSS capacitance [60].
Since INA233, used for monitoring current and voltage, communicates over I2C bus, it is necessary to use an external device to read these measurements during the flight. A company-made logger intended for measuring current and voltage of the propulsion system power supply bus, the main power supply bus and the servo motor power supply bus was used to perform this task. A logger captured all measurements at the frequency of 1 Hz and saved them on an onboard microSD card. The frequency source is provided by the external device. A pulse per second (PPS) output signal with a very high-accuracy UAV global navigation satellite system (GNSS) receiver was used for this task. Precisely knowledge of the frequency of the captured data allows the possibility of combining those measurements with UAV log data.
A block schematic of the MPPT in connection with the logger is shown in Figure 11. In Figure 12, the developed MPPT is shown.

3.2. Electrical Energy Production Calculation

It is important to know in advance the extension of the flight time provided by the use of solar energy. This allows the possibility of finding the optimal takeoff time for a specific location and date when the highest yield will be gained. However, one must consider that the accuracy of that calculation is subject to many variables, such as weather conditions (sun irradiance, temperature, wind, etc.) and the accuracy of the flight simulator. For all mathematical post-processing operations in this study, the programming and numeric computing platform MATLAB [62] was used.
To perform the electrical energy production calculation, first we must find the relation between airplane rotation during the flight and solar irradiance. The rotation of the UAV body is usually given by the rotation angles of the yaw (ψ), pitch (Θ) and roll (ϕ). These angles correspond to the yaw–pitch–roll convection, also known as the Tait–Bryan angles [63]. As shown in Figure 13, yaw represents rotation around the z-axis of the UAV three-dimensional Cartesian coordinate system, pitch represents rotation around the y-axis and roll represents rotation around the x-axis. Since the x-axis is pointed north, the y-axis is pointed east and the z-axis is pointed toward the Earth’s center of mass (or down), this type of local coordinate system, with its origin fixed at the spacecraft center of gravity, is also called a north–east–down (NED) system [64].
UAV rotation angles during the flight are calculated by the autopilot, based on data provided by the inertial measurement unit (IMU) [66]. Data are continuously used by the autopilot to ensure proper flight paths are taken, while at the same time they are also logged on the autopilot’s microSD card in case further analysis is needed. The values of rotation angles are also part of the telemetry data flow from the UAV to the GCS during the flight and are written in the log file on the GCS computer. The difference between these two logs is that the frequency used for logging data onboard is much higher than the log frequency on the GCS side. Another difference is that the onboard logging frequency is constant, while the CGS logging frequency depends on the stability of the communication link between the UAV and the GCS. During a loss of communication event, no log data are saved on the GCS side.
As shown in Figure 9, solar modules are mounted on both wings of the Bramor UAV. We can consider that all solar modules together represent a plane. Since modules are mounted on the relatively straight parts of the wings, any curvature can be neglected. A normal vector of the solar modules plane is pointed upward (Figure 13) in the reverse direction of the UAV coordinate system’s z-axis. If we consider that the sun is always at a certain position in the sky and that the UAV is rotating around its axis, the projection of the direct sun rays onto the solar modules will change according to the angle between the direct sun rays and the normal vector of the solar modules plane. The calculation of this angle is a crucial step in the calculation of the electrical energy production. We can omit the flight altitude in this calculation, since the flight altitude of the UAV is significantly lower than the other distances considered.
In order to find the angle between a sun ray and the normal vector of the solar modules plane, we have to convert both vectors into the same three-dimensional Cartesian coordinate system. The position of the sun, which can be calculated mostly using trigonometry equations [67], is normally given in the horizontal coordinate system with two angular coordinates—azimuth (φ) and elevation (α) [68]. A transformation is shown in Figure 14.
The Cartesian coordinate system must be compatible with the UAV coordinate system, so the x-axis must be pointed to the north, the y-axis to the east and the z-axis down.
In Figure 14 (left) we express x, y and z as shown in Equation (1), while In Figure 14 (right) we express z and w as shown in Equation (2). By combining Equations (1) and (2), we express a relation between the horizontal coordinate system and the Cartesian coordinate system, as shown in Equation (3). The relations can be further simplified by choosing r = 1, as shown in Equation (4). This equation finally represents the location of the sun in the sky in the Cartesian coordinate system:
x = w × cos φ ,   y = w × sin φ ,   z = z  
z = r × sin α , w = r × cos α
x = r × cos α × cos φ , y = r × cos α × sin φ ,   z = r × sin α
x = cos α × cos φ , y = cos α × sin φ ,   z = sin α
The next step is the transformation of the rotation angles to the three-dimensional Cartesian coordinate system. This can be expressed with the rotational matrix, which can be derived in three steps. First, the rotation around the z-axis (Rψ) is written, then around the y-axis (RΘ) and finally around the x-axis (Rϕ). The results are shown in Equations (5)–(7). The rotation matrix RotMat, shown in Equation (8), is a product of the matrixes given in the intermediate step, expressed in the reverse order:
R ψ = cos ψ sin ψ 0 sin ψ cos ψ 0 0 0 1
R Θ = cos Θ 0 sin Θ 0 1 0 sin Θ 0 cos Θ  
R   ϕ = 1 0 0 0 cos ϕ sin ϕ 0 sin ϕ cos ϕ
RotMat = R ϕ × R Θ × R ψ = c 5 c 4 c 5 c 1 c 2 c 3 c 2 c 5 c 6 c 1 c 3 c 2 c 1 + c 6 c 4 c 3 c 5 c 6 c 2 c 4 + c 3 c 1 c 6 c 2 c 1 c 3 c 4 c 6 c 5 [ c 1 = sin ψ ,   c 2 = sin Θ , c 3 = sin ϕ , c 4 = cos ψ , c 5 = cos Θ , c 6 = cos ϕ ]
The last row of the RotMat matrix represents the direction of the rotated Cartesian coordinate system’s z-axis, which corresponds to the airplane rotation [69]. Since the normal vector of the solar modules plane is the reverse direction of the z-axis, elements of the normal vector have a minus sign before each z-axis element, as shown in Equation (9):
n =   c 6 c 2 c 4 + c 3 c 1     c 6 c 2 c 1 c 3 c 4     c 6 c 5
The last step is to find the angle between the vectors in three-dimensional space (Figure 15). The first vector is the location vector from the coordinate system origin to the sun direction and the second vector is the normal of the solar modules plane. Since we can omit the UAV flight altitude, both Cartesian coordinate systems have a common origin. The calculation of the angle between two vectors in three-dimensional space is now a trivial mathematical problem.
Sun irradiance measurements are obtained using a device called a pyranometer. Usually, separate pyranometers are needed to measure global horizontal irradiance (GHI) and diffuse horizontal irradiance (DHI) [70]. Monitoring of these two meteorological variables is not very common and is often obtained performed via a national network of meteorological stations. Normally, an archive of measured meteorological variables exists as a source of already measured irradiance values. Irradiance conditions in the flying field are limited to the measurements of the nearest meteorological station, so there should be a difference between irradiance at the place where the measurements are retrieved and the location where the airplane is flying.
To perform an electrical energy calculation, a calculation of direct normal irradiance (DNI) on the solar modules plane is needed, since this type of irradiance affects the flight the most. DNI can be calculated using Equations (10) and (11), where Equation (10) represents a simple type of relation between GHI, DHI and DNI.
GHI = DNI directsunray × cos γ + DHI W m 2
DNI in Equation (10) is denoted as DNIdirectsunray, since it represents a DNI from the point where the sun is positioned in the sky; γ denotes an angle between the direct sun ray and the zenith when GHI and DHI measurements are carried out.
DNI irradiation on the solar modules plane, denoted as DNImodules, depends on the angle (δ) between the direct sun ray and the normal of the solar modules plane, as shown in Equation (11):
DNI modules = DNI directsunray × cos δ W m 2
Irradiance measurements are usually captured less frequently than other meteorological variables. Since the combination of irradiance measurements is needed with the measurements of all currents and voltages, which are obtained during the flight with the frequency of 1 Hz, we have to interpolate the irradiance data. This can be expressed using linear interpolation, which in our calculations involves cubic spline and other factors. On the other hand, logged UAV data have a higher frequency; therefore, we have to decrease the frequency of that data using some type of averaging or by omitting the intermediate measurements.
Finally, electrical power production (EPP) at a discrete second ([n]) during the flight can be calculated as shown in Equation (12). Electrical energy production (EEP) at a discrete second during the flight is then expressed by multiplying power by time, since all data are obtained on the same time basis (1 s), as shown in Equation (13):
EPP   n   = A × B n   ×   η modules × DNI modules n   +   DHI β n W
EEP   n   = A × B n   ×   η modules × DNI modules n   +   DHI β n   ×   t Ws ,   t = 1   s
Parameter A in Equations (12) and (13) denotes the solar modules area (for the Bramor UAV this equals 0.1904 m2); ηmodules denotes the solar module efficiency (solar cell technical data sheet assume 26% efficiency at STC); DNImodules, calculated using Equation (11), denotes a direct normal irradiance on the solar modules plane and DHIβ denotes a diffuse irradiance on the solar modules plane. The DHIβ value is a function of the angle between the zenith and the normal of the solar modules plane and can be calculated in different ways by using models such as the isotropic sky diffuse model, as used in our calculations and shown in Equation (14); Perez sky diffuse model; Reindl sky diffuse model; and Hay and Davies sky diffuse model [71].
DHI β n   = DHI n × 1 + cos β n 2 W m 2
In Equation (14), β denotes an angle between the zenith and the normal of the solar modules plane.
Energy production during the flight, as shown in Equation (15), is a summation of the electrical energy production for every second of the flight, from takeoff until the parachute is deployed.
EEP flight = n = takeoff parachute   pop EEP   n Ws
The efficiency of MPPT (ηMPPT) is not included in Equations (12) and (13), since the goal is to calculate the electrical energy production at the input side of the MPPT.
The symbol B in Equations (12) and (13) denotes a multivariable function, which has an effect on the calculated results. Until recently, the number of performed flights was not large enough and flights were performed within a period of half month. Additional progress will help in determining the effects of all influencing variables or factors.

4. Results and Discussion

For the first experiment, we present the results of flights performed on 20 August 2021, 27 August 2021, 2 September 2021, 3 September 2021 and 9 September 2021 at the nearest flying field. The weather during the flights was mainly sunny, although sometimes there were high clouds and some wind, although the operational conditions were still safe.
Standard elements of the flight, for example takeoff, area mission waypoints, rally and parachute deployment, were included in flight plans for the performed flights. The average airspeed during the flights was 17 m/s and the maximum flying altitude was 120 m above ground level (AGL). For airplane control, an in-house application was used, C3P, which runs on the GCS computer. An image taken during one of the performed flights is shown in Figure 16.
All currents and voltages were measured and saved on the logger’s memory card. From these measurements, the electrical energy was calculated. The results are presented in Table 2.
As shown in Table 2, MPPT energy efficiency of more than 96.27% and extended endurance of up to 21.25% were achieved, although the elevation of the sun in the sky was lower on the flying dates compared to the elevation on the summer solstice.
In the second experiment, we verified the proposed electrical energy production calculation by comparing it with the actually measured electrical energy production.
The data, especially for the rotation angles needed for the calculation, were obtained from log files. Sun irradiance measurements, GHI and DHI values were obtained from ARSO’s archive [72]. Measurements from the meteorological station were used, which is around 26 km away from the location where the flights were performed. Data from this station was used as it has the most similar climatic conditions and almost the same altitude as the location where the flights were performed.
Table 3 shows the B values, as used in Equations (12) and (13), needed to equalize the results of the electrical energy production calculation, Equation (15), with the measured electrical energy production obtained from current and voltage measurements during actually performed flights.
As can be calculated from the B values in Table 3, the difference between the B value1 and B value2 was less than 0.25%.
The measured electrical energy production at the input side of MPPT compared to the electrical energy production calculation at the input side of MPPT is shown in Figure 17. The results are presented for a short segment of the flight performed on 3 September 2021.
For the electrical energy production calculation, a B value of 0.6210 was used, so the log data saved on the autopilot’s memory card were applied. It is evident that the shape of the electrical energy production calculation is almost the same as the shape of the measured electrical energy production. Blue spikes on the graph in Figure 17 present the moments when the MPPT searched for the GMPP.
The complete flightpath of the flight performed on 3 September 2021 is shown in Figure 18. The purpose of the flight was aerial mapping of the agriculture area.
For a given flight plan, calculating the electrical energy production in advance gives UAV operators the advantage of determining the optimal takeoff time in order to maximize the amount of electrical energy provided by the solar modules.
Exploiting solar energy for the endurance extension of lightweight UAVs adds extra mass via the solar modules, MPPT and wires and connectors. In our case, the mass of the solar modules was 90 g, the mass of the MPPT was 40 g and the mass of the wires and connectors totaled 130 g. The total extra mass, therefore, equaled 260 g. Since the total mass of the UAV without the endurance extension system equaled around 4.8 kg, this extra mass was a less than 6% increase.
In order to measure the electrical energy production, a company-made logger and additional wiring with a total mass of 50 g were installed. This equipment is not necessary in real use of solar modules, which should result in greater endurance extension, as presented in Table 2.

5. Conclusions and Future Work

The purpose of this study was to verify whether any technology exists for endurance extension of lightweight UAVs. It has been shown that many options for endurance extension exist, but that only a few of them are applicable for lightweight UAVs, since the mass and space of the system are limited. The use of solar energy as the source of energy was proven to be very promising in such vehicles.
We upgraded the existing UAV, which is used for aerial mapping missions, with GaAs solar modules and developed a custom-made MPPT with an integrated P&O algorithm. In the first part of the study, the development of MPPT was presented. In the second part, we expressed the mathematical relation of the electrical energy production from solar modules with the known airplane rotation, location and time of flight, indirectly known as the global horizontal irradiance and diffuse horizontal irradiance at that location. The calculation was verified on actually performed flights. In the third part, the experimental results were presented. As can be seen, the energy efficiency of the MPPT was more than 96.27%, the endurance of the flights was extended up to 21.25% and the calculated electrical energy matched the measured electrical energy.
The MPPT can be further reduced in size and mass. Additionally, the effect of the additional mass on the UAV power consumption is not known yet and the functionality of the B value has not been exactly specified. This will form the basis for the future studies.
Solar technology will be even more widespread in the future, increasing the autonomy of different vehicles and other devices, since it represents a solid pillar of green energy, which is of the utmost importance for withstanding global warming.

Author Contributions

Conceptualization, D.H.; methodology, D.H. and A.Ž.; hardware and software, D.H.; validation, A.Ž.; formal analysis, D.H. and A.Ž.; investigation, D.H.; resources, D.H. and A.Ž.; data curation, D.H. and A.Ž.; writing—original draft preparation, D.H. and A.Ž.; writing—review and editing, D.H. and A.Ž.; visualization, D.H.; supervision, A.Ž.; project administration, D.H.; funding acquisition, A.Ž. All authors have read and agreed to the published version of the manuscript.

Funding

The authors acknowledge the funding by the Slovenian Research Agency (research program grant number P2-0197).

Data Availability Statement

The data are available upon request.

Acknowledgments

The authors acknowledge the support of C-Astral Aerospace, Ltd., for providing the resources needed for experimental flights.

Conflicts of Interest

The authors declare no conflict of interest.

References

  1. C-Astral Aerospace, Ltd. Company Web Page. Available online: www.c-astral.com (accessed on 22 September 2021).
  2. C-Astral Aerospace, Ltd. Area Coverage Chart. Available online: http://www.c-astral.com/en/download/601 (accessed on 22 September 2021).
  3. C-Astral, Ltd. Image of Bramor ppX UAV. Available online: http://www.c-astral.com/media/cache/br/bramor-ppx-6f2036421abf52cbf9159d0ebb164f5b.jpeg (accessed on 22 September 2021).
  4. Data Sheet of Li-Ion Battery Cell Panasonic NCR18650B. Available online: https://www.batteryspace.com/prod-specs/NCR18650B.pdf (accessed on 23 September 2021).
  5. Sion Power Corporation. Company Web Page. Available online: https://sionpower.com (accessed on 23 September 2021).
  6. Kokam Co., Ltd. Company Web Page. Available online: https://kokam.com/?lang=en (accessed on 23 September 2021).
  7. Amicell—Amit Industries, Ltd. Company Web Page. Available online: https://www.amicell.co.il (accessed on 23 September 2021).
  8. OXIS Energy, Ltd. Company Web Page. Available online: https://oxisenergy.com (accessed on 23 September 2021).
  9. Energy Density of Gasoline. Available online: https://hypertextbook.com/facts/2003/ArthurGolnik.shtml (accessed on 24 September 2021).
  10. Fuel Cells. Available online: https://www.energy.gov/eere/fuelcells/fuel-cells (accessed on 24 September 2021).
  11. Empa Achieves New Flexible Solar Cell Record. Available online: https://worldindustrialreporter.com/empa-achieves-new-flexible-solar-cell-record (accessed on 24 September 2021).
  12. MicroLink Devices, Inc. Photovoltaics. Available online: http://www.mldevices.com/index.php/product-services/photovoltaics (accessed on 24 September 2021).
  13. Genasun Lithium MPPT’s. Available online: https://genasun.eu/collections/genasun-lithium-mppts (accessed on 24 September 2021).
  14. Automakers Are Developing Solar-Powered Vehicles. Available online: https://www.assemblymag.com/articles/96333-automakers-are-developing-solar-powered-vehicles (accessed on 24 September 2021).
  15. eNow, Inc. Solar Technology for Trucks & Buses. Available online: https://www.enowenergy.com/solar-technology-overview-enow (accessed on 24 September 2021).
  16. Image of Flexible Solar Cell Module Made by Alta Devices, Inc. Company. Available online: https://mms.businesswire.com/media/20190423005283/en/717574/5/Alta_Devices_AnyLight_Solar_for_HALE_.jpg?download=1 (accessed on 24 September 2021).
  17. MicroLink Devices, Inc. Company Web Page. Available online: http://www.mldevices.com (accessed on 24 September 2021).
  18. Ascent Solar Technologies, Inc. Company Web Page. Available online: https://www.ascentsolar.com/index.html (accessed on 24 September 2021).
  19. Empa—Laboratory for Thin Films and Photovoltaics. Available online: https://www.empa.ch/web/s207 (accessed on 24 September 2021).
  20. SolAero Technolgies, Inc. Company Web Page. Available online: https://solaerotech.com (accessed on 24 September 2021).
  21. SolAero Technologies’ Solar Panel Powers NASA’s Mars Helicopter—Ingenuity. Available online: https://www.prnewswire.com/news-releases/solaero-technologies-solar-panel-powers-nasas-mars-helicopter---ingenuity-301271650.html (accessed on 24 September 2021).
  22. Alta Devices, Inc. Wikipedia Web Page. Available online: https://en.wikipedia.org/wiki/Alta_Devices (accessed on 24 September 2021).
  23. Alta Says 31.6% Solar Efficiency Record to Boost Drones. Available online: https://renewablesnow.com/news/alta-says-31-6-solar-efficiency-record-to-boost-drones-522791 (accessed on 24 September 2021).
  24. Fu, S.C.; Zhong, X.L.; Zhang, Y.; Lai, T.W.; Chan, K.C.; Lee, K.Y.; Chao, C.Y.H. Bio-inspired cooling technologies and the applications in buildings. Energy Build. 2020, 225, 110313. [Google Scholar] [CrossRef]
  25. Blackbody Radiation. Available online: https://www.e-education.psu.edu/astro801/content/l3_p5.html (accessed on 24 September 2021).
  26. How the Solar Cell Found the Spotlight. Available online: https://www.axpo.com/dk/en/about-us/magazine.detail.html/magazine/renewable-energy/how-the-solar-cell-found-the-spotlight.html (accessed on 24 September 2021).
  27. Rashid, M.H. Power Electronics Handbook, 4th ed.; Butterworth-Heinemann: Oxford, UK, 2018; p. 735. [Google Scholar]
  28. Shannan, N.M.A.A.; Yahaya, N.Z.; Singh, B. Single-diode model and two-diode model of PV modules: A comparison. In Proceedings of the 2013 IEEE International Conference on Control System, Computing and Engineering, Penang, Malaysia, 29 November–1 December 2013; pp. 210–214. [Google Scholar] [CrossRef]
  29. Letcher, T.M. Future Energy: Improved, Sustainable and Clean Options for Our Planet, 2nd ed.; Elsevier: London, UK, 2014; pp. 388–389. [Google Scholar]
  30. IV Curve. Available online: https://www.pveducation.org/pvcdrom/solar-cell-operation/iv-curve (accessed on 25 September 2021).
  31. Vieira, R.G.; de Araújo, F.M.U.; Dhimish, M.; Guerra, M.I.S. A Comprehensive Review on Bypass Diode Application on Photovoltaic Modules. Energies 2020, 13, 2472. [Google Scholar] [CrossRef]
  32. Baba, A.O.; Liu, G.; Chen, X. Classification and Evaluation Review of Maximum Power Point Tracking Methods. Sustain. Futures 2020, 2, 100020. [Google Scholar] [CrossRef]
  33. Koutroulis, E.; Kalaitzakis, K.; Voulgaris, N.C. Development of a microcontroller-based, photovoltaic maximum power point tracking control system. IEEE Trans. Power Electron. 2001, 16, 46–54. [Google Scholar] [CrossRef] [Green Version]
  34. Practical Guide to Implementing Solar Panel MPPT Algorithms. Available online: http://www.microchip.com/wwwAppNotes/AppNotes.aspx?appnote=en561417 (accessed on 26 September 2021).
  35. El-Khozondar, H.J.; El-Khozondar, R.J.; Matter, K.; Suntio, T. A review study of photovoltaic array maximum power tracking algorithms. Renew. Wind. Water Sol. 2016, 3, 3. [Google Scholar] [CrossRef] [Green Version]
  36. Esram, T.; Chapman, P.L. Comparison of Photovoltaic Array Maximum Power Point Tracking Techniques. IEEE Trans. Energy Convers. 2007, 22, 439–449. [Google Scholar] [CrossRef] [Green Version]
  37. Pallavee Bhatnagar, A.; Nema, B.R.K. Conventional and global maximum power point tracking techniques in photovoltaic applications: A review. J. Renew. Sustain. Energy 2013, 5, 032701. [Google Scholar] [CrossRef]
  38. Jain, A.; Jain, C.; Singh, B.; Al-Haddad, K.; Chandra, A. A dual tangent based algorithm for maximum power point tracking of solar PV systems. In Proceedings of the IECON 2015—41st Annual Conference of the IEEE Industrial Electronics Society, Yokohama, Japan, 9–12 November 2015; pp. 601–606. [Google Scholar] [CrossRef]
  39. Sharma, R.S.; Katti, P.K. Perturb & observation MPPT algorithm for solar photovoltaic system. In Proceedings of the 2017 International Conference on Circuit, Power and Computing Technologies (ICCPCT), Kollam, India, 20–21 April 2017; pp. 1–6. [Google Scholar] [CrossRef]
  40. Belkaid, A.; Colak, I.; Isik, O. Photovoltaic maximum power point tracking under fast varying of solar radiation. Appl. Energy 2016, 179, 523–530. [Google Scholar] [CrossRef]
  41. Al-Diab, A.; Sourkounis, C. Variable step size P&O MPPT algorithm for PV systems. In Proceedings of the 2010 12th International Conference on Optimization of Electrical and Electronic Equipment, Brasov, Romania, 20–22 May 2010; pp. 1097–1102. [Google Scholar] [CrossRef]
  42. Tang, L.; Xu, W.; Mu, C. Analysis for step-size optimisation on MPPT algorithm for photovoltaic systems. IET Power Electron. 2017, 10, 1647–1654. [Google Scholar] [CrossRef]
  43. Dandoussou, A.; Kamta, M.; Bitjoka, L.; Wira, P.; Kuitché, A. Comparative study of the reliability of MPPT algorithms for the crystalline silicon photovoltaic modules in variable weather conditions. J. Electr. Syst. Inf. Technol. 2017, 4, 213–224. [Google Scholar] [CrossRef]
  44. Fazelpour, F.; Vafaeipour, M.; Rahbari, O.; Shirmohammadi, R. Considerable parameters of using PV cells for solar-powered aircrafts. Renew. Sustain. Energy Rev. 2013, 22, 81–91. [Google Scholar] [CrossRef]
  45. Serrano-Guerrero, X.; González-Romero, J.; Cárdenas-Carangui, X.; Escrivá-Escrivá, G. Improved variable step size P&O MPPT algorithm for PV systems. In Proceedings of the 2016 51st International Universities Power Engineering Conference (UPEC), Coimbra, Portugal, 6–9 September 2016; pp. 1–6. [Google Scholar] [CrossRef]
  46. Vivek, P.; Ayshwarya, R.; Amali, S.J.; Sree, A.S.N. A novel approach on MPPT algorithm for solar panel using buck boost converter. In Proceedings of the 2016 International Conference on Energy Efficient Technologies for Sustainability (ICEETS), Nagercoil, India, 7–8 April 2016; pp. 396–399. [Google Scholar] [CrossRef]
  47. Loukriz, A.; Haddadi, M.; Messalti, S. Simulation and experimental design of a new advanced variable step size Incremental Conductance MPPT algorithm for PV systems. ISA Trans. 2016, 62, 30–38. [Google Scholar] [CrossRef] [PubMed]
  48. European Standard EN-50530:2011; CENELEC: Brussels, Belgium, 2011.
  49. Morton, S.; D’Sa, R.; Papanikolopoulos, N. Solar powered UAV: Design and experiments. In Proceedings of the 2015 IEEE/RSJ International Conference on Intelligent Robots and Systems (IROS), Hamburg, Germany, 28 September–2 October 2015; pp. 2460–2466. [Google Scholar] [CrossRef]
  50. Sudha; Patange, S.S.R.; Raja, S.; Aravindu, B.; Raghavendura, L.; Devi, M.S. Experimental studies for enhancing endurance of unmanned air vehicles. In Proceedings of the 2017 International Conference on Electrical, Electronics, Communication, Computer, and Optimization Techniques (ICEECCOT), Mysuru, India, 15–16 December 2017; pp. 216–219. [Google Scholar] [CrossRef]
  51. Noth, A. Design of Solar Powered Airplanes for Continious Flight. Ph.D. Thesis, ETH Zürich, Zürich, Switzerland, September 2008. [Google Scholar]
  52. Data Sheet of LTC4359. Available online: https://www.analog.com/media/en/technical-documentation/data-sheets/ltc4359.pdf (accessed on 27 September 2021).
  53. Data Sheet of INA233. Available online: https://www.ti.com/document-viewer/INA233/datasheet (accessed on 27 September 2021).
  54. Data Sheet of LT8490. Available online: https://www.analog.com/media/en/technical-documentation/data-sheets/8490fa.pdf (accessed on 27 September 2021).
  55. Data Sheet of LT8705. Available online: https://www.analog.com/media/en/technical-documentation/data-sheets/8705ff.pdf (accessed on 27 September 2021).
  56. Design Trade-Offs for Switch-Mode Battery Chargers. Available online: http://www.ti.com/lit/ml/slyp089/slyp089.pdf (accessed on 27 September 2021).
  57. Matlab, Mathworks. Available online: https://www.mathworks.com/products/matlab.html (accessed on 27 September 2021).
  58. Tait-Bryan Rotations. Available online: https://www.airports-worldwide.com/articles/article0702.php (accessed on 27 September 2021).
  59. Local Tangent Plane Coordinates. Available online: https://en.wikipedia.org/wiki/Local_tangent_plane_coordinates (accessed on 27 September 2021).
  60. UAV Coordinate System Orientation. Available online: https://docs.px4.io/master/assets/img/frame_heading.f02fbdcf.png (accessed on 28 September 2021).
  61. Intertial Measurement Unit (IMU). Available online: https://roboticsclubiitk.github.io/2017/12/21/Beginners-Guide-to-IMU.html (accessed on 28 September 2021).
  62. The Sun’s Position. Available online: https://www.pveducation.org/pvcdrom/properties-of-sunlight/the-suns-position (accessed on 28 September 2021).
  63. Horizontal Coordinate System. Available online: https://www.timeanddate.com/astronomy/horizontal-coordinate-system.html (accessed on 28 September 2021).
  64. Rotation and Rotation Matrices. Available online: https://journals.iucr.org/d/issues/2001/10/00/ba5006 (accessed on 28 September 2021).
  65. The Difference between Horizontal and Tilted Global Solar Irradiance. Available online: https://www.kippzonen.com/News/408/The-Difference-between-Horizontal-and-Tilted-Global-Solar-Irradiance#.YVyJ7X2xWUl (accessed on 29 September 2021).
  66. POA Sky Diffuse. Available online: https://pvpmc.sandia.gov/modeling-steps/1-weather-design-inputs/plane-of-array-poa-irradiance/calculating-poa-irradiance/poa-sky-diffuse (accessed on 30 September 2021).
  67. ARSO, Slovenian Environmental Agency. Available online: http://meteo.arso.gov.si/met/en/app/webmet (accessed on 30 September 2021).
  68. Avy Completes Successful Test Flight with First Dutch Solar Drone. Available online: https://avy.eu/stories/press-release-avy-completes-successful-test-flight-with-first-dutch-solar-drone/ (accessed on 9 November 2021).
  69. Silent Falcon™ Small Unmanned Aircraft System. Available online: https://www.homelandsecurity-technology.com/projects/silent-falcon-small-unmanned-aircraft-system/ (accessed on 9 November 2021).
  70. AtlantikSolar. Available online: http://www.atlantiksolar.ethz.ch/ (accessed on 9 November 2021).
  71. Airbus Zephyr. Available online: https://en.wikipedia.org/wiki/Airbus_Zephyr (accessed on 9 November 2021).
  72. Solar Impulse. Available online: https://en.wikipedia.org/wiki/Solar_Impulse (accessed on 9 November 2021).
Figure 1. Bramor ppX UAV [3]. Figure is obtained with the permission, from webpage of C-Astral Aerospace, Ltd. company.
Electronics 10 02876 g001
Figure 2. Example of a flexible solar module.
Electronics 10 02876 g002
Figure 3. Simplified operation of a solar cell.
Electronics 10 02876 g003
Figure 4. Single-diode equivalent circuit in a solar cell.
Electronics 10 02876 g004
Figure 5. Typical IV and PV characteristics of a solar module.
Electronics 10 02876 g005
Figure 6. PV of a solar module in partly shaded conditions. More local MPPs are visible.
Electronics 10 02876 g006
Figure 7. Simplified schematic of the UAV power supply system with the solar module and MPPT included. The output of the MPPT is connected in parallel to the battery, UAV propulsion system and main electronic power supply line.
Electronics 10 02876 g007
Figure 8. Shapes with the same color show pairs of series-connected solar modules (top view).
Electronics 10 02876 g008
Figure 9. Bramor ppX UAV with solar modules mounted on the wings.
Electronics 10 02876 g009
Figure 10. Endurance extension system (blue colored shape). The same battery used to power the UAV is used also in connection with the endurance extension system.
Electronics 10 02876 g010
Figure 11. Block schematic of the MPPT in connection with the logger.
Electronics 10 02876 g011
Figure 12. Photograph of the developed MPPT.
Electronics 10 02876 g012
Figure 13. UAV coordinate system with a normal vector for the solar modules [65]. Letters x, y and z present name of Cartesian coordinate system axis and letter n presents a normal vector of solar modules plane. Figure is adapted from PX4 User Guide (Documentation) web page (CC BY 4.0).
Electronics 10 02876 g013
Figure 14. The transformation from the horizontal coordinate system to the three-dimensional Cartesian coordinate system. Here, φ represents the azimuth, α represents the elevation, r represents the distance from the coordinate system origin to the sun and w represents the distance from the coordinate system origin to the projection of the sun on the XY plane of the Cartesian coordinate system.
Electronics 10 02876 g014
Figure 15. Local vector from the three-dimensional Cartesian coordinate system origin to the sun direction and the normal vector of the solar modules plane.
Electronics 10 02876 g015
Figure 16. A photo of the Bramor ppX UAV equipped with solar modules, captured during the flight.
Electronics 10 02876 g016
Figure 17. Comparison between the measured and calculated electrical energy values at the input of the MPPT during a short segment of the flight performed on 3 September 2021.
Electronics 10 02876 g017
Figure 18. Flightpath of the flight performed on 3 September 2021.
Electronics 10 02876 g018
Table 1. Technical specifications for the used solar modules.
Chain TypeNumber of Solar Cells Connected in Series/ParallelOpen-Circuit Voltage VOC(V)Short-Circuit Current ISC (A)Voltage at Maximum Power VMP (V)Current at Maximum Power IMP (A)Maximum Power PMP (W)
A32/236.06 2/35.20 1/33.19 30.45 4/0.46 1/0.47 531.58 2/30.72 1/28.71 30.43 4/0.44 1/0.45 513.72 6/13.52 1/13.00 7
B32/236.06 2/35.20 1/33.19 30.45 4/0.46 1/0.47 531.58 2/30.72 1/28.71 30.43 4/0.44 1/0.45 513.72 6/13.52 1/13.00 7
C32/336.06 2/35.20 1/33.19 30.68 4/0.69 1/0.71 531.58 2/30.72 1/28.71 30.65 4/0.66 1/0.68 520.58 6/20.28 1/19.51 7
1 Value refers to the standard test condition (STC): 1000 W/m2, AM1.5, 25 °C. Values were calculated from values corresponding to one solar cell. 2 Value at 10 °C was calculated using voltage temperature coefficient (−0.187%/°C from 25 °C). 3 Value at 60 °C was calculated using voltage temperature coefficient (−0.187%/°C from 25 °C). 4 Value at 10 °C was calculated using current temperature coefficient (+0.084%/°C from 25 °C). 5 Value at 60 °C was calculated using current temperature coefficient (+0.084%/°C from 25 °C). 6 Value at 10 °C was calculated using power temperature coefficient (−0.095%/°C from 25 °C). 7 Value at 60 °C was calculated using power temperature coefficient (−0.095%/°C from 25 °C).
Table 2. Results of the MPPT testing.
Flight NumberDate of FlightAirborne Time 1 (s)Total Electrical Energy at the Input of MPPT 2 (Wh)Electrical Energy at the Output of MPPT 3 (Wh)MPPT Energy Efficiency 4 (%)Extended Endurance 5 (%)
120 August 2021297916.9516.3696.5021.25
227 August 2021193810.9110.5196.2717.03
32 September 2021463429.4028.5297.0119.28
43 September 2021807251.0849.5697.0314.45
59 September 2021383621.2020.4596.4812.36
1 Time duration between UAV takeoff and parachute deployment. 2 Electrical energy at the input of the MPPT. The value corresponds to the sum of electrical energies of all three inputs. 3 Electrical energy at the output of the MPPT. 4 Efficiency of the MPPT calculated as the ratio between the total electrical energy at the output of the MPPT and the total electrical energy at the input of the MPPT. 5 Endurance extension comparing the airborne time needed for the same amount of energy provided by the battery to be achieved.
Table 3. B value results.
Flight NumberDate of FlightB Value 1B Value 2
120 August 20210.59130.5928
227 August 20210.55220.5523
32 September 20210.63670.6365
43 September 20210.62130.6210
59 September 20210.56580.5658
1 Source of rotation angles was the log created during the flight on the GCS. This log can be affected by loss of communication events, so the frequency of the saved data was not necessarily constant. 2 Source of rotation angles was the log created on the autopilot’s memory card. This log file included data recorded at a constant frequency.
Publisher’s Note: MDPI stays neutral with regard to jurisdictional claims in published maps and institutional affiliations.

