Article

Operation Optimization of Regional Integrated Energy System Considering the Responsibility of Renewable Energy Consumption and Carbon Emission Trading

1
Chongqing University, 174 Shazhengjie, Chongqing 400044, China
2
Chongqing Institute of Green and Intelligent Technology, Chinese Academy of Sciences, Chongqing 400714, China
3
Chongqing School, University of Chinese Academy of Sciences, Chongqing 400714, China
4
CISDI Engineering Co., Ltd., Chongqing 400013, China
*
Author to whom correspondence should be addressed.
Electronics 2021, 10(21), 2677; https://doi.org/10.3390/electronics10212677
Submission received: 12 October 2021 / Revised: 22 October 2021 / Accepted: 28 October 2021 / Published: 1 November 2021
(This article belongs to the Section Systems & Control Engineering)

Abstract

:
To “bring carbon emissions to a peak by 2030 and to be carbon-neutral by 2060”, the role of renewable energy consumption and carbon emission trading are promoted. As an important energy consumer of regional energy system, it is necessary for integrated energy system to ensure the low-carbon economic operation of the system. Combined with the responsibility of renewable energy consumption, green certificate trading mechanism, carbon emission rights trading, and China Certified Emission Reduction (CCER), a regional integrated energy system operation optimization model was proposed. The model aims to minimize the total cost of the system, which included with electric bus, thermal bus, and cold bus. Setting different scenarios for the given example, the results show that the optimized model could effectively reduce the operating costs of the system. Moreover, the results also provide an effective reference for the system’s economic and low-carbon operation.

1. Introduction

Under the recommendations for formulating China’s 14th five-year development plan and the long-range goals for 2035, China will pursue clean, low-carbon, safe, and efficient use of energy and accelerate the growth of new energy and green industries to promote greener economic and social development in all respects.
National Development and Reform Commission (NDRC) and the National Energy Administration (NEA) of China jointly issued the “Guiding Opinions on Promoting the source-grid-load-storage integration system and the complementarity development of multi-energy” on 5 March 2021 [1]. This government document focuses on the construction of integrated energy system in areas with good resources of green energy. The development of clean energy needs to be planned from the overall perspective of the integrated energy system, and the consumption of clean energy is supported by multi-energy complementation and coordinated integrated energy system. As an important practitioner of the Integrated Energy System of source-grid-load-storage, regional integrated energy system is considered to be an important approach to realize the transformation of energy structure and to build a clean, low-carbon, and efficient energy system [2].
The Ministry of Ecology and Environment on January 5 rolled out interim rules for carbon emissions trading management [3]. This is the first time the country has clarified the responsibilities of the enterprises to cut greenhouse gas emissions. On 25 May 2021, NDRC and NEA jointly rolled out the “Notice on Responsibility of Renewable Energy Consumption and Related Matters in 2021” (NDRC NEA [2021] No. 704) [4], specifying the minimum Responsibility of Renewable Energy Consumption without hydro-power. A high proportion of renewable energy is an inevitable choice to achieve the low-carbon goal. Moreover, the renewable energy power consumption guarantee mechanism, the green certificate trading mechanism, the carbon emission trading and China Certified Emission Reduction (CCER) have become the key supports for this goal. More than reducing the operating cost of the system, the above study supports the integrated energy system, and also contributes to the realization of emission peak and carbon neutrality.
There are some studies on Regional Integrated Energy System. A two-level optimal scheduling model according to the energy demands is proposed to maximize the social welfare and minimize the energy purchase cost [5]. An optimal dispatch model for regional integrated energy system including renewable energy is built to minimize environmental pollution and fossil fuel consumption [6]. In addition, the minimum cost of the integrated energy system is taken as the objective function to construct an integrated energy system dispatch model including wind turbo, photovoltaic power generation, gas, and the distribution grid [7]. An optimal scheduling model considering the uncertainty of wind power is proposed to minimize the cost and carbon emission and to maximize the energy utilization efficiency [8]. This model can improve the system efficiency. Meanwhile, it ensures the operation is environmental-friendly and economical. An operation optimization model of regional integrated energy system under the responsibility of renewable energy consumption is proposed to maximize the total revenue of the system, considering the green certificate transaction mechanism [9]. Blockchain technology and green certificate transaction mechanism are taken into account to optimize the integrated energy system model considering the cross-chain transaction [10]. Literature [11] increased the consideration of carbon allowance trading volume constraints. Meanwhile, the impact on the scheduling results of carbon allowance trading and carbon trading prices is analyzed. There are some studies on carbon emission constraints, however, a few studies take into account the impact of responsibility of renewable energy consumption, carbon emission trading, and CCER constraints on the optimal dispatching of regional-integrated energy system.
Taking into account the impact of the responsibility of renewable energy consumption, green certificate trading, carbon emission trading, and CCER, an optimization operation model of a regional integrated energy system is proposed in this paper. Comparison of the given case before and after optimization shows that the optimization model proposed in this paper can significantly increase the revenue of this system, and that the responsibility of renewable energy consumption constraint has a greater degree of influence on the system revenue than that of the emission trading. The simulation results verify the effectiveness of the model.

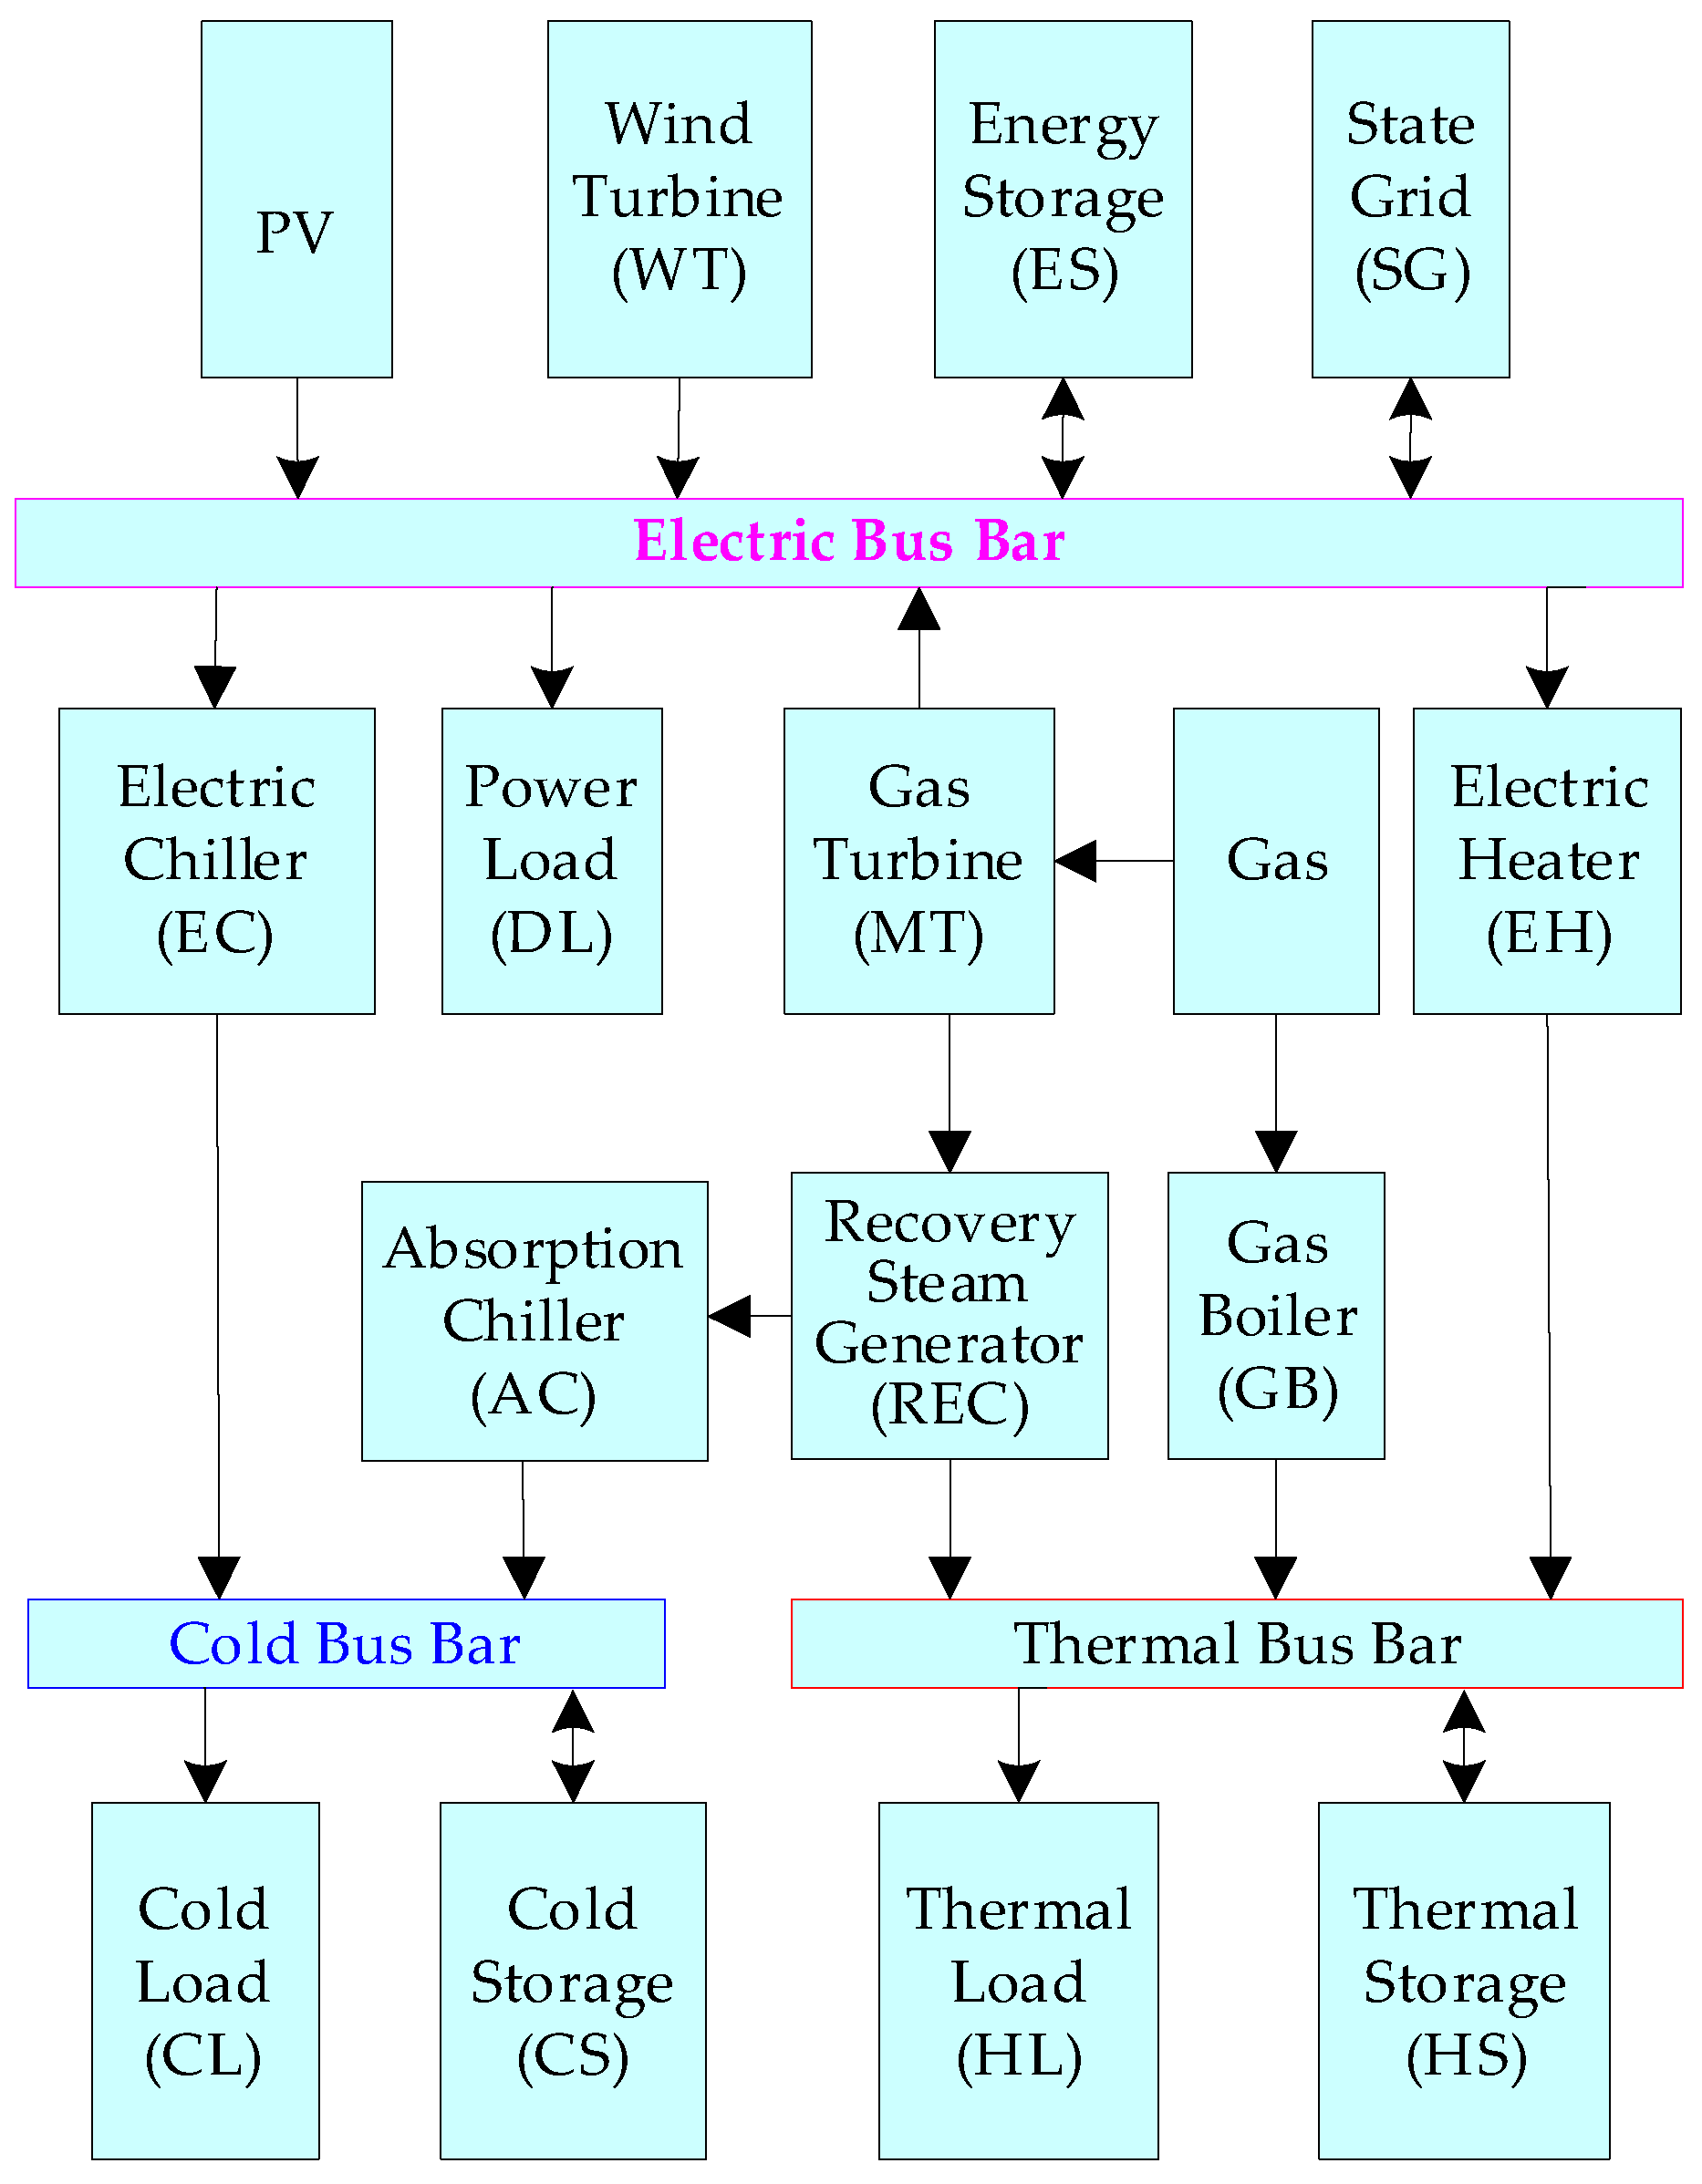
2. Integrated Energy System

The integrated energy system with multi-energy studied in this paper is composed of three bus bars, namely electric bus bar, cold bus bar, and thermal bus bar as shown in Figure 1. The power generation equipment, electric load, and electric storage are connected through the electric bus bar. For convenience of expression, the thermal bus bar and the cold bus bar are conceptually proposed by analogy with the electric bus bar in this paper.
The power generation equipment includes photovoltaic power generation (PV), wind turbine power generation (WT), and gas turbine power generation (GT). The energy storage equipment includes the electric energy storage equipment, the thermal energy storage equipment, and the cold energy storage equipment. The chiller equipment includes electric chiller (EC) and absorption chiller equipment (AC). The boiler equipment includes electric heater (EH), gas boiler (GB), and heat recovery steam generator boiler (REC).

3. Modeling

3.1. Objective Function

The cost function of the integrated energy system should account for gas purchase cost, system operating cost, power interaction cost with the distribution network, green electricity consumption cost, and carbon emission cost. Here, the total cost of the system is minimized as below:
min F = t = 1 T ( F F U t + F O M t + F C O t + F G R E t + F R E D D t )
where F is the total cost of the system. F F U t is the gas purchase cost which is explained in detail in Equation (2); F O M t is the operation and maintenance cost which is explained in detail in Equation (3); F C O t is the interaction cost between the system and the distribution network, in other words, it is the cost of purchasing electricity from the distribution network which is explained in detail in Equation (6); F G R E t is the cost of meeting responsibility of renewable energy consumption target which is explained in detail in Equation (7). F R E D D t is the carbon emission cost which is explained in detail in Equation (9).
F F U t = t = 1 T [ ( P M T t λ M T + P G B t λ G B ) × C F U t H F U t ]
Equation (2) is the specific expression of F F U t in Equation (1) where P M T t and P G B t are the consumption power of gas turbine and gas boiler in time period t, respectively. λ M T and λ G B are the efficiency of gas turbine and gas boiler, respectively. C F U t is the price of gas at time period t. H F U t is the inferior calorific value of gas.
F O M t = t = 1 T ( F O M P V t + F O M W T t + F O M M T t + F O M S t )
Equation (3) is the specific expression of F O M t in Equation (1) where the F O M P V t , F O M W T t , F O M M T t , and F O M S t are the cost of equipment maintenance of PV, wind power generator, gas turbine, and energy storage, respectively.
{ F O M P V t = t = 1 T ( c P V t P P V t ) F O M W T t = t = 1 T ( c W T t P W T t ) F O M M T t = t = 1 T ( c M T t P M T t ) F O M S t = t = 1 T ( c E S t P E S , t o t t + c C S t P C S , t o t t + c H S t P H S , t o t t )
Equation (4) is the specific expression of F O M P V t , F O M W T t , F O M M T t , and F O M S t in Equation (3), where the c P V t , c W T t , c M T t , c E S t , c C S t , and c H S t are the unit cost of equipment maintenance of PV, wind power generator, gas turbine and energy storage, respectively. P P V t and P W T t are the output power of photovoltaic and wind power generator at time period t. P E S , t o t t , P C S , t o t t , and P H S , t o t t are the power of electric energy storage, cold energy storage, and thermal energy storage equipment at time period t, which are specific expressions as shown in Equation (5).
{ P E S , t o t t = P E S t , D + | P E S t , C | P C S , t o t t = P C S t , D + | P C S t , C | P H S , t o t t = P H S t , D + | P H S t , C |
where P E S t , D and P E S t , C are the discharge and charging power of electric energy storage at time period t, respectively. P C S t , D and P C S t , D are the release and absorption power of cold energy storage at time period t, respectively. P H S t , D and P H S t , D are the release and absorption power of thermal energy storage at time period t, respectively.
F C O t = { c b t P C O t     ( P C O t 0 ) c s t P C O t     ( P C O t < 0 )
Equation (6) is the specific expression of F C O t in Equation (1) where c b t and c s t are the unit power purchase or sale price at time period t. P C O t is the interactive power with the power distribution network at time period t.
F G R E t = c G R E t 1000 × ( K t a r t K a c t t ) × P D L t
Equation (7) is the specific expression of F G R E t in Equation (1) where c G R E t is the price of a single green card in time period t. P D L t is the total load power of the system. K t a r t , K a c t t are the responsibility of renewable energy consumption (expressed as the proportion of renewable energy in the total energy consumption).
The proportion of renewable energy could not meet the stipulated value when K t a r t K a c t t is less than 0, which means that the green certificate needs to be purchased through the green certificate center. When K t a r t K a c t t is greater than 0, the green certificate has a surplus and can be sold in the green certificate center. The K a c t t is formulated as Equation (8):
K a c t t = P P V t + P W T t P D L t × 100 % + x K G R t
where x is 1 when the system purchases power from the grid in the time period t. otherwise, x is 0. K G R t is the proportion of renewable energy of power purchase in time period t.
F R E D D t = c R E D D t × ( Q R E D D , a c t t Q R E D D , t a r t Q R E D D , C C E R t )
Equation (9) is the specific expression of F R E D D t in Equation (1), where c R E D D t is the unit market price of carbon in time period t. Q R E D D , a c t t is the actual carbon emissions in time period t. Q R E D D , t a r t is the regional carbon quota. Q R E D D , C C E R t is the Chinese certified emission reduction (CCER), calculated according to the power output of PV and wind turbine station, which is formulated as follows:
{ Q R E D D , C C E R t = τ C C E R × ( P P V t + P W T t ) Q R E D D , C C E R t Q R E D D , a c t t × 5 %
where τ C C E R is the carbon emission factor in kgCO2/kWh.

3.2. Constraints of Models

3.2.1. Constraints of PV and WT

The output of PV and WT is limited by the equipment and the constraints are formulated as follows:
{ P P V , min t P P V t P P V , max t P W T , min t P W T t P W T , max t
where P P V , min t and P P V , max t are the minimum and maximum photovoltaic output power in time period t, respectively. P W T , min t and P W T , max t are the minimum and maximum output power of wind turbine in time period t, respectively.

3.2.2. Constraints of Gas Turbine

To compensate for the uncertainty and intermittence of the output of PV and WT, a gas turbine is installed serving as a controllable equipment. Equation (12) is the constraints of the power output of gas turbine.
{ P M T , min t P M T t P M T , max t I M T , d o w n t Δ t P M T t P M T t 1 I M T , u p t Δ t
where P M T , min t and P M T , max t are the minimum and maximum output of the gas turbine in time period t, respectively. I M T , d o w n t and I M T , u p t are downhill and uphill constraints in time period t, respectively.

3.2.3. Constraints of Chiller Equipment

Electric Chiller Equipment
{ P E C t = P E C r a t λ E C P E C , min t P E C t P E C , max t
where P E C t is the output of the electric chiller. P E C r a t is the rated power output of the electric chiller equipment. λ E C is the chiller efficiency. P E C , min t and P E C , max t are the minimum and maximum output power of the electric chiller in time period t, respectively.
Absorption Chiller Equipment
{ P A C t = P A C r a t λ A C P R E C t ( 1 ρ ) P A C , min t P A C t P A C , max t
where P A C t is the output of the absorption chiller equipment at time period t. P A C r a t is the rated power output of the absorption chiller equipment. P R E C t is the chiller efficiency. ρ is the distribution coefficient. P A C , min t and P A C , max t are the minimum and maximum output power of the absorption chiller in time period t, respectively.

3.2.4. Constraints of Heating Equipment

Electric Heating Equipment
{ P E H t = P E H r a t λ E H P E H , min t P E H t P E H , max t
where P E H t is the output power of the electric heating equipment at time period t. P E H r a t is the rated power of the electric heating equipment. λ E H is the heating efficiency of the electric heating equipment. P E H , min t and P E H , max t are the minimum and maximum output power of the electric heating equipment at time period t, respectively.
Gas Boiler Equipment
{ P G B t = P G B r a t λ G B P G B , min t P G B t P G B , max t
where P G B t is the output power of the gas boiler at time period t. P G B r a t is the rated output power of the gas boiler. λ G B is the heating efficiency of the gas boiler. P G B , min t and P G B , max t are the minimum and maximum power of the gas boiler, respectively.
Heat Recovery Steam Generator
{ P R E C t = P R E C r a t λ R E C ρ P R E C , min t P R E C t P R E C , max t
where P R E C t is the heating output power of the heat recovery steam generator (HRSG) at time period t; P R E C r a t is the rated output power of HRSG. λ R E C is the heating efficiency of the HRSG. P R E C , min t and P R E C , max t are the minimum and maximum power of the HRSG, respectively.

3.2.5. Constraints of Energy Storage

Electric Energy Storage Constraints
{ 0 P E S t , C P E S , C A P t ζ E S t , C 0 P E S t , D Q E S , C A P t ζ E S t , D Q E S , min t Q E S t Q E S , max t Q E S t = Q E S t 1 ( 1 λ E S ) + ( P E S t 1 , C η E S C P E S t 1 , D η E S D )
where P E S t , C and P E S t , D are the charging and discharging power of the electric storage equipment at time period t. Q E S , C A P t is the rated capacity of the electric storage equipment. ξ E S t , C and ξ E S t , D are the maximum rate of charge and discharge of the storage equipment. Q E S t , Q E S , min t , and Q E S , max t are the present electricity at time period t, minimum and maximum electricity of storage equipment, respectively. λ E S is the self-discharge rate of the storage equipment. η E S C and η E S D are the charge-discharge efficiencies of the storage equipment, respectively.
Constraints of Cold Storage
{ 0 P C S t , C Q C S , C A P t ζ C S t , C 0 P C S t , D Q C S , C A P t ζ C S t , D Q C S , min t Q C S t Q C S , max t Q C S t = Q C S t 1 ( 1 λ C S ) + ( P C S t 1 , C η C S C P C S t 1 , D η C S D )
where P C S t , C and P C S t , D are the power output of cold storage equipment in time period t. Q C S , C A P t is the rated capacity of the cold storage equipment. ξ C S t , C and ξ C S t , D are the maximum charging and discharging rates of the cold storage equipment in time period t. Q C S t , Q C S , min t , and Q C S , max t are the present cold energy at time period t, minimum and maximum cold energy of the cold storage equipment, respectively. λ C S is the self-discharge rate of the cold storage equipment. η C S C and η C S D are the charge and discharge efficiency of the cold storage equipment, respectively.
Constraints of Thermal Storage
{ 0 P H S t , C Q H S , C A P t ζ H S t , C 0 P H S t , D Q H S , C A P t ζ H S t , D Q H S , min t Q H S t Q H S , max t Q H S t = Q H S t 1 ( 1 λ H S ) + ( P H S t 1 , C η H S C P H S t 1 , D η H S D )
where P H S t , C and P H S t , D are the heating and release power of the thermal storage equipment at time period t, respectively. Q H S , C A P t is the rated capacity of the thermal storage equipment. ξ H S t , C and ξ H S t , D are the ratios of heating and release of the thermal storage equipment. Q H S t , Q H S , min t , and Q H S , max t are the present thermal storage at time period t, minimum, and maximum thermal storage of the thermal storage equipment, respectively. λ H S is the self-release rate of the thermal storage equipment. η H S C and η H S D are the efficiency of heating and release of the thermal storage equipment, respectively.

3.2.6. Constraints of Energy Balance

The output of each equipment in the integrated energy system is not only affected by its own parameters, but also related to the system energy balance.
Electricity Balance
P P V t + P W T t + P M T t + P C O t + P E S t , D = P D L t + P E S t , C + P E C E t + P E H E t
where the P E C E t is the power consumption of electrical chiller. P E H E t is the power consumption of electrical heater.
Cold Balance
P E C t + P A C t + P C S t , D = P C L t + P C S t , C
where P E C t is the output of electrical chiller. P A C t is the output of absorption chiller. P C L t is the cold demand of the system.
Thermal Balance
P E H t + P G B t + P R E C t + P H S t , D = P H L t + P H S t , C
where P E H t is the thermal power output of electrical heater in time period t. P G B t is the thermal power output of the gas boiler in time period t. P R E C t is the output thermal power of heat recovery steam generator (HRSG). P H L t is the thermal demand of the system.
Constraints of Power Interaction
P C O , min t P C O t P C O , max t
where P C O , min t and P C O , max t are the minimum and maximum interaction power with the distribution network at time period t, respectively.

4. Simulation and Analysis

A regional integrated energy system in Shanghai is taken as an example in this paper. The scheduling step is 1 h, and the scheduling period is 24 h. The CPLEX solver is called to get the optimal solution in the MATLAB environment.

4.1. Parameter Setting

The price of electricity purchased and sold in Shanghai is shown in Table 1, and the equipment parameters in this paper are shown in Table 2.

4.2. Results and Discussions

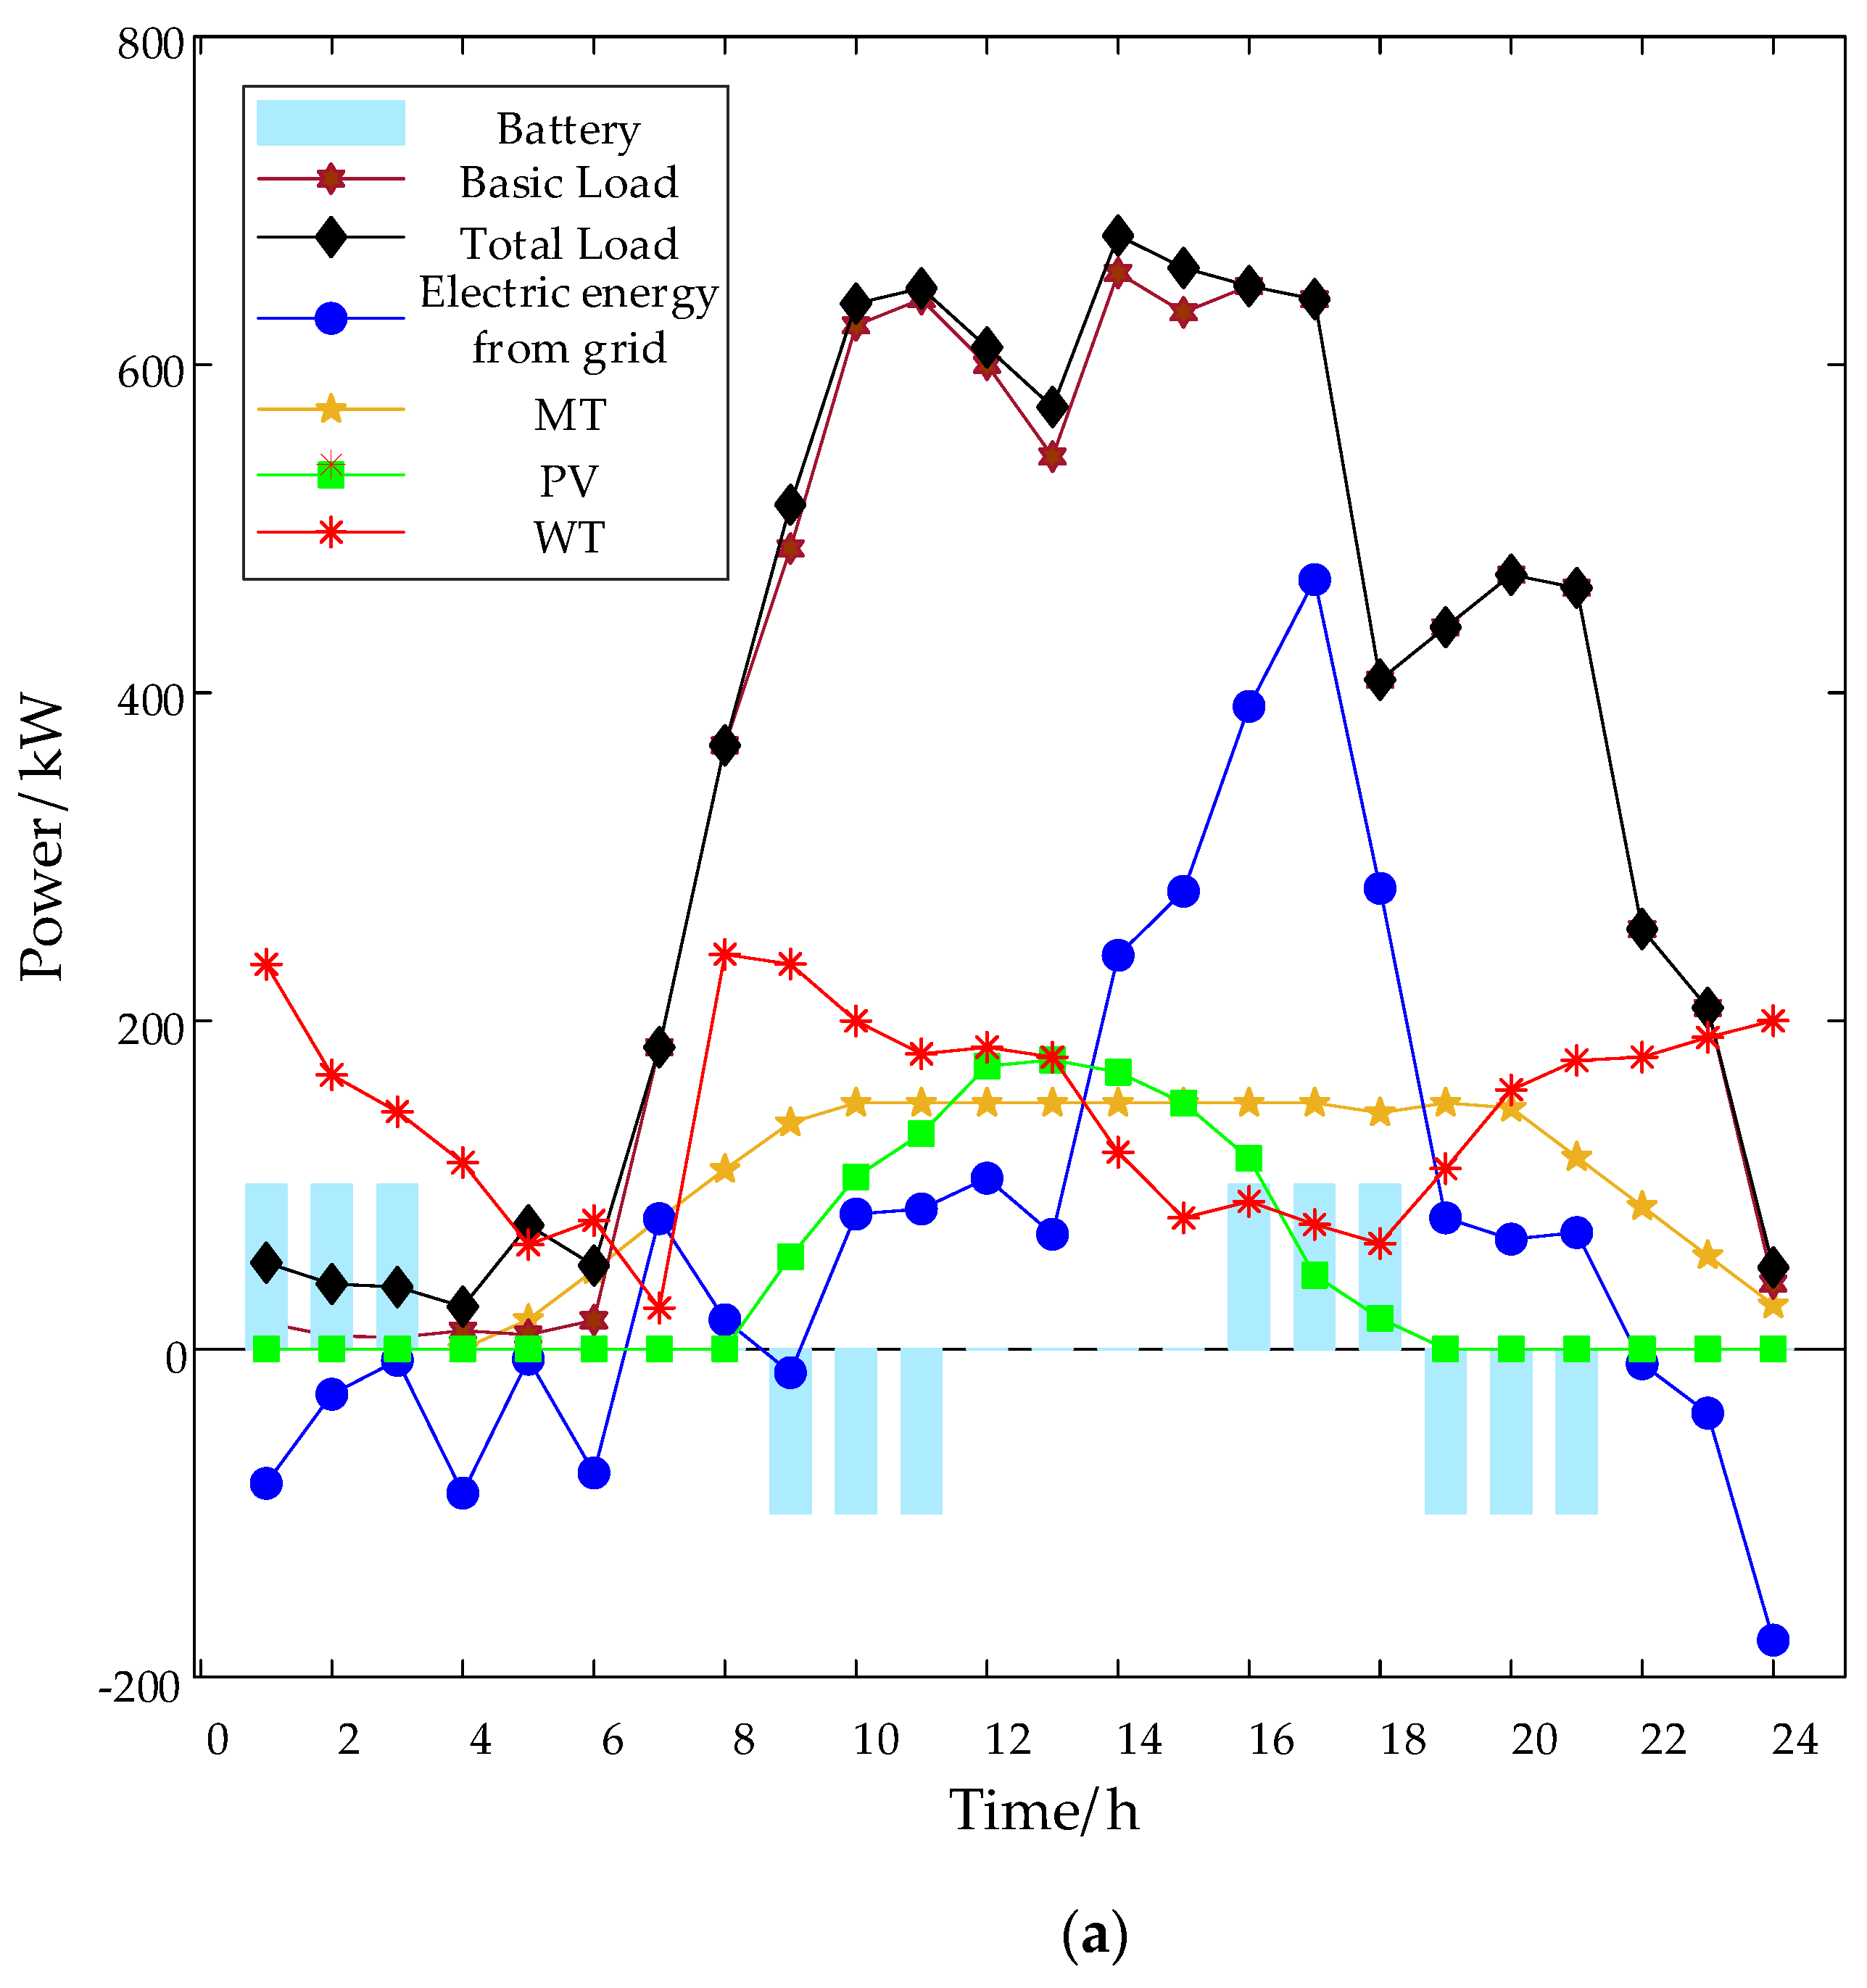
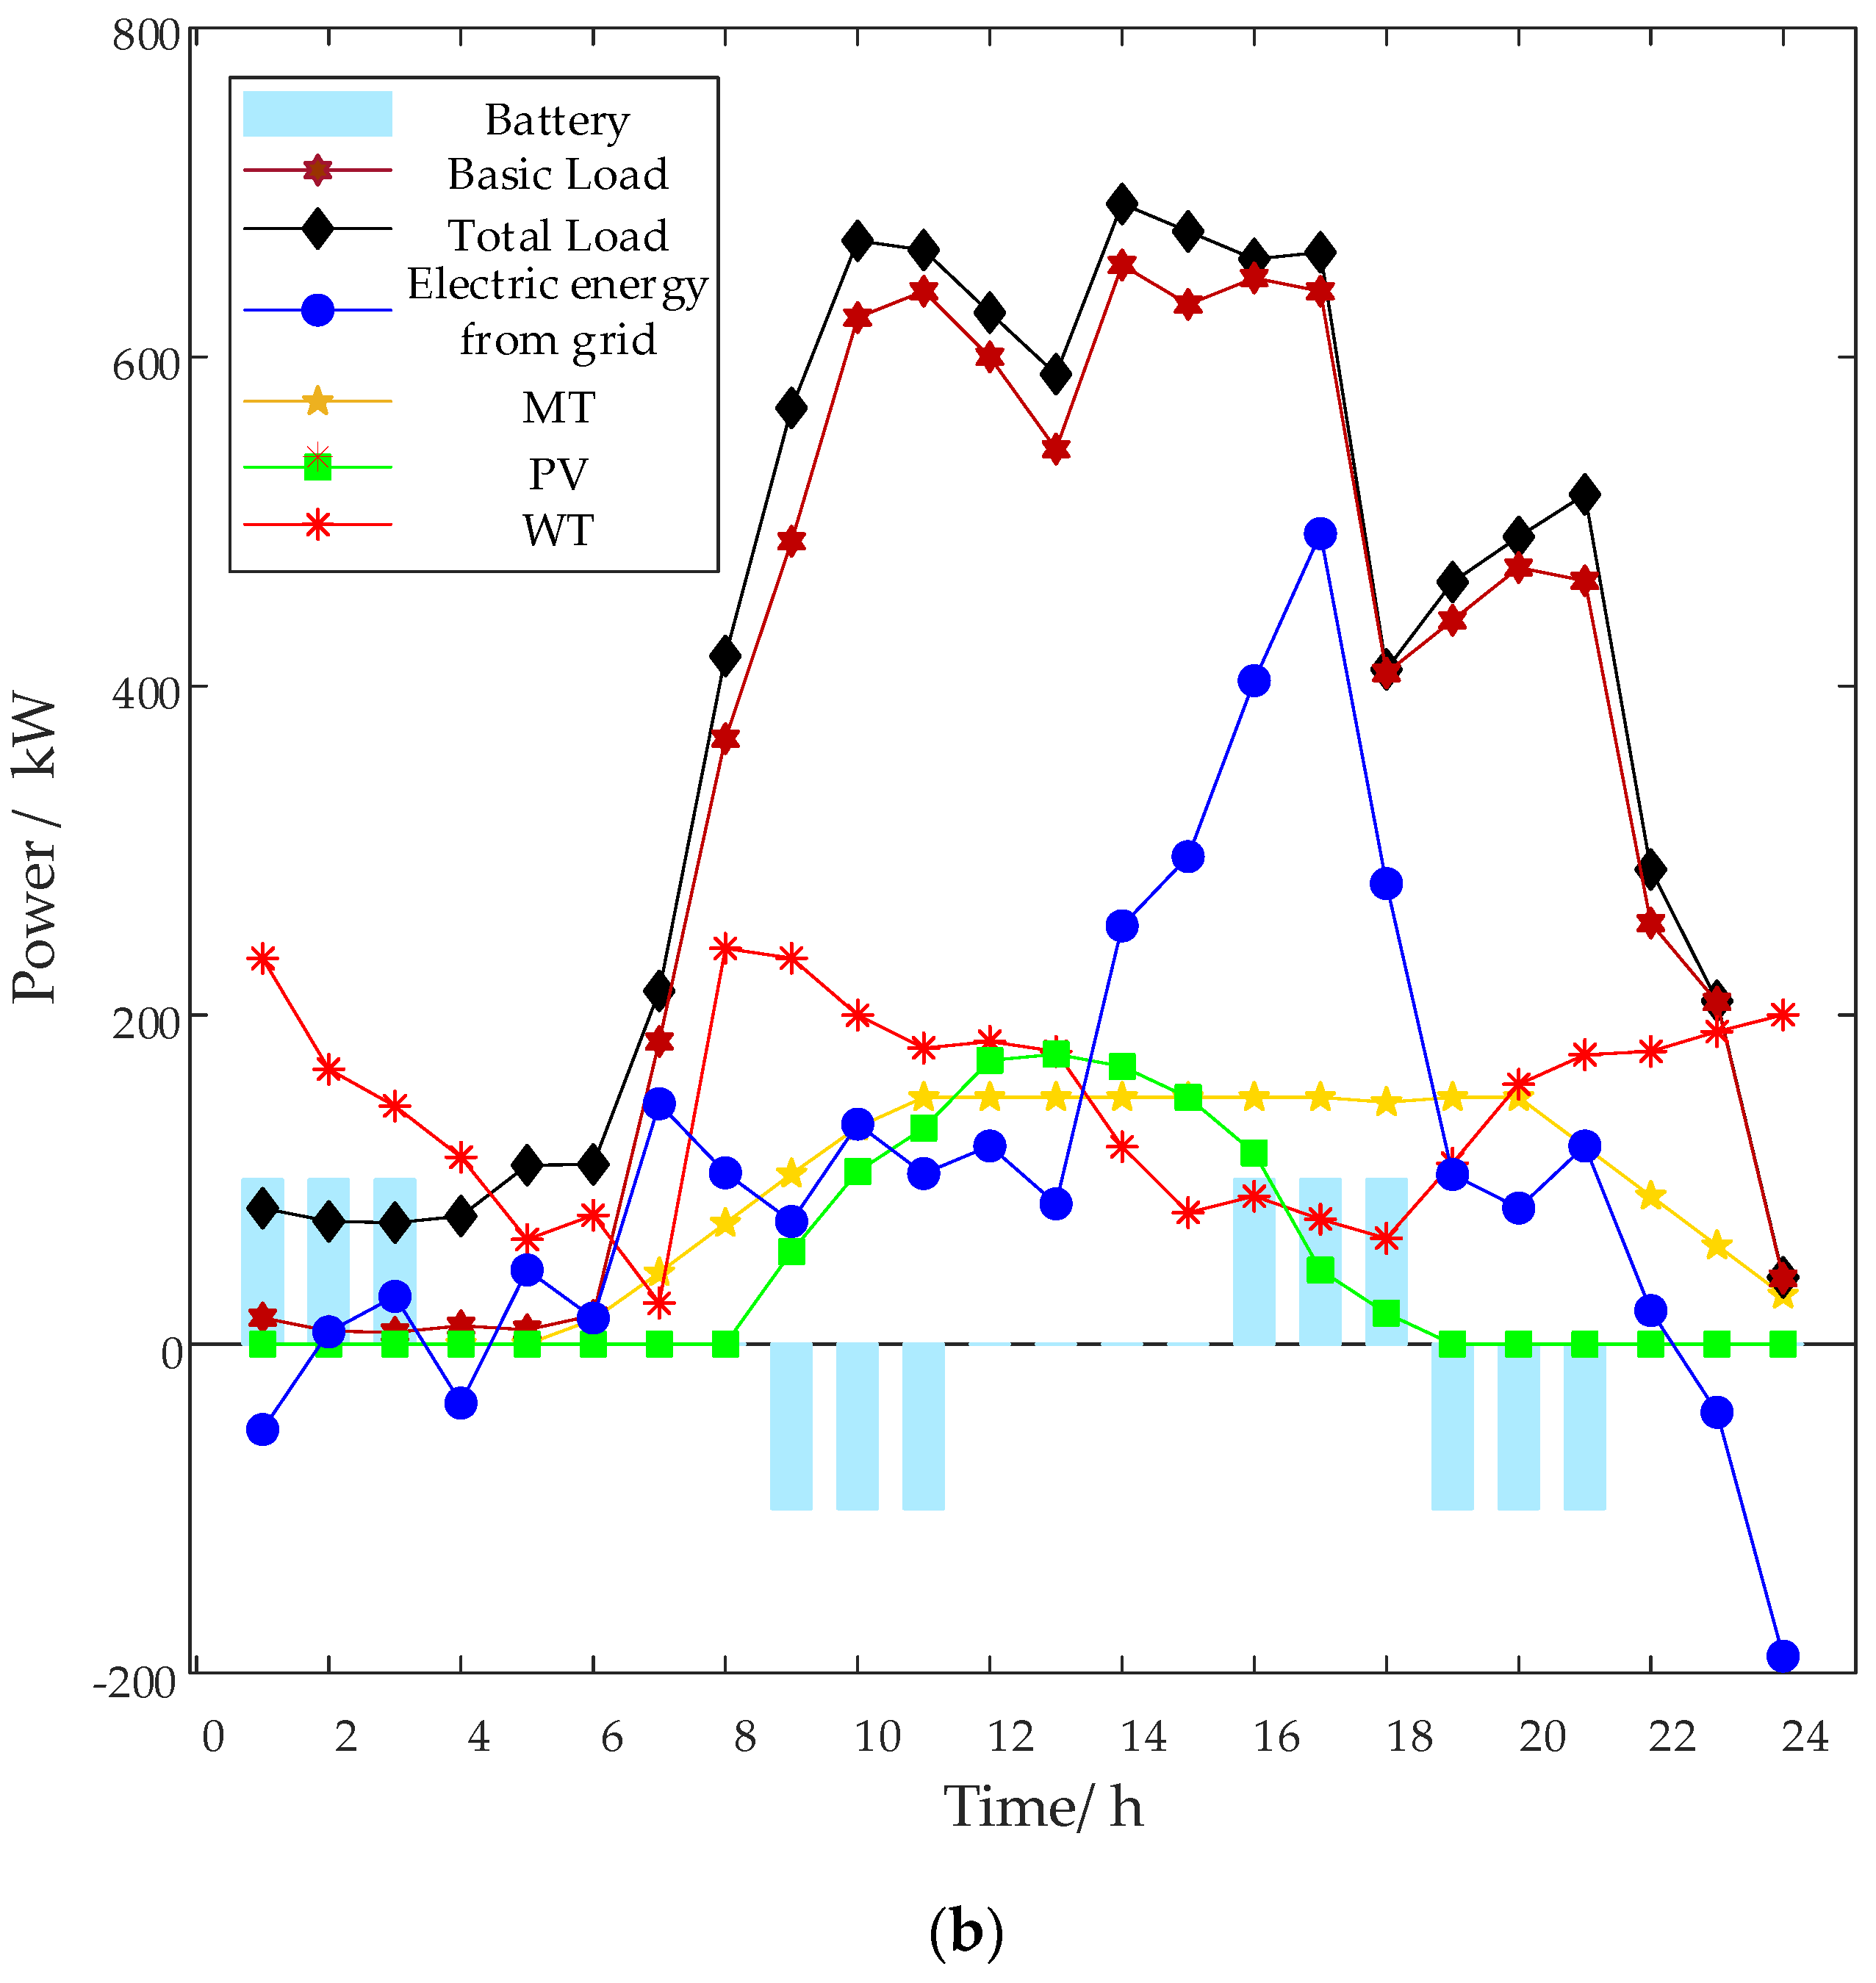
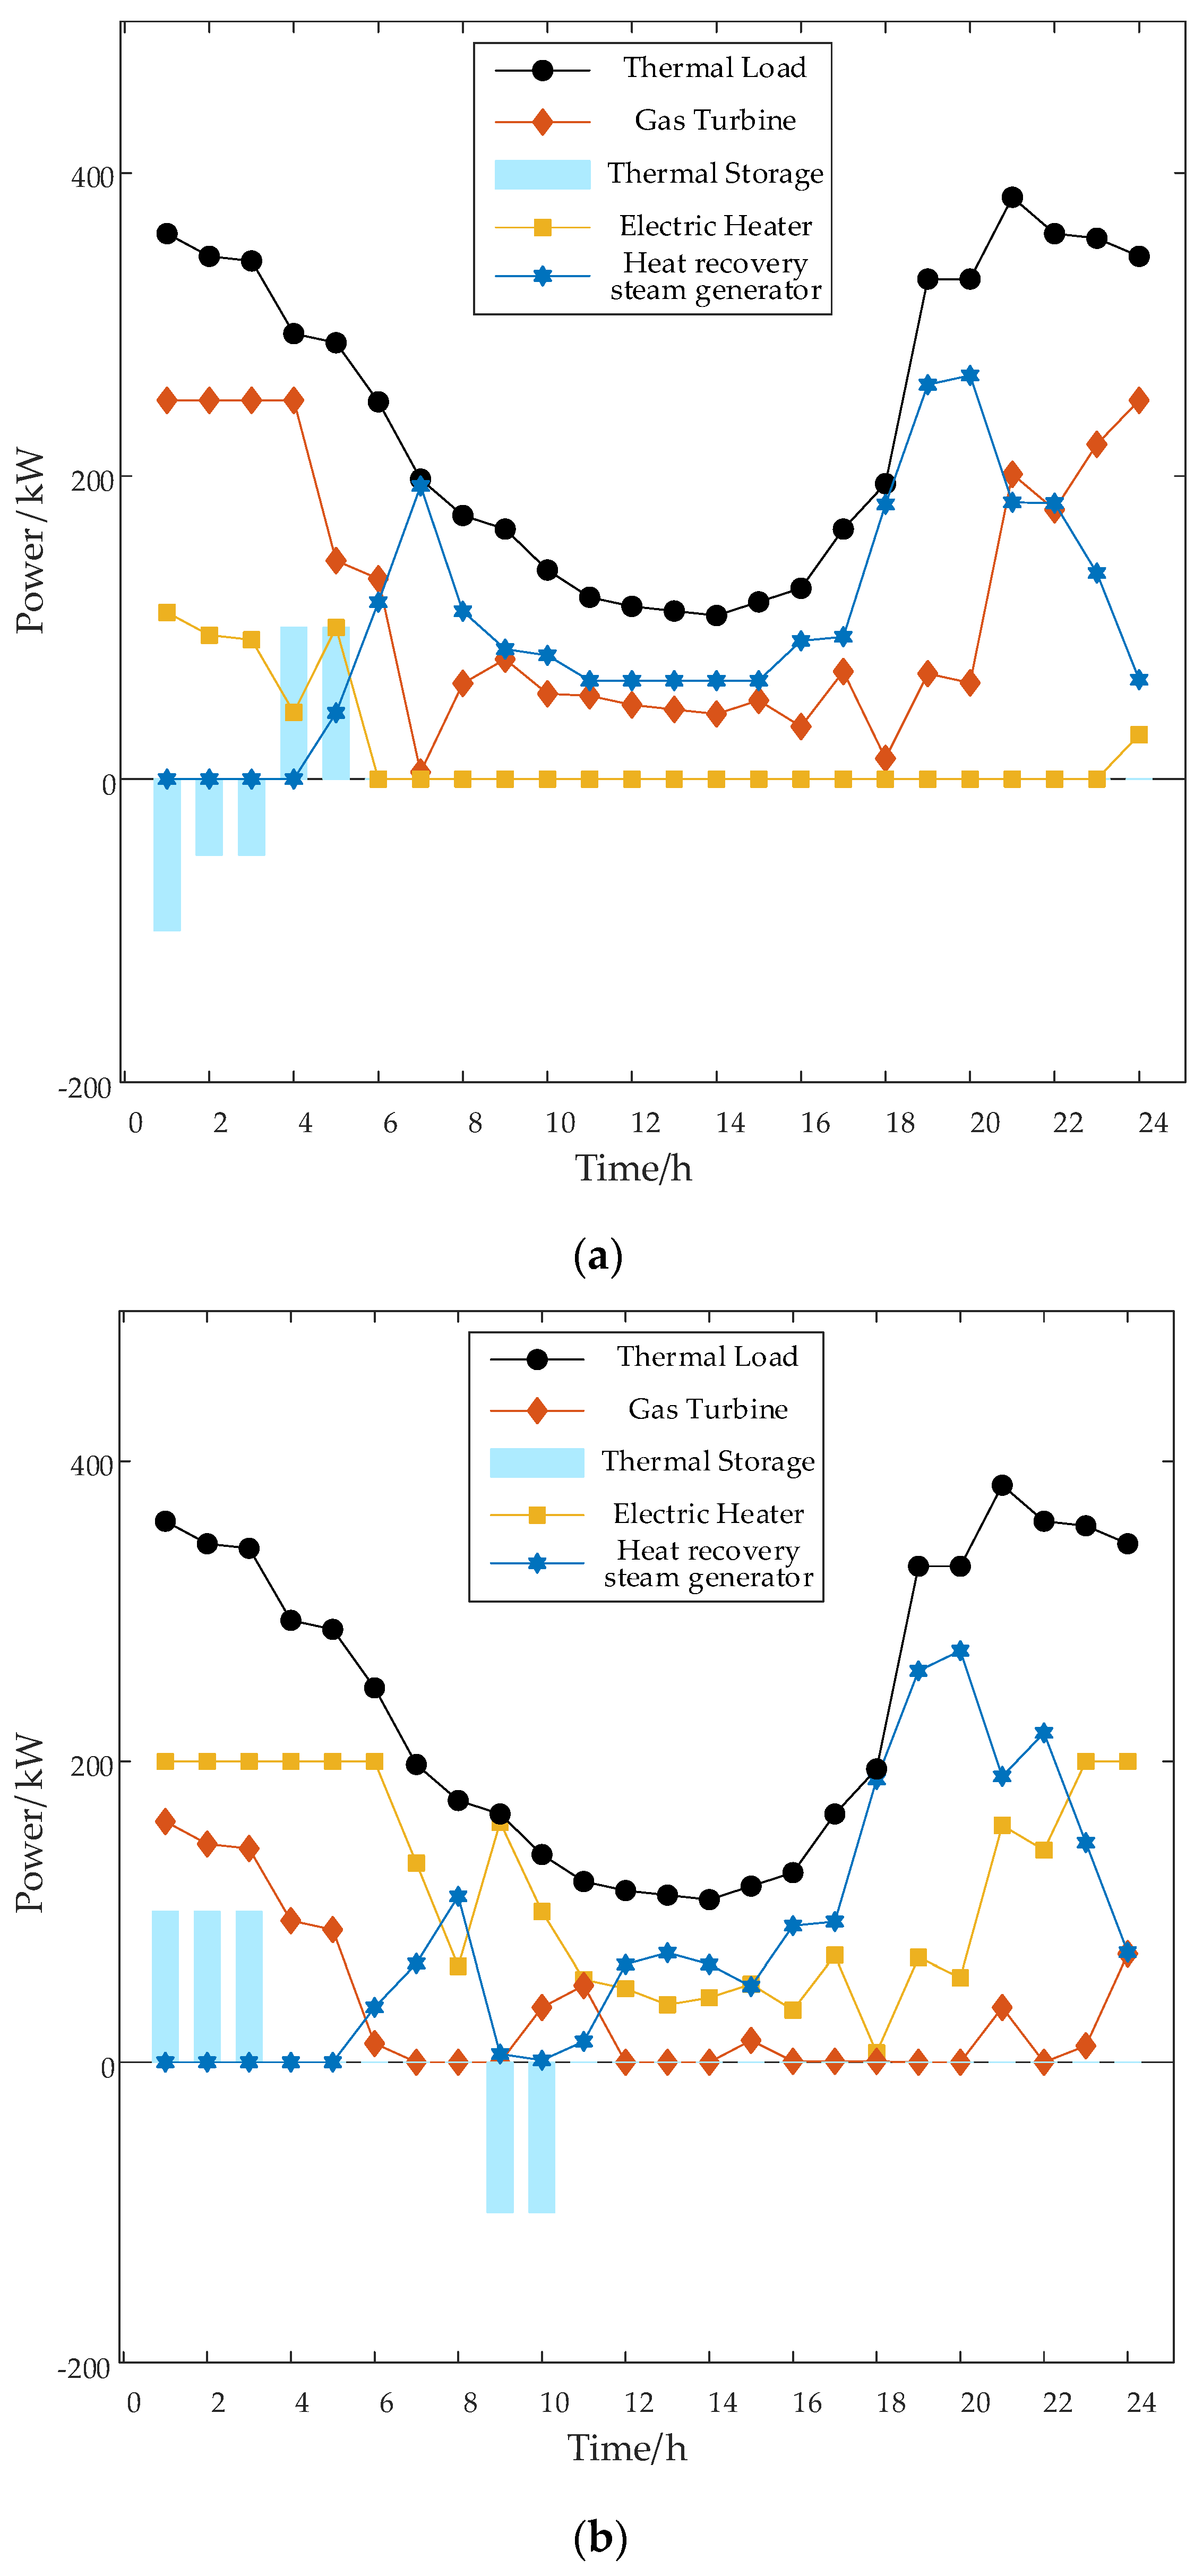
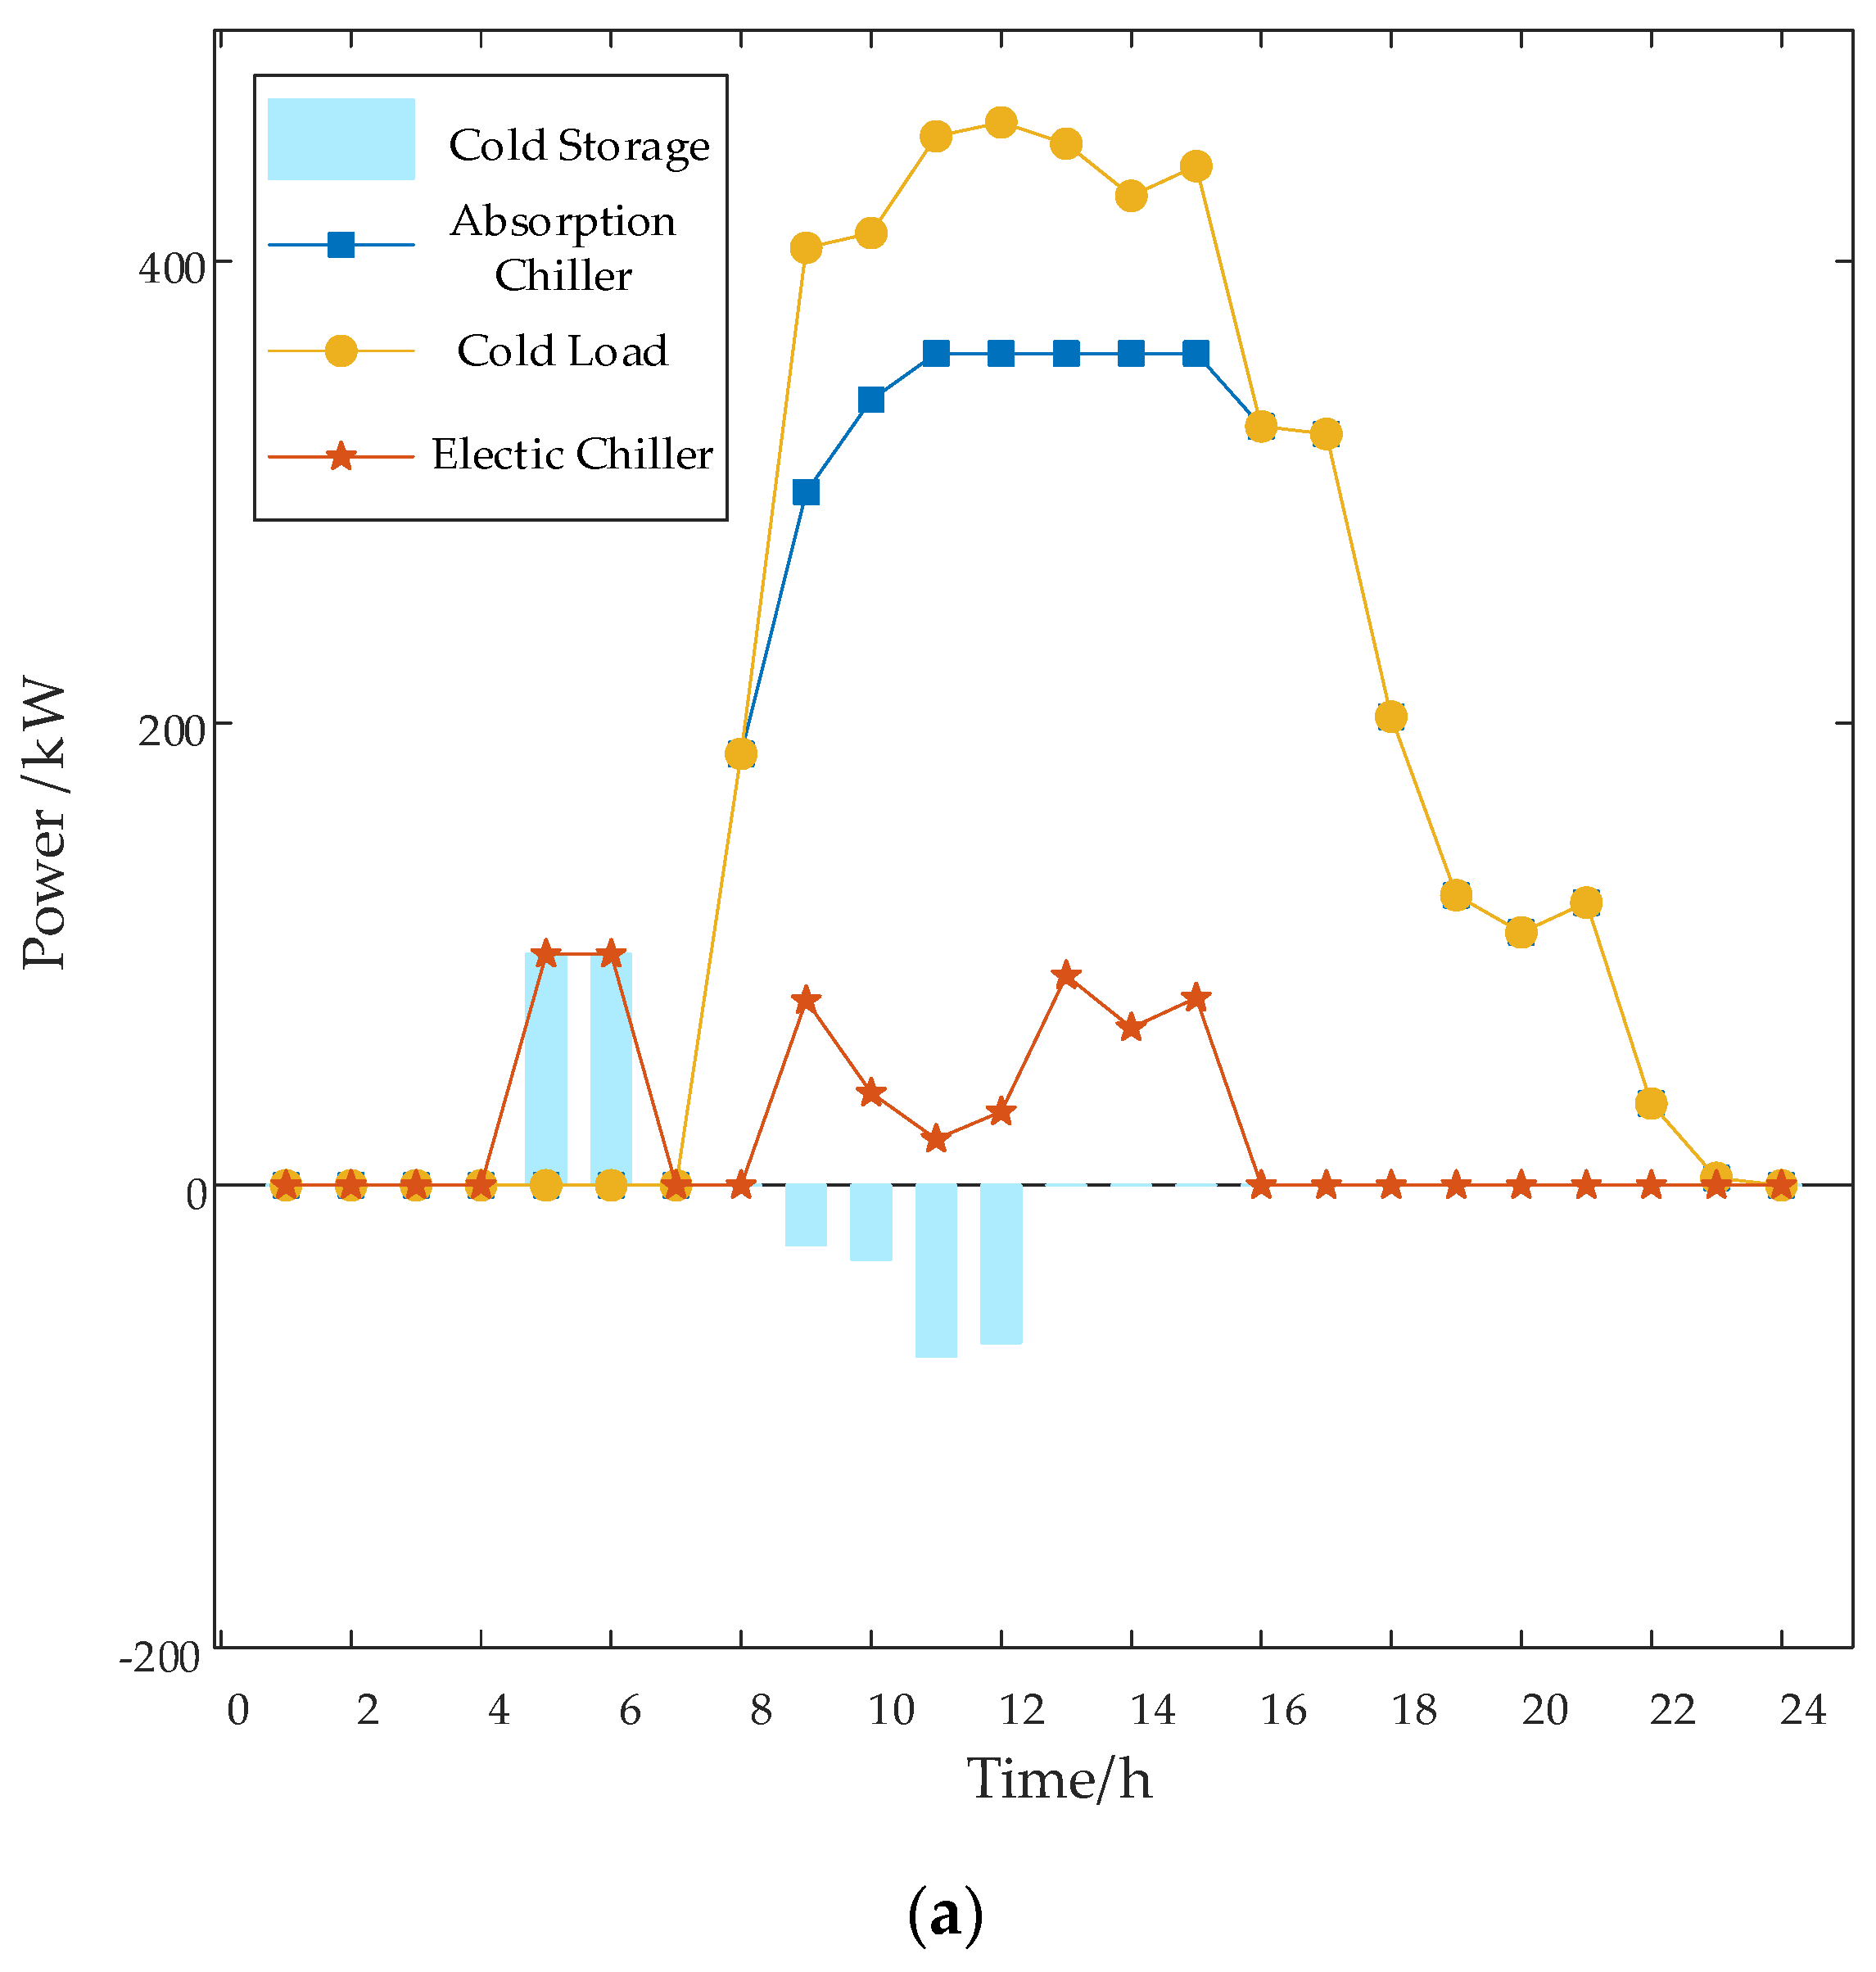
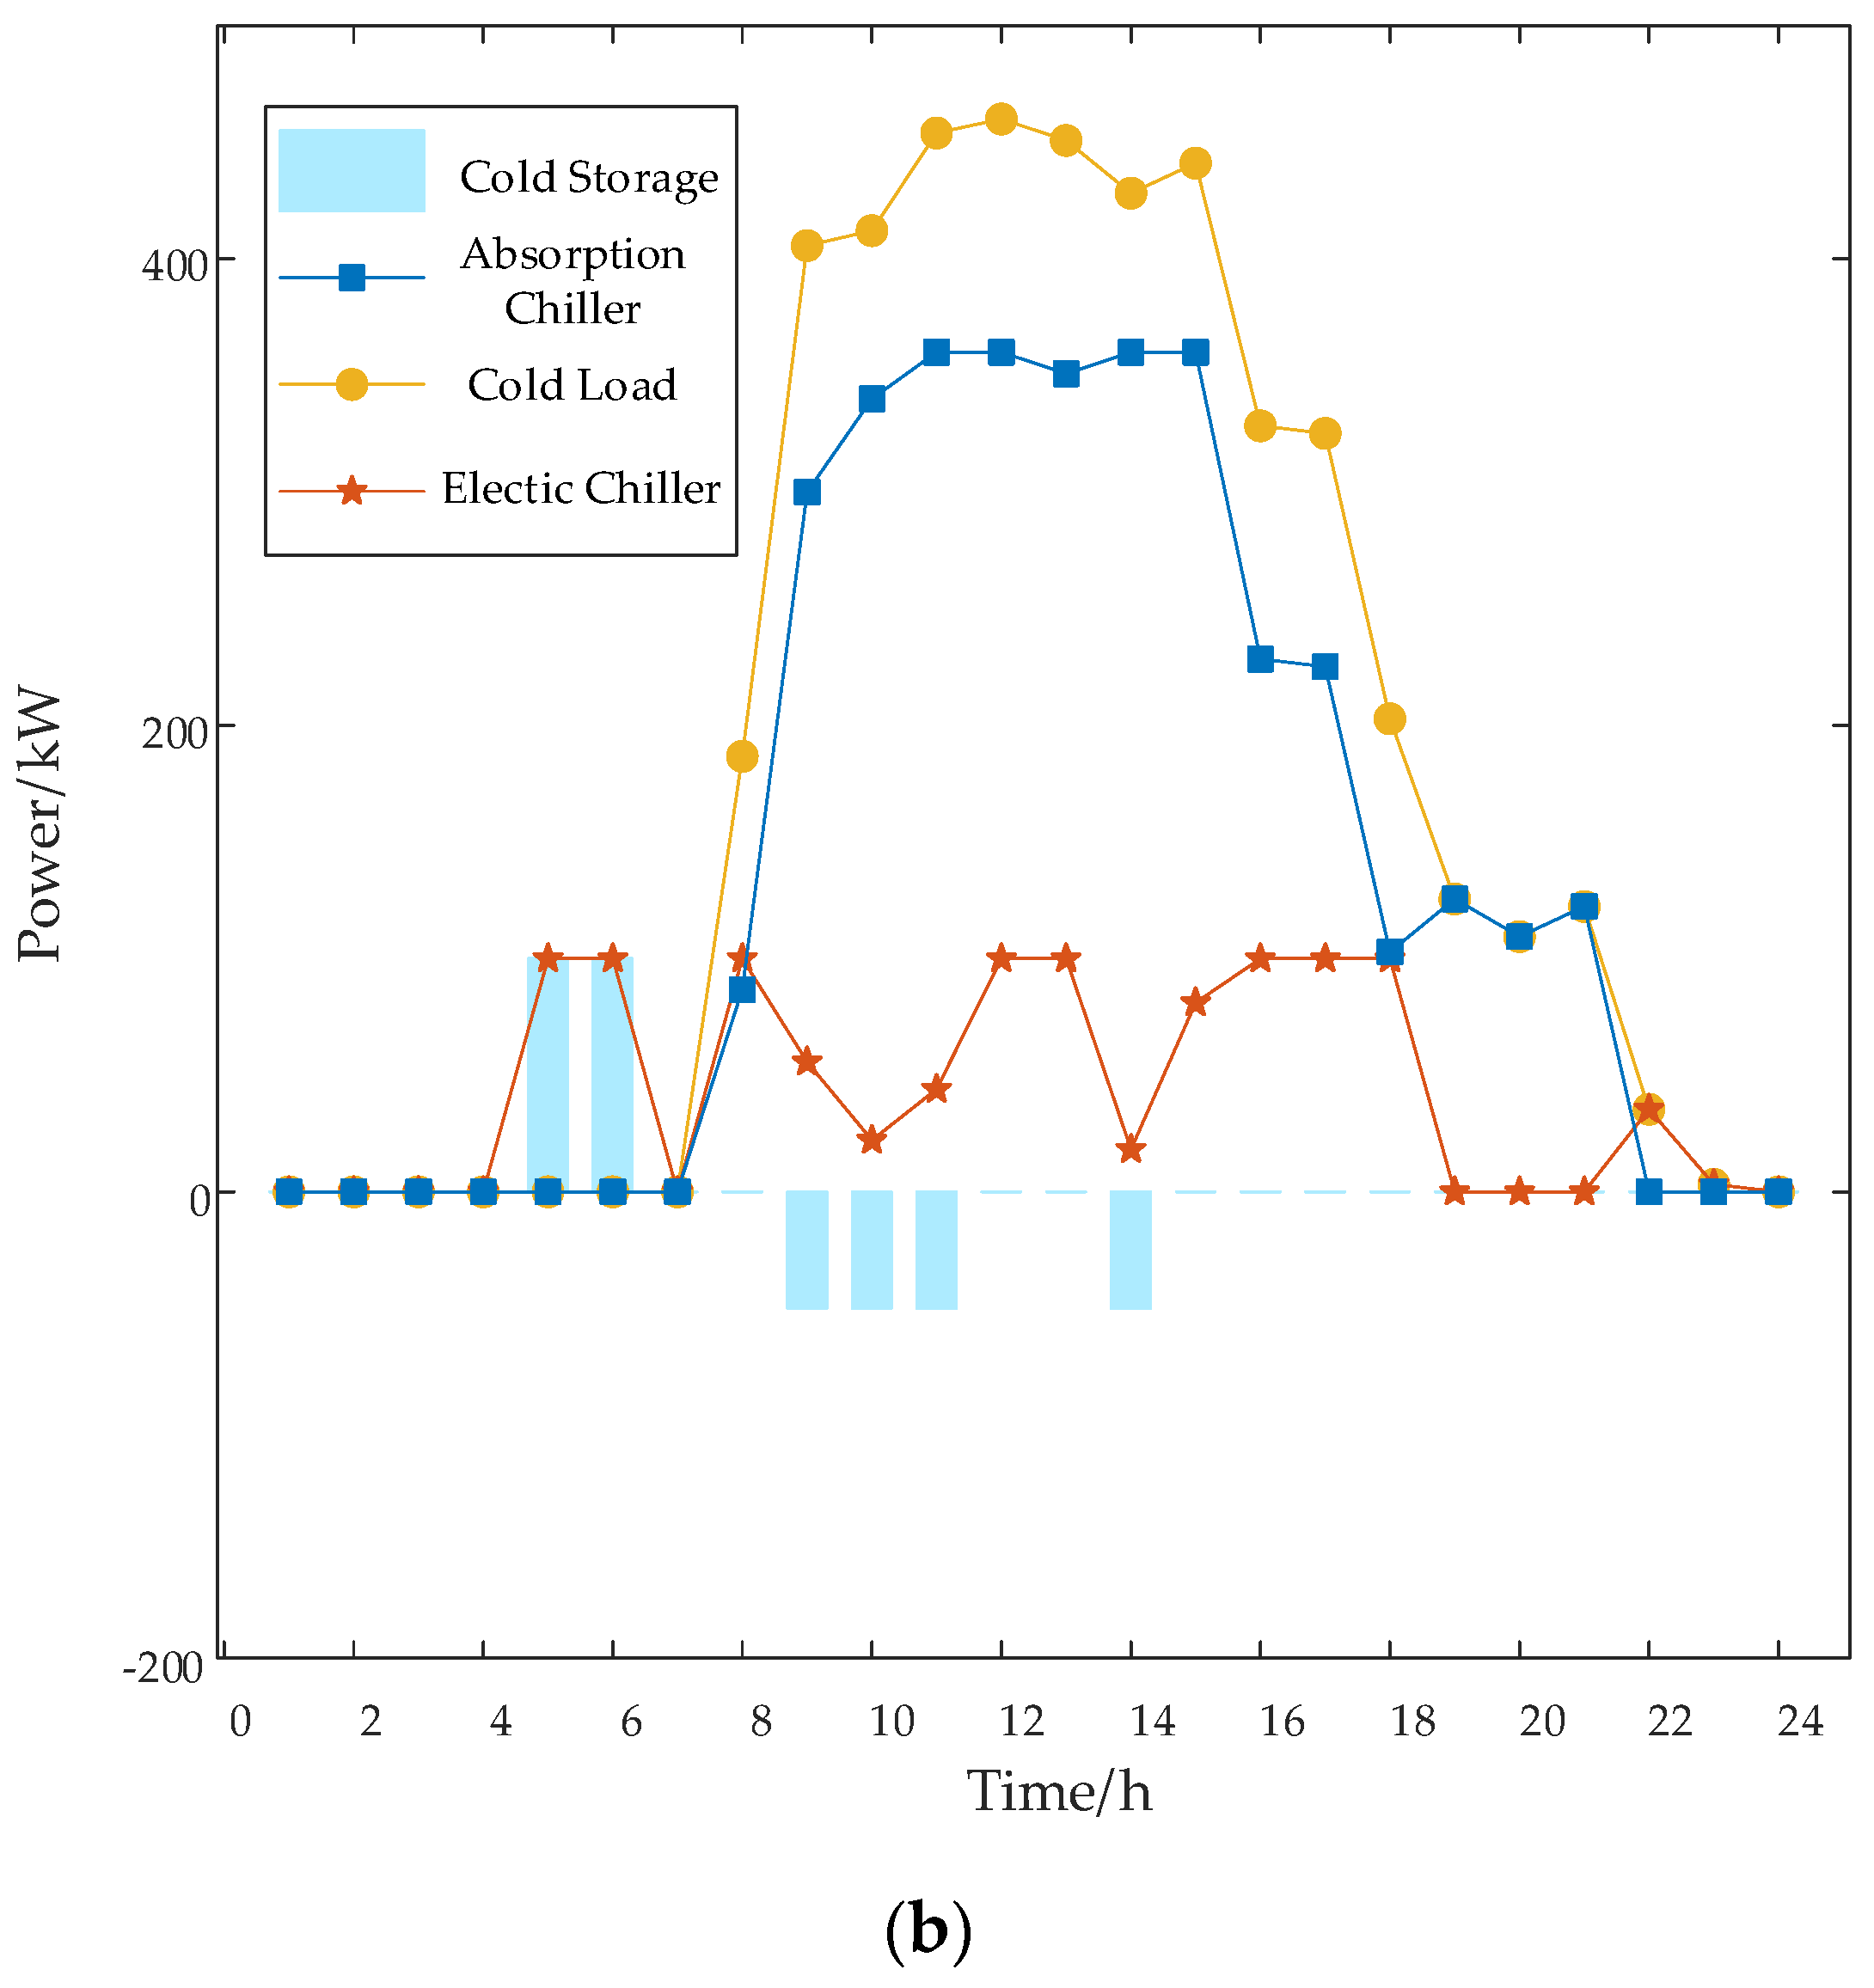
4.2.1. Comparative Analysis of Energy Output

In this section, the proposed optimization model is simulated, and the results are shown in Figure 2, Figure 3 and Figure 4.
Figure 2 shows the results of the system optimal dispatching of the electric bus. The electric energy generated by WT at night is greater than the load demand. It can be seen from Figure 2 that the excess power is consumed by EH, stored by battery, and sequentially traded through power grid. In the day time, the power supplied by PV, WT, gas turbine could not meet the load demand. As a result, the power supply is supplemented by the distribution network. The battery is charged and discharged twice a day in Figure 2. It is charged from 3 a.m. to 5 a.m. and from 16 p.m. to 18 p.m. and discharged from 9 a.m. to 11 a.m. and from 19 p.m. to 21 p.m.
According to the comparison between Figure 2a,b the basic electrical load remains unchanged. The output of the gas turbine in Figure 2b is reduced, and the load of electric heater and electric chiller is increased. In addition, the total electrical load is significantly higher than that before optimization. Subject to carbon emissions constraints, the output of gas turbine decreases during the day time. Therefore, the load of electric heater and electric chiller is increased, too.
According to Figure 3, the thermal load demand remains unchanged in the two situations described in this paper. The demand of thermal load at night is high, and the thermal storage device is charged and discharged once a day. Moreover, the thermal load is mainly supplied by GB and REC before optimization, supplemented by EH. After optimization, the thermal load is mainly supplied by EH, and GB and REC are auxiliary.
The cost of GB and REC is lower than that of EH without considering the responsibility of renewable energy consumption and carbon emission trading. Therefore, the thermal load is mainly supplied by GB and REC before optimization, supplemented by EH.
After optimization, as can been seen, when the responsibility of renewable energy consumption and carbon emission trading are taken into account, the cost of GB and REC is higher than that of EH. The thermal demand is mainly supplied by EH.
Moreover, the power release time of thermal storage is also adjusted. Before optimization, to meet the thermal demand, the thermal storage equipment releases the power from 1 a.m. to 3 a.m. However, the thermal storage equipment releases the power from 9 a.m. to 10 a.m. to reduce the output of the EH. During this time, the price of electricity purchase is at the peak.
According to Figure 4, the cold-load demand during the day is high, and the cold-storage equipment is charged and discharged once a day. The cost of AC is lower than that of EC without considering the responsibility of renewable energy consumption and carbon emission trading. Therefore, the cold-load is mainly supplied by AC before optimization, supplemented by EC. After optimization, as can been seen, when the responsibility of renewable energy consumption and carbon emission trading are taken into account, the cost of AC is higher than that of EC. The cold-load demand is mainly supplied by EC.
Moreover, the power release time of cold-storage is also adjusted. Before optimization, to meet the cold-load demand, the cold-storage equipment releases the power from 9 a.m. to 12 a.m. However, the cold-storage equipment releases the power from 9 a.m. to 11 a.m. and from 14 p.m. to 15 p.m. to reduce the output electricity. During this time, the price of electricity purchase is at the peak.

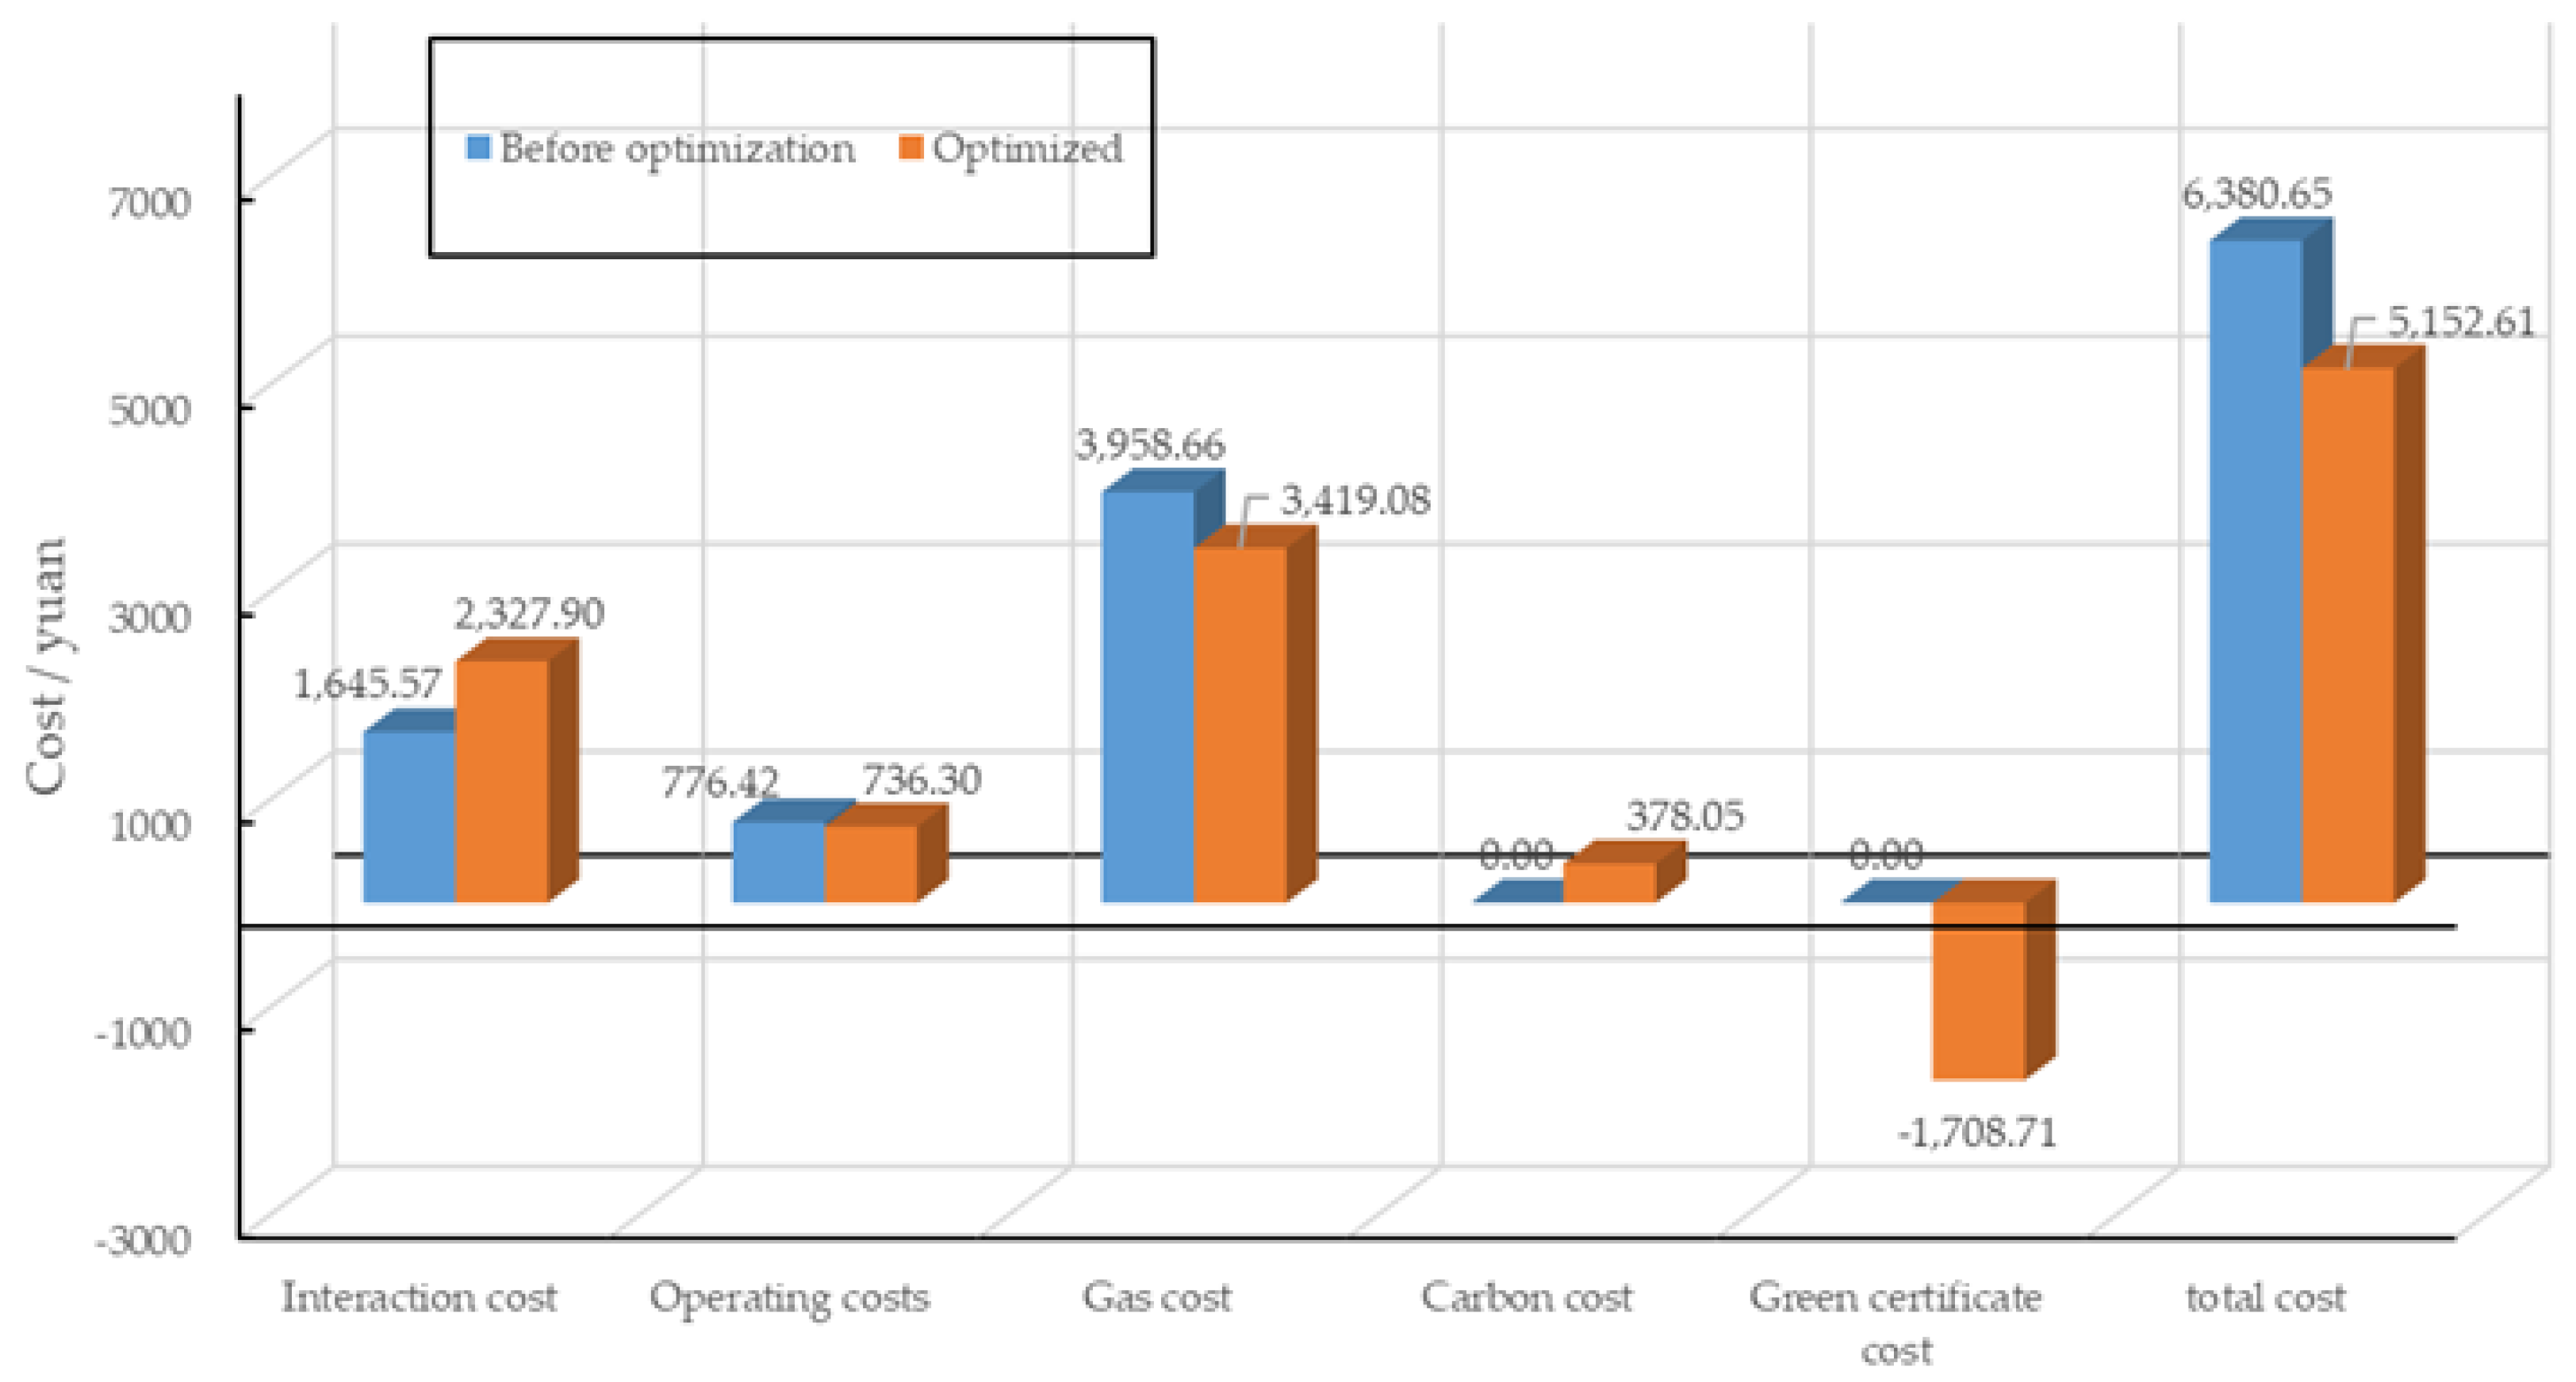
4.2.2. Cost Analysis

As can been seen from Figure 5, after optimization, the costs of interaction with distribution network, system operating, and carbon transaction increase slightly. The cost of gas purchase decreases, and the renewable power costs increase in the opposite direction, and it can be construed that the total cost of the integrated energy system is reduced. According to Table 3, it can be seen that the power generated by PV and WT can not only participate in green certificate transactions, but offset part of the carbon emission, which has environmental and economic benefits.

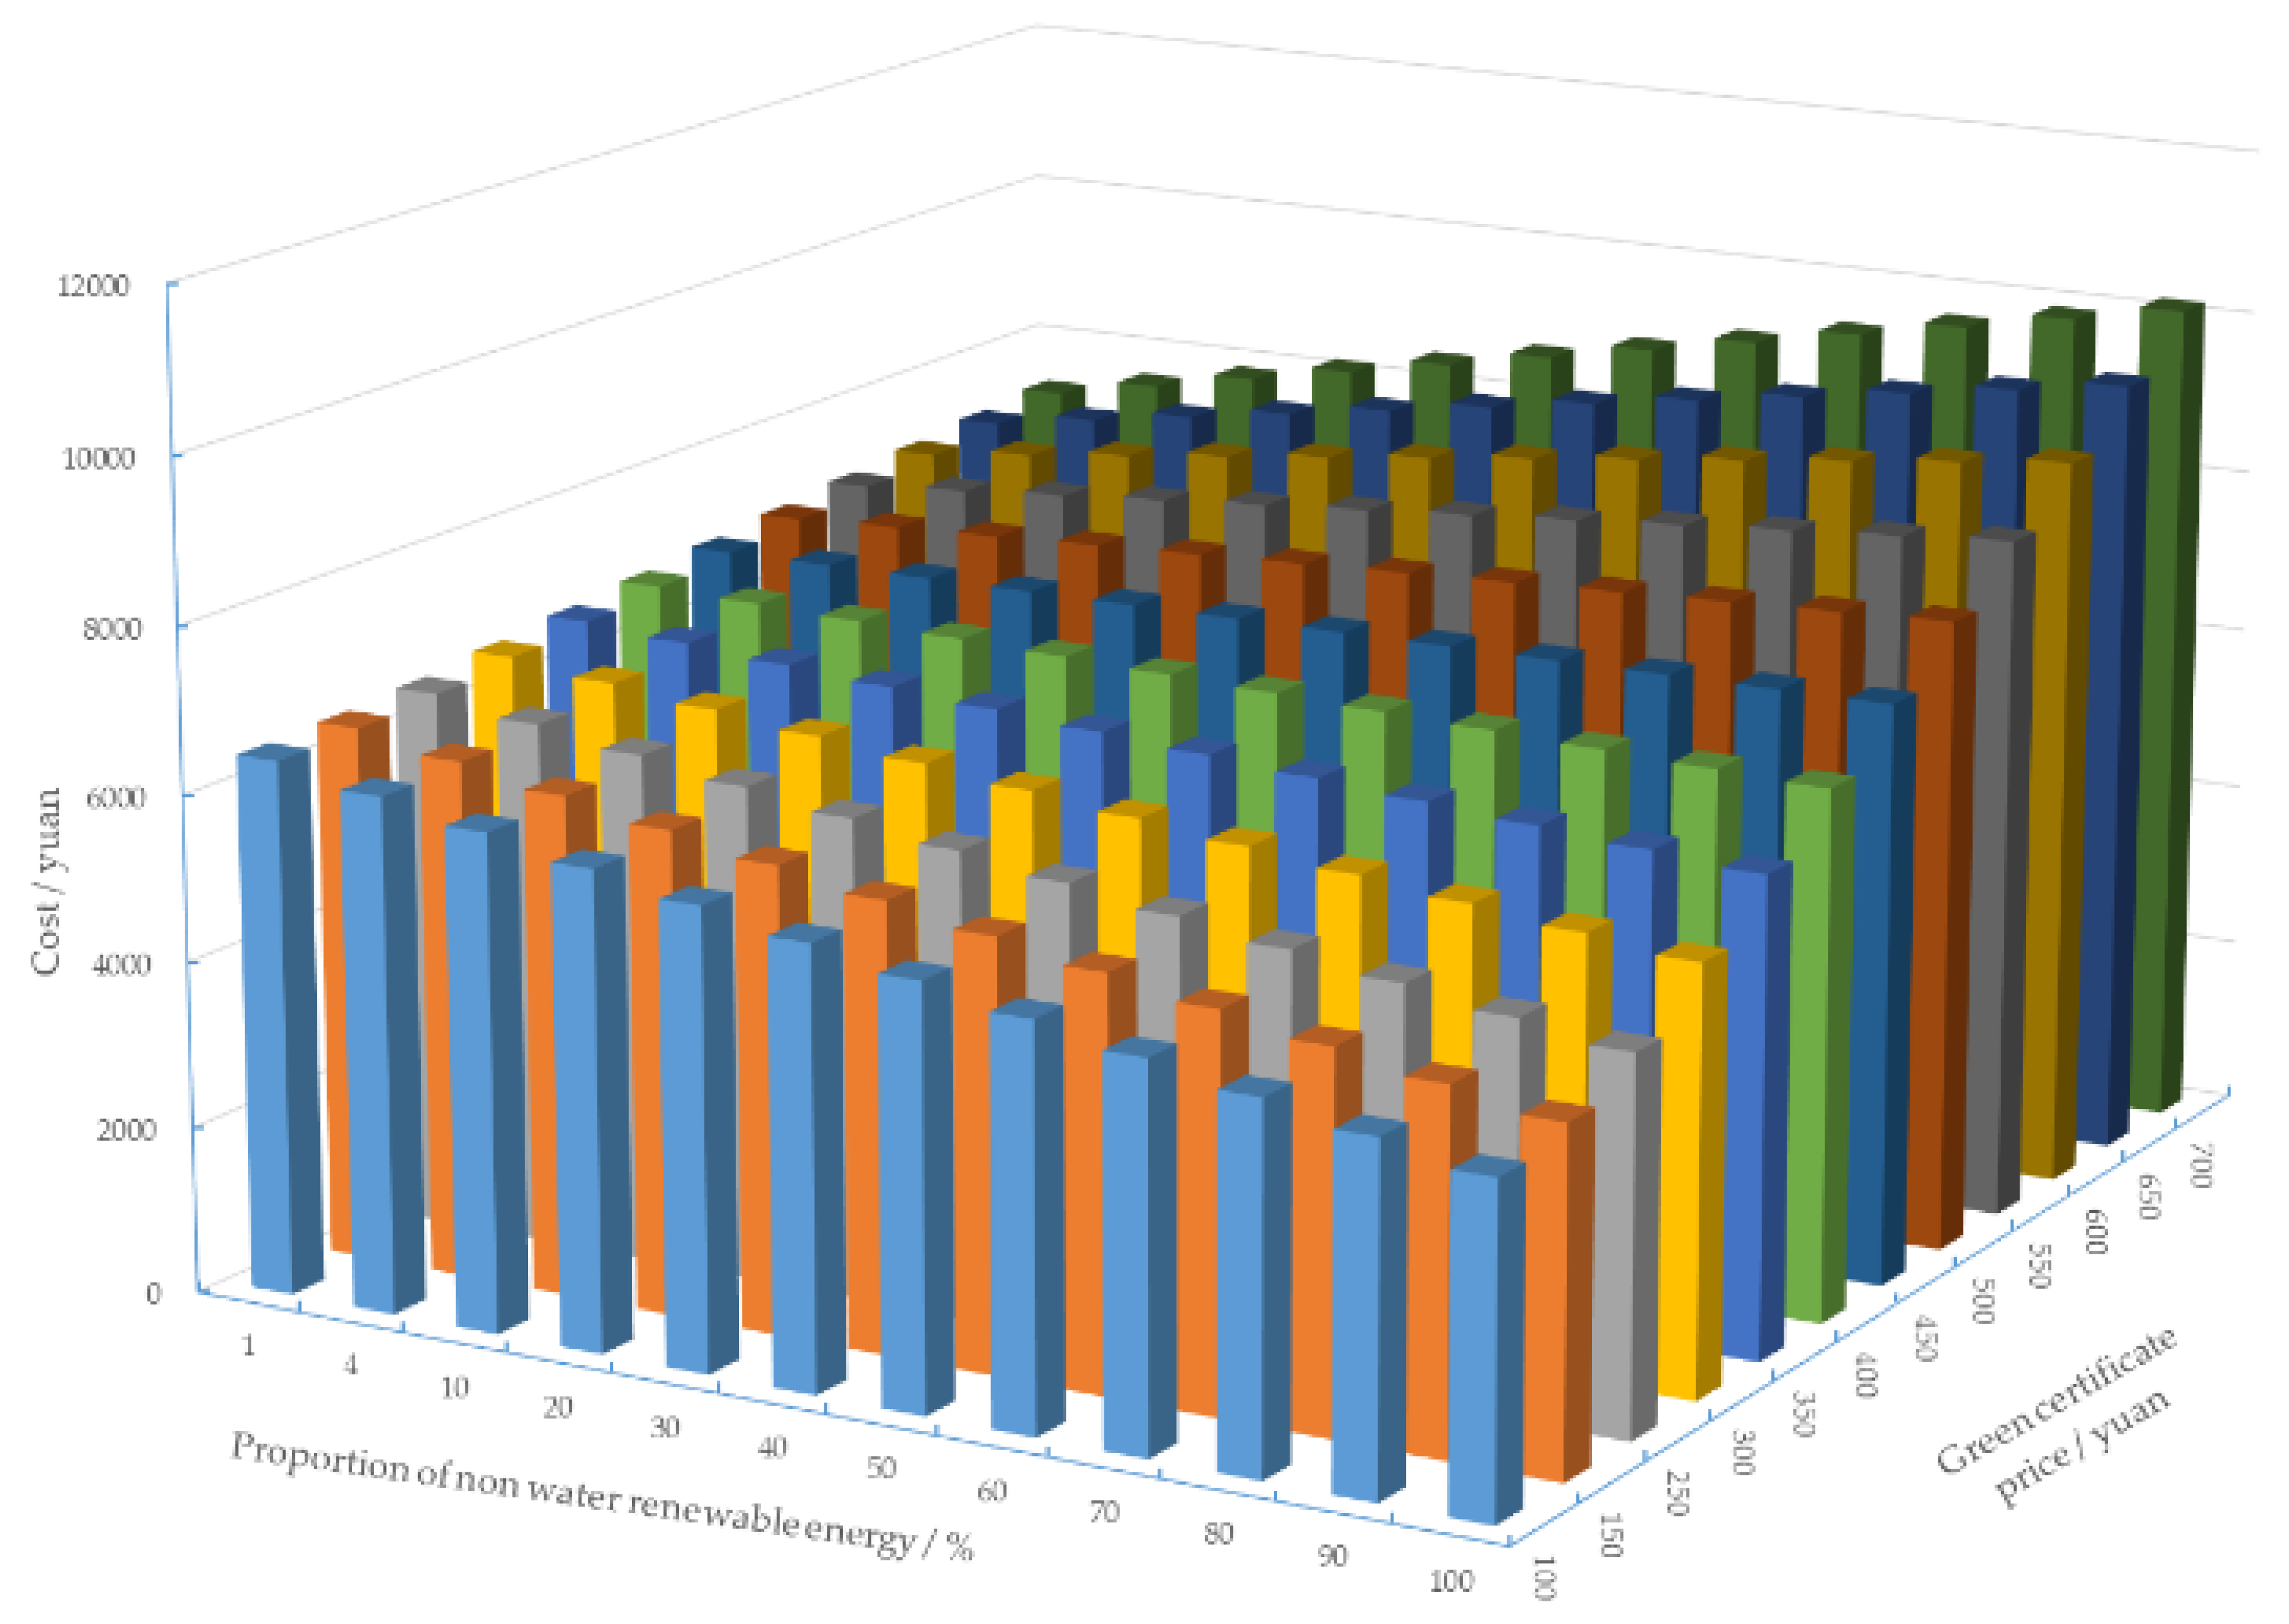
4.2.3. Sensitivity Analysis

For further study on integrated energy system, different factors such as the proportion of CCER, the responsibility of renewable energy consumption, the price of green certificates, and the carbon transaction are analyzed in this section. The default proportion of CCER is 5%. The default value of responsibility of renewable energy consumption is 4%, and the default unit-price of green certificate price is CNY403.

Sensitivity Analysis under the Constraints of the Responsibility of Renewable Energy Consumption

In this case, the cost of total system is affected by both the green certificate price and the responsibility of renewable energy consumption. Figure 6 shows the impact of different green certificate prices and different proportion of the responsibility of renewable energy consumption.
As illustrated in Figure 6, the higher the green certificate price is, the lower the proportion of non-hydropower and the lower the total cost of the system are. When the proportion of non-hydropower is low, the responsibility of renewable energy consumption is low, correspondingly. On the other hand, the integrated energy system could gain benefits by selling the green certificate price converted according to the excess renewable power.
Moreover, when the proportion of non-hydropower is less than 40%, on the basis of the same proportion of non-hydropower, the total cost of the system gradually decreases with the increase of green certificate price. When the proportion of non-hydropower is greater than 50%, the total cost of the system gradually increases with the increase of green certificate price on the basis of the same proportion of non-hydropower.
The renewable power of the integrated energy system could meet the load demand when the required proportion of non-hydropower is less than 40%, and the excess renewable power can be sold through the green certificate trading platform. Therefore, with the rise of green certificate price, the income of renewable power gradually increases and the total cost of the system gradually decreases, correspondingly. However, when it is greater than 50%, the renewable power could not meet the load demand, and the balance renewable power needs to be purchased through the green certificate trading platform, resulting in additional costs. Therefore, with the increase of the price of green certificate, the total cost of the system increases gradually.
As shown in Figure 6, when the required proportion of non-hydropower is 48%, the renewable power of the integrated energy system could just meet the load demand right. On the other hand, there is no need to buy or sell green certificates from the platform. It can be construed that the total cost of the system can be effectively reduced by increasing the proportion of renewable energy in the integrated energy system.

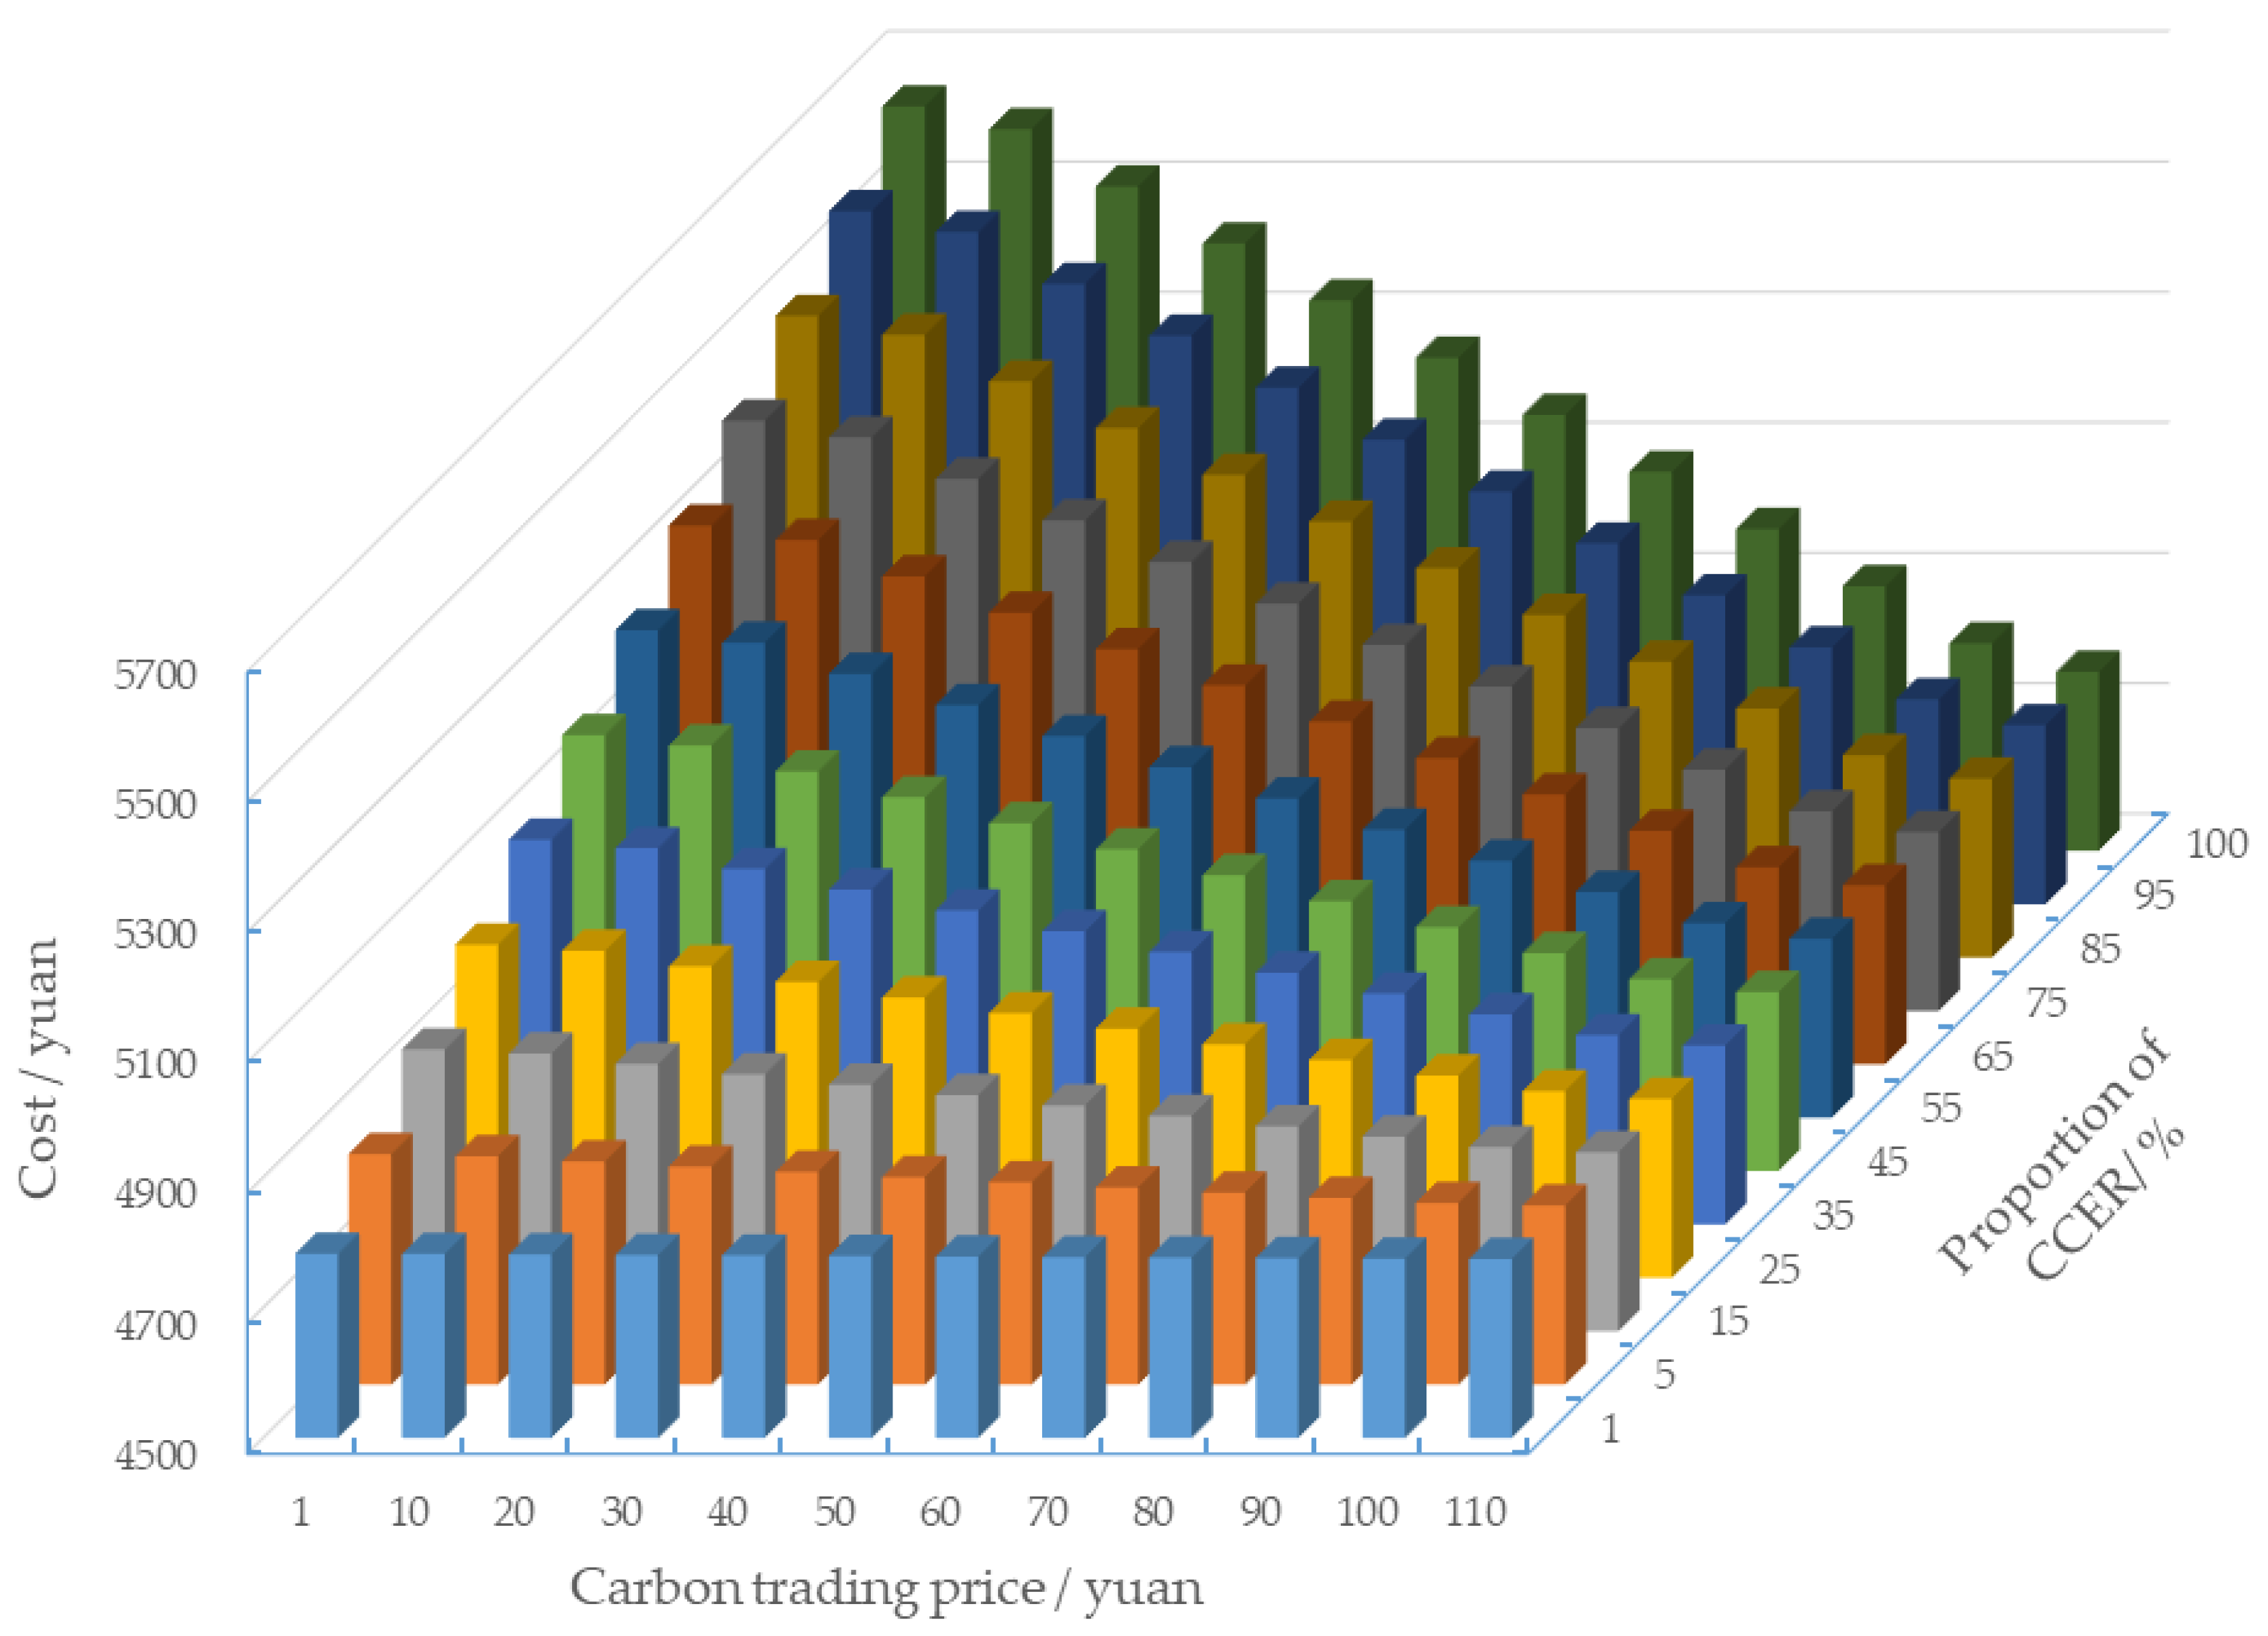
Sensitivity Analysis under the Constraints of Carbon Emissions Trading

In this case, the total cost of the system is affected by the carbon trading price and the offset proportion of CCER, illustrated by Figure 7.
According to Figure 7, the lower the CCER offset proportion is, the higher the carbon transaction price and the total cost of the system are. When the carbon trading price remains unchanged, the lower the CCER offset proportion is, the higher the total system cost is. When the CCER offset proportion remains unchanged, the higher the carbon trading price is, the higher the total cost of the system is. However, when the CCER offset proportion is close to 100%, the total cost of the system remains almost unchanged at different carbon trading prices because the CCER offset amount is close to the carbon emission and carbon neutralization is realized within the integrated energy system.
Therefore, the cost will be reduced through the promotion of CCER offset proportion by forestry carbon sequestration projects and methane utilization projects and so on.
The rate of cost volatility is introduced to better compare the impact of renewable power trading and carbon emission trading on the total cost of the system as follows:
τ = 2 × ( F max F min ) F max + F min
where τ is the rate of cost volatility. F max and F min are the maximum and minimum cost, respectively.
The sensitivity analysis under the constraints of the responsibility of renewable energy consumption shows that the rate of cost volatility is about 95%. Moreover, the rate of cost volatility is about 17% under the constraint of carbon emission trading. Therefore, it can be concluded that the responsibility of renewable energy consumption has a greater impact on the system cost.

5. Conclusions

This study investigated the optimization operation model of the integrated energy system. The most noteworthy findings of this study can be summarized as follows:
  • An optimization operation model of integrated energy system is proposed in this paper. In this regard, the impact of the responsibility of renewable energy consumption, green certificate trading, carbon emission trading, and CCER was deployed. Under the constraints of renewable power consumption and carbon emission trading, the model can meet the needs of multiple loads, and in the meantime, it reduces the operation cost of the system;
  • Compared with the model without considering the responsibility of renewable energy consumption, green certificate trading, the optimized model proposed in this paper could reduce the operation cost of the system by changing the output proportion of different equipment and get additional benefits from green certificate trading and CCER converted according to the renewable energy;
  • The operation cost of the integrated energy system is more sensitive to the constraints of the responsibility of renewable energy consumption than that of carbon emission trading.
  • The integrated energy system can effectively improve the efficiency of multi energy and reduce the cost of the system, which is the general trend of the energy system in the future.
China has put forward the energy development strategy of carbon peak and carbon neutralization. Moreover, a distribution network with high proportion of renewable energy is the key access to the energy development of the integrated energy system. The impact of responsibility of renewable energy consumption, green certificate trading, carbon emission trading, and CCER is introduced in this paper, which provide a reference for the integrated energy system planning. Moreover, the issue of regional integrated energy system concerns territory, urbanization and suburbanization, settlement, sustainable development. There are specific analyses on these issues that were out of the scope of this paper.

Author Contributions

Conceptualization, F.L. and S.L.; methodology, F.L.; software, F.L., S.L., C.C. and J.F.; validation, F.L., S.L.; formal analysis, C.C. and J.F.; investigation, F.L. and J.F.; resources, F.L.; data curation, C.C. and F.L.; writing—original draft preparation, C.C.; writing—review and editing, F.L., S.L., C.C. and J.F.; visualization, F.L. and J.F.; supervision, F.L.; project administration, F.L. All authors have read and agreed to the published version of the manuscript.

Funding

This research was supported in part by the project “R & D and application to industry of medium voltage UPS of high reliability flywheel energy storage” under grant cstc2019jscx-mbdxX0017 and the project “Key technologies and demonstration application of distributed renewable energy supply system” under grant cstc2017rgzn-zdyfX0030.

Data Availability Statement

The data presented in this study are available on request from the corresponding author.

Conflicts of Interest

The authors declare no conflict of interest.

References

  1. National Development and Reform Commission (NDRC). The National Energy Administration of China. Guiding Opinions on Promoting the Source-Grid-Load-Storage Integration System and the Complementarity Development of Multi-Energy. Available online: https://www.ndrc.gov.cn/xxgk/zcfb/ghxwj/202103/t20210305_1269046.html?code=&state=123 (accessed on 1 September 2021).
  2. Xi, J. Statement by Xi Jinping at the General Debate of the 75th Session of the United Nations General Assembly. Available online: http://www.gov.cn/xinwen/2020-09/22/content_5546168.htm (accessed on 1 September 2021).
  3. Ministry of Ecology and Environment of the People’s Republic of China. Interim Rules for Carbon Emissions Trading Management. Available online: https://www.mee.gov.cn/xxgk2018/xxgk/xxgk02/202101/t20210105_816131.html (accessed on 1 September 2021).
  4. National Development and Reform Commission (NDRC). The National Energy Administration of China. Notice on the Responsibility of Renewable Energy Consumption and Related Matters in 2021. Available online: https://www.ndrc.gov.cn/xwdt/tzgg/202105/t20210525_1280790.html?code=&state=123 (accessed on 1 September 2021).
  5. Shao, C.; Ding, Y.; Wang, J. Modeling and integration of flexible demand in heat and electricity integrated energy system. IEEE Trans. Sustain. Energy 2017, 99, 141. [Google Scholar]
  6. Soheyli, S.; Mayam, M.H.S.; Mehrjoo, M. Modeling a novel CCHP system including solar and wind renewable energy resources and sizing by a CC-MOPSO algorithm. Appl. Energy 2016, 184, 375–395. [Google Scholar] [CrossRef]
  7. Pan, H.; Liang, Z.; Xiao, Y. Optimal operation of regional integrated energy system under multiple scenes. Acta Energ. Sol. Sin. 2021, 42, 484–492. [Google Scholar]
  8. Zhang, T.; Guo, Y.; Li, Y.; Yu, L.; Zhang, J. Optimization scheduling of regional integrated energy systems based on electric-thermal-gas integrated demand response. Power Syst. Prot. Control 2021, 49, 52–61. [Google Scholar]
  9. Cao, Y.; Guo, X.; Dong, H.; Wang, L.; Zeng, M. Operation optimization of regional integrated energy system under the responsibility of renewable energy consumption. J. North China Electr. Power Univ. 2021, 11, 1007–2691. [Google Scholar]
  10. Luo, Z.; Qin, J.; Liang, J.; Zhao, M.; Wang, H.; Liu, K. Operation Optimization of Integrated Energy System with Green Certificate Cross-chain Transaction. Power Syst. Technol. 2021, 2, 1–11. [Google Scholar]
  11. Zhang, G.; Zhang, F.; Zhang, L.; Liang, J.; Han, X.; Yang, Y. Two-stage Robust Optimization Model of Day-ahead Scheduling Considering Carbon Emissions Trading. Proc. CSEE 2018, 38, 5490–5499. [Google Scholar]
Figure 1. Structure diagram of the integrated energy system.
Electronics 10 02677 g001
Figure 2. The power output on the electric bus before and after optimization: (a) before optimization; (b) after optimization.
Electronics 10 02677 g002aElectronics 10 02677 g002b
Figure 3. The power output on the electric bus before and after optimization: (a) before optimization; (b) after optimization.
Electronics 10 02677 g003
Figure 4. The power output on the electric bus before and after optimization: (a) before optimization; (b) after optimization.
Electronics 10 02677 g004aElectronics 10 02677 g004b
Figure 5. Cost comparison chart.
Electronics 10 02677 g005
Figure 6. Cost comparison under different green certificate prices and different proportion of the responsibility of renewable energy consumption.
Electronics 10 02677 g006
Figure 7. Total system cost under different carbon trading prices and CCER proportion.
Electronics 10 02677 g007
Table 1. Electricity purchase and sale price in different periods.
Time PeriodPeakPlainValley
Time8:00–11:00, 13:00–15:00, 18:00–21:006:00–8:00, 11:00–13:00, 15:00–18:00, 21:00–22:000:00–6:00, 22:00–0:00
Buy1.0210.5930.298
Sale0.980.50.298
Table 2. Parameters of equipment.
EquipmentAmountParametersUnitEquipmentParametersUnitAmount
Maximum power output of PV50PPVkWEfficiency of gas boilerλGB%73
Maximum power output of WT50PWTkWEfficiency of heat recoveryλREC%90
Maximum output of Gas turbine60PMTkWEfficiency of electric heaterλEH%300
Maximum power of heat recovery steam generator100PRECkWMaintenance cost of PVCPVCNY/kW0.029
Maximum power of gas boiler90PGBkWMaintenance cost of WTCWTCNY/kW0.025
Maximum power of absorption chiller90PACkWMaintenance cost of gas turbineCMTCNY/kW0.025
Maximum power of electric chiller80PECkWMaintenance cost of electric storageCESCNY/kW0.028
Maximum power of electric heater100PEHkWMaintenance cost of thermal storageCEHCNY/kW0.016
Efficiency of gas turbine30λMT%Maintenance cost of cold storageCECCNY/kW0.018
Efficiency of electric chiller300λEC%Downhill output of gas turbineIMT,downkW30
Efficiency of absorption chiller120λAC%Uphill output of gas turbineIMT,upkW-30
Table 3. Offset of CCER.
Time PeriodActual AmountOffset Amount of CCERSettle Amount
Carbon emission7962.24398.117564.13
Cost of carbon emission397.9519.91378.05
Publisher’s Note: MDPI stays neutral with regard to jurisdictional claims in published maps and institutional affiliations.

