1. Introduction
The past few decades have witnessed an uprising in technological advances and the emergence of industry 4.0, the reliability of industrial cyber-physical systems (ICPSs) becomes even more in demand [
1]. While artificial intelligence (AI) remains the state-of-art alternative for most reliability solutions, predictive maintenance (PdM) becomes even more patronized than the traditional routine-based methods considering that recent solutions in the domain rely on the use of statistical principles on sensor data and AI-based methodologies for decision making [
2].
Equipment/component condition monitoring under condition-based maintenance (CBM) schemes offers significant benefits ranging from reduced costs, uptime improvement, and downtime reduction. The availability of (and durability) of data-driven approaches to CBM has shown profound successes in recent times; yet, attaining a global paradigm for its use remains open for investigation, criticisms, improvements, and hopefully, generality [
3]. On the bright side, recent studies [
4,
5] suggest that the use of multiple parameters (sensor measurements, features, etc.) for condition monitoring better provides a more reliable standpoint for diagnostic/FDI evaluations when compared with single parameters. Particularly for electronic components, because of their comparatively higher delicate nature (when compared with mechanical equipment/systems), the ability to predict failure at an early stage is crucial. In addition, ensuring their successful and long-term operation becomes even more crucial for increased profit, utility, and consumer satisfaction [
6]. Consequently, appropriately exploiting reflective parameters from these electronic components becomes necessary.
Power electronic devices are made up of separate components and modules that are subjected to thermal, chemical, electrical, and mechanical stressors, eventually leading to catastrophic failure. Various research has divided power electronics failure mechanisms into two categories: chip-related and packaged-related failures. Electrical over-stress, either by high voltage or high current, is the most popular trigger of chip failure, whereas thermal stress is the most common cause of packed device failure [
7,
8]. Numerous electrical parameters and ambient variables influence the operational characteristics of electronic components and devices, resulting in abrupt/uncertain failures before the intended lifetime, as indicated in the datasheet [
9]. Particularly for electronic components, environmental factors affect their durability. For instance, according to [
6], temperature changes has a 45% impact on the performance and longevity of electronic components, whereas vibration, humidity, dust, and stress all have a 20%, 19%, 6%, and 10% impact on the performance and longevity of electronic components respectively. Needless to say, uncertain factors also contribute marginally to most electronic component failures; hence the need for reliable multi-variable condition monitoring systems [
1,
2,
4].
Electrical signature analysis (ESA) is one of the major techniques which is centered on the evaluation of the electrical signals of power electronics using signal processing methods for the discovery of, and evaluation of transient and spectral behaviors in the components. In this domain, current signature analysis (CSA), voltage signature analysis (VSA), and extended park’s vector approach (EPVA) are quite popular and with appropriate methodologies, they can be integrated with an even more reliable ESA-based condition monitoring framework [
10,
11]. The idea and major intrigue ESA posses are in identifying faults in electrical systems by monitoring the frequency components during the healthy and faulty stage [
12]. Feature and usage-based diagnostics and prognostics for electronic systems can be utilized by finding essential diagnostic parameters that coincide with failure progression and recognized failure models. To provide collective proof of a worsening or deteriorating condition, collected features can be identified, evaluated, and exploited for data-driven (AI-based) FDI [
10,
13,
14]. From a realistic perspective, the complexity of electronic data, the vast number of parameters, conflicting failure mechanisms, and the prevalence of intermittent faults and failures make health management and assessment of electronic systems a difficult task. This makes it even more beneficial to exploit as many measurements (and features) as possible under a comprehensive framework to ensure that not only are optimal parameters are identified, but also, properly harnessed. This is especially true when working with complicated electrical systems, where different parameters (like the voltage, resistance, capacitance, etc.) reflect component conditions uniquely [
15].
In this paper, we have been able to physically simulate loaded conditions for an SMPS device and proposed an integrated framework for condition monitoring. The proposed framework exploits statistical features from current and voltage signatures simultaneously and a machine learning model for FDI. Arguably, the efficiencies of time-frequency-domain feature extraction over the stand-alone time-domain or frequency-domain feature extraction methods are quite impressive; however, considering their relatively higher computational costs and peculiarity for vibration monitoring, the less computationally expensive technique—time-domain feature extraction provides a cost-efficient and reliable feature extraction method [
4]. To achieve a more reliable diagnosis using these time-dependent signal processing methods, it is often wiser to explore as many features as possible to acquire a more diversified representation of the components. This provides an abundance of features to select from based on discriminance and salience using any (or a combination) of the numerous filter-based, wrapper-based, and/or hybrid feature selection methods available for exploration. Particularly for cost-aware systems, filter-based methods offer ease-of-use, high efficiency, fair reliability, and unbiasedness (considering that their functionality are purely unsupervised). Furthermore, considering the integrated dual monitoring process (voltage and current), the rationale for cost efficiency becomes even more important.
The rest of the paper is structured thus:
Section 2 presents the motivation for the study and relevant literature review while
Section 3 summarizes the theoretical background of the constituent modules in the proposed study.
Section 4 presents the proposed diagnostics framework while
Section 5 presents the experimental validation of the proposed framework using ML-based classification algorithms (chosen based on experience-based knowledge and predictive capacity).
Section 6 discusses the inherent experimental results and lastly,
Section 7 presents a conclusion that helps to foster future research directions.
2. Motivation and Literature Overview
The working principle of a linear power supply denotes that for an output voltage to be achieved, the power circuits require a primary capacitor, a secondary capacitor, and more or fewer feedback resistors. Unlike the more common switched-mode power supplies (SMPS), which have replaced the classic linear-type AC with DC power supplies, reduced power consumption, heat dissipation, size, and lighter weight are some of the advantages of the switched-mode over the linear power supply. Most PCs, amplifiers, televisions, motor drives, and other electronic devices are presently set up with a power supply mechanism. More emphatically, the main advantage of an SMPS over a typical linear regulator is its better efficiency, which is obtained via a powerful internal switching device such as a transistor, power metal-oxide-semiconductor field-effect transistor (MOSFET), or Schottky diode.
Most often, a power supply like other sensitive electronic systems is designed to operate continuously, exposing it to a variety of failure mechanisms such as electrical stress, overuse/under-use, ambient conditions, and so on. As a result, real-time condition monitoring of the power supply is essential for accurate predictive maintenance. The switching transistor, whose role is to provide a high alternating voltage for the transformer, is one of the most critical risk-prone components following a failure mode effect analysis (FMEA) [
16]. This hints at an increased need for ensuring that the SMPS operates under the recommended specifications to avoid unforeseen failure. On the brighter side, condition monitoring offers a cost-effective solution for controlled and uninterrupted functioning [
14].
Several methods have been employed in the past for SMPS condition monitoring with reliable successes. Most traditional methods typically exploit the transient and/or spectral information in electrical signatures using domain knowledge guided by an understanding of the equipment’s physics-of-failure (PoF) [
17]. On the other hand, state-of-the-art methods exploit the efficiencies of AI techniques over PoF models especially for systems with a significant level of uncertainty. For instance, the wavelet-based analytical model developed in [
18] for fault direction identification in relay agents uses the wavelet coefficient of measured line currents. Although the results validate the model’s strengths through a simulation of a benchmark medium-voltage distribution system, the proposed analytical model lacks strong conviction for physical systems with significant uncertainty levels. In a different study [
19], the authors proposed a fault diagnosis and reconfiguration method for 3-phase interleaved buck converters based on the output voltage for diagnosing open-circuit faults. The experimental evaluations on a hardware-in-the-loop test platform reveal high-speed computation efficiencies, ease-of-use, and high accuracy; however, the approach functions under ideal theoretical assumptions on VSA only. Another study took a different approach by exploring CSA methods. A hybrid grid system that contains a basic power supply was developed to achieve a fast switching fault diagnosis utilizing an instantaneous phase current [
20].
Beyond ESA methods, other variables like temperature also provide reliable condition capabilities. In [
8], a thermal approach was used to check for degradation of the semiconductors which was subjected to thermal aging. The major impression that inspires the author of this paper is the structure of the vigorous diagnostic that allows for a packaged device of mostly electronics devices to be monitored under severe environmental conditions. In another study, as part of an incorporated methodology to power supply health management, a statistical consistency model, failure process analysis, enhanced aging, feature classification, sensor-based condition monitoring, and pattern recognition algorithms were given in [
21]. Therein, the most common failure causes for SMPSs were found to be MOSFETs, IGBTs, and Schottky diodes with Time-dependent dielectric breakdown (TDDB) and the activation of parasitic structure using physics of failure analysis [
22].
From a broader perspective, the authors believe that exploiting multiple parameters in a comprehensive framework would offer better reliable condition monitoring efficiencies since the efficiencies of one variable (VSA for instance) would complement the limitations of the other (CSA for instance). In this light, this study makes the following contributions:
An integrated dual monitoring approach for SMPS switching devices is proposed. The model combines voltage and current signatures to achieve a more comprehensive condition monitoring framework for system fault diagnosis based on electrical stress.
The proposed model considers cost-awareness by extracting statistical features from the electrical signals. Considering the computational costs associated with the most advanced signal processing techniques and the need for a dual feature extraction process (from current and voltage signals), the statistical feature extraction process offers a cost-efficient (yet highly reliable) alternative. The cost efficiency is further supported by a high-threshold correlation-based feature selection module for improved condition monitoring.
Against the limitations of traditional analytical methods, the proposed model exploits the efficiencies of AI-based models for diagnosis. An exploratory comparison is presented between the employed ML-based classifiers and their performances assessed from different empirical standpoints.
3. Theoretical Review
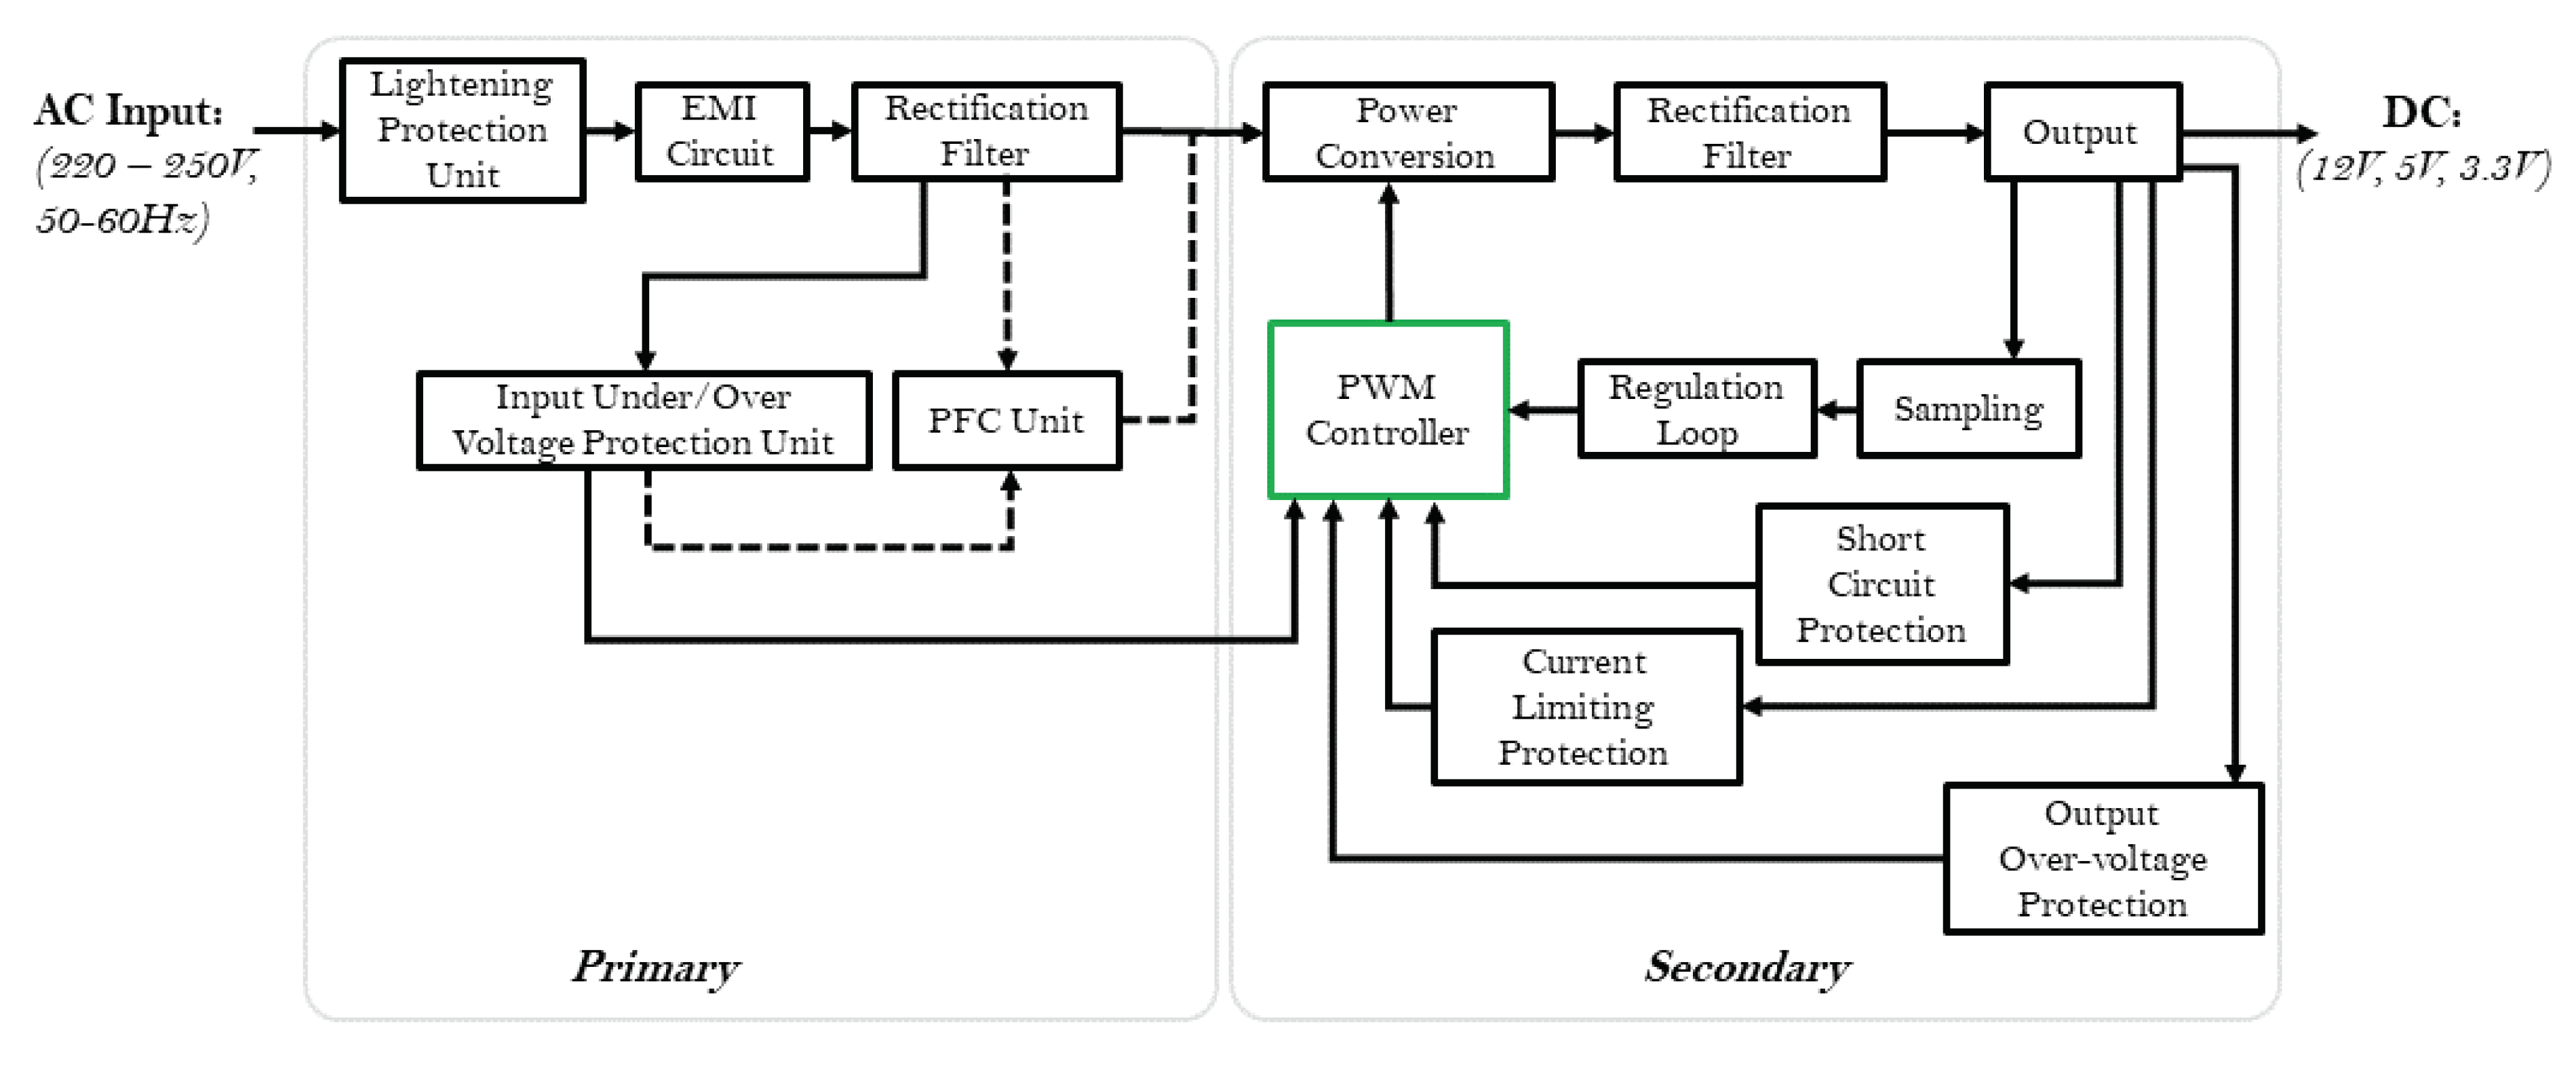
3.1. AC–DC Switched Mode Power Supply
Ideally, an AC–DC SMPS converts AC power from the primary section to lower voltage DC power in the secondary section. Despite the fluctuations in the supply, it provides reliable DC output by regulating electric power. This is attributed to the voltage-controlled devices which form a major part of its functionality. Although diverse unique designs and configurations abound in the market, most SMPS devices are composed of an input electromagnetic interference filter (EMI), a rectification and filtering circuit, a power conversion circuit, a pulse width modulation (PWM) controller circuit, and an output rectification and filtering circuit [
23].
Figure 1 illustrates a typical AC-DC SMPS configuration and the functional connections between/amongst them.
As shown, the SMPS receives AC power (220–250 V, 50–60 Hz) at the EMI whose main function is to suppresses the electromagnetic noise and clutter signals of the input power source to prevent interference to the power supply. It also suppresses high-frequency clutter generated by the SMPS itself from interfering with the power grid. This is supported by the lightning protection unit (which consists of varistors) that impedes the increased voltage effect caused by lightning.
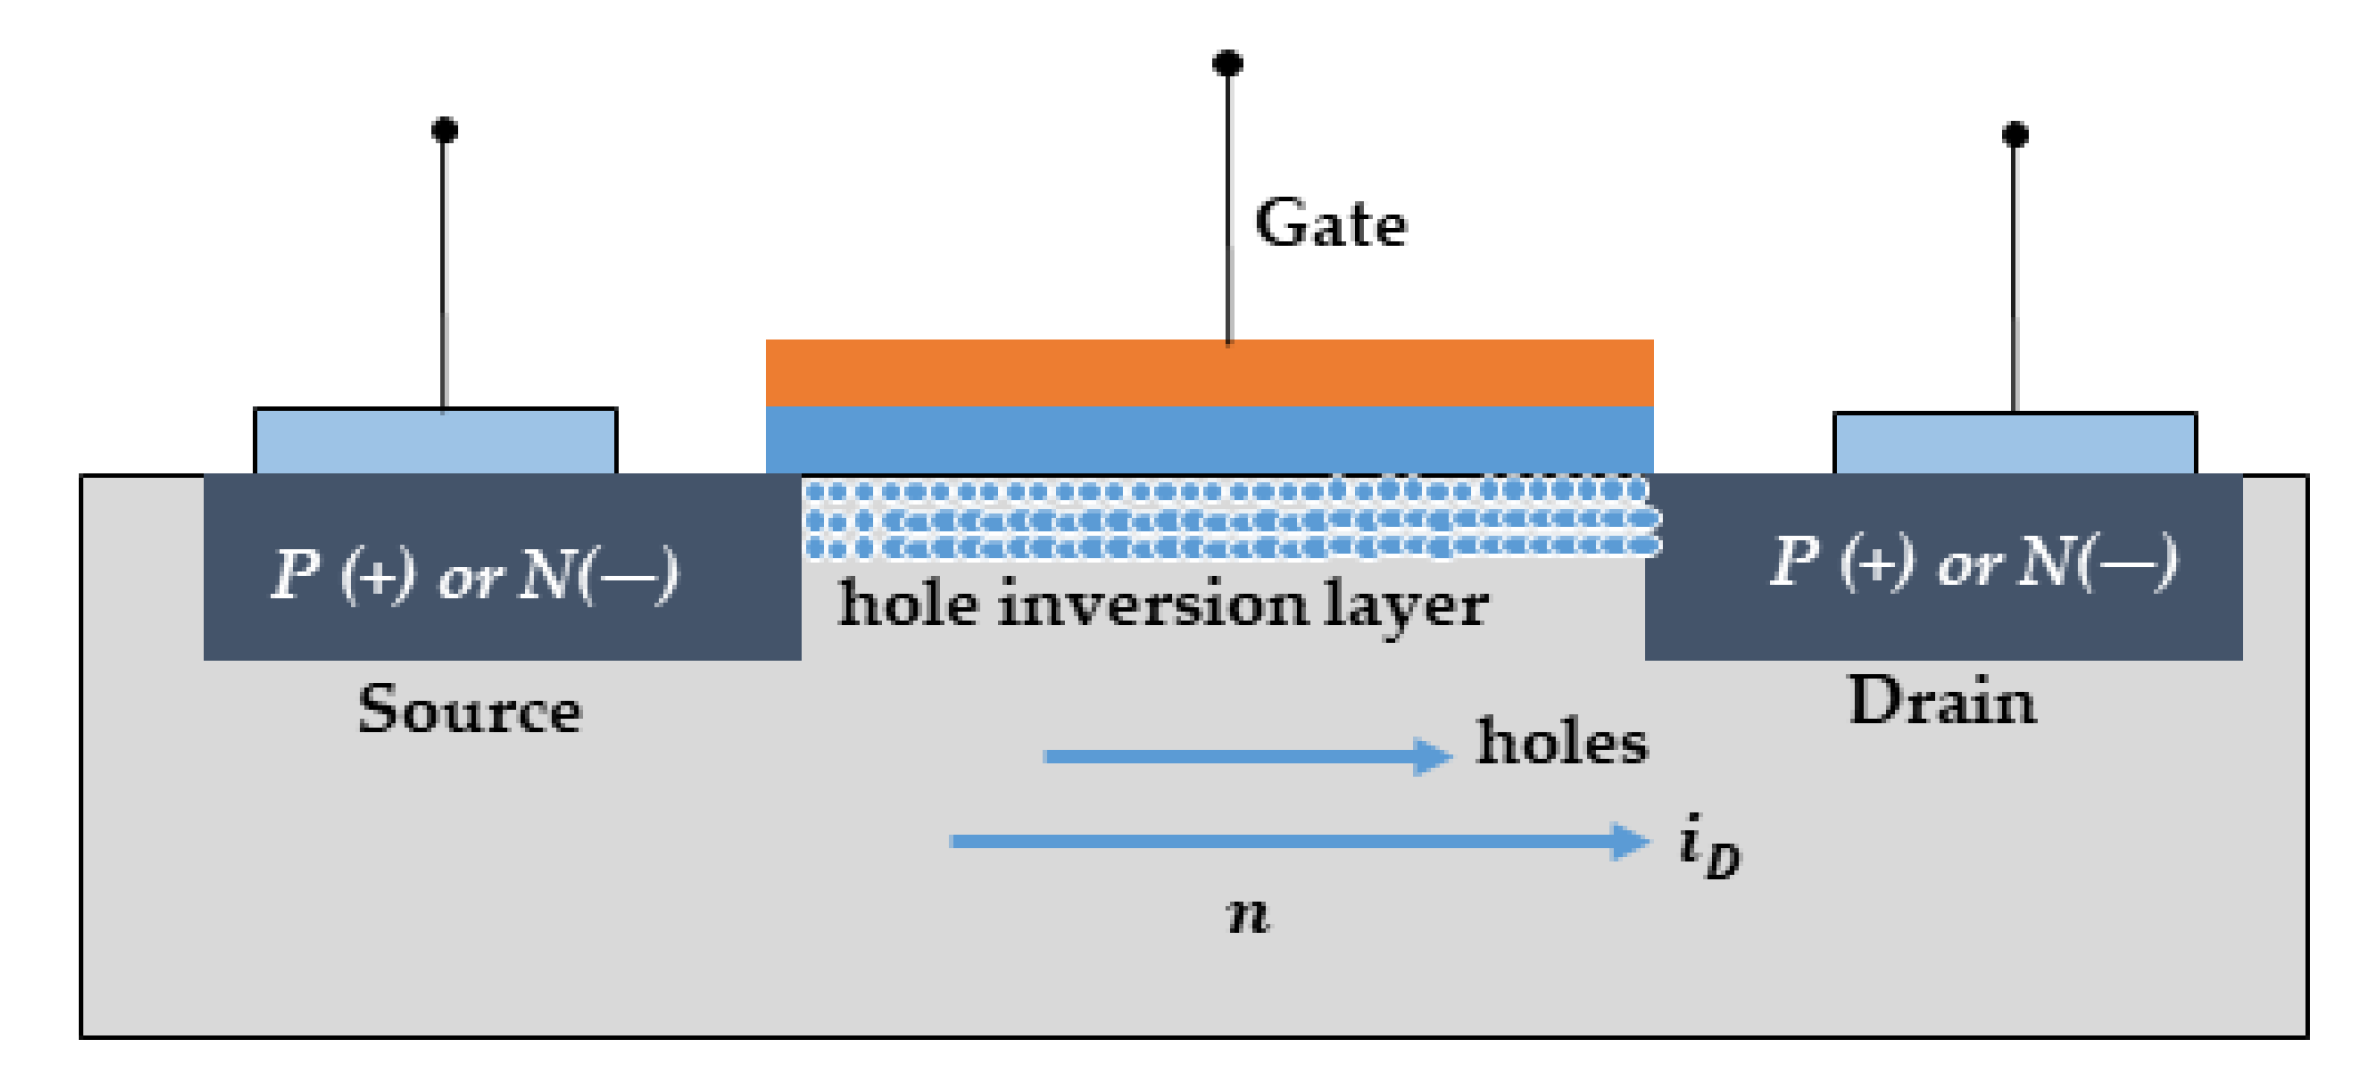
The rectification filter unit then rectifies (and filters) the AC voltage to obtain a relatively pure DC voltage with the aid of a capacitor. Next, the harmonic filter power factor correction (PFC) with the help of the input voltage protection unit provides automatic line-voltage adjustment, improves AC mains power quality in medium- and high-power applications, and stabilizes the SMPS bulk bus voltage. These features, in turn, improve cost factors and the holdup time of the isolated PWM converter. Presently, the most widely used power conversion device for SMPS devices is the MOSFET (MOS transistor) and is probably the most critical component of most SMPS devices [
24]. As illustrated in
Figure 2, the two different types of MOSFETS—P and N-type are illustrated. Overall, MOSFETs are voltage-controlled devices that function by utilizing the magnitude of the gate-source voltage (
) to change the amount of induced charge on the semiconductor surface, thereby controlling the drain current (
) [
25].
Generally, the mode of operation of MOSFETS could either be a depletion type (P-channel) or enhancement type (N-channel) whereby enhancement types require the
to switch the device “OFF” as is the case with a normally closed switch while the reverse is the case for a depletion type. When a negative gate voltage is applied (with a positive source voltage (
)), the hole inversion layer is produced, allowing the current to flow to the drain to be turned on. On the other hand, when a positive gate voltage is applied (with a negative source voltage (
)), the device is turned on. Ideally, the
must be sufficient to drive the MOSFET into the ohmic zone and is expected to maintain a 12 V capacity. To provide a simpler illustration for understanding the modes of operation of the different types of MOSFETs,
Table 1 provides the criteria/condition which the P-Channel and N-Channel turn ON and OFF.
The simplicity in design of P-Channel MOSFETs is beneficial for low-voltage drive compact board applications where space is limited. Its simplified gate driving technique often reduces overall cost and is more preferred over the N-Channel MOSFETs.
3.2. Electrical Signature Analysis
Electrical stress on electronics, in general, can induce component degradation or catastrophic failure during operation or handling. As a result of improper device application or use, electrical over-stress can occur, leading to parametric dilapidation or catastrophic failure; however, during the transfer test of exposed electronics, improper handling and a lack of effective electrostatic discharge (ESD) shielding may result in electrostatic discharge (ESD). These stresses are often reflected as electrical signals which when properly harnessed, can provide distinctive information for condition assessments.
Often, time-domain and frequency-domain signal processing techniques provide underlying features that can be linked to varying component conditions. The frequency-domain outputs– spectra (or electrical fingerprints) often present component conditions in a range of characteristic frequencies with different magnitudes which change as the component condition changes [
26]; however, a major setback of this technique is that it functions on the assumption that the signals are stationary and requires a short period (a less than a second) of a signal for reliable analyses. These limitations render it less optimal for cases where fluctuations are witnessed in the electrical signals (high nonstationarity). In this case, exploiting time-domain statistical tools would provide superior efficiencies since they provide transient characteristics and are more cost-efficient. When certain faults occur, specific frequencies vary in magnitude. Fault patterns are frequency components that are elicited by each fault. They are largely determined by the machine’s line frequency and structural parameters [
13].
Arguably, time-frequency-domain signal processing techniques like a short-time Fourier transform (STFT), empirical mode decomposition (EMD), wavelet transform, mel frequency cepstral coefficients (MFCC), etc. offer superior efficiencies since they capture both transient and spectral characteristics; however, considering the high costs associated with them, their impact in the proposed study would only inhibit the cost awareness [
13]. For instance, the EMD functions on the basis of the exhaustive iteration process, the STFT requires an optimal choice of window function which is often an uphill task, the wavelet transform depends on the optimal choice of matching wavelet while MFCC’s efficiencies are preserved for low-frequency problems so maybe unfit for high-frequency fault detection or condition monitoring [
4].
3.3. Review of ML Algorithms
AI has become predominant across most disciplines owing to its superiority over traditional statistical model-based approaches. In the domain, recent research trends suggest the use of the more robust deep learning (DL)-based methods artificial neural networks (ANNs) over the more fundamental machine learning (ML) algorithms like K-Nearest Neighbor(KNN), gradient boosting classifier (GBC) Support Vector Machines (SVM), Random Forest (RF), Decision Tree (DT), multi-layer perceptron (MLP), etc. Although characterized with superior detection and predictive accuracy, these ANNs are still faced with interpretability challenges, excessive parameters dependence, demands big data, over-fitting/under-fitting issues, computational cost, and complexity [
2,
13,
27,
28]. On the bright side, ML algorithms are more interpretable, easy to use, efficient with little data, resource-friendly, and reliable given the right inputs [
2].
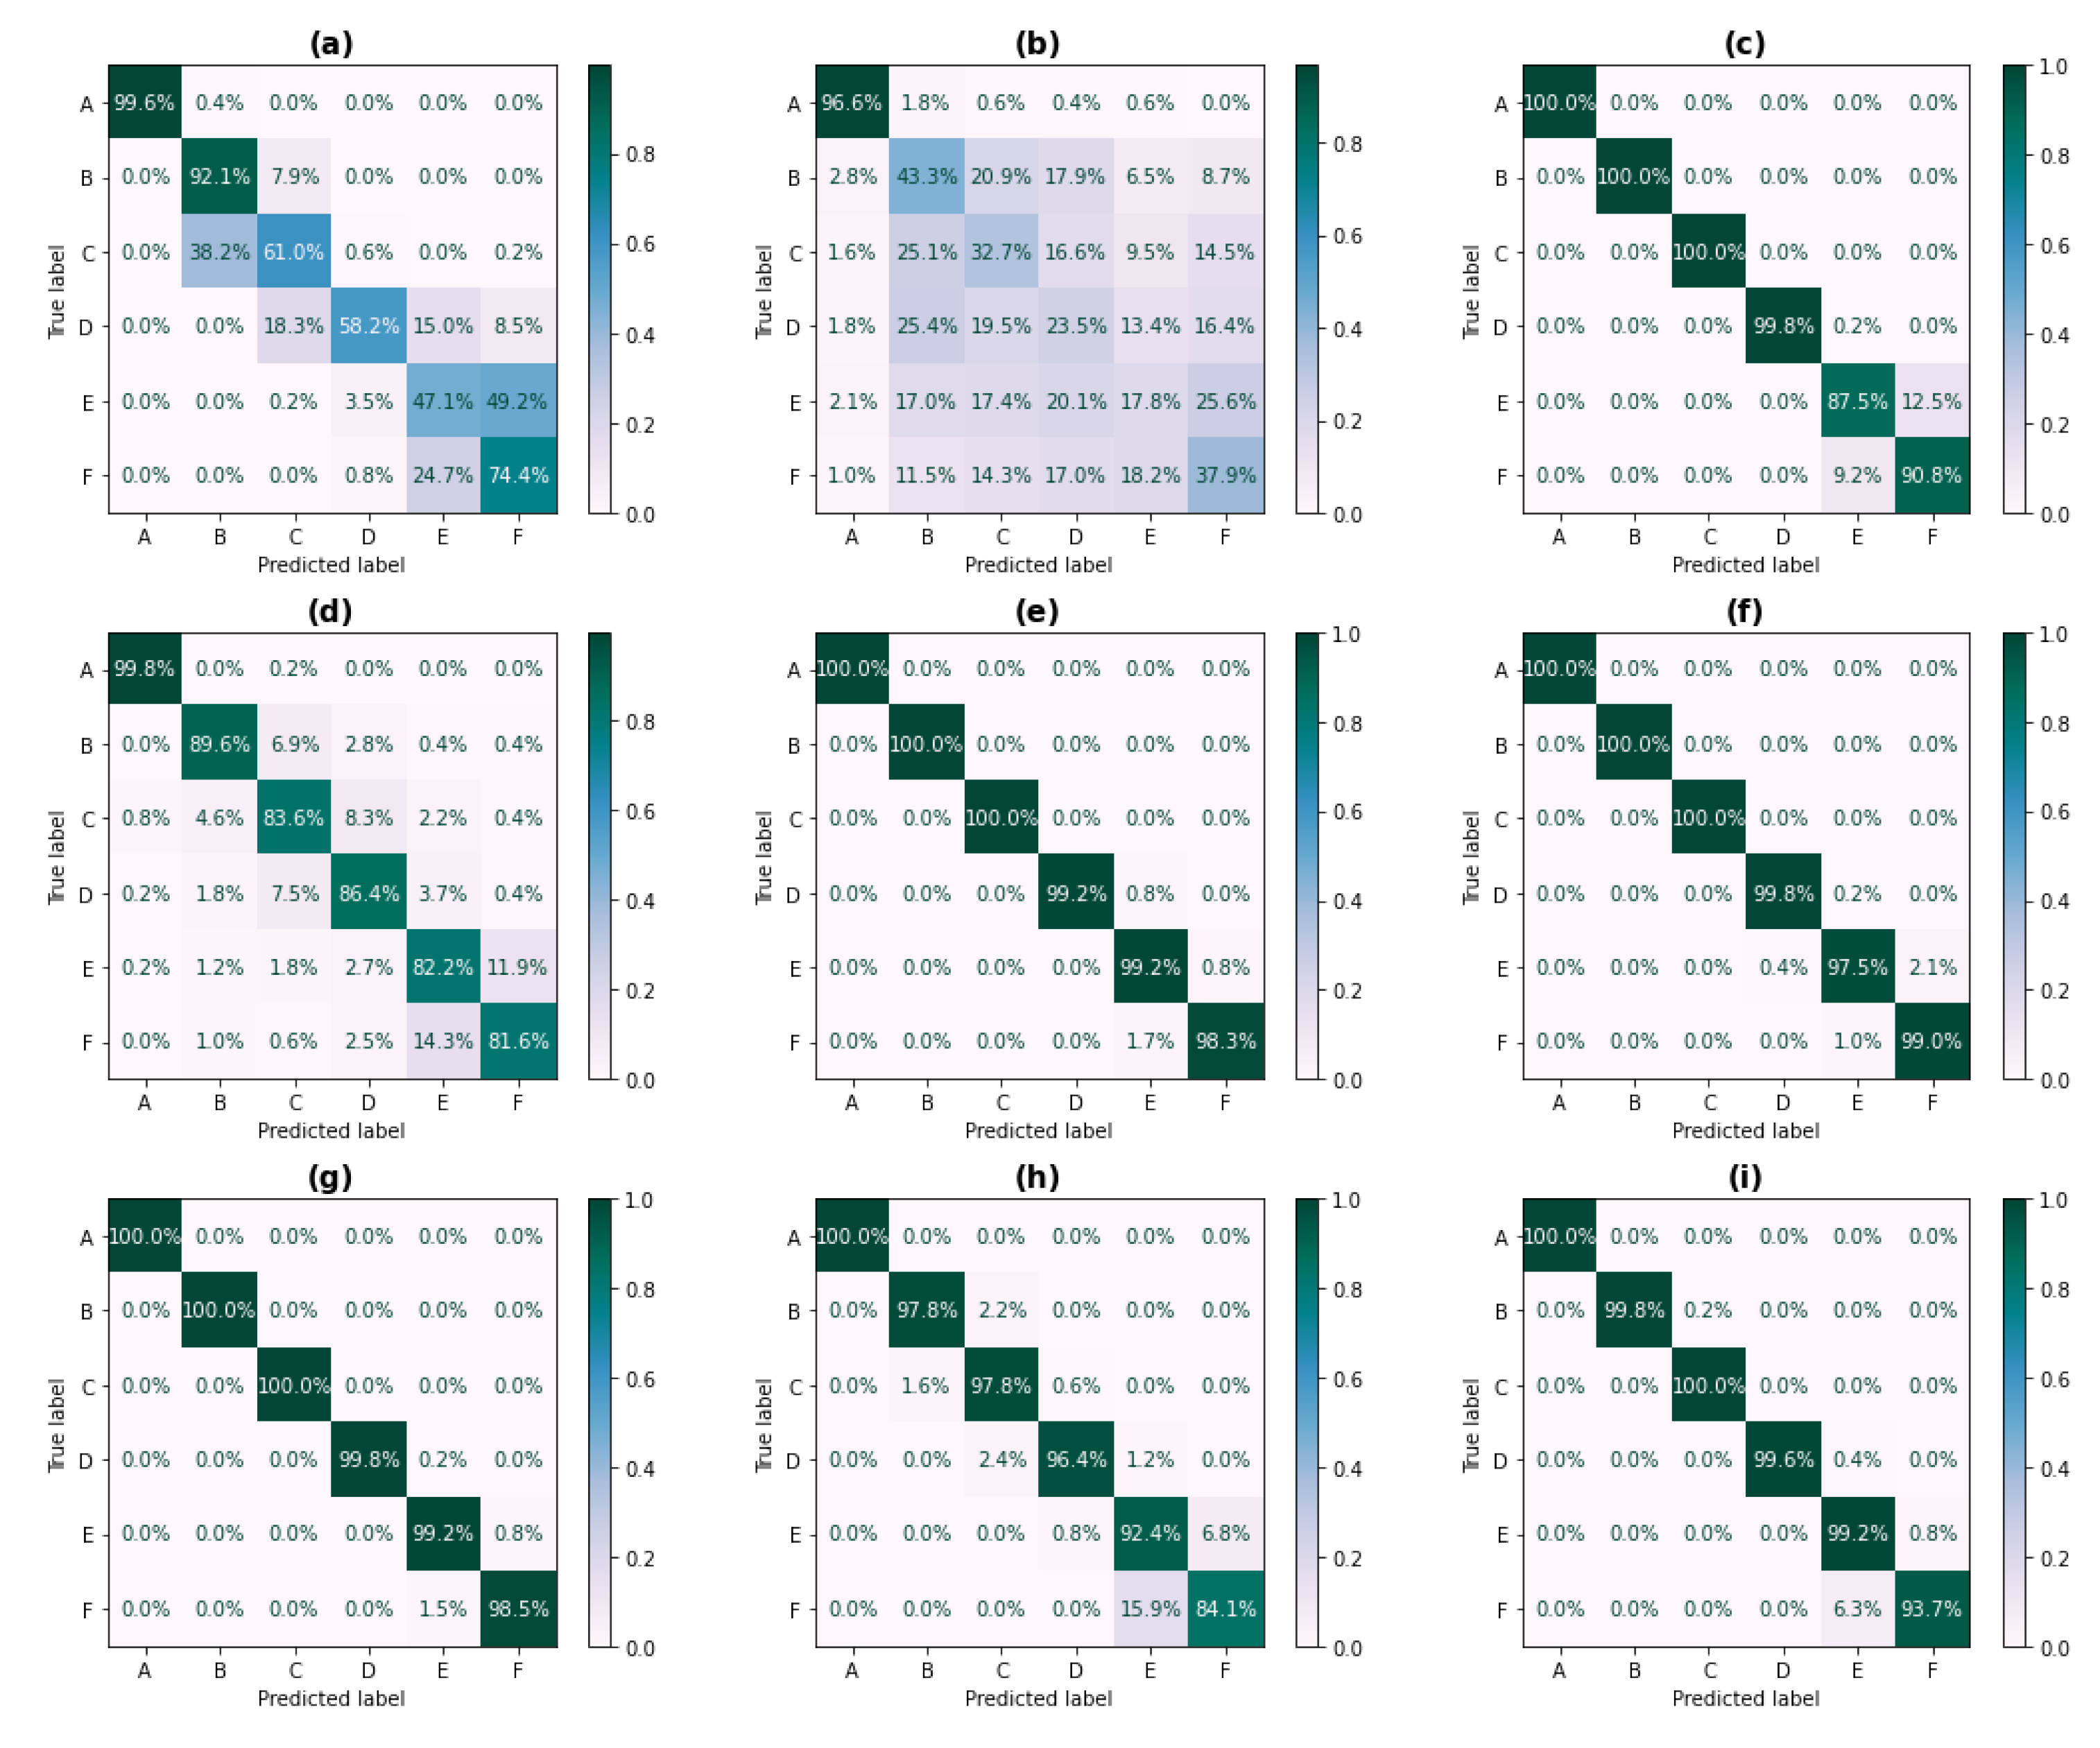
Numerous studies have proposed different improvements in these ML algorithms (and a hybrid combination of algorithms) with significant successes; however, each algorithm functions uniquely based on a set of pre-defined process rules. This makes their respective performance on a given set of inputs different, and with diverse parameter possibilities for each of them, achieving generality in their use still remains open for continued research. Notwithstanding, recent studies have observed some cost efficiency of these algorithms under ideal conditions with some concurrent inferences which provide leeway for choosing amongst them. For instance, contrary to the RF algorithm and GBC, the KNN and DT are popularly known for computational cost-friendliness given the same set of inputs. The SVM and MLP are often disfavoured due to the strenuous parameter search associated with its use.
In reality, it would be futile to explore all these algorithms (and their different architectures and variants) in this study. Notwithstanding, experience in the domain and supporting research [
4,
29] RF, GBC, KNN, and SVM are quite robust for most classification problems and are employed in this study.
4. Proposed Diagnostic Framework
The descriptive procedure for the diagnostic approach is shown in
Figure 3, whereby the model receives voltage and current signals from the data acquisition module. Overall, the proposed model consists of the following key modules—Two-way feature extraction, correlation-based feature selection, ML/DL-based diagnosis, and performance evaluation.
The voltage and current signals are simultaneously received by the model for a normalized feature extraction process. Particularly, the features summarized in
Table 2 are extracted from the signals via a windowing approach—using a window size of 0.1 s (100 samples), the signals were split into equally spaced series, and on each of these portions, the features were extracted.
It is common practice to capture as many features as possible [
30]. This ensures that the underlying characteristics in the signals are well represented from diverse perspectives while also capturing the time-dependent information in the signals. By doing so, necessary transient evaluations may be conducted (if the need arises). Overall, the statistical feature extraction process presented herein was motivated by the cost awareness of the system owing to the potential costs associated with the two-way feature extraction if other advanced frequency-domain and/or time-frequency-domain signal processing methods were employed.
In addition to the above rationale, combining the extracted features from the current and voltage signals constitutes a high-dimensional feature space which also has some similarities amongst the extracted variables. Ideally, ML-based classifiers flourish based on the discriminance in the provided inputs. This presents an opportunity for feature selection after which, only discriminant features are retained, the curse of dimensionality is significantly minimized, computational costs are reduced, and the diagnostic/FDI performance is improved. Consequently, the correlation-based method of feature selection is employed for feature selection. This simple but effective statistical test which was developed by Karl Pearson in 1911 [
31] is a measure for quantifying the linear dependence between two variables
X and
Y and has a range of
(negative correlation) and
(positive correlation). This is obtained using Equation (
1).
where
and
are the standard deviations of
X and
Y, respectively while
is the covariance.
The selected features are then received by the ML classifiers for training and testing on the training and test datasets, respectively. The overall performance(s) is(are) finally evaluated.
5. Experimental Setup and Signal Processing
This section presents the methods that have been deployed to acquiring data from the accelerated life test setup to aid the machine learning-based classification approach for system fault diagnosis. Accelerated aging techniques open up a slew of possibilities for equipment condition monitoring and degradation assessments. They, for instance, make it possible to assess reliability in a fraction of the time it takes to undertake long-term reliability studies. Notwithstanding the time efficiency associated with the technique, it necessitates knowledge of the degradation process, quantities of critical productivity variables, and noticeable parameters in the augmented aging procedure.
As shown in
Figure 4, the experimental setup consists of a DC load supply (PPL-8612c3, 150 V/60 A 300 W), the experimental case study—a 700 Watt SMSPS device (Hyper K Series/HP700S manufactured by FSP Group), and a NI 9174 DAQ device (affixed with NI 9221 and NI 9246 modules for acquiring voltage and current signals, respectively).
The DC load provides variable loading to the SMPS while the current and voltage signals are simultaneously acquired from the MOSFET terminals on the PCB. The cases study houses four (4) MOSFETS with a maximum root mean square voltage (
) of 31 V connected in parallel. Consequently, the current and voltage signals are then digitally collected from one of the MOSFET’s terminals respectively by soldering two different pairs of wires to the terminals (each pair for the current and voltage signals respectively) while the other ends of the soldered wires are connected to the NI 9228 and NI 9246 modules respectively (see
Figure 4). Digital data collection was done using a desktop computer with the aid of LabVIEW software at a sampling rate of 1KHz. The variable loading conditions are summarised in
Table 3.
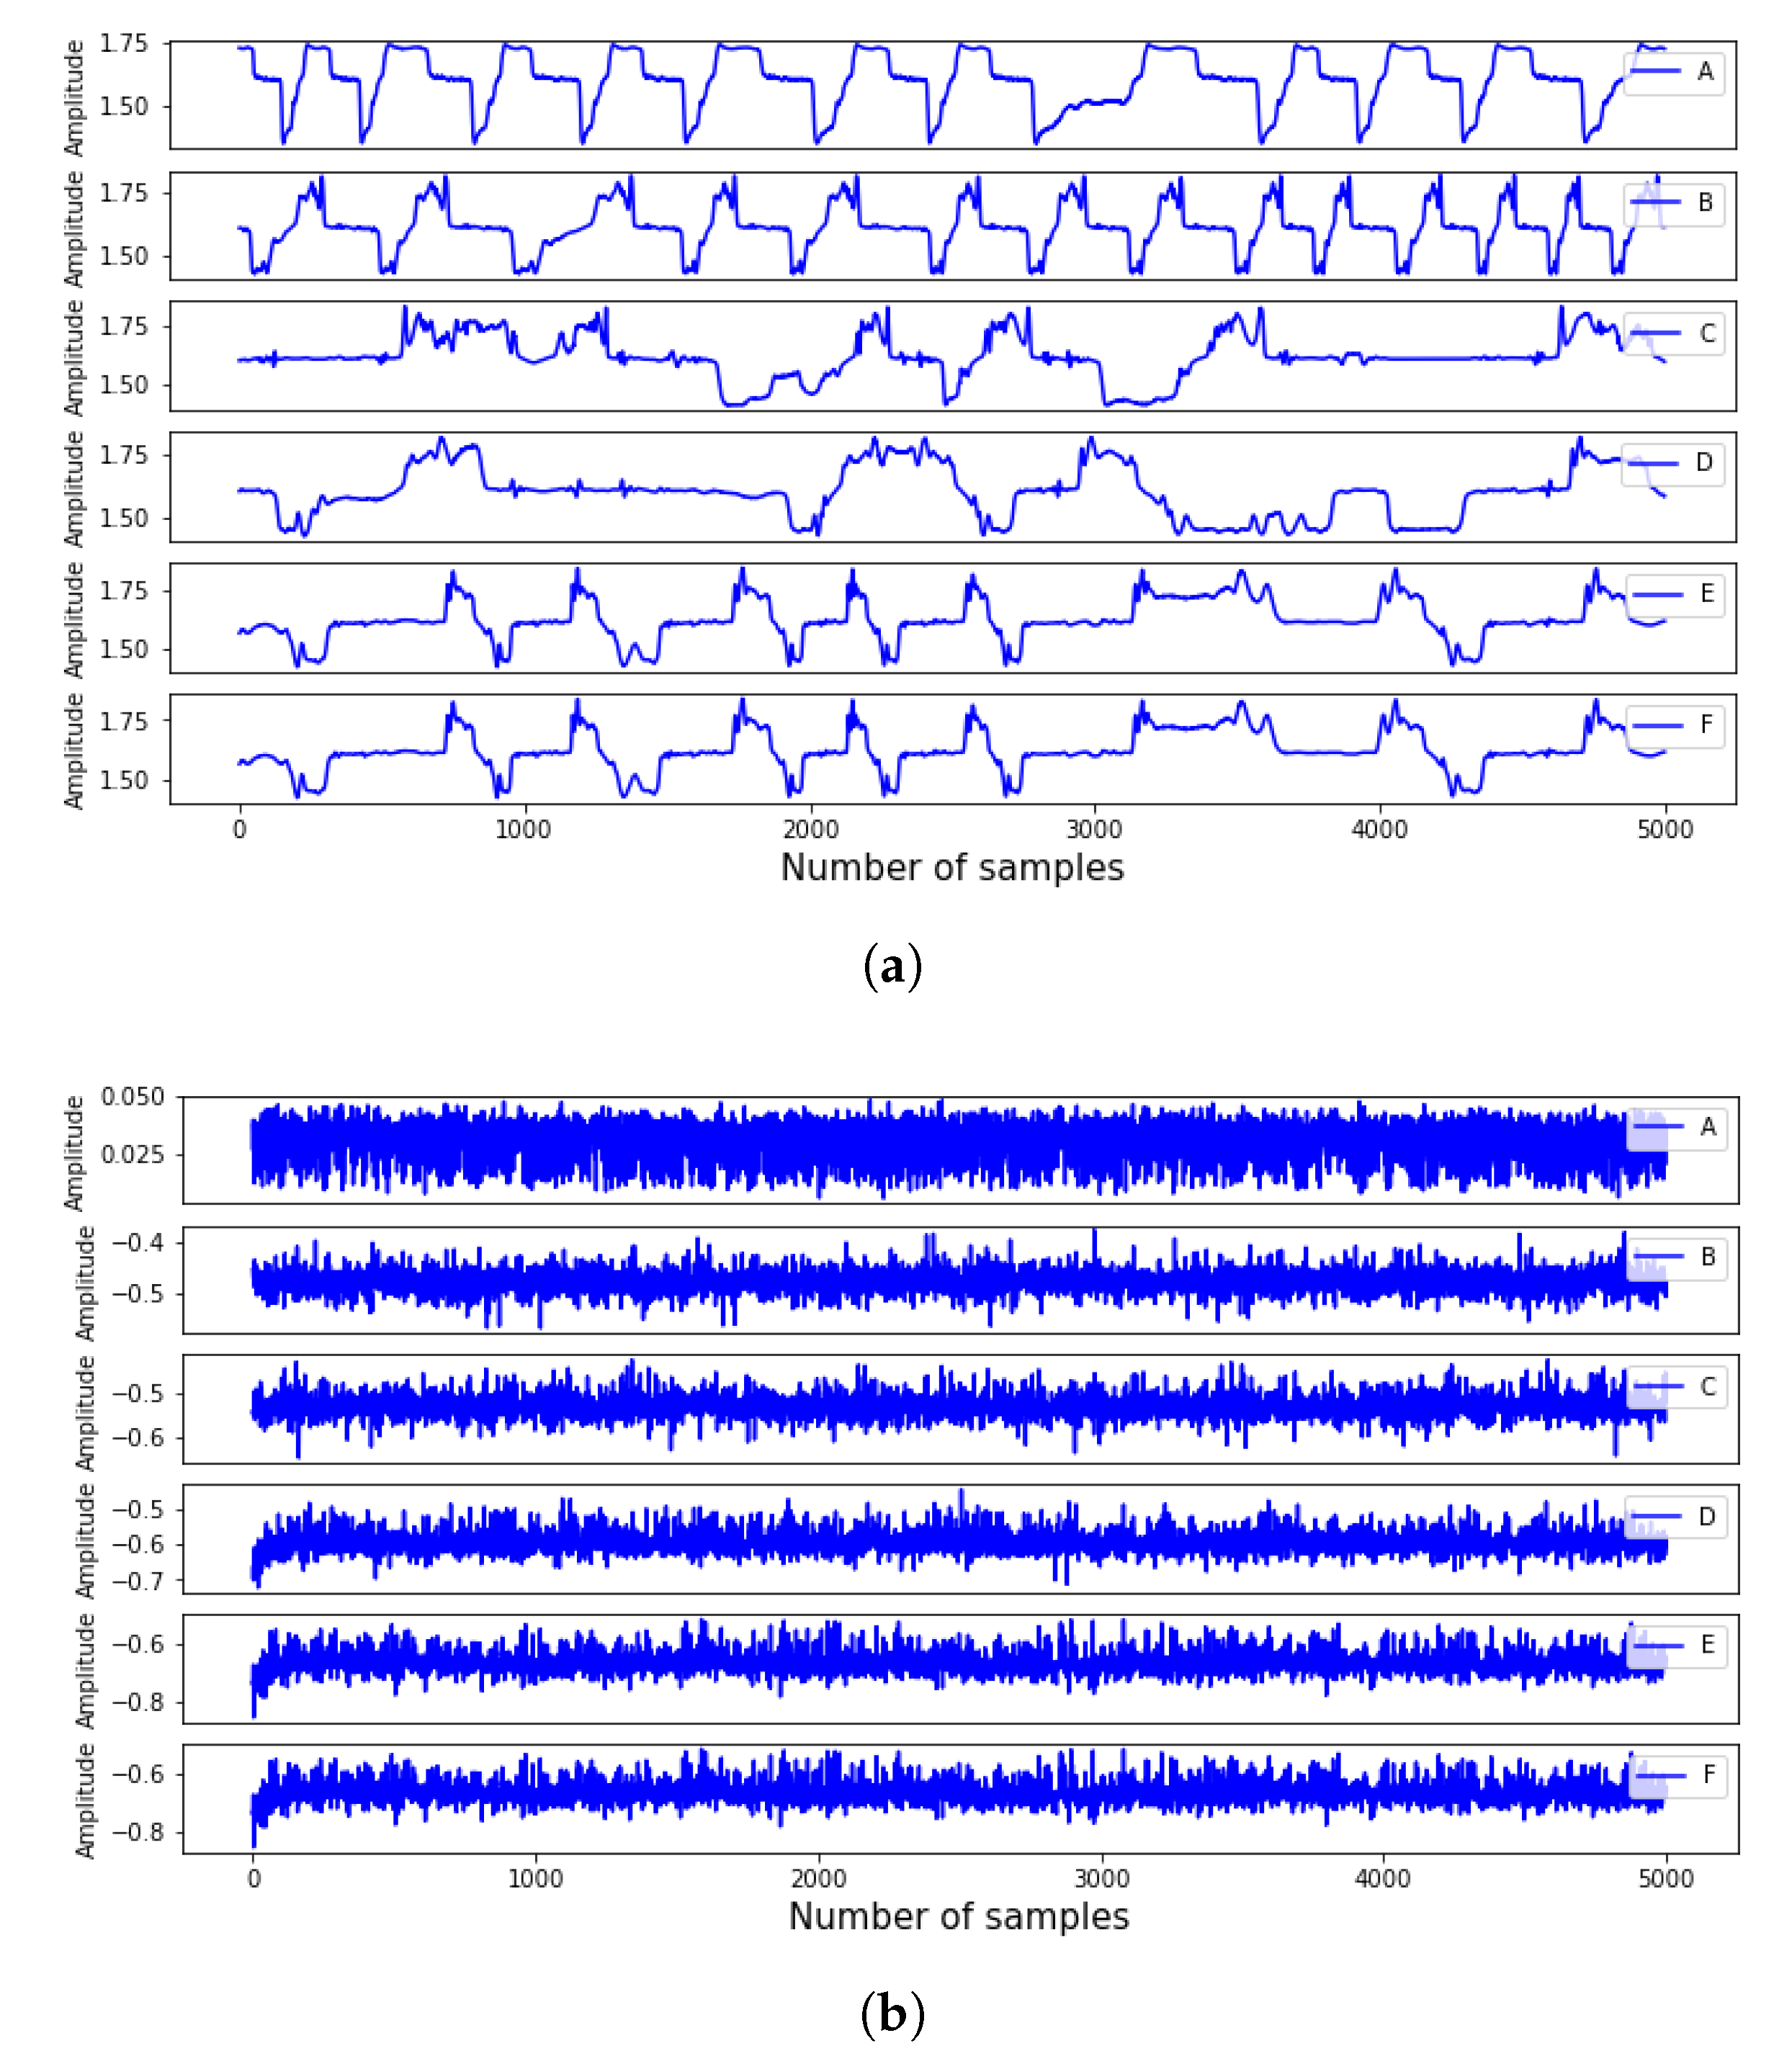
5.1. Experimental Results
During the experiment, it was observed that the overall system’s amperage increased as the loading increased; however, as
Figure 5 shows, the impact of varying loading on the MOSFET could be observed directly from the raw signals as there are transient changes in the voltage and current signals, respectively.
As shown in
Figure 5a, at no loading condition (Case A), it is observed that a maximum voltage of ≈
V is observed with periodic behavior. As loading is increased (Case A–F), new high-frequency components are observed; however, these high-frequency components have marginal relevance since the transient effect of the loading conditions are more reflected by the non-stationary behavior of the signals for the different conditions. This same assumption was considered for the current signals too since transient effects are also observed for the respective signals at the different conditions. Consequently, it would be more logical to exploit transient characteristics (features) for diagnosis.
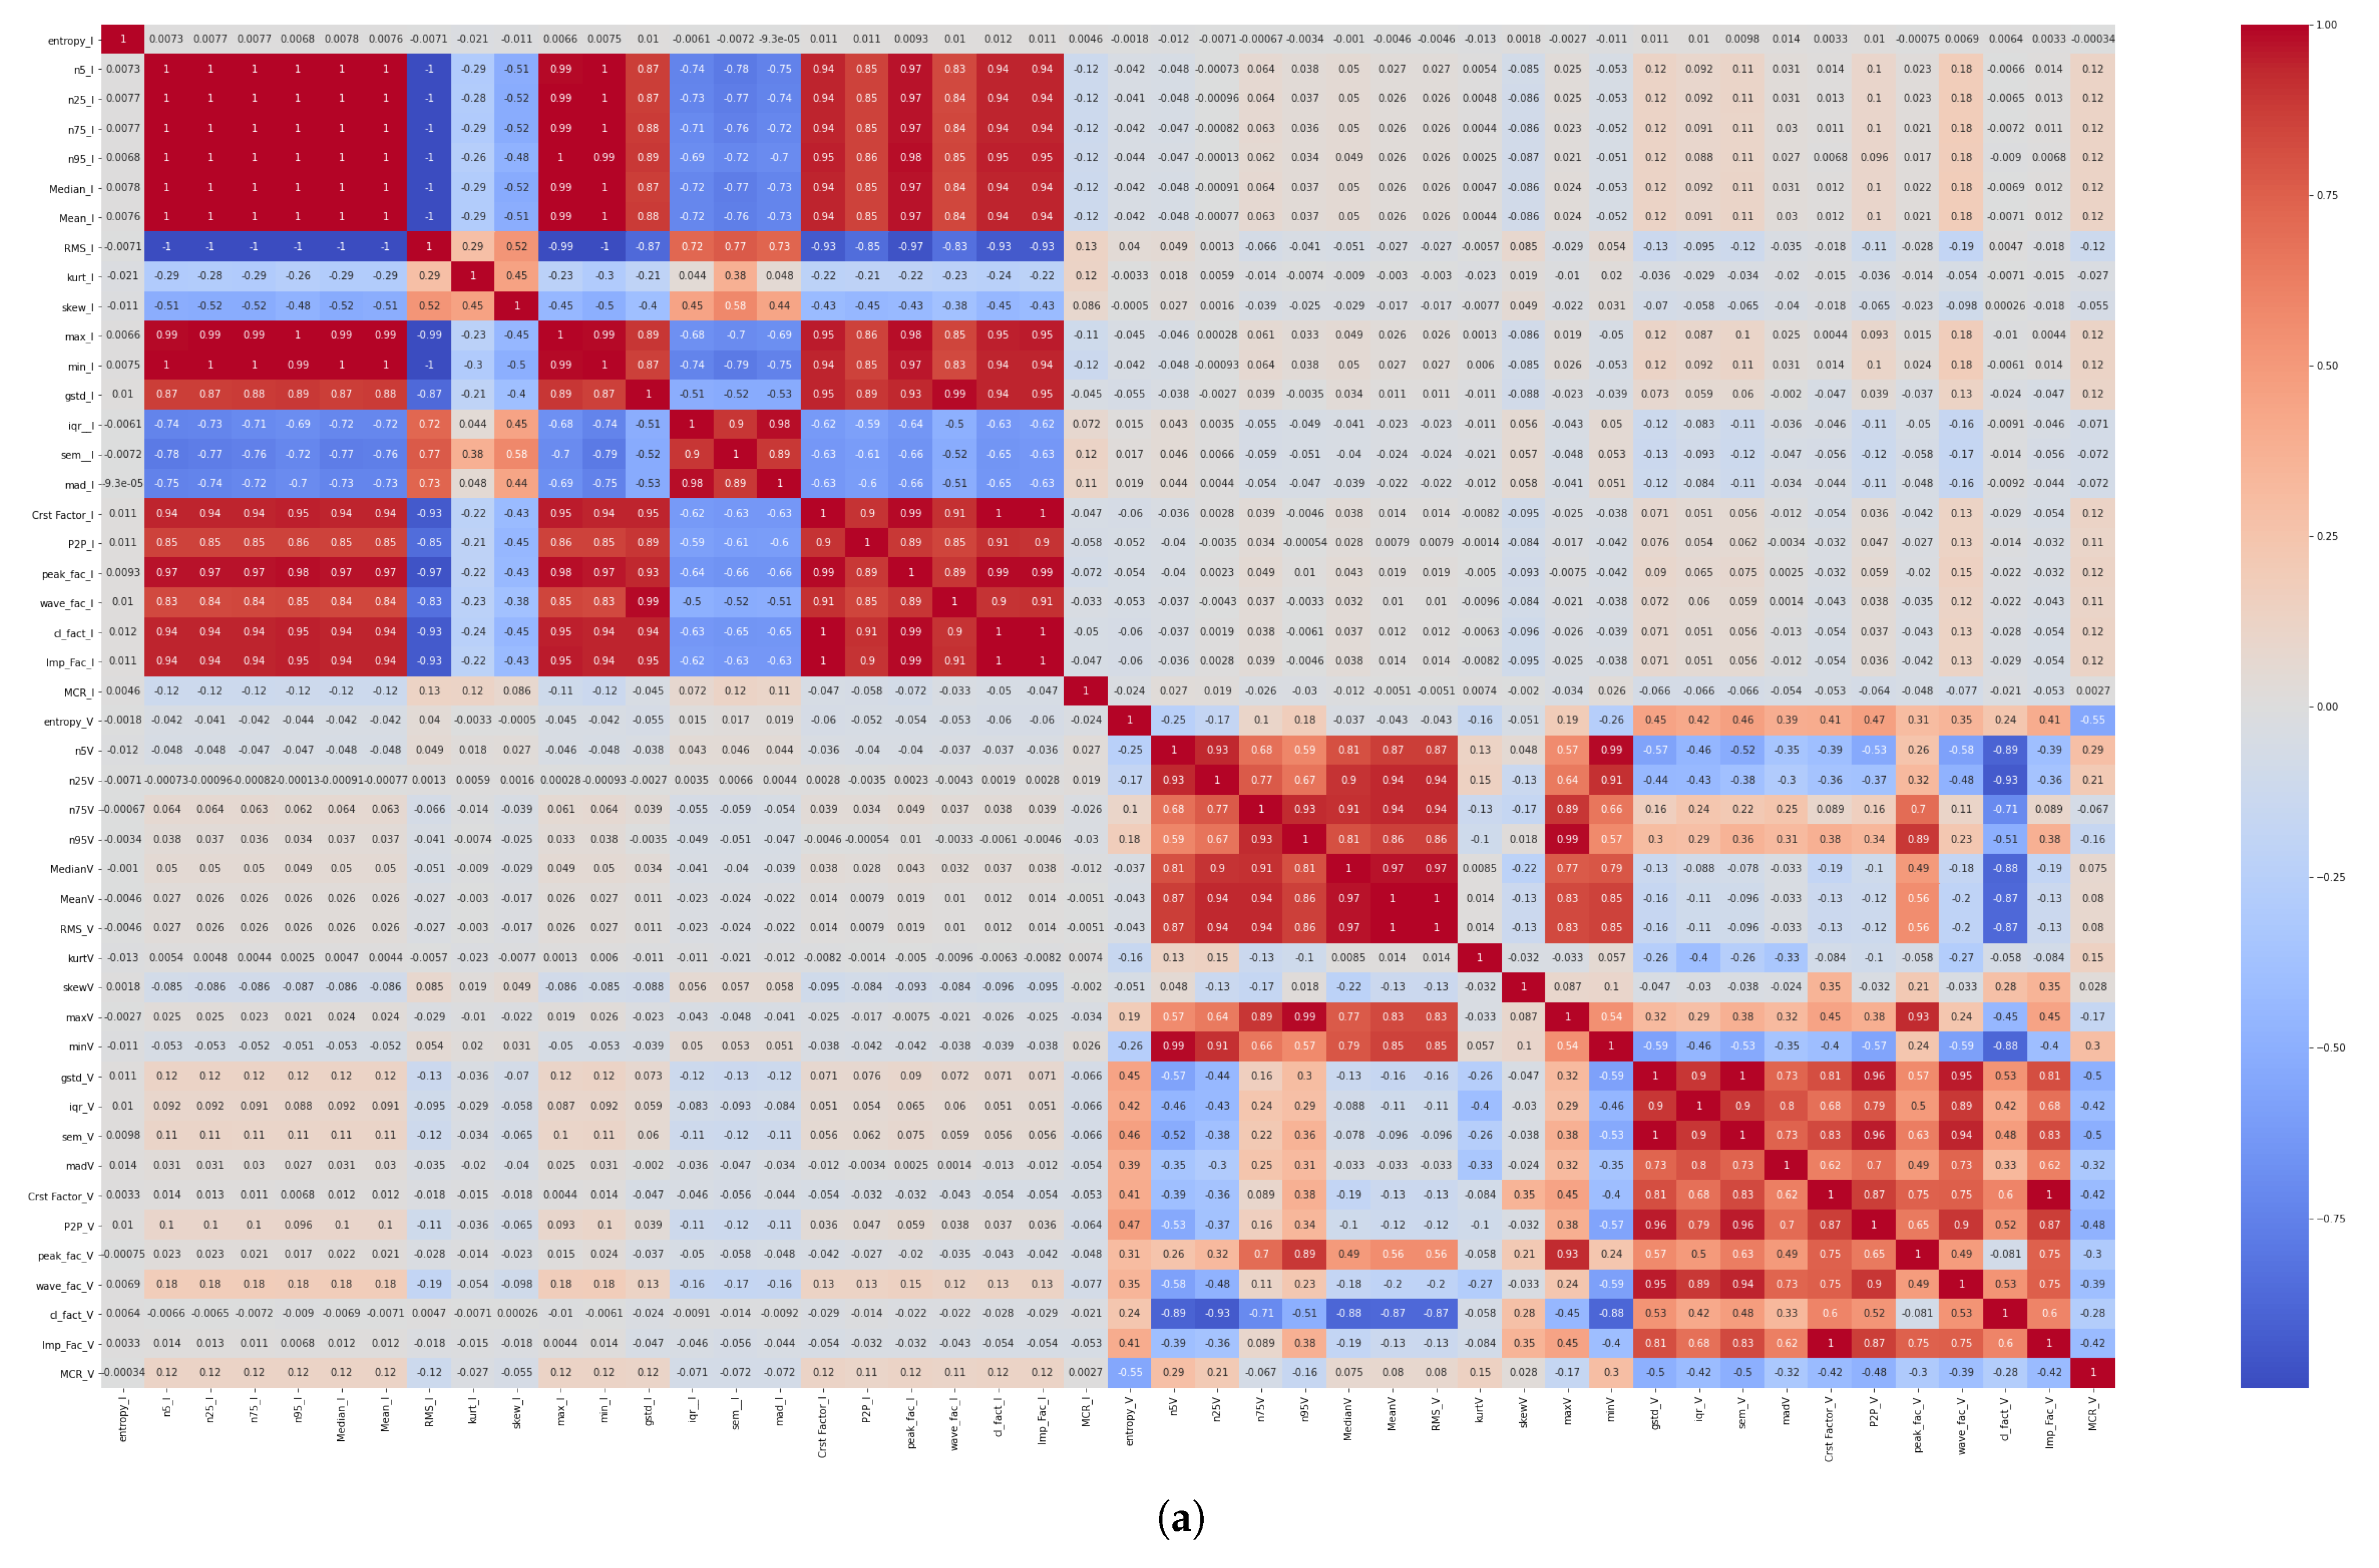
5.2. Feature Engineering
Following the system model presented in
Figure 6, the features summarised in
Table 2 were extracted simultaneously from the voltage and current signals. An exhaustive observation of the extracted features revealed that each of the features (in their unique functionalities) were able to capture diverse transient information from the different signals; however, a correlation comparison would provide comparative assessments on their discriminance—the major selection criteria for diagnosis.
Figure 6a shows the comprehensive correlation comparison of all the extracted features using Equation (
1) while
Figure 6b shows the selected features based on a 0.9 correlation threshold for selection.
As observed in
Figure 6a, there are quite a number of highly correlated features (in red); however, upon implementing the feature selection, 21 features which include entropy, percentile, RMS, kurtosis, skewness, Geometric standard deviation, 5th percentile, interquartile range, crest factor, and mean crossing rate are highly discriminant in both current and voltage signals. On the other hand, features like peak-to-peak are uniquely discriminant in the current signals whereas features like clearance factor, median absolute deviation, and 75th percentile are uniquely discriminant in the voltage signals. Overall, the feature selection results reveal the comprehensive representation of the two-way features extraction process for SMPS condition monitoring.
7. Conclusions and Future Works
Likely one of the first attempts on a fault diagnostic approach of SMPS, this study proposed an ML-based diagnostics framework for SMPS by subjecting it to the electrical stress mode of failure. The SMPS has emerged as the cornerstone of efficient power transformation, converting mains voltage AC input to low voltage DC output. Analyzing the power supply switching operation which is a repeated on/off state which generates alternate current with high frequency at the primary side before being transferred through the transformer to the other side which is called the Secondary side. The voltage and current signals serve as the primary indicators of the switching device’s degradation and condition of health in this investigation; however, necessary feature engineering further provides more reliable diagnostic parameters and were validated. An experimental test-bed was developed to monitor the switching device’s behavior as it is subjected to external loading. Electrical signature analysis was used to analyze and visualize the behavior of the SMPS and switching devices under various electrical loading conditions using the various signal processing techniques. ML algorithms were used for fault diagnosis using uncorrelated statistical transient features from the current and voltage signals. The study aimed to find the best possible ML algorithm for the condition monitoring of the SMPS switching device with the RF and GBC being the most accurate and expensive while the DT was quite computationally efficient with high accuracy. In contrast, the KNN performed very poorly.
On the downside, the efficiency of the proposed diagnostic scheme will rely significantly on the operator/user experience since the feature selection threshold relies purely on user experience. This opens up room for human errors to creep in; however, it also opens up new opportunities for continued research. Considering the study explores only transient features (due to cost awareness), a cost-unaware application would require more advanced feature extraction techniques which would provide a more reliable avenue for improved trustworthiness and accuracy of the model. Ongoing research are aimed at exploring these solutions.
In future works, the authors intend to examine the SMPS using a temperature-dependent technique, by exposing the switching devices to temperatures outside of their permissible operating range for more precise condition monitoring. SMPS components in home items such as individual computers convert voltage and current features when transferring power from a DC or AC source to DC loads. SMPS are employed in all but the most rigorous uses to provide an efficient and effective source of power for most types of electronics systems as a result of their performance. Because of its relevance, having an accurate condition monitoring method that allows for an effective switching element maintenance strategy would be ideal.


