1. Introduction
Single-photon emission computed tomography (SPECT) is a tomographic imaging technique used in nuclear medicine that provides a sliced representation of a volumetric body region; it is based on the detection of single photons emitted by the decay of a radiopharmaceutical injected intravenously into the patient, which gathers in an organ or region of interest, allowing it to be viewed [
1,
2]. Detected photons are γ-rays. Depending on the tracer used in the exam, SPECT clinical examinations are performed in oncology, neurology, and lung studies [
3,
4,
5]. Recently, the use of SPECT in the cardiovascular field is having more and more development, also thanks to new technologies [
6] that have made it possible to obtain gated images with very low tracer doses compared to the past and very short acquisition times [
7,
8,
9,
10].
Myocardial perfusion imaging (MPI) using SPECT is the most frequently performed nuclear cardiology procedure and provides a sensitive means for detection, localization, and risk stratification of coronary artery disease (CAD), assessment of left ventricular (LV) function, and myocardial viability [
8]. Thanks to recent hardware and software developments, the use of SPECT in cardiology has enormously increased [
11].
Indeed, several novel designs of the gantry, including new solid-state detectors, which allow increased photon sensitivity in the myocardial region, and novel collimator designs, such as pinhole configured specifically for cardiac imaging, allowed the imaging time and radiation dose to be reduced.
In the literature, it is shown that the acquisition of cardiac SPECT images is performed both using dedicated systems [
12] and general-purpose cameras [
13] with the latter being able to image each body area and not just the heart.
The introduction of dedicated cardiac SPECT cameras represents an important step toward improvement of image quality and more effective diagnosis of cardiac diseases, allowing to reduce both acquisition times and injected radiotracer’s dose. However, dedicated cardiac scanners present some intrinsic limitations, such as the fixed spatial design that limits their use in obese patients and the single-organ use that limits its diffusion in general nuclear medicine laboratories. Hence, general purpose SPECT cameras should be expected to be used in cardiac imaging in the future.
In the present work, a technical comparison was made between the tomographs Alcyone—Discovery 530c by General Electric (GE), suitably built for cardiovascular studies, and Discovery NM/CT 670 by GE, designed for all anatomic districts’ studies. As it has already been demonstrated from the clinical point of view that, in patients submitted to myocardial perfusion imaging (MPI), Discovery allowed comparable diagnostic accuracy than Alcyone, albeit at the expenses of a relatively longer acquisition time [
14], in the present work, we wanted to evaluate if similar results can also be demonstrated from the technical point of view.
In the present work, the comparison included both the analysis of technical parameters of the two scanners, such as the energy resolution, spatial resolution, and count sensitivity, and the comparison of image quality metrics computed on images of a cardiac-shaped phantom and from 11 patients that underwent SPECT examination.
1.1. SPECT Main Components
1.1.1. Detectors
The photons emitted by the patient’s body are immediately detected and converted into a useful signal by the gamma camera.
In the latest generation SPECT cameras, such as those studied in this work, cadmium zinc telluride (CZT) crystals are used for converting emitted photons to electrical signal; they are very compact with high energy resolution, detector sensitivity, spatial resolution, and modulation transfer function [
15,
16,
17]. The photon-counting property of the CZT detector is such that γ-ray photons can be counted like in a standard digital camera for visible light, and it can work at a very high flux rate up to 50 Mcps/mm
2.
The high energy resolution (<6% full-width-at-half-maximum, FWHM) of CZT detectors reduces the detection of scattering events, increasing the contrast-to-noise ratio (CNR) and the spatial resolution. CZT detectors are also characterized by high sensitivity (i.e., count sensitivity): a 140 keV gamma photon produces about 30,000 electrons, i.e., 10 times more than those produced using a conventional NaI crystal; this advantage means that less activity and a shorter acquisition time are necessary to form useful images: in cardiac imaging, if with traditional cameras it takes 30 min to complete an exam, with modern cameras, less than 10 min are required.
1.1.2. Collimators
There are different types of collimators [
18], which differ in the orientation of the holes, thickness of the metal, and hole width, such as fan beam, parallel hole, and pinhole. Collimators are usually made of materials with a high density and a high atomic number, such as lead, tungsten, gold, and platinum.
The parallel hole consists of a grid with parallel holes, typically hexagonal. Only photons coming from a tight cone-shaped region in a direction perpendicular to the entrance surface of the collimator can fully traverse the collimator hole and reach the detector. Only a small fraction (typically ∼10−4–10−2) of emitted photons pass through the holes and are detected, limiting the sensitivity.
A pinhole collimator consists of a small pinhole aperture in a plate of dense material such as lead or tungsten. The sensitivity of a single pinhole collimator is rather low, but if the detector is large enough, multiple pinholes can be combined, generating a “multiple-pinhole collimator” and improving the sensitivity. A multiple-pinhole collimator is particularly suitable for the acquisition of a circumscribed and superficial anatomical district, such as the thyroid or heart [
19,
20].
To pass from the acquired data to the image, it is necessary to apply suitable reconstruction algorithms. Currently, the most used algorithms are analytical ones, such as filtered back-projection (FBP), and iterative ones, such as maximum likelihood-expectation maximization (MLEM) or ordered subset expectation maximization (OSEM) [
21]. The image reconstruction phase also plays an important role in the resulting image quality. However, since the main objective of this study was to assess how much the hardware components of SPECT scanners can affect cardiac image quality, we refer the reader to consider other literature about the software aspects [
6,
11,
22].
1.2. Description of the Two SPECT Scanners
The two SPECT machines used in the comparison are Discovery NM 530c (Alcyone) and Discovery NM/CT 670 CZT, both commercialized by GE Healthcare.
Both cameras are equipped with CZT crystal detectors. Acquired raw data are stored in list-mode; starting from the raw data, it is then possible to perform various reconstructions, for example by selecting different energy and different temporal windows. Both machines offer the possibility of performing gated exams, i.e., simultaneous SPECT and electrocardiogram (ECG) recordings, aimed at studying the cardiac function and extracting parameters of interest, such as ejection fraction (EF), end-diastolic (EDV) and end-systolic volume (ESV), and estimation of cardiac contractility.
Table 1 shows the nominal technical characteristics of the two systems, as available in their respective datasheets.
Discovery 670 has a much lower photon sensitivity than Alcyone (see
Table 1); however, it has a wider and more modifiable field of view (FOV), which allows eliminating artifacts and allows imaging even of patients with high body mass index (BMI), thanks also to its mobile structure (not fixed like that of Alcyone); moreover, unlike Alcyone, it is also widely used in non-cardiological imaging practices.
1.2.1. Discovery NM 530c (Alcyone)
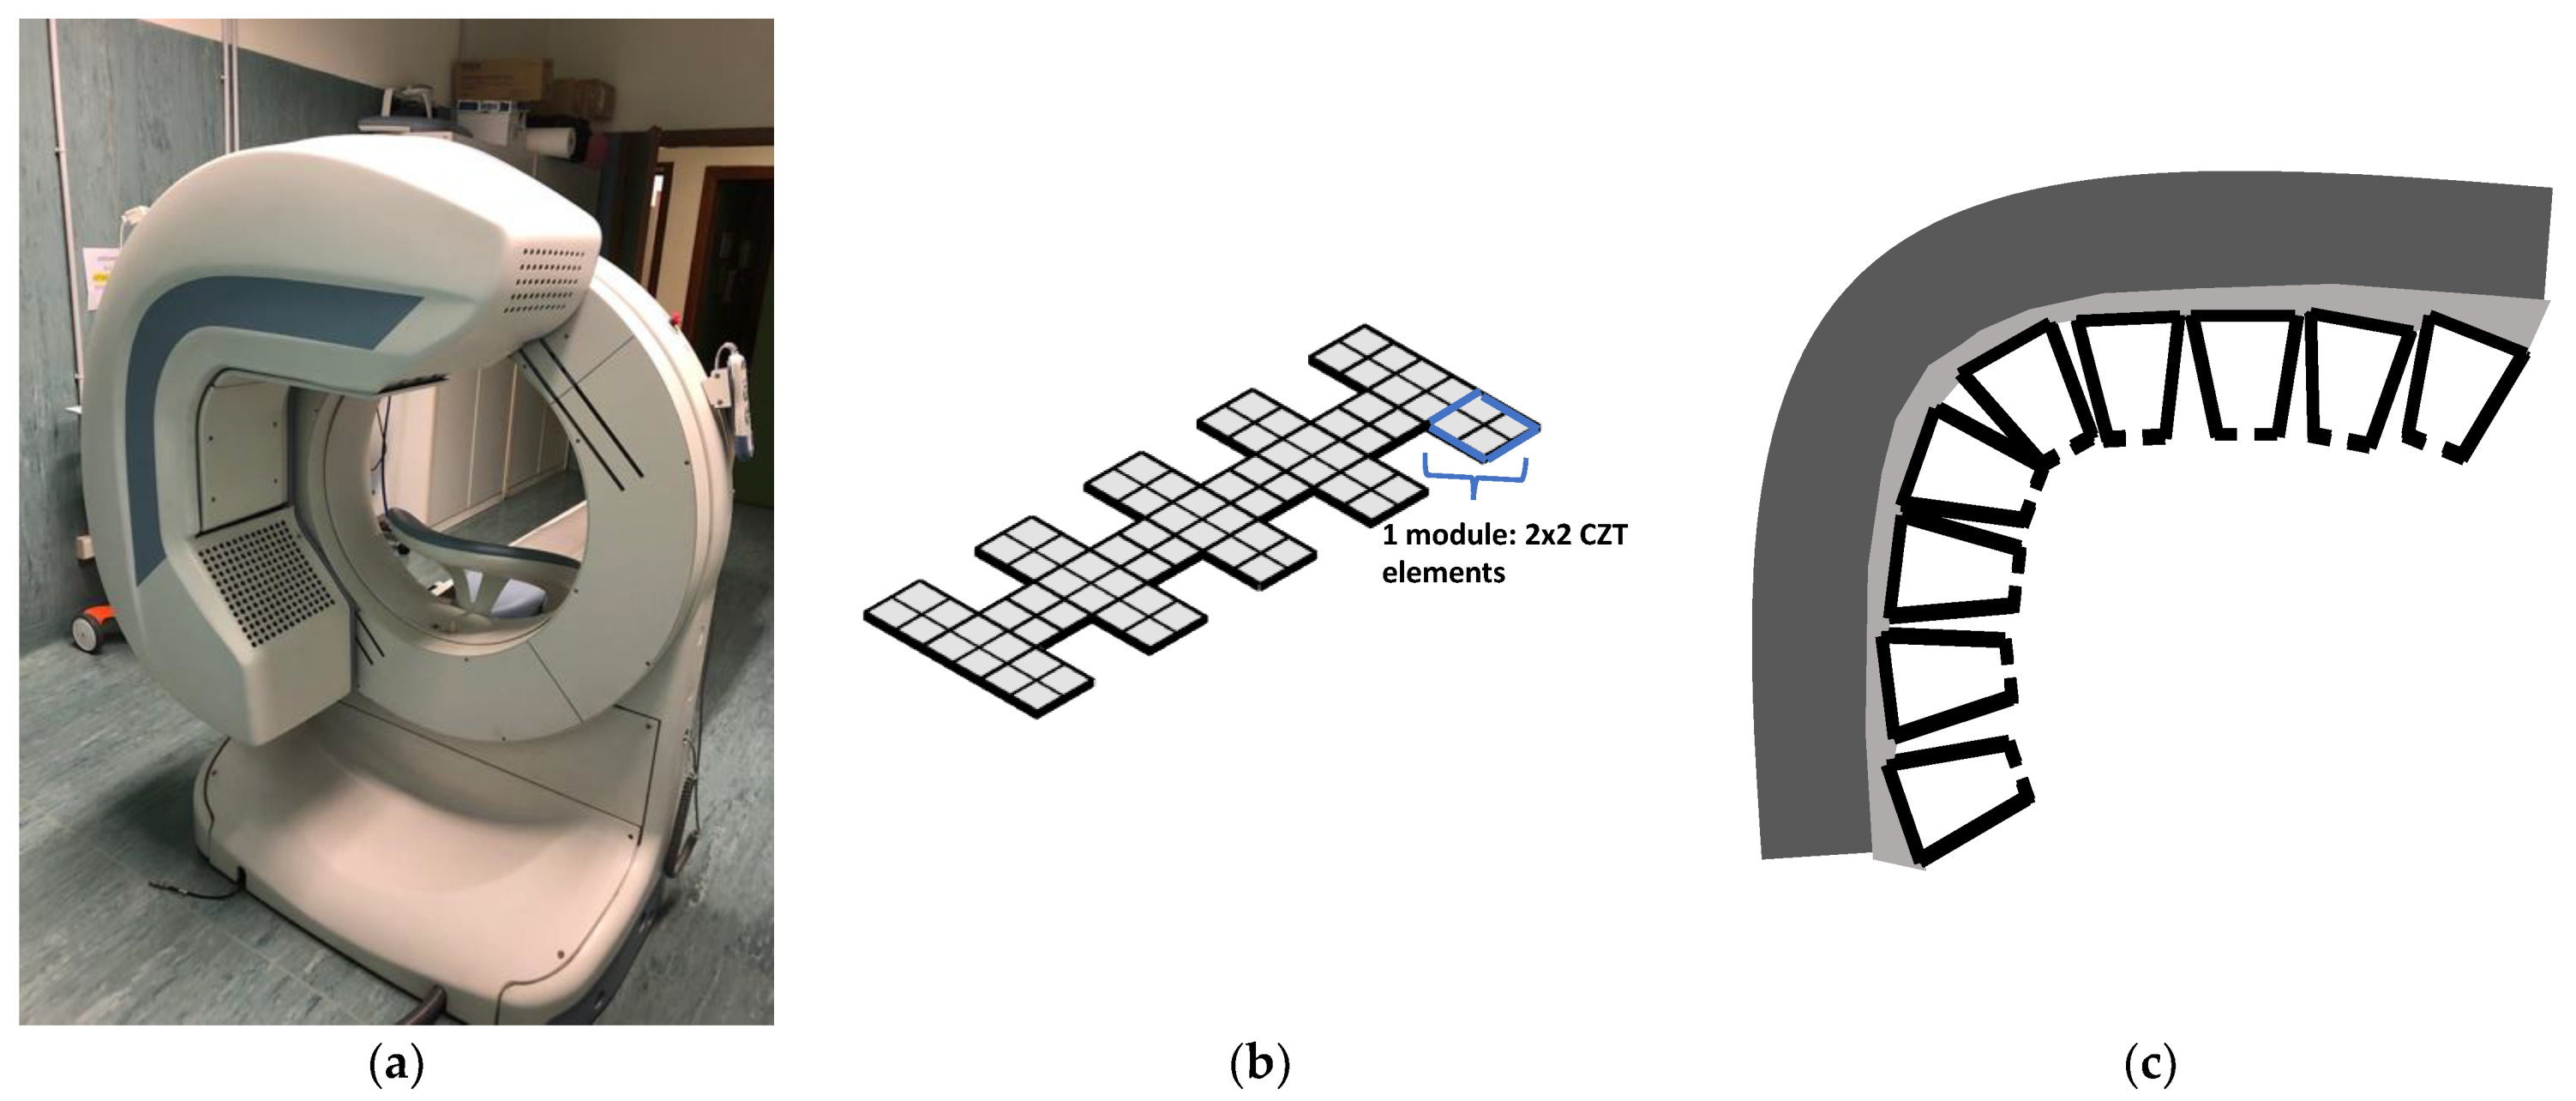
The Discovery NM 530c, known as Alcyone by the name of the technology that characterizes it, is a camera specifically designed for the heart: the detectors are arranged in an “L” shape, to wrap and center the heart area (
Figure 1a) [
23]. It can be considered as an upgraded and commercial version of the D-SPECT camera [
24]. What mainly distinguishes Alcyone from traditional Anger-logic cameras is its tomographic count sensitivity, which is up to four times higher [
24].
The low exposure allowed by this technology makes it also usable for the follow-up.
The detectors are organized in 19 modules, each consisting of four (2 × 2) CZT detectors, each consisting of 16 × 16 pixels. The modules are positioned along three lines, perpendicular to the patient’s longitudinal axis, as shown in
Figure 1b; there is an arrangement by columns of the type “3-1-3”: the central row is completely occupied by the nine detector blocks, while the other two house five blocks each, alternating full and empty positions.
The collimators are arranged so that each collimator comprises a block of four CZT detectors. They have a pinhole geometry, with an opening of 5.1 mm, focusing on a small volume in order to have the quality field of view (QFOV) in which to position the patient’s heart. Thanks to the pinhole conformation, sensitivity increases as the distance reduces, reducing the detection of photons from tissues and organs not included in the QFOV. The energy resolution, already high thanks to the CZT detectors, is further increased by the presence of oblique angles of incidence granted by the pinhole geometry (
Figure 1c).
A drawback of Alcyone, compared to the Discovery NM/CT 670, is that the attenuation correction cannot be performed using the data from the CT acquisition, but corrections are made using suitable software algorithms. It should be noted, however, that thanks to the arrangement of the head camera, the detectors are very close to the cardiac region and therefore attenuation is minimized.
1.2.2. Discovery NM/CT 670 CZT
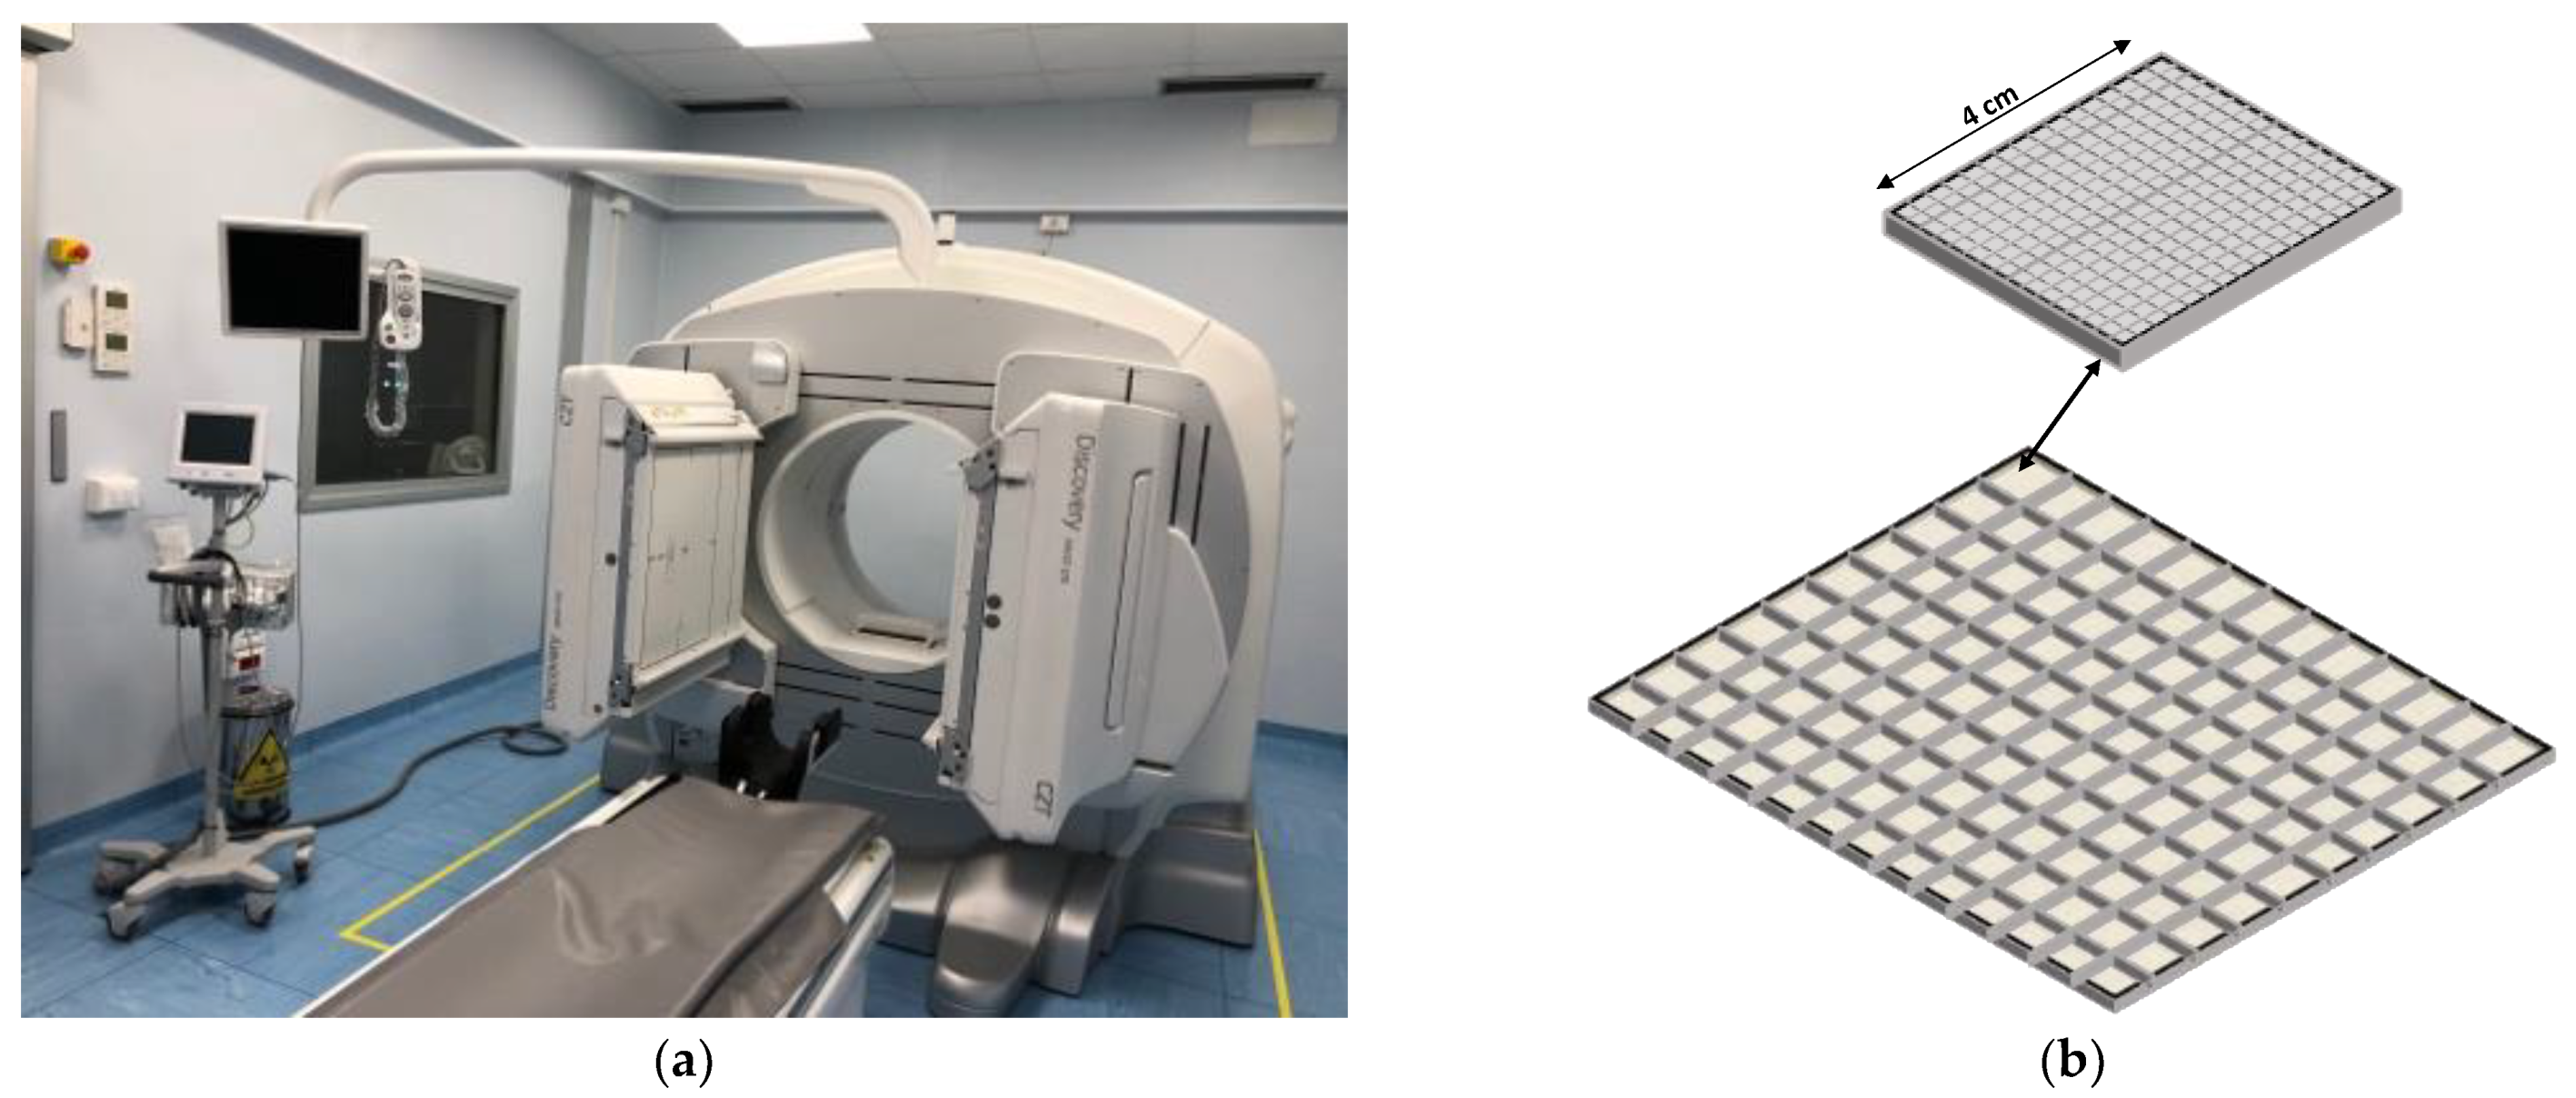
Discovery NM/CT 670 CZT (hereinafter called Discovery) is a multi-imaging system (
Figure 2a) combining computerized tomography (CT) and SPECT cameras. One of the advantages of having an integrated CT system is that the attenuation correction on the SPECT images can be performed using the CT data. It is a multipurpose imaging machine that allows performing medical examinations such as cardiology, oncology, neurology, and orthopedics.
The system is composed of a multi-detector CT scanner, inserted in the gantry, and an NM-camera, composed of two rotating heads, which can be positioned in different geometric combinations according to the purpose; typically, the “L-shape” arrangement is adopted, at 90°, for cardiac acquisitions, or the “H-shape” at 180°. Its design and the presence of moving parts make it accessible even to patients with high BMI, unlike other cameras with fixed structures.
The detectors are mounted in the two rotating heads with the following arrangement: each head includes 130 CZT detectors, arranged in a 10 × 13 matrix, each detector is made up of a matrix of 16 × 16 pixels of 2.46 mm side (as shown in
Figure 2b); the uniformity field of view measures 511 × 393 mm
2. The SPECT acquisition involves the rotation of each head for 180°.
The collimators are of the wide energy ultra-high resolution lead type, with parallel holes.
1.3. Cardiac SPECT Images Acquisition and Analysis
Cardiac SPECT clinical studies often include the evaluation of heart wall motion, wall thickening, and ejection fraction (EF); these parameters require: (a) the simultaneous acquisition of SPECT data and ECG signal and (b) a subsequent analysis of the reconstructed images. A stable heart rate and rhythm is necessary to then reconstruct synchronized images; this can be achieved by rejecting heartbeats that fall out of range at the expense of an increase in image time. Usually, the heart is gated for 8 or 16 frames per cycle [
8]. Cardiac perfusion studies include the acquisition of SPECT images both at rest and during stress; both image acquisitions are ECG gated to aid in the evaluation of transient left-ventricle dysfunction following stress. After image reconstruction, the images are in body axial orientation, so image re-orientation is necessary for having images that follow the heart main axis: short axis (SA), vertical long axis, and horizontal long axis. Then, image segmentation is performed to separate the myocardial wall from other tissues, and the left ventricle function and perfusion parameters are evaluated [
8,
25]. Image re-orientation, segmentation, and parameter evaluation are always performed using software tools installed in a workstation separated from the SPECT scanner.
2. Materials and Methods
2.1. Parameters Characterizing SPECT Tomograph and Image Quality
To evaluate the quality of a SPECT tomograph, several parameters can be estimated or directly measured on phantoms or in vivo. Sensitivity, energy resolution, and spatial resolution are among the most used ones; moreover, on the reconstructed images, the image uniformity, the signal to background noise ratio (SBNR), and the tissue contrast to background noise ratio (TCBNR) are usually evaluated.
System sensitivity parameter indicates the combination collimator–detector’s ability to detect photons, and it is defined as the ratio between the activity detected in the unit of time and the dosage provided [
26]. Sensitivity is a critical parameter, which affects both the acquisition time and the amount of tracer to be injected.
Energy resolution, Ren, represents the ability of a system to distinguish photons of different energy; it is calculated by evaluating the FWHM of the energy spectrum of acquisition (
), normalized by the energy of the photopeak (
), to indicate the dispersion around the emission value:
Spatial resolution indicates the ability of a system to distinguish two points or two linear radioactive sources as separate entities, and it is influenced by both the detector intrinsic resolution and the geometrical resolution of the collimators. In this work, it has been evaluated from a phantom with three-point sources, arranged in an “L” shape, for the point spread function (PSF) on which to calculate the FWHM in mm as an index of the spatial resolution [
26].
Uniformity provides an estimate of the uniformity of the signal in a region of interest (ROI), such as the heart in the cardiac images. It is given by [
22]:
where
denotes the intensity value of the
i-th voxel in the ROI,
is the mean value of all the voxels in the ROI, and
N is the total number of voxels. The lower
U, the more homogeneous the ROI.
SBNR is a parameter we defined as:
where
is the mean signal intensity from a tissue ROI and
is the standard deviation of the pixel values in a background ROI, which constitutes the measurement noise.
TCBNR was defined as:
where
is the mean value of a background region; this parameter gives information on the contrast between a region with an emitting tissue and a region without radiation.
2.2. Data Acquisition
The comparison of the performance of the two SPECT systems is based on images acquired with a NEMA (National Electrical Manufacturers Association) phantom, a home-made, heart-like phantom, and a clinical dataset comprising 11 subjects. Moreover, to assess the energy resolution, a rectangular source (flood source) of cobalt (Co-57) was used, with an energy peak at 122 KeV.
It should also be noted that, as a consequence of the different acquisition method, different reconstruction techniques have been used for different sets of images: Alcyone simulates a SPECT system starting from the data in list-mode then generates sinograms and finally performs the reconstruction, while the Discovery actually rotates around the patient, and it directly produces and stores raw data as sinograms.
Input doses were chosen to reflect as closely as possible the doses typically present in cardiac tissue in patient clinical examinations. They have been evalauted by using a dose-calibrator (ISOMED 2010, Nuviatech Healthcare, Germany), inserting in the device the three tracer-filled capillaries for the NEMA phantom and a syringe without rubber for the cardiac phantom.
2.2.1. Comparison of Acquisition Parameters for the Two Instruments
To make the data acquired by the two systems comparable in the best possible way and to perform acquisitions that resemble as closely as possible a real clinical examination, the acquisition parameters have been set as equal as possible for both systems.
For example, as shown in
Table 2 and
Table 3, the attenuation correction was skipped on both machines, although Discovery is capable of doing it by leveraging CT data; the size of the analyzed images was 70 × 70 pixels for Alcyone (the only available size) and 64 × 64 and 128 × 128 for Discovery; acquisition time used for Alcyone was about half that of Discovery to replicate the acquisition times used in clinical practice.
For each phantom, a single acquisition was made on Alcyone and, immediately after, two acquisitions on Discovery: the first for obtaining 64 × 64 images and the second for obtaining 128 × 128 images.
As it is shown in
Table 2, for the same input dose, although the acquisition time with Alcyone is less than half that of Discovery (9 min against 18′58′′ for Discovery), the total counts are about 1.2 times higher.
Even for the cardiac phantom, the counts measured with Alcyone are higher than those measured with Discovery.
2.2.2. NEMA Phantom
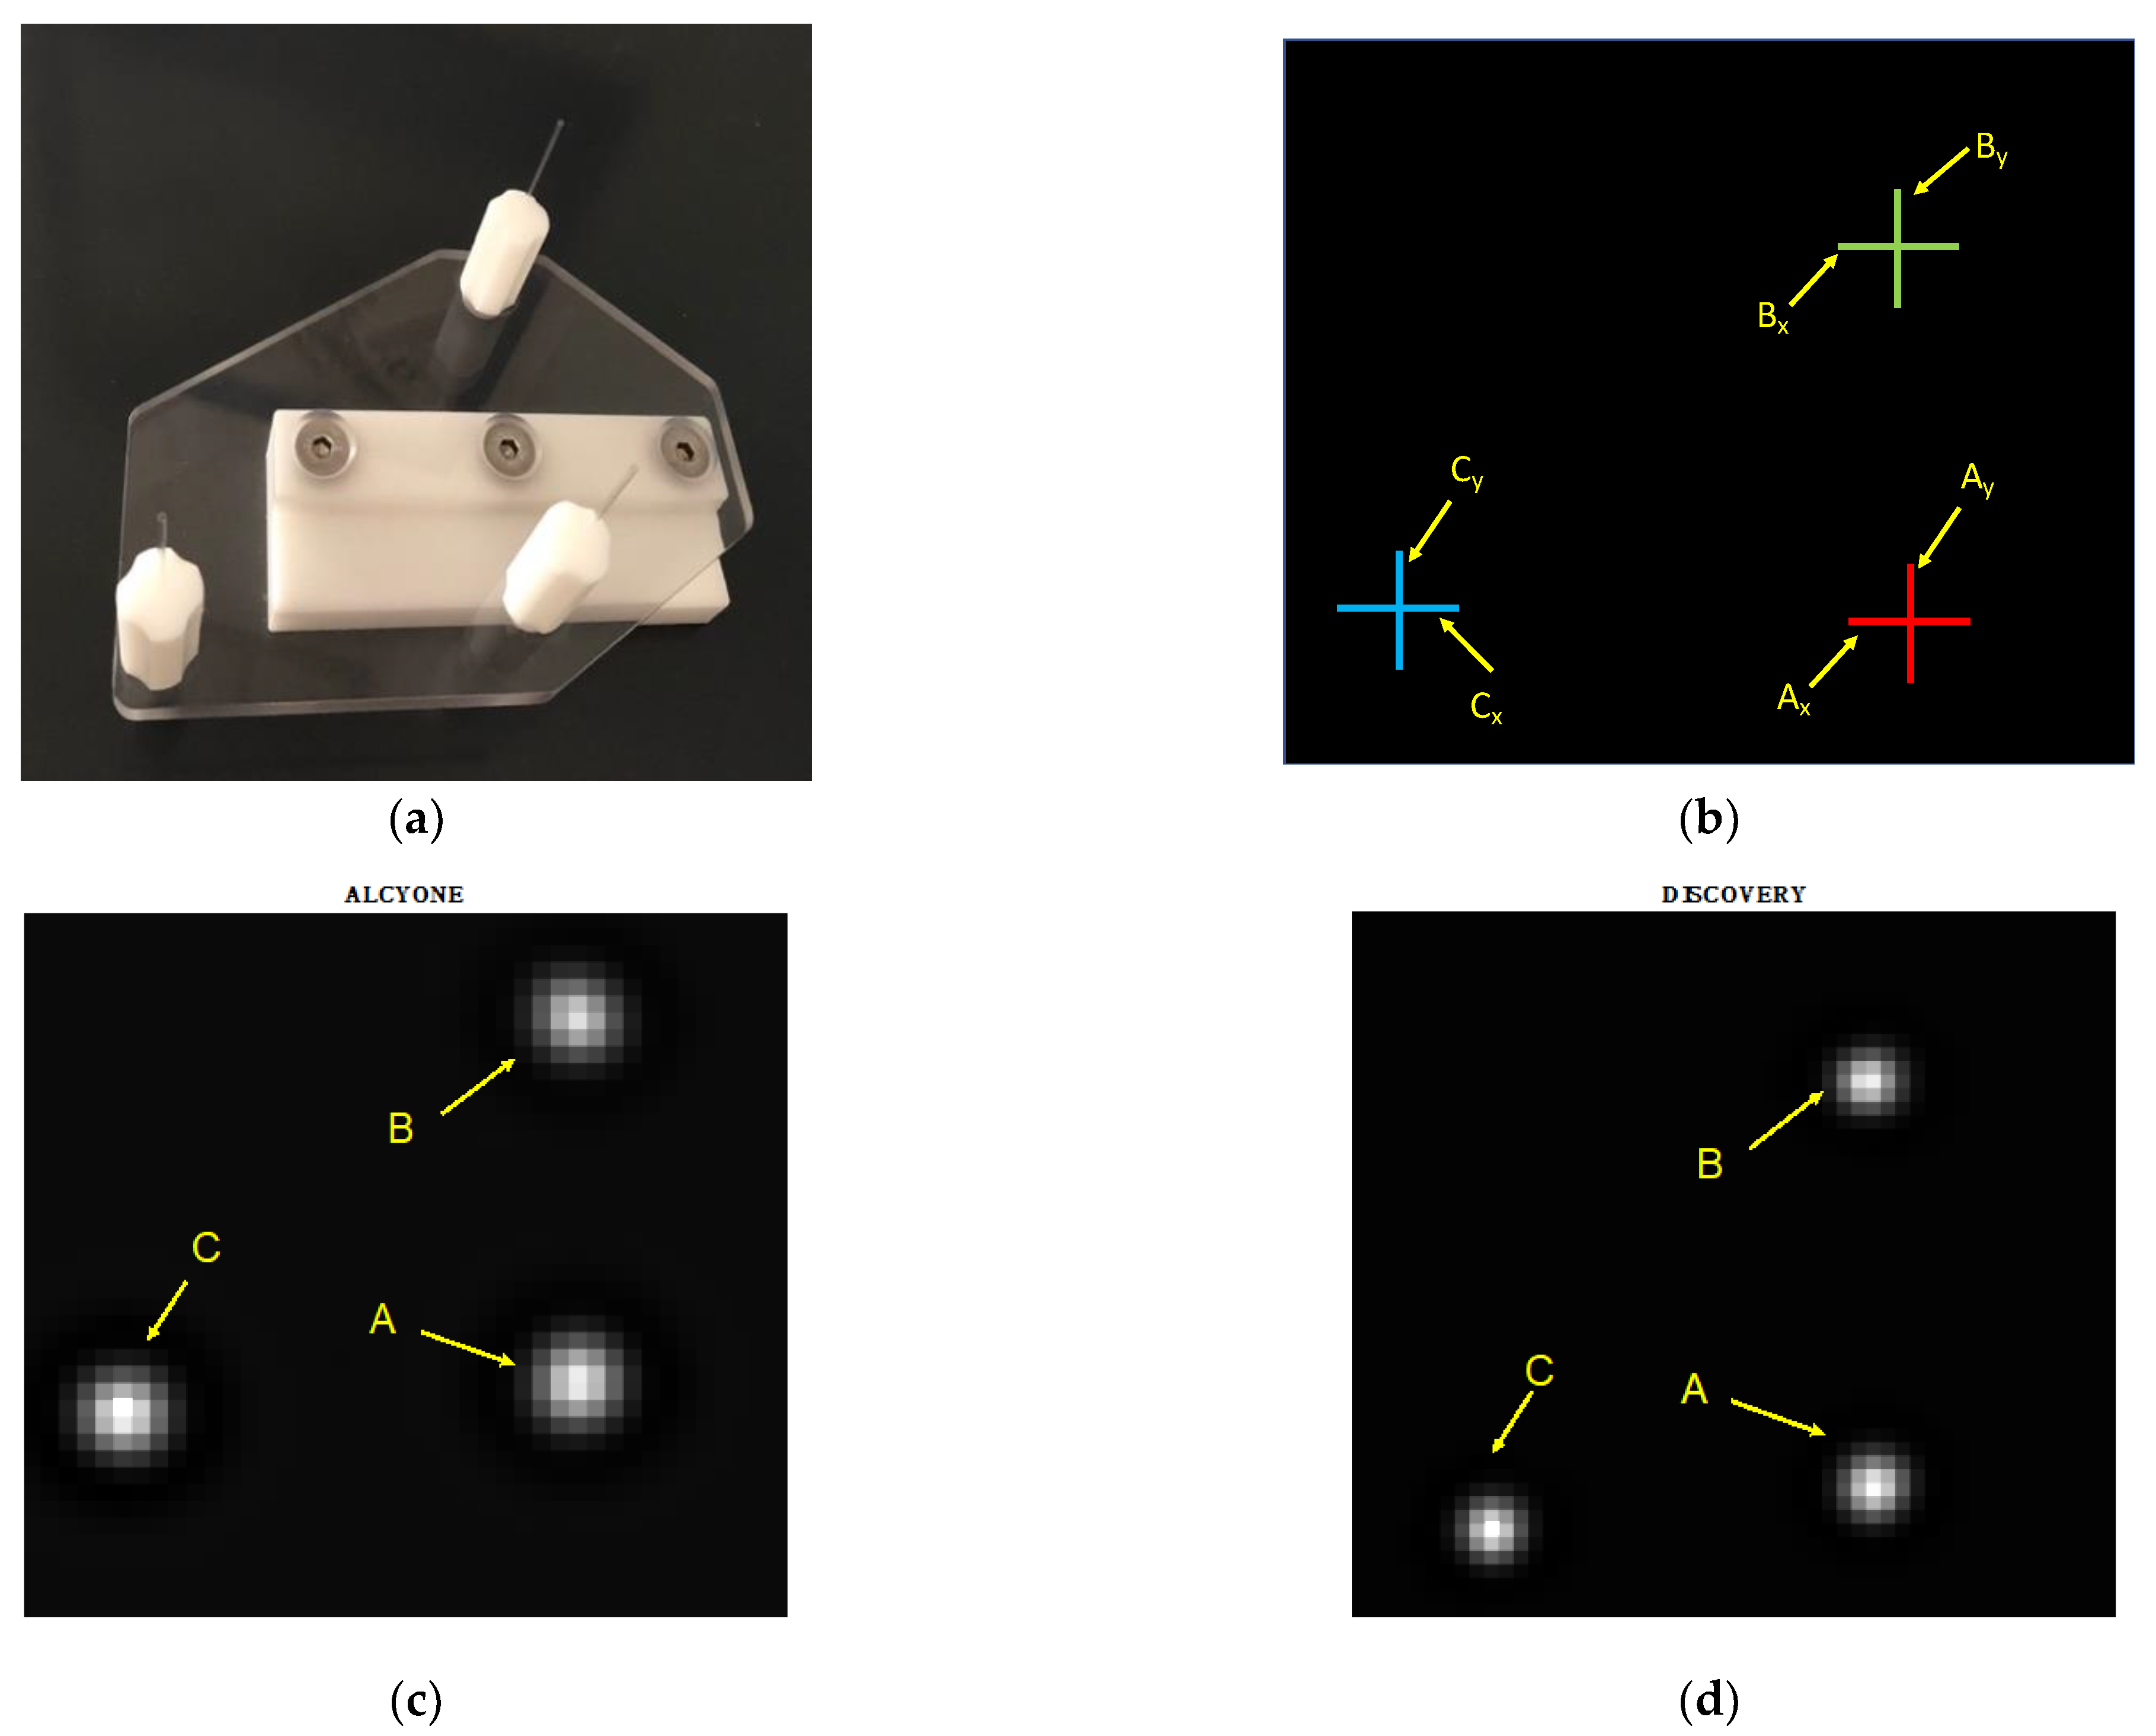
The NEMA phantoms allow performing quality tests on biomedical imaging systems. The phantom used in the present study (see
Figure 3a) allows testing the performance of the tomograph (such as sensitivity and spatial resolution) both in the central and peripheral regions of the camera [
27]. It is composed of three rigid capillaries, with a diameter of the order of 1 mm and length of about 8 cm, which are inserted into three plastic supports fixed to a flat plexiglass base and arranged to form an “L”.
The three capillaries of the NEMA phantom were filled by capillarity (i.e., placing them next to the tracer, which was absorbed) with 99mTc-tetrofosmin.
The NEMA phantom was placed in the center of the bore, using the support the phantom is provided with. The capillaries were oriented parallel to the bore.
Figure 3b shows the locations used to compute the FWHM in mm, to estimate the spatial resolutions. In
Figure 3c,d, examples of images acquired from Alcyone and Discovery are shown, respectively.
2.2.3. Cardiac Phantom
To study the behavior of the two SPECT systems in an ideal situation, that is, in absence of physiological noise, cardiac acquisition sessions were carried out with a custom-made cardiac phantom (see
Figure 4a). It includes two almost cylindrical components similar to the typical shape of the endocardial and pericardial wall; the innermost is solid, with a small protrusion of about 1 cm in diameter, and the outer one is empty and fits the smaller cylinder. There is an empty gap between the two components of about of 93 mL in volume, which represents the ventricular wall, and when imaging, it is filled with a tracer to emulate the myocardium supplied with blood. The narrowing of the myocardial area simulates the presence of an ischemic area in the ventricle, where no blood, and therefore no tracer, arrives.
The phantom was filled with 99mTc-tetrofosmin, with 10% radioactivity, obtained by dilution, to reproduce the physiological situation, in which the heart captures only 10% of the activity injected.
Table 3 summarizes the acquisition parameters used.
During acquisition, the phantom was considered as a “real” ventricle, reproducing its position in vivo even when placing it on the scanner bed: it was placed in a region of the bore that simulated the typical positioning of a human heart, in a lateral region of the bore, about 20 cm from the detectors, and with the long axis of the heart oblique with respect to the axes of the bore. Then, the images were analyzed in the same way as those in vivo. In
Figure 4b,c, short axis and long axis views of the phantom from Alcyone and Discovery are shown, respectively.
Images are a crop of the starting images, aimed at highlighting the heart region: in
Figure 4b, the images have a size of 34 × 34 pixels (pixel size of 4 mm), and in
Figure 4c, the images have a size of 42 × 42 pixels (pixel size of 3.4 mm).
In the last slices of the short axis views, the non-emitting area (simulating an ischemic condition) is evident, for both the scanners.
2.2.4. Clinical Data
Images from 11 subjects belonging to a control group without perfusion and BMI anomalies were analyzed. All subjects signed an informed consent form.
Tracer used was 99mTc-tetrofosmin. Acquisitions were ECG-gated and followed the stress/rest single-day protocol, according to the ASNC Guidelines [
28] and to the EANM Guidelines [
29], as described in detail in [
14].
Briefly: the tracer dosage was 148–185 MBq for the stress mode, and 296–370 MBq for the rest mode; the patients were placed in the machine in the supine position, with arms above the head; the energy emission windows were centered at 140 KeV ± 10%, with windows for scatter corrections centered at 120 KeV ± 5%; the stress condition was induced by physical exercise or by administering dipyridamole, according to the peculiarities of the patient, and after 10 min in the first case, or 15 min in the second, a 7-min acquisition was performed on the Alcyone machine, immediately followed by a 12.5 min acquisition on the Discovery NM/CT 670; the rest condition acquisition was started 30 min after the injection, starting with Alcyone for 6 min, then moving on to Discovery NM/CT 670 and acquiring for 10 min.
Since the half-life of 99mTc-tetrofosmin is quite long (of about 278 (+/−32) min in normal myocardium [
30]), the acquisition of images from the two scanners in a quite sequential manner, without waiting times, has meant that the degradation of the emission due to decay is very low, at about 1.2%, and therefore can be considered negligible.
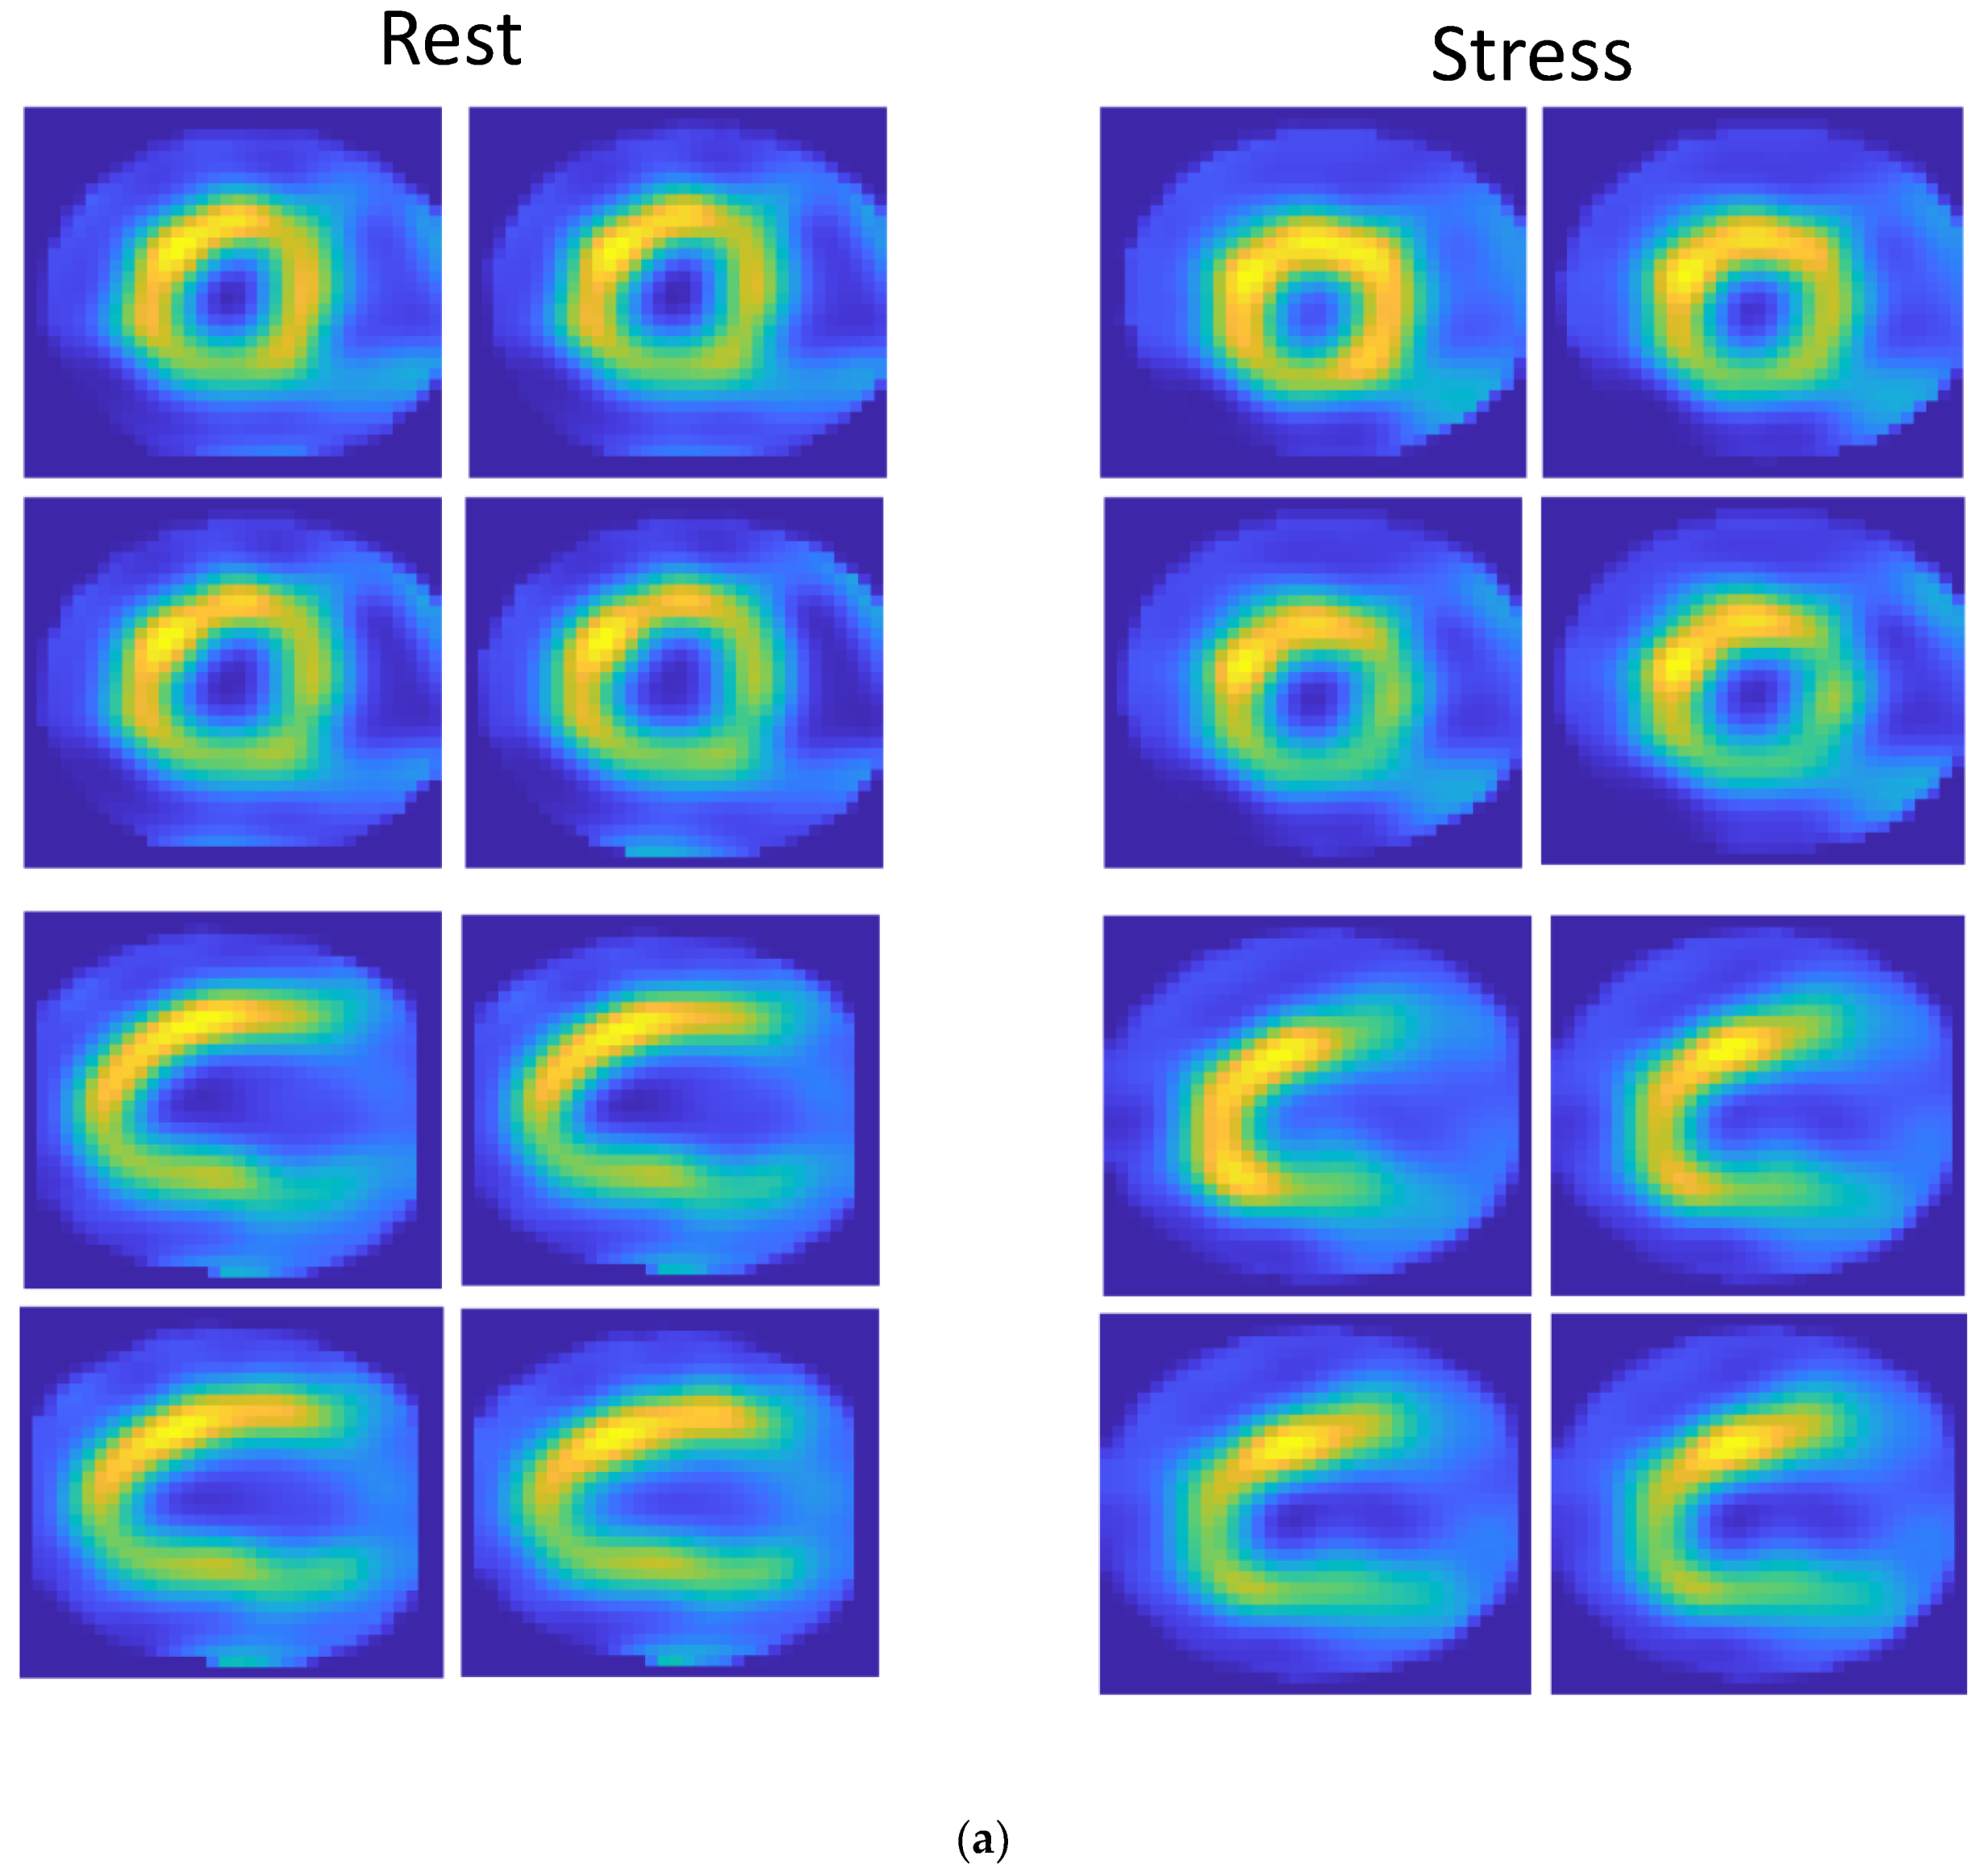
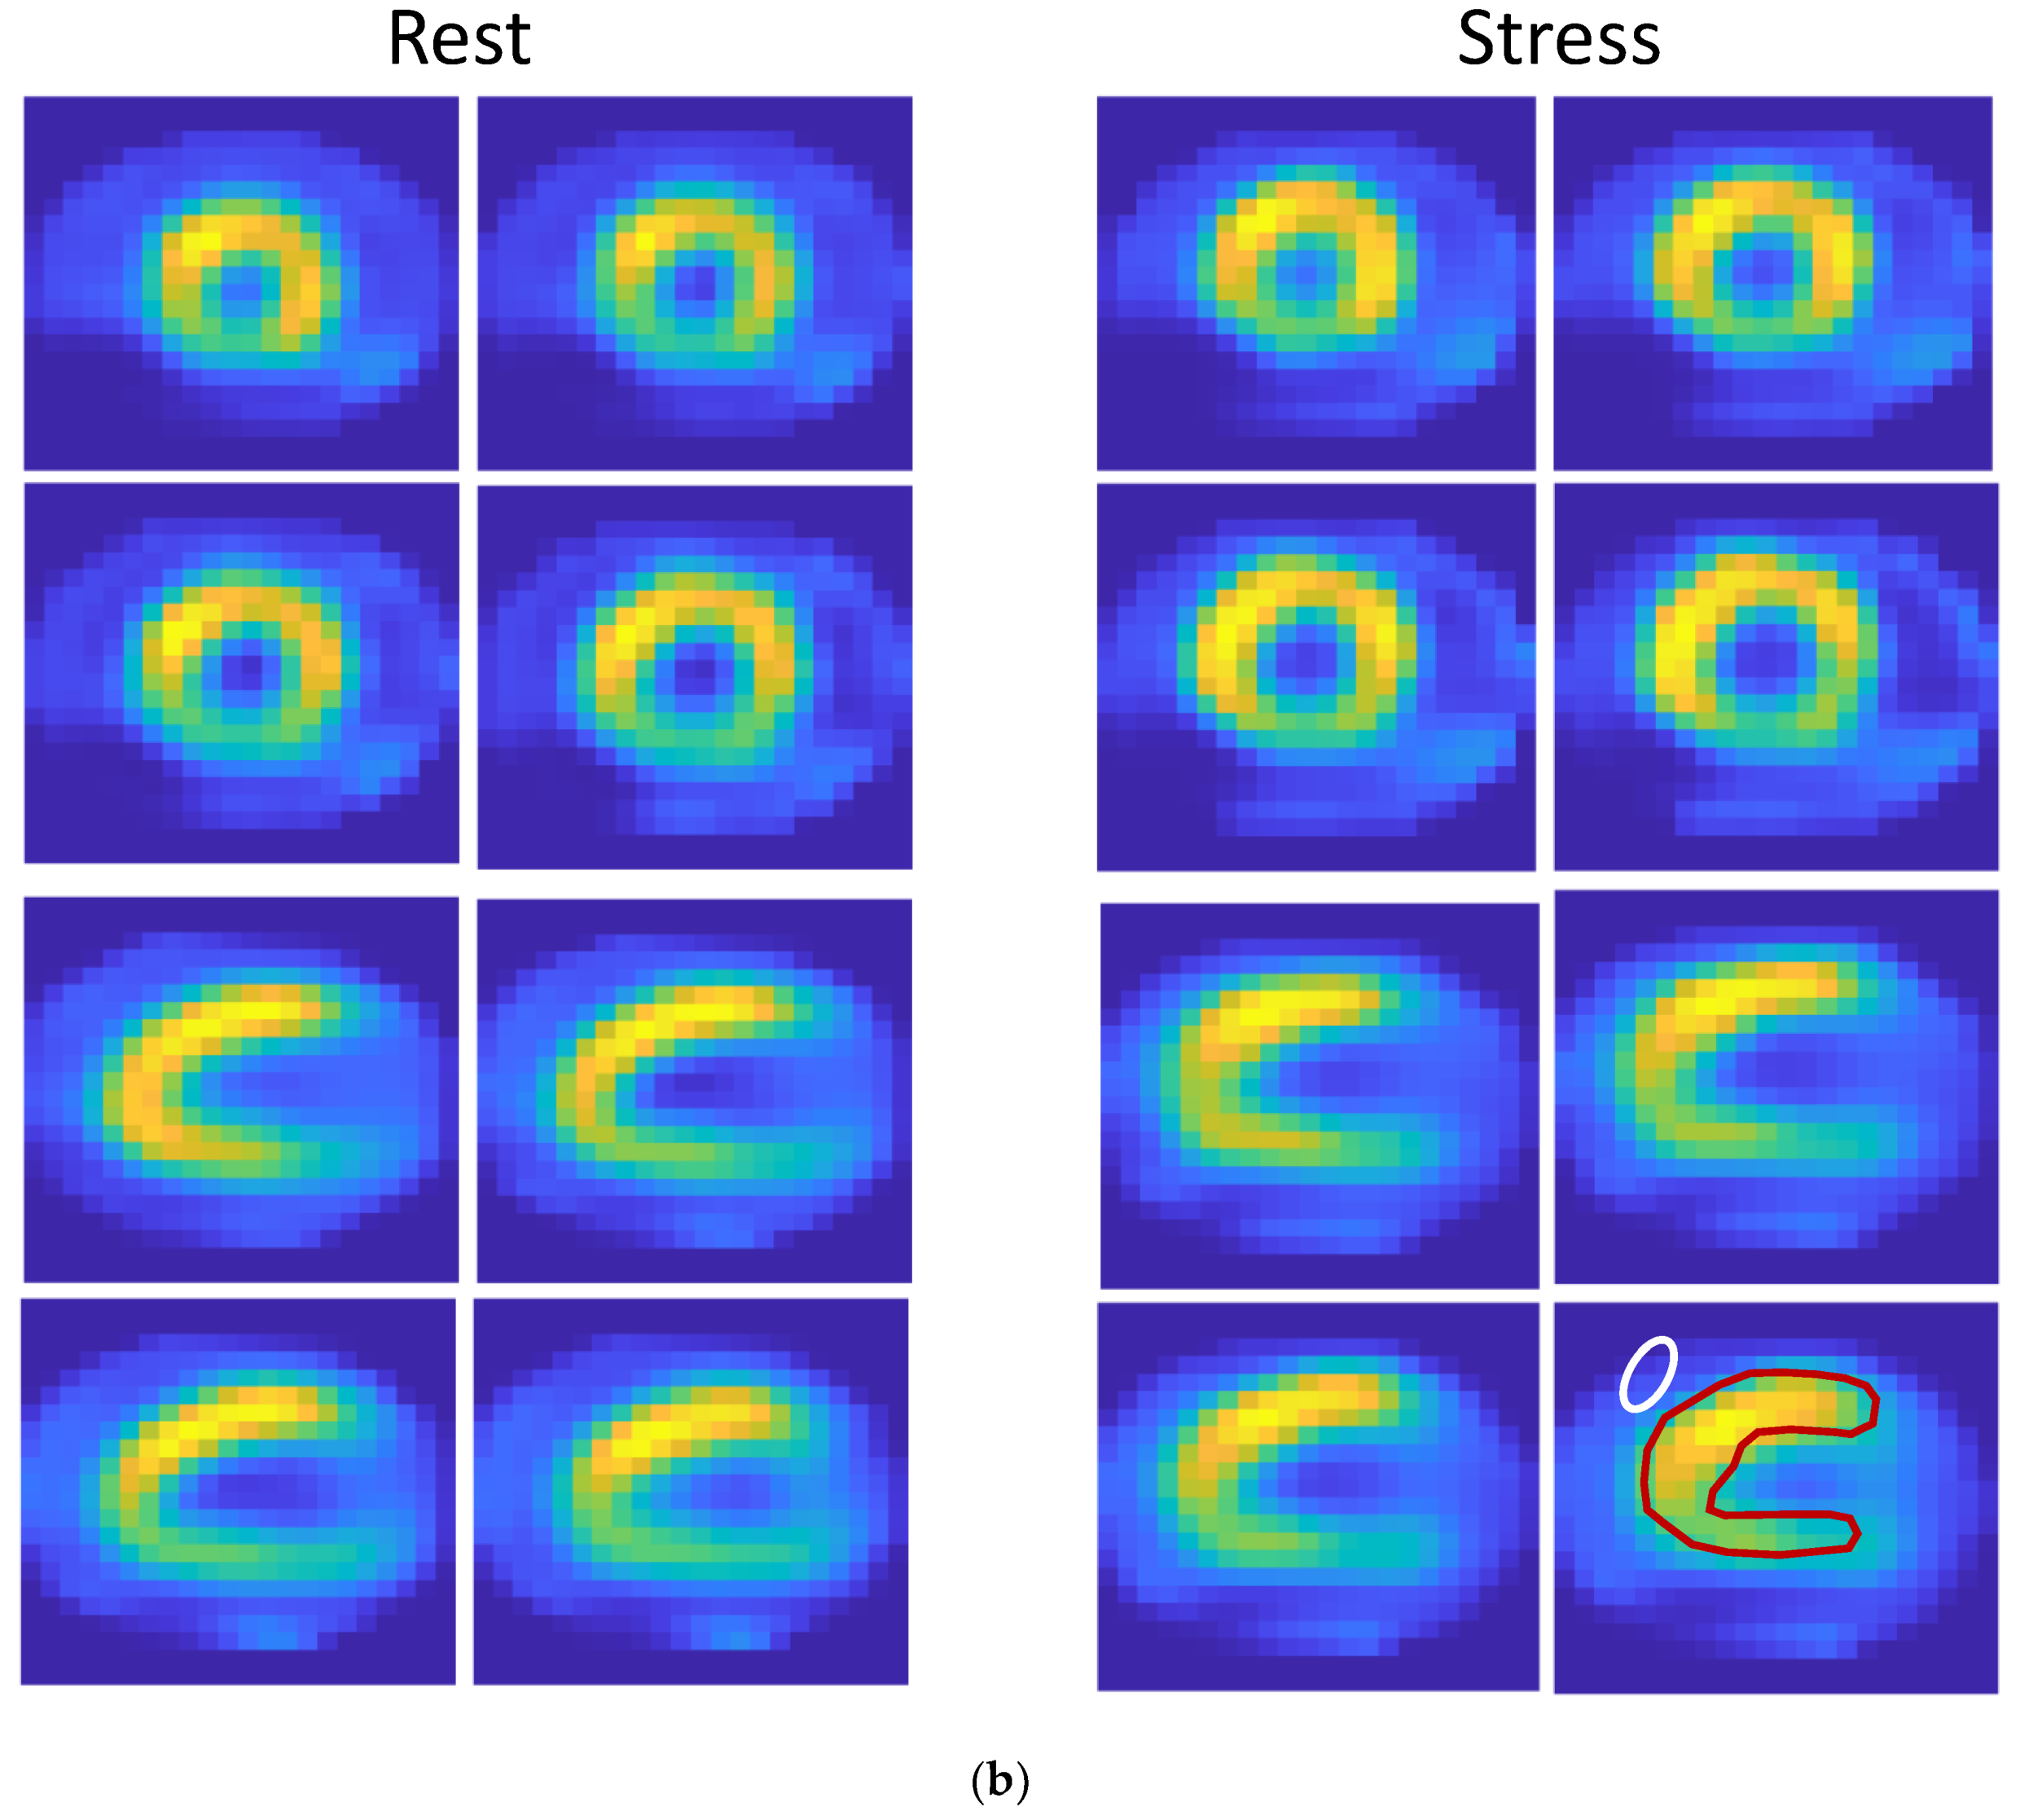
In
Figure 5, cardiac images from a subject in rest (left) and stress (right) conditions are shown. In
Figure 5a,b are images acquired respectively with Alcyone and Discovery. The images are cropped, with a size of 34 × 34 pixels (pixel size of 4 mm) in
Figure 5a and a size of 22 × 22 pixels in
Figure 5b (pixel size of 6.8 mm).
2.3. ROIs Selection from Cardiac Phantom and Clinical Data
On the reconstructed images, two ROIs were selected to determine the indices of interest: one covering the myocardial wall and one ROI in the image background. The ROI covering the myocardium was obtained semi-automatically, starting from the application of the k-means [
31] algorithm on each slice and then improving the segmentation by hand if needed. The ROI relative to the background, of an elliptical shape, was manually drawn on the region determined by the k-means algorithm as not belonging to the myocardial tissue, and an area as homogeneous as possible was selected by hand.
As for the phantom images, the background was very well defined; it had been selected quite correctly by the k-means clustering method. Instead, it was more complex to determine it in the clinical data. In this case, we selected a region that included non-cardiac tissue as a background and placed the elliptical ROI where the tissue was most homogeneous.
The ROIs selection method described was independently applied to each image acquired with Alcyone and with Discovery.
As an example of ROIs, in the last panel, at the bottom right of
Figure 4c and
Figure 5b, ROIs covering myocardium and background were superimposed.
3. Results and Discussion
3.1. System Sensitivity
According to the definition of sensitivity, the total number of photons detected for each acquisition (counts) was divided by the total acquisition time and the dose delivered. Results are shown in
Table 4.
From
Table 4, it can be seen that Alcyone’s performance is more than twice that of Discovery, regardless of the image size considered in Discovery. This is due both to its geometry, designed to reach the heart (or, in this case, the source of radioactivity) closely, and to its detection technology, which allows the acquisition of data in half the time (9 min, compared to about 19 for Discovery). Such results are quite in line with those present in literature [
26,
32].
3.2. Energy Resolution
Energy resolution was evaluated as usually performed during the daily quality control (QC) routine, using a Co-57 phantom. The SPECT system automatically calculates the FWHM% value of the energy spectrum.
For Alcyone, the measurement is repeated for each of the 19 CZT blocks: the data (which, following the Shapiro–Wilk test, resulted in a Gaussian distribution with α = 0.01) were averaged to obtain the energy resolution of the machine; the same was done for Discovery, in which only two measurements are made, one for each rotating head.
The energy resolutions obtained and shown in
Table 5, are in line with those declared in the datasheets of the two machines (see
Table 1), and with values reported in the literature [
33]. The fact that the two scanners differ by almost 0.7 percentage points in our case is probably due to the use of a different isotope than Tc99, which can have a different spectrum conformation.
3.3. Spatial Resolution
Cross-sectional images of the NEMA phantom were used to evaluate the PSF (
Figure 3). For each set available, three different slices were selected and analyzed, located at three different heights along the phantom.
The value in mm corresponding to the FWHM of the PSF of the three-point sources were calculated; tangential and radial resolution (
Figure 3b) values corresponding to each source were averaged.
In
Table 6 the results obtained are shown. Spatial resolution is higher for Alcyone: it is most likely due to Alcyone’s pinhole collimation system, which, compared to parallel hole collimation, allows the source to be zoomed, playing on geometric parameters. Additionally, for spatial resolution, the results obtained are very similar to the ones present in the literature [
26,
32].
3.4. Image Indexes from the Cardiac Phantom
In
Table 7, the SBNR, TBCNR, and uniformity indexes obtained analyzing images of the cardiac phantom acquired on both Alcyone and Discovery are shown.
Discovery shows better performance than Alcyone according to all three indexes, both in images of 128 × 128 pixels, where this better performance is more evident, and in images of 64 × 64 pixels; this is likely due to the fact that the cardiac phantom, as it was built, has no ‘surrounding tissues’, and therefore the scattering and/or attenuation effects are not present, so Discovery is able to focus well on the heart district. Instead, the presence of other tissues between the district of interest and the detectors, as it happens in in vivo acquisitions, should reduce the goodness of the acquisition for Discovery.
3.5. Image Indexes from Patients’ Images
According to the Shapiro–Wilk test, the distributions of the parameters evaluated in the images acquired in vivo from patients were non-Gaussian; therefore, the Wilcoxon rank test for paired data (α = 0.05, n = 11) was adopted to verify that there was a significant difference between the results obtained by the two machines, comparing the values of three parameters between Alcyone and Discovery, for each of the tests (rest and stress). The null hypothesis was rejected, which states that the difference between the pairs of results is due to chance.
Table 8 shows the median and third quartile values obtained for the three indices by the two machines.
As for the SBNR and TBCNR values, which estimate the relationship between signal and noise, Alcyone is better than Discovery. This can be attributed to the design of the machine: by focusing all detectors on the heart, it greatly reduces the contribution of surrounding organs and tissues, as well as that of physiological noise.
In terms of uniformity, however, Discovery’s performance results better. However, it must be considered that this parameter estimates the homogeneity of a certain region: we have selected an ROI that covers the entire left ventricle, and we have given the same weight to all the pixels that belong to the ROI, not taking into account the partial volume effect whereby the pixels furthest in the periphery of the cardiac wall cover both the myocardium and the surrounding tissue, leading to values of the corresponding pixels lower than the pixels containing only the myocardial tissue. Using an algorithm that selects only the internal zones, the results would probably be different; however, this method was chosen to reproduce the perception of the human eye, which tends to focus not on only the inner area of a region of interest but on the entire area.
In
Table 9 the results obtained from image clinical analysis are shown, including LV functional and structural parameters. They confirm results obtained in [
14], where a higher population was considered: an overestimation of both end-diastolic and end-systolic LV volumes from Discovery images, with no impact on EF evaluation.
4. Conclusions
In this work, the two SPECT systems, Discovery NM 530c (Alcyone) and Discovery NM/CT 670, were compared by considering aspects intrinsic to the cameras, such as spatial resolution and count sensitivity and by evaluating some parameters on the reconstructed images.
The two systems exploit the potential of the latest generation CZT detectors, but their spatial arrangement is different, as are the collimators and their arrangement in the head of the camera.
As for the indices considered in the analysis, all of them, with the exception of those relating to the custom-made cardiac phantom, performed better from the Alcyone data than from Discovery ones.
Alcyone represents the standard for cardiac SPECT, and the results obtained in the tests carried out in the present work were clear proof of this. However, the “L” shape of the camera head and the pinhole collimators, designed to focus and enlarge an organ at a short distance from the detectors such as for the heart, make it practically unusable for the acquisition of other organs or tissues.
Instead, the Discovery system is much more versatile: being a general-purpose design, it is suitable for imaging every part of the body; a higher FOV, together with the integration of SPECT and CT technologies, opens up a wide range of examination possibilities, as, for example, in oncology, neurology, and nephrology. It has a non-fixed design, which allows the detectors to be arranged in different configurations according to the investigated district and to acquire any type of patients, regardless of their physical mobility or body mass.
Although, from a clinical point of view, there are no situations in which the dedicated heart scanner can provide clinical information that the general purpose one cannot provide, it should be noted that Alcyone, having a resolution in the cardiac district much higher than Discovery, requires a lower tracer dosage and/or acquisition time to obtain good quality images. The possibility of reducing the injected dose without losing image quality is an extremely useful result, especially when it is required to carry out follow-up studies on cardiopathic patients.
In conclusion, from a technical point of view, it is difficult to state which machine is actually superior to the other as, on the one hand, there are excellent performances aimed at a limited medical field, while, on the other hand, there is excellent potential, slightly lower for cardiac studies, but aimed at a wide range of uses. The finding that Alcyone uses reduced doses for the same image quality is an important additional opportunity in the hands of the cardiologist.
Author Contributions
Conceptualization, P.M. and A.G.; methodology, M.F.S. and V.P.; software, A.M.; data acquisition, A.G. and M.B.; data analysis, A.M., M.S. and M.F.S.; data curation, P.M. and L.L.; writing—original draft preparation, M.F.S., L.L., A.M. and M.S.; supervision, L.L. All authors have read and agreed to the published version of the manuscript.
Funding
This research received no external funding.
Data Availability Statement
Data available on request from the authors.
Acknowledgments
The authors would like to acknowledge the S. Chiara Hospital-Nuclear Medicine Dept. of Pisa, Italy (D. Volterrani) for providing the NEMA phantom, and the CO.RA. SRL Company (Lucca, Italy) for building the cardiac phantom used in this study.
Conflicts of Interest
The authors declare no conflict of interest.
References
- Hutton, B.F. SPECT Imaging: Basics and New Trends. In Handbook of Particle Detection and Imaging; Springer: Berlin/Heidelberg, Germany, 2012; pp. 917–933. [Google Scholar]
- National Research Council (US) and Institute of Medicine (US) Committee on the Mathematics and Physics of Emerging Dynamic Biomedical Imaging. Single Photon Emission Computed Tomography. In Mathematics and Physics of Emerging Biomedical Imaging; National Academy of Sciences: Washington, DC, USA, 1996; Chapter 5; pp. 89–103. [Google Scholar]
- Mazurek, A.; Dziuk, M.; Witkowska-Patena, E.; Piszczek, S.; Gizewska, A. The Utility of Hybrid SPECT/CT Lung Perfusion Scintigraphy in Pulmonary Embolism Diagnosis. Respiration 2015, 90, 393–401. [Google Scholar] [CrossRef]
- Bajc, M.; Jonson, B. Ventilation/Perfusion SPECT for Diagnosis of Pulmonary Embolism and Other Diseases. Int. J. Mol. Imaging 2011, 2011, 1–7. [Google Scholar] [CrossRef] [Green Version]
- Israel, O.; Pellet, O.; Biassoni, L.; De Palma, D.; Estrada-Lobato, E.; Gnanasegaran, G.; Kuwert, T.; la Fougère, C.; Mariani, G.; Massalha, S.; et al. Two decades of SPECT/CT—The coming of age of a technology: An updated review of literature evidence. Eur. J. Nucl. Med. Mol. Imaging 2019, 46, 1990–2012. [Google Scholar] [CrossRef] [PubMed] [Green Version]
- Abbott, B.G.; Case, J.A.; Dorbala, S.; Einstein, A.J.; Galt, J.R.; Pagnanelli, R.; Bullock-Palmer, R.P.; Soman, P.; Wells, R.G. Contemporary Cardiac SPECT Imaging-Innovations and Best Practices: An Information Statement from the American Society of Nuclear Cardiology. Circ. Cardiovasc. Imaging 2018, 11, e000020. [Google Scholar] [CrossRef] [Green Version]
- Malek, H. Nuclear cardiology. In Practical Cardiology; Elsevier: Amsterdam, The Netherlands, 2018; Chapter 9; ISBN 9780323511766. [Google Scholar]
- Dorbala, S.; Ananthasubramaniam, K.; Armstrong, I.S.; Chareonthaitawee, P.; DePuey, E.G.; Einstein, A.J.; Gropler, R.J.; Holly, T.A.; Mahmarian, J.J.; Park, M.A.; et al. Single Photon Emission Computed Tomography (SPECT) Myocardial Perfusion Imaging Guidelines: Instrumentation, Acquisition, Processing, and Interpretation. J. Nucl. Cardiol. 2018, 25, 1784–1846. [Google Scholar] [CrossRef] [Green Version]
- Santarelli, M.F.; Genovesi, D.; Positano, V.; Di Sarlo, R.; Scipioni, M.; Giorgetti, A.; Landini, L.; Marzullo, P. Cardiac amyloidosis detection by early bisphosphonate (99mTc-HMDP) scintigraphy. J. Nucl. Cardiol. 2020. [Google Scholar] [CrossRef]
- Santarelli, M.F.; Scipioni, M.; Genovesi, D.; Giorgetti, A.; Marzullo, P.; Landini, L. Imaging Techniques as an Aid in the Early Detection of Cardiac Amyloidosis. Curr. Pharm. Des. 2020, 26, 1–12. [Google Scholar] [CrossRef] [PubMed]
- Jing Wu, C.L. Recent advances in cardiac SPECT instrumentation and imaging methods. Phys. Med. Biol. 2019, 64, 06TR01. [Google Scholar] [CrossRef]
- Buechel, R.R.; Pazhenkottil, A.P.; Herzog, B.A.; Husmann, L.; Nkoulou, R.N.; Burger, I.A.; Valenta, I.; Wyss, C.A.; Ghadri, J.R.; Kaufmann, P.A. Real-time breath-hold triggering of myocardial perfusion imaging with a novel cadmium-zinc-telluride detector gamma camera. Eur. J. Nucl. Med. Mol. Imaging 2010, 37, 1903–1908. [Google Scholar] [CrossRef] [PubMed] [Green Version]
- Mouden, M.; Timmer, J.R.; Ottervanger, J.P.; Reiffers, S.; Oostdijk, A.H.J.; Knollema, S.; Jager, P.L. Impact of a new ultrafast CZT SPECT camera for myocardial perfusion imaging: Fewer equivocal results and lower radiation dose. Eur. J. Nucl. Med. Mol. Imaging 2012, 39, 1048–1055. [Google Scholar] [CrossRef] [PubMed]
- Gimelli, A.; Liga, R.; Bertasi, M.; Kusch, A.; Marzullo, P. Head-to-head comparison of a CZT-based all-purpose SPECT camera and a dedicated CZT cardiac device for myocardial perfusion and functional analysis. J. Nucl. Cardiol. 2019. [Google Scholar] [CrossRef]
- Niimi, T.; Nanasato, M.; Sugimoto, M.; Maeda, H. Evaluation of Cadmium-Zinc-Telluride Detector-based Single-Photon Emission Computed Tomography for Nuclear Cardiology: A Comparison with Conventional Anger Single-Photon Emission Computed Tomography. Nucl. Med. Mol. Imaging 2017, 51, 331–337. [Google Scholar] [CrossRef] [PubMed]
- Iniewski, K. CZT detector technology for medical imaging. J. Instrum. 2014, 9, C11001. [Google Scholar] [CrossRef]
- Barber, H.B.; Barrett, H.H.; Augustine, F.L.; Hamilton, W.J.; Apotovsky, B.A.; Dereniak, E.L.; Doty, F.P.; Eskin, J.D.; Garcia, J.P.; Marks, D.G.; et al. Development of a 64 × 64 CdZnTe array and associated readout integrated circuit for use in nuclear medicine. J. Electron. Mater. 1997, 26, 765–772. [Google Scholar] [CrossRef]
- Van Audenhaege, K.; Van Holen, R.; Vandenberghe, S.; Vanhove, C.; Metzler, S.D.; Moore, S.C. Review of SPECT collimator selection, optimization, and fabrication for clinical and preclinical imaging. Med. Phys. 2015, 42, 4796–4813. [Google Scholar] [CrossRef] [PubMed] [Green Version]
- Dey, J. Improvement of performance of cardiac SPECT camera using curved detectors with pinholes. IEEE Trans. Nucl. Sci. 2012, 59, 334–337. [Google Scholar] [CrossRef]
- Funk, T.; Kirch, D.L.; Koss, J.E.; Botvinick, E.; Hasegawa, B.H. A novel approach to multipinhole SPECT for myocardial perfusion imaging. J. Nucl. Med. 2006, 47, 595–602. [Google Scholar] [PubMed]
- Bruyant, P.P. Analytic and iterative reconstruction algorithms in SPECT. J. Nucl. Med. 2002, 43, 1343–1358. [Google Scholar]
- Jin, M.; Niu, X.; Qi, W.; Yang, Y.; Dey, J.; King, M.A.; Dahlberg, S.; Wernick, M.N. 4D reconstruction for low-dose cardiac gated SPECT. Med. Phys. 2013, 40, 1–12. [Google Scholar] [CrossRef] [PubMed]
- Ljungberg, M.; Pretorius, P.H. SPECT/CT: An update on technological developments and clinical applications. Br. J. Radiol. 2018, 91, 20160402. [Google Scholar] [CrossRef]
- Erlandsson, K.; Kacperski, K.; Van Gramberg, D.; Hutton, B.F. Performance evaluation of D-SPECT: A novel SPECT system for nuclear cardiology. Phys. Med. Biol. 2009, 54, 2635–2649. [Google Scholar] [CrossRef]
- Verberne, H.J.; Acampa, W.; Anagnostopoulos, C.; Ballinger, J.; De Bondt, P.; Buechel, R.R.; Cuocolo, A.; Van Eck-Smit, B.L.F.; Flotats, A.; Hacker, M.; et al. EANM procedural guidelines for radionuclide myocardial perfusion imaging with SPECT and SPECT/CT: 2015 revision. Eur. J. Nucl. Med. Mol. Imaging 2015, 42, 1929–1940. [Google Scholar] [CrossRef] [Green Version]
- Imbert, L.; Poussier, S.; Franken, P.R.; Songy, B.; Verger, A.; Morel, O.; Wolf, D.; Noel, A.; Karcher, G.; Marie, P.Y. Compared performance of high-sensitivity cameras dedicated to myocardial perfusion SPECT: A comprehensive analysis of phantom and human images. J. Nucl. Med. 2012, 53, 1897–1903. [Google Scholar] [CrossRef] [Green Version]
- National Electrical Manufacturers Association. NEMA Standards Publication NU 2-2007. 2007. Available online: https://psec.uchicago.edu/library/applications/PET/chien_min_NEMA_NU2_2007.pdf (accessed on 9 September 2021).
- Henzlova, M.J.; Duvall, W.L.; Einstein, A.J.; Travin, M.I.; Verberne, H.J. ASNC imaging guidelines for SPECT nuclear cardiology procedures: Stress, protocols, and tracers. J. Nucl. Cardiol. 2016, 23, 606–639. [Google Scholar] [CrossRef] [PubMed] [Green Version]
- Hyafil, F.; Gimelli, A.; Slart, R.H.J.A.; Georgoulias, P.; Rischpler, C.; Lubberink, M.; Sciagra, R.; Bucerius, J.; Agostini, D.; Verberne, H.J. EANM procedural guidelines for myocardial perfusion scintigraphy using cardiac-centered gamma cameras. Eur. J. Hybrid Imaging 2019, 3, 11. [Google Scholar] [CrossRef] [PubMed] [Green Version]
- Münch, G.; Neverve, J.; Matsunari, I.; Schröter, G.; Schwaiger, M. Myocardial technetium-99m-tetrofosmin and technetium-99m-sestamibi kinetics in normal subjects and patients with coronary artery disease. J. Nucl. Med. 1997, 38, 428–432. [Google Scholar] [PubMed]
- Lloyd, S.P. Least Squares Quantization in PCM. IEEE Trans. Inf. Theory 1982, 28, 129–137. [Google Scholar] [CrossRef]
- Bocher, M.; Blevis, I.M.; Tsukerman, L.; Shrem, Y.; Kovalski, G.; Volokh, L. A fast cardiac gamma camera with dynamic SPECT capabilities: Design, system validation and future potential. Eur. J. Nucl. Med. Mol. Imaging 2010, 37, 1887–1902. [Google Scholar] [CrossRef] [PubMed] [Green Version]
- Takahashi, M.; Miyazaki, Y.; Kondo, A.; Ehara, T.; Koga, K.; Matsunari, I. Performance Evaluation of the Discovery NM/CT 670 CZT. J. Nucl. Med. 2019, 59, 1835. [Google Scholar]
Figure 1.
SPECT Alcyone. (a) the tomograph, (b) schematic representation of detectors configuration; (c) pin-holes collimators disposition.
Figure 1.
SPECT Alcyone. (a) the tomograph, (b) schematic representation of detectors configuration; (c) pin-holes collimators disposition.
Figure 2.
Discovery NM/CT 670 CZT system: (a) the machine, (b) detectors arrangement.
Figure 2.
Discovery NM/CT 670 CZT system: (a) the machine, (b) detectors arrangement.
Figure 3.
NEMA phantom, with examples of images acquired with Alcyone and Discovery. (a) the phantom; (b) schematic representation of the lines along which the FWHM of the PSF was considered for spatial resolution evaluation; (c) example image acquired from Alcyone; (d) example image acquired by Discovery.
Figure 4.
Custom-made cardiac phantom; (a) the phantom; (b) example images from Alcyone, slices are in the short axis (upper row) and long axis (lower row) views; (c) example images from Discovery; slices are in the short axis (upper row) and long axis (lower row). In the lower right image in (c), the ROIs covering the phantom (in red) and the background (in blue) are shown as an example to show where ROIs have been selected for numerical analysis (i.e., uniformity, SBNR, and TCBNR).
Figure 5.
Images from a patient, in rest and stress conditions; the first two rows are relevant to cardiac short axis views; the last two rows are long axis views. (a) Images acquired by Alcyone (b); images acquired by Discovery. In the lower right image in b, the ROIs covering myocardium (in red) and background (in white) are shown as an example to show where ROIs have been selected for numerical analysis (i.e., uniformity, SBNR, and TCBNR).
Table 1.
Technical characteristics of the two machines.
Table 1.
Technical characteristics of the two machines.
| Parameters | Alcyone
(Discovery NM 530c) | Discovery
(Discovery NM/CT 670) |
|---|
| Energy range (CZT) | 40–200 KeV | 40–250 KeV |
| Sensor spatial resolution | 2.46 mm | 2.46 mm |
| Energy resolution (FWHM) | ≤6.2% @140 KeV | ≤6.3% @20 Kpcs |
| Acquisition matrix size | 70 × 70 | 64 × 64, 128 × 128, 256 × 256 |
| Reconstructed voxel size | 4 mm | 6.7994, 3.3997, 1.6998 mm |
Table 2.
Acquisition parameters used for scanning the NEMA phantom.
Table 2.
Acquisition parameters used for scanning the NEMA phantom.
| | Alcyone
(Discovery NM 530c) | Discovery
(Discovery NM/CT 670) |
|---|
| | 70 × 70 | 64 × 64 | 128 × 128 |
| Input dose | 545.4 μCi (20.18 MBq) | 545.4 μCi (20.18 MBq) |
| Acquisition time | 9 min | 18.58 min (30 s/view) |
| Counts | 5,937,831 | 4,869,045 | 4,660,727 |
| Attenuation Correction | none | none |
Table 3.
Acquisition parameters used for scanning the cardiac phantoms.
Table 3.
Acquisition parameters used for scanning the cardiac phantoms.
| | Alcyone
(Discovery NM 530c) | Discovery
(Discovery NM/CT 670) |
|---|
| | 70 × 70 | 64 × 64 | 128 × 128 |
| Input dose | 633.0 μCi (23.42 MBq) | 633.0 μCi (23.42 MBq) |
| Acquisition time | 9 min | 18.58 min (30 s/view) |
| Counts | 2,900,342 | 2,049,226 | 1,961,438 |
| Attenuation Correction | none | none |
Table 4.
Sensitivity values.
Table 4.
Sensitivity values.
| | Alcyone
(Discovery NM 530c) | Discovery
(Discovery NM/CT 670) |
|---|
| | 70 × 70
(4 mm) | 64 × 64
(6.7994 mm) | 128 × 128
(3.3997 mm) |
| Counts | 5,937,831 | 4,869,045 | 4,660,727 |
| Sensitivity (cps/MBq) | 544.89 | 212.02 | 202.95 |
Table 5.
Energy resolution.
Table 5.
Energy resolution.
Alcyone.
(Discovery NM 530c) | Discovery
(Discovery NM/CT 670) |
|---|
| Mean (std) | Mean (std) |
|---|
| 6.089 (0.384) | 6.769 (0.043) |
Table 6.
Spatial resolution evaluation.
Table 6.
Spatial resolution evaluation.
| | Alcyone
(Discovery NM 530c) | Discovery
(Discovery NM/CT 670) |
|---|
| | 70 × 70
(4 mm) | 64 × 64
(6.7994 mm) | 128 × 128
(3.3997 mm) |
|---|
| | Mean (std) | Mean (std) | Mean (std) |
|---|
| X, center (Ax) | 6.667 (0.191) | 14.664 (0.758) | 10.222 (0.097) |
| Y, center (Ay) | 7.747 (0.247) | 15.661 (0.754) | 10.108 (0.163) |
| X, tang. (Bx) | 5.373 (0.543) | 14.868 (0.306) | 9.508 (0.058) |
| Y, rad. (By) | 4.6 (0.01) | 15.684 (0.669) | 9.61 (0.223) |
| X, radial. (Cx) | 6.173 (0.154) | 13.372 (0.224) | 10.04 (0.089) |
| Y, tang. (Cy) | 5.453 (0.309) | 19.401 (1.715) | 10.675 (0.147) |
Table 7.
SBNR, TBCNR, and uniformity indexes from cardiac phantom.
Table 7.
SBNR, TBCNR, and uniformity indexes from cardiac phantom.
| | Alcyone
(Discovery NM 530c) | Discovery
(Discovery NM/CT 670) |
|---|
| | 70 × 70
(4 mm) | 64 × 64
(6.7994 mm) | 128 × 128
(3.3997 mm) |
|---|
| SBNR | 16.6 | 17.4 | 30.7 |
| TBNR | 15.5 | 15.7 | 27.6 |
| Uniformity | 11 | 3.5 | 9.8 |
Table 8.
SBNR, TBCNR, and uniformity indexes from patients.
Table 8.
SBNR, TBCNR, and uniformity indexes from patients.
| Rest | Stress |
|---|
SBNR
Median (3° quart.) | TBCNR
Median (3° quart.) | Uniformity
Median (3° quart.) | SBNR
Median (3° quart.) | TBCNR
Median (3° quart.) | Uniformity
Median (3° quart.) |
|---|
Alcyone
(Discovery NM 530c) |
| 12.54 (20.49) | 10.04 (16.61) | 17.11 (17.89) | 12.90 (20.38) | 10.89 (15.99) | 16.70 (18.24) |
Discovery
(Discovery NM/CT 670) |
| 10.72 (11.93) | 6.68
(7.52) | 12.32 (13.71) | 7.73
(9.62) | 5.312 (6.19) | 13.68 (15.19) |
Table 9.
Clinical parameters results.
Table 9.
Clinical parameters results.
| Parameter | Alcyone
(Discovery NM 530c) | Discovery
(Discovery NM/CT 670) | P for Difference |
|---|
| | Mean (std) | Mean (std) | |
|---|
| LV mass (g) | 125.09 (25.14) | 124.64 (26.87) | 0.43 |
| LV function at rest | | | |
| End-diastolic volume (EDV) (mL) | 88.90 (28.26) | 96.18 (26.51) | 0.004 |
| End-systolic volume (mL) | 30.82 (21.80) | 36.09 (18.17) | 0.02 |
| Ejection fraction (EF) | 70.09 (11.06) | 68.45 (6.31) | 0.22 |
| LV function after stress | | | |
| End-diastolic volume (EDV) (mL) | 84.55 (25.19) | 89.64 (25.40) | 0.023 |
| End-systolic volume (mL) | 29.27 (19.04) | 35.18 (17.89) | <0.001 |
| Ejection fraction (EF) | 69.73 (8.45) | 67.55 (6.20) | 0.049 |
| Publisher’s Note: MDPI stays neutral with regard to jurisdictional claims in published maps and institutional affiliations. |
© 2021 by the authors. Licensee MDPI, Basel, Switzerland. This article is an open access article distributed under the terms and conditions of the Creative Commons Attribution (CC BY) license (https://creativecommons.org/licenses/by/4.0/).


 ,
, 


