
Impact of Inter-Gateway Distance on LoRaWAN Performance


Abstract
:1. Introduction
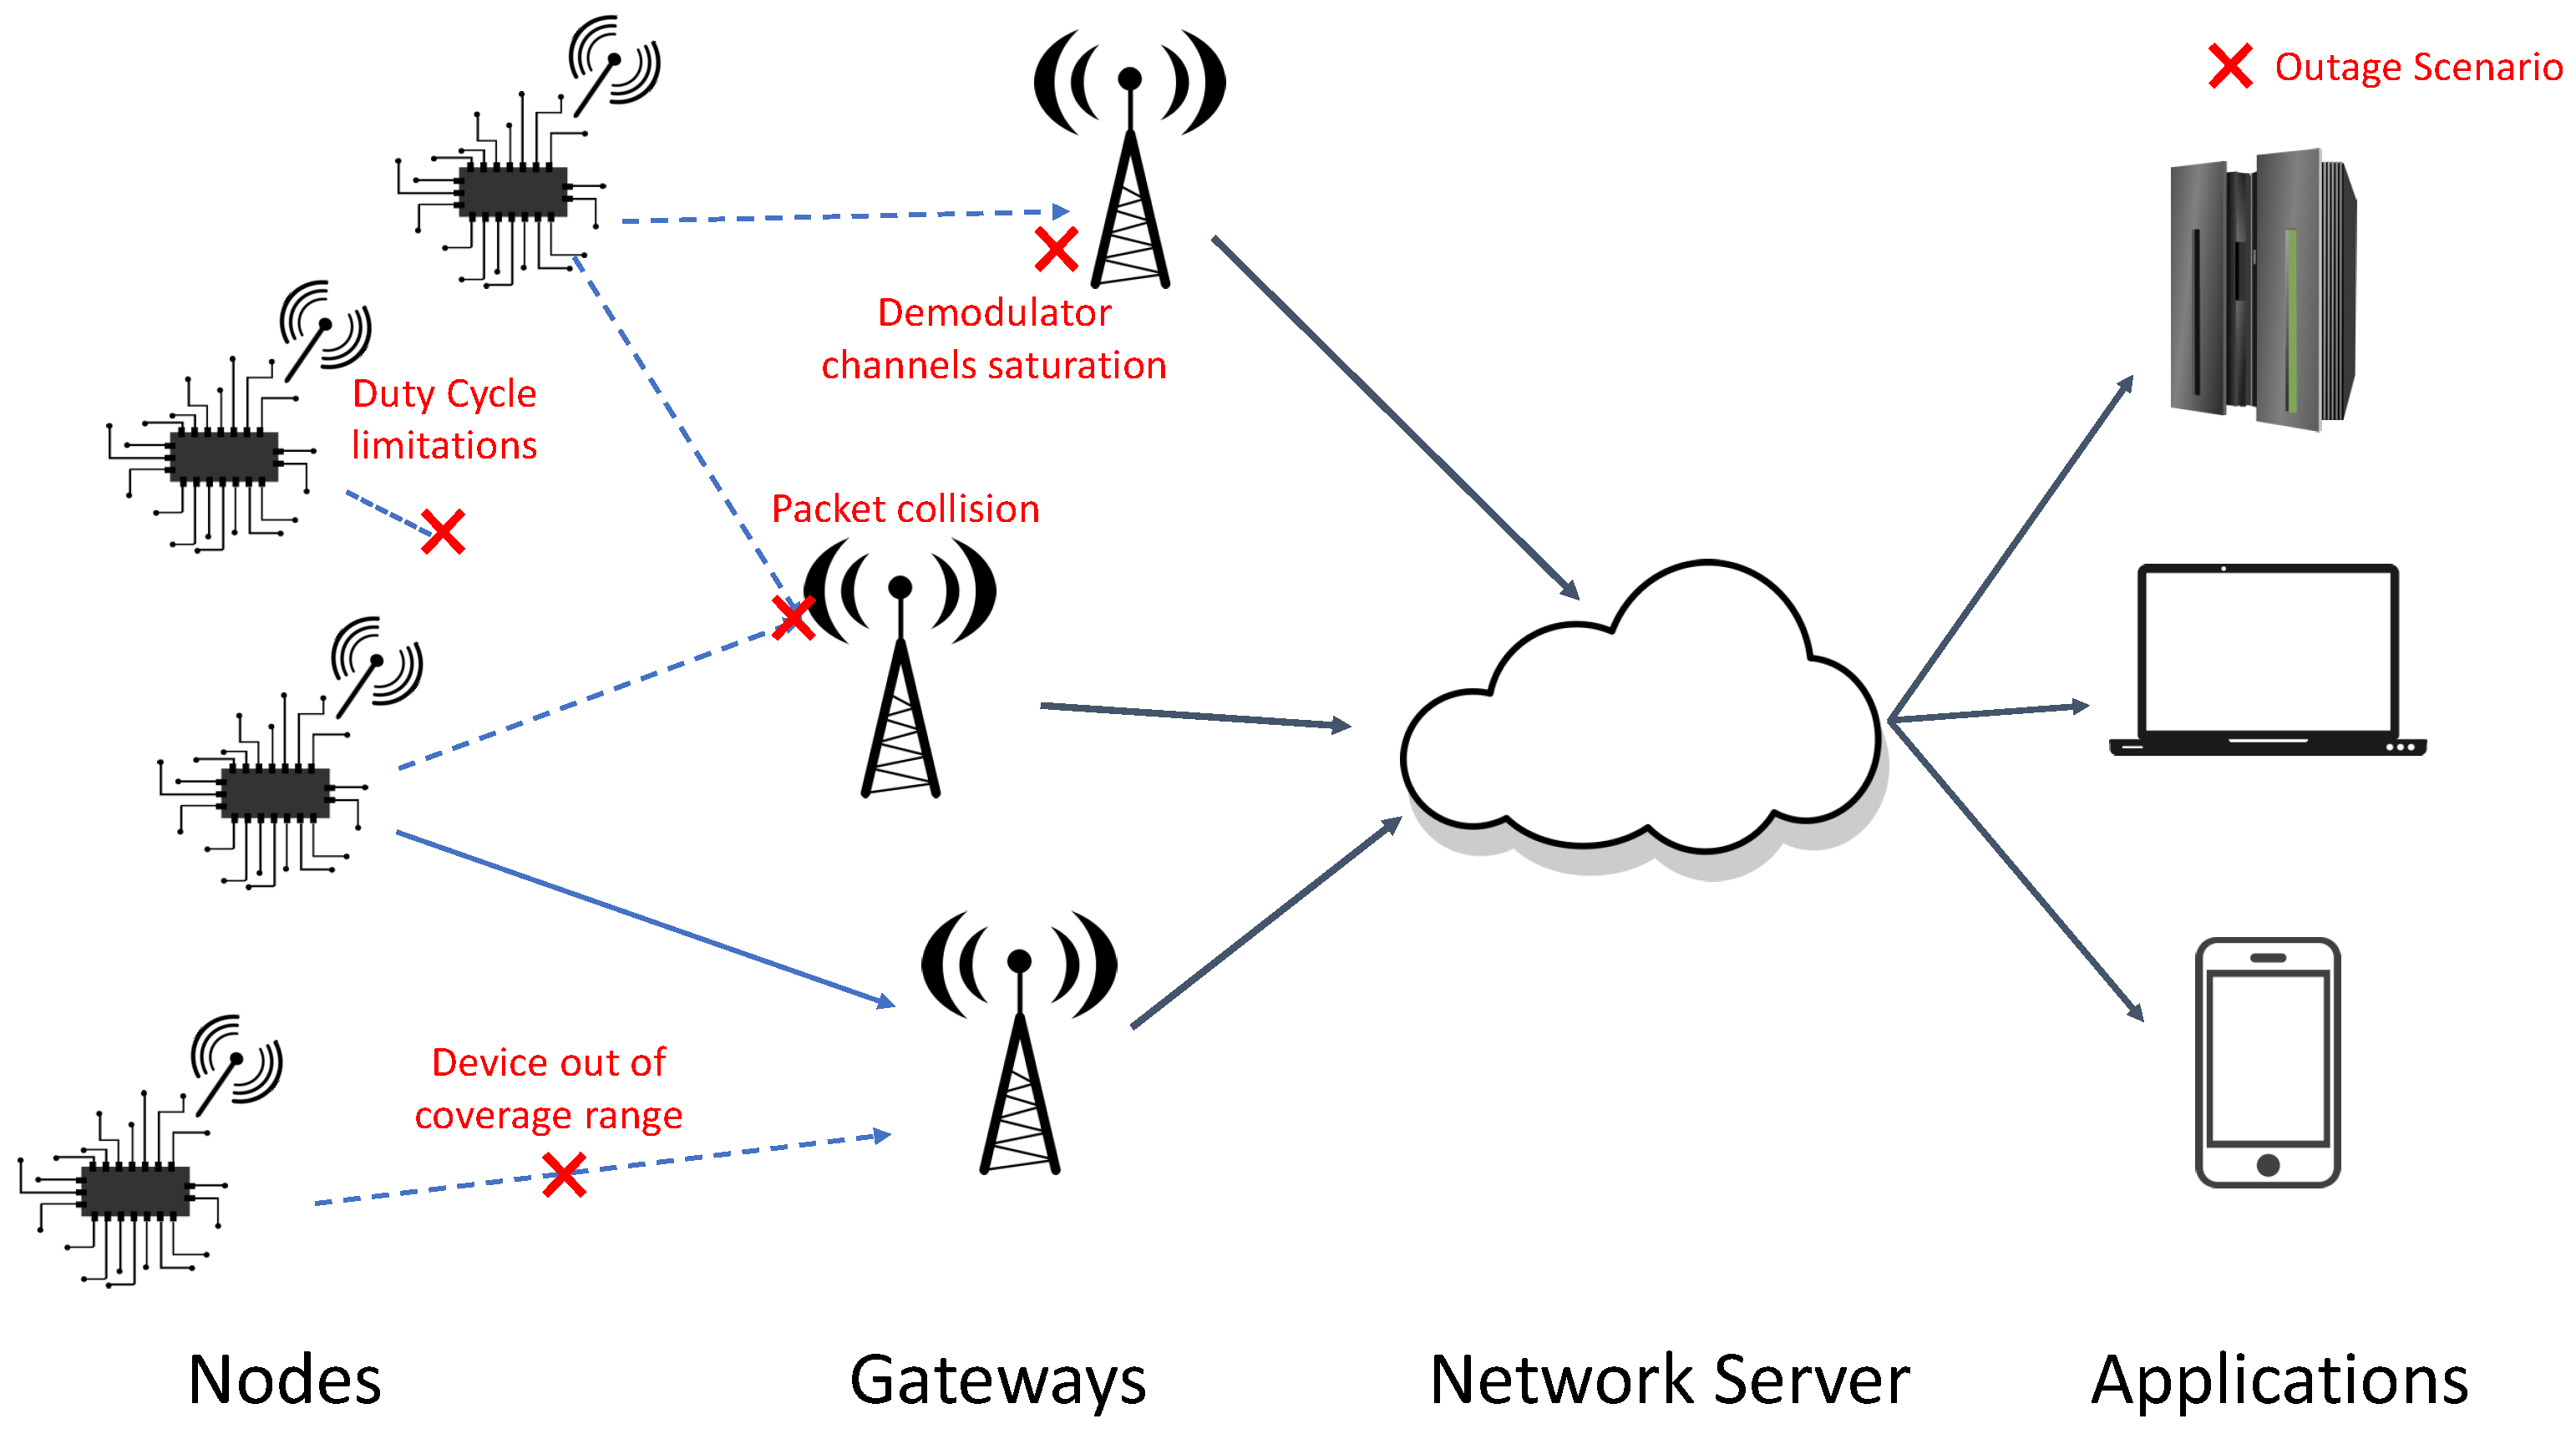
- First, we develop a comprehensive list of the known outage conditions in a practical, uplink-only, LoRaWAN network.
- Then, using the NS-3 discrete-time simulator, the weight of each outage condition on the overall QoS of a two-gateway LoRaWAN network is also assessed, as a factor of the inter-gateway distance.
2. LoRaWAN Outage Conditions
2.1. Duty Cycle Limitations
- = time-of-silence required after transmission;
- = time-on-air;
- = duty cycle.
- = the maximum operator, selecting the highest value between the two inputs;
- = number of payload bytes, including 13 additional bytes if header is present;
- = Spreading Factor;
- H = 0 if header is present, or 1 if not;
- = 0 or 1, depending on whether low data rate optimisation is present;
- = Coding Rate from 1 to 4 (being 4/4 + CR).
2.2. Device Out of Coverage Range
- (dB) being the path loss at the reference distance , calculated using the Friis free-space path loss model;
- d is the distance between the transmitter and the receiver;
- is the reference distance;
- is the path loss exponent;
- is a variable that can be used to model slow and fast fading.

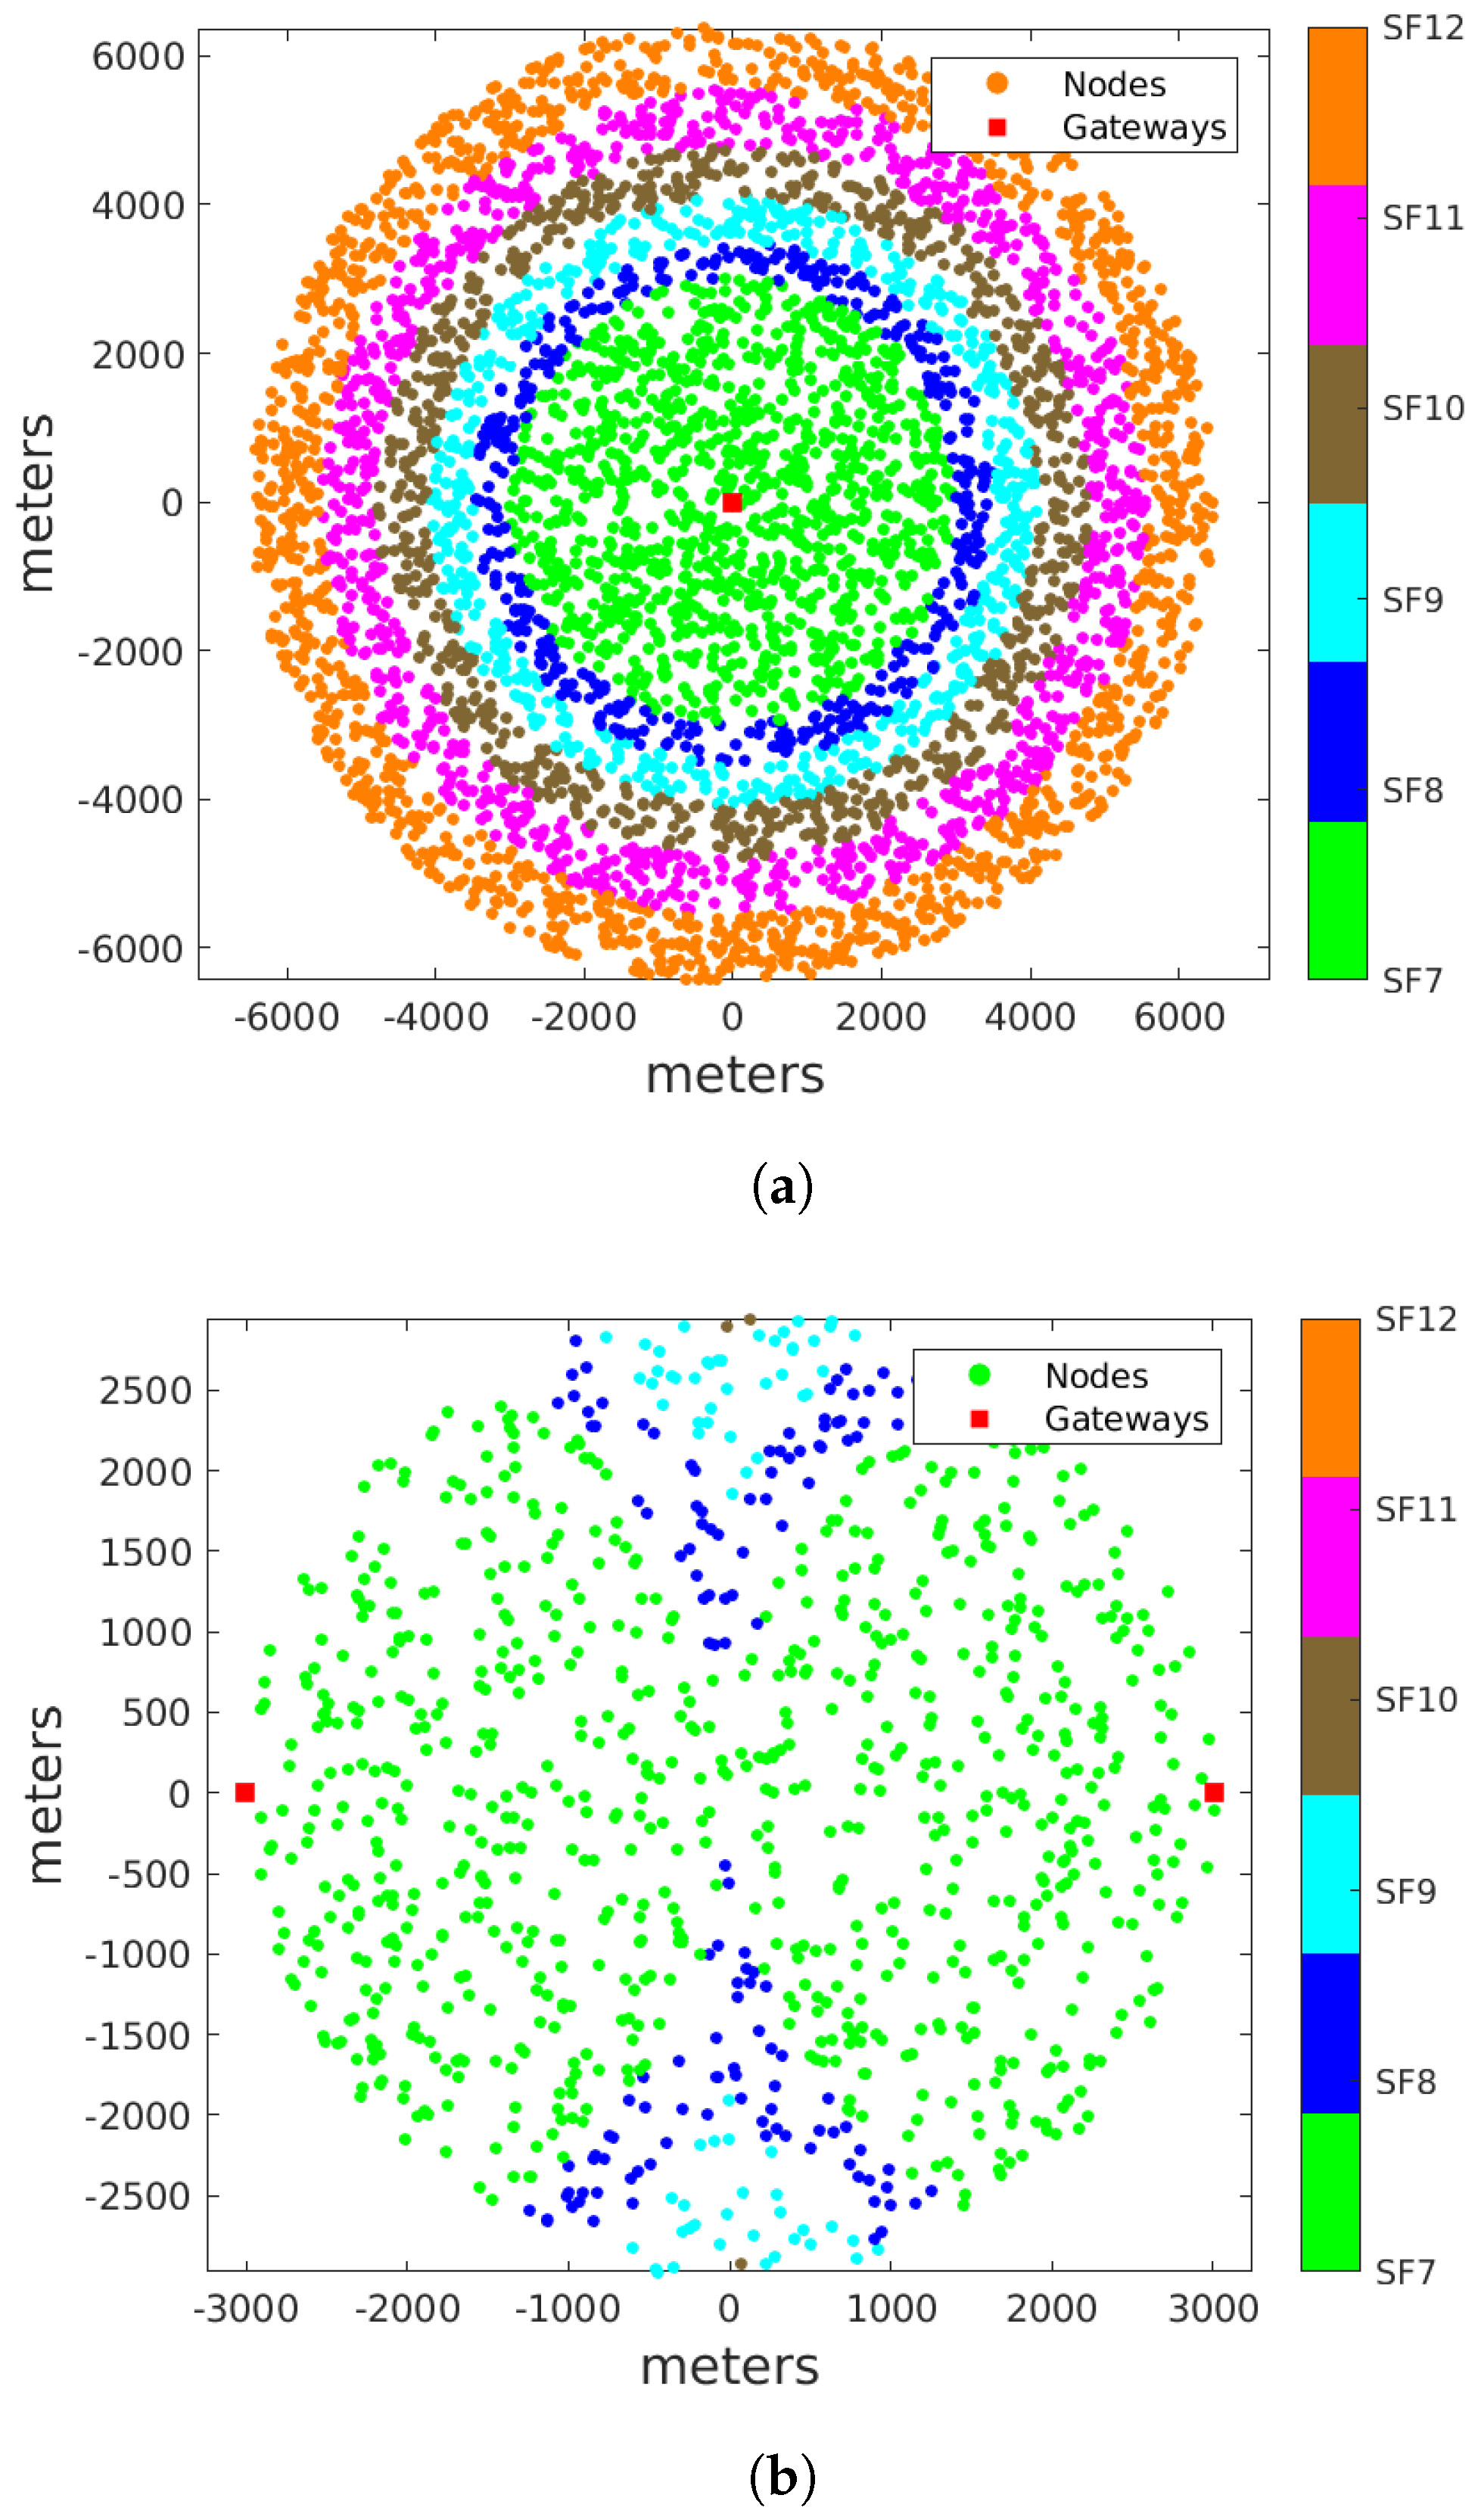
| SF | SNRmin @ Rx (dB) a | SGW (dB) b | Rmax (m) c | AoD (km2) d |
|---|---|---|---|---|
| 7 | −7.5 | −124.5 | 3011 | 28 |
| 8 | −10 | −127 | 3509 | 10.2 |
| 9 | −12.5 | −129.5 | 4089 | 13.84 |
| 10 | −15 | −132 | 4766 | 18.83 |
| 11 | −17.5 | −134.5 | 5554 | 25.54 |
| 12 | −20 | −137 | 6473 | 34.72 |
2.3. Demodulator Channels Saturation
2.4. Packet Collision
3. Related Works
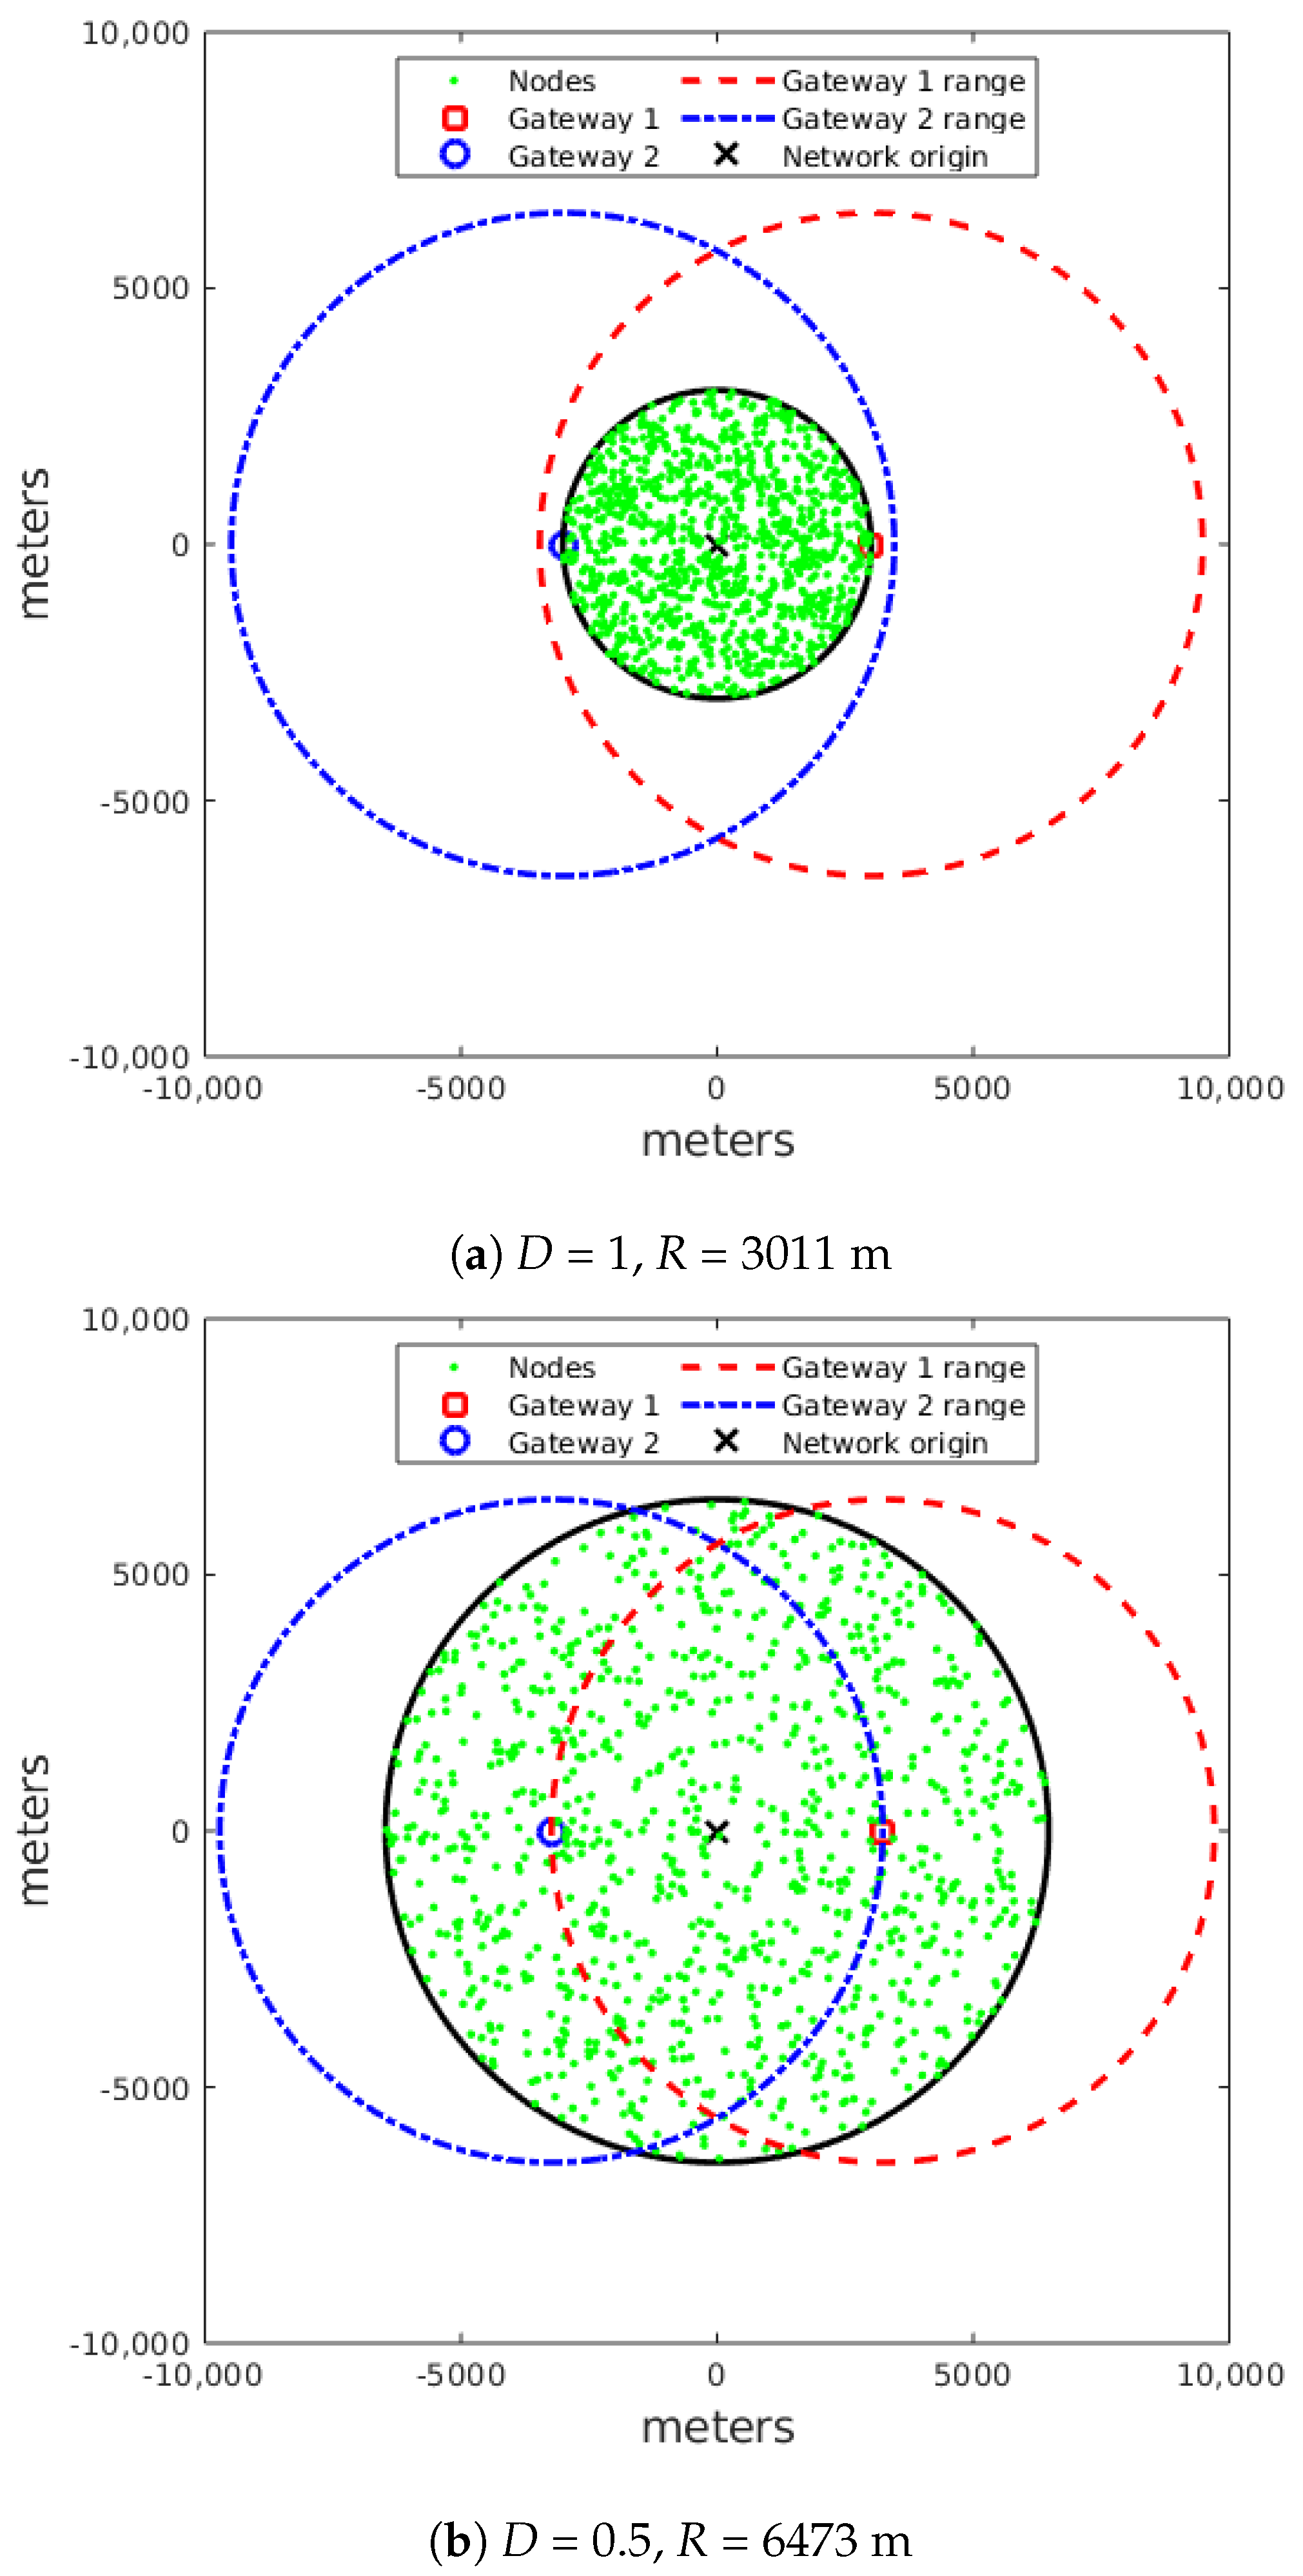
4. System Model and Simulation Setup
- = maximum distance a node can be from a gateway on a given SF, from Table 1;
- = radius of the network deployment.
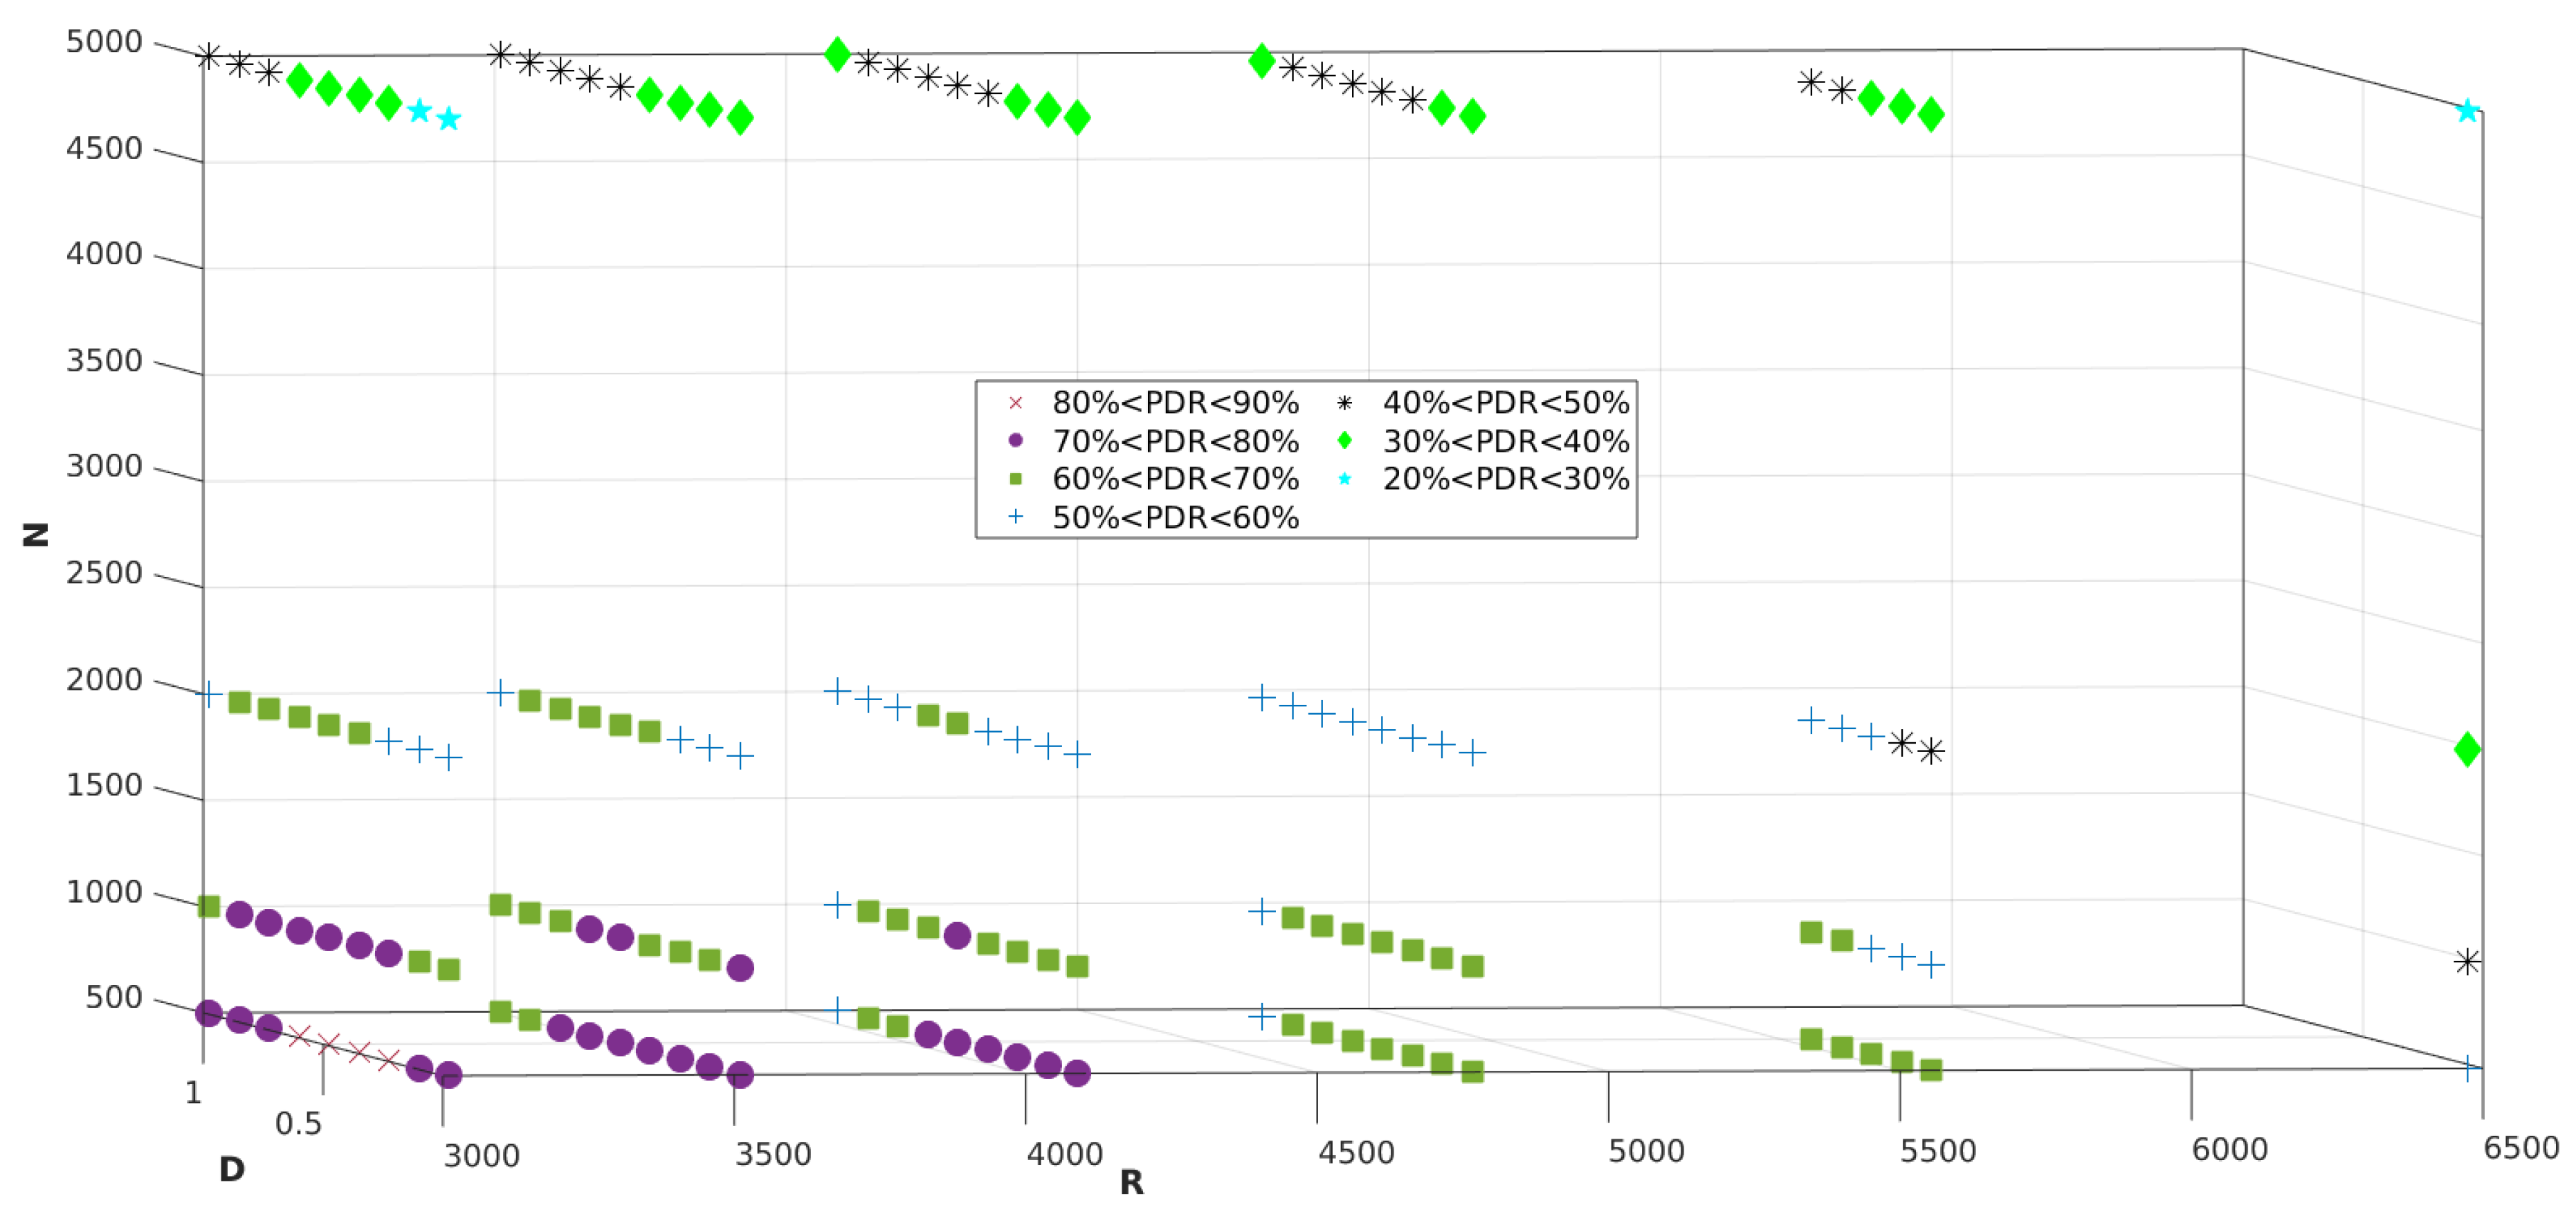
5. Simulation Results
6. Conclusions
Author Contributions
Funding
Data Availability Statement
Acknowledgments
Conflicts of Interest
References
- Augustin, A.; Yi, J.; Clausen, T.; Townsley, W.M. A study of Lora: Long range & low power networks for the internet of things. Sensors 2016, 16, 1466. [Google Scholar] [CrossRef]
- Centenaro, M.; Vangelista, L.; Zanella, A.; Zorzi, M. Long-range communications in unlicensed bands: The rising stars in the IoT and smart city scenarios. IEEE Wirel. Commun. 2016, 23, 60–67. [Google Scholar] [CrossRef] [Green Version]
- Sanchez-Iborra, R.; Cano, M.D. State of the art in LP-WAN solutions for industrial IoT services. Sensors 2016, 16, 708. [Google Scholar] [CrossRef] [PubMed]
- Adelantado, F.; Vilajosana, X.; Tuset-Peiro, P.; Martinez, B.; Melia-Segui, J.; Watteyne, T. Understanding the Limits of LoRaWAN. IEEE Commun. Mag. 2017, 55, 34–40. [Google Scholar] [CrossRef] [Green Version]
- Georgiou, O.; Raza, U. Low Power Wide Area Network Analysis: Can LoRa Scale? IEEE Wirel. Commun. Lett. 2017, 6, 162–165. [Google Scholar] [CrossRef] [Green Version]
- Georgiou, O.; Psomas, C.; Skouroumounis, C.; Krikidis, I. Optimal Non-Uniform Deployments of LoRa Networks. IEEE Wirel. Commun. Lett. 2020, 9, 1919–1923. [Google Scholar] [CrossRef]
- Georgiou, O.; Psomas, C.; Krikidis, I. Coverage Scalability Analysis of Multi-Cell LoRa Networks. In Proceedings of the IEEE International Conference on Communications, Dublin, Ireland, 7–11 June 2020. [Google Scholar] [CrossRef]
- Sørensen, R.B.; Razmi, N.; Nielsen, J.J.; Popovski, P. Analysis of LoRaWAN Uplink with Multiple Demodulating Paths and Capture Effect. In Proceedings of the IEEE International Conference on Communications, Shanghai, China, 20–24 May 2019. [Google Scholar] [CrossRef] [Green Version]
- Mahmood, A.; Sisinni, E.; Guntupalli, L.; Rondon, R.; Hassan, S.A.; Gidlund, M. Scalability Analysis of a LoRa Network under Imperfect Orthogonality. IEEE Trans. Ind. Inform. 2019, 15, 1425–1436. [Google Scholar] [CrossRef] [Green Version]
- Abeele, F.V.; Haxhibeqiri, J.; Moerman, I.; Hoebeke, J. Scalability analysis of large-scale LoRaWAN networks in ns-3. IEEE Internet Things J. 2017, 4, 2186–2198. [Google Scholar] [CrossRef] [Green Version]
- Magrin, D.; Centenaro, M.; Vangelista, L. Performance evaluation of LoRa networks in a smart city scenario. In Proceedings of the IEEE International Conference on Communications, Paris, France, 21–25 May 2017. [Google Scholar] [CrossRef]
- SEMTECH. Designer ’s Guide; SEMTECH. 2013, pp. 1–9. Available online: https://www.rs-online.com/designspark/relassets/ds-assets/uploads/knowledge-items/application-notes-for-the-internet-of-things/LoRaDesignGuide.pdf (accessed on 6 September 2021).
- LoRa Alliance. LoRaWAN® Regional Parameters 1.1; LoRa Alliance. 2021. Available online: https://lora-alliance.org/wpcontent/uploads/2020/11/lorawan-regional-parameters-v1.1ra.pdf (accessed on 6 September 2021).
- Microchip. RN2483; Microchip. 2019, pp. 1–22. Available online: http://ww1.microchip.com/downloads/en/Appnotes/AN3076-Adding-LoRa-RN2483-Click-to-AVR-IoT-WG-Board-00003076A.pdf (accessed on 6 September 2021).
- Gaussian Waves. Log Distance Model. Available online: https://www.gaussianwaves.com/2013/09/log-distance-path-loss-orlog-normal-shadowing-model/ (accessed on 6 September 2021).
- Ofcom. IR 2030–UK Interface Requirements 2030; Ofcom. 2021. Available online: https://www.ofcom.org.uk/__data/assets/pdf_file/0028/84970/ir-2030.pdf (accessed on 6 September 2021).
- Semtech Corporation. SX127x Wireless & Sensing Products Datasheet; SX1276/77/78/79 2020. Available online: https://semtech.my.salesforce.com/sfc/p/#E0000000JelG/a/2R0000001Rbr/6EfVZUorrpoKFfvaF_Fkpgp5kzjiNyiAbqcpqh9qSjE (accessed on 6 September 2021).
- Semtech Corporation. SX1308 Wireless & Sensing Products Datasheet; Semtech Corporation. 2017, pp. 1–40. Available online: https://semtech.my.salesforce.com/sfc/p/#E0000000JelG/a/44000000MDnb/XsCTHcePJiAjE.V2EEZt3Wqu005Yf3FBWbtF0A6Yv70 (accessed on 6 September 2021).
- Croce, D.; Gucciardo, M.; Mangione, S.; Santaromita, G.; Tinnirello, I. Impact of LoRa Imperfect Orthogonality: Analysis of Link-Level Performance. IEEE Commun. Lett. 2018, 22, 796–799. [Google Scholar] [CrossRef] [Green Version]
- Goursaud, C.; Gorce, J.M. Dedicated networks for IoT: PHY / MAC state of the art and challenges. EAI Endorsed Trans. Internet Things 2015, 1, 150597. [Google Scholar] [CrossRef]
- Matni, N.; Moraes, J.; Rosario, D.; Cerqueira, E.; Neto, A. Optimal Gateway Placement Based on Fuzzy C-Means for Low Power Wide Area Networks. In Proceedings of the 2019 IEEE Latin-American Conference on Communications, LATINCOM, Salvador, Brazil, 1–13 November 2019. [Google Scholar] [CrossRef]
- Tian, H.; Weitnauer, M.A.; Nyengele, G. Optimized gateway placement for interference cancellation in transmit-only LPWA networks. Sensors 2018, 18, 3884. [Google Scholar] [CrossRef] [PubMed] [Green Version]
- Marais, J.M.; Abu-Mahfouz, A.M.; Hancke, G.P. A Review of LoRaWAN Simulators: Design Requirements and Limitations. In Proceedings of the 2019 International Multidisciplinary Information Technology and Engineering Conference, Vanderbijlpark, South Africa, 21–22 November 2019; pp. 1–6. [Google Scholar] [CrossRef]
- Bor, M.C.; Roedig, U.; Voigt, T.; Alonso, J.M. Do LoRa Low-Power Wide-Area Networks Scale? In Proceedings of the 19th ACM International Conference on Modeling, Analysis and Simulation of Wireless and Mobile Systems (MSWiM’16), Malta, 13–17 November 2016; ACM: New York, NY, USA, 2016; pp. 59–67. [Google Scholar] [CrossRef] [Green Version]
- To, T.H.; Duda, A. Simulation of LoRa in NS-3: Improving LoRa Performance with CSMA. In Proceedings of the IEEE International Conference on Communications, Shanghai, China, 20–24 May 2018. [Google Scholar] [CrossRef] [Green Version]
- Muthanna, M.S.A.; Wang, P.; Wei, M.; Abuarqoub, A.; Alzu’bi, A.; Gull, H. Cognitive control models of multiple access IoT networks using LoRa technology. Cogn. Syst. Res. 2021, 65, 62–73. [Google Scholar] [CrossRef]
- Liando, J.C.; Gamage, A.; Tengourtius, A.W.; Li, M. Known and unknown facts of LoRa: Experiences from a large-scale measurement study. ACM Trans. Sens. Netw. 2019, 15. [Google Scholar] [CrossRef]
- Cuomo, F.; Campo, M.; Caponi, A.; Bianchi, G.; Rossini, G.; Pisani, P. EXPLoRa: Extending the performance of LoRa by suitable spreading factor allocations. In Proceedings of the 2017 IEEE 13th International Conference on Wireless and Mobile Computing, Networking and Communications (WiMob), Rome, Italy, 9–11 October 2017; pp. 1–8. [Google Scholar] [CrossRef]
- NS-3. Nakagami Model. Available online: https://www.nsnam.org/doxygen/classns3_1_1_nakagami_propagation_loss_model.html (accessed on 6 September 2021).
- Sanchez-Iborra, R.; Sanchez-Gomez, J.; Ballesta-Viñas, J.; Cano, M.D.; Skarmeta, A.F. Performance evaluation of lora considering scenario conditions. Sensors 2018, 18, 772. [Google Scholar] [CrossRef] [PubMed] [Green Version]
- Cuomo, F.; Gamez, J.C.C.; Maurizio, A.; Scipione, L.; Campo, M.; Caponi, A.; Bianchi, G.; Rossini, G.; Pisani, P. Towards traffic-oriented spreading factor allocations in LoRaWAN systems. In Proceedings of the 2018 17th Annual Mediterranean Ad Hoc Networking Workshop, Med-Hoc-Net 2018, Capri Island, Italy, 20–22 June 2018; pp. 1–8. [Google Scholar] [CrossRef] [Green Version]


| Payload Length | 10 bytes |
|---|---|
| CR | 4/5 |
| BW | 125 kHz |
| Channel | 868.3 MHz |
| Tx Power | 14 dBm |
| Sim. Time | 3600 s |
| Tx Time | 180 s |
| PL0 | 7.7 dB |
| d0 | 1 m |
| γ | 3.76 |
| Noise Figure (NF) | 6 dB |
| Nodes (N) | 500, 1000, 2000, 5000 |
| Radius (R) | 3011, 3509, 4089, 4766, 5554, 6473 m |
| Distance between GWs (D) | 0, 0.125, 0.25, 0.375, 0.5, 0.625, 0.75, 0.875, 1 |
| Simulation Hardware | 11th Gen Intel Core i7 @ 3GHz |
| SF | Rmax (m) | z | Range of Valid D for Full Coverage |
|---|---|---|---|
| 7 | 3011 | 1.9 | 0–1 |
| 8 | 3509 | 1.55 | 0–1 |
| 9 | 4089 | 1.22 | 0–1 |
| 10 | 4766 | 0.91 | 0–0.875 |
| 11 | 5554 | 0.59 | 0–0.5 |
| 12 | 6473 | 0 | 0 |
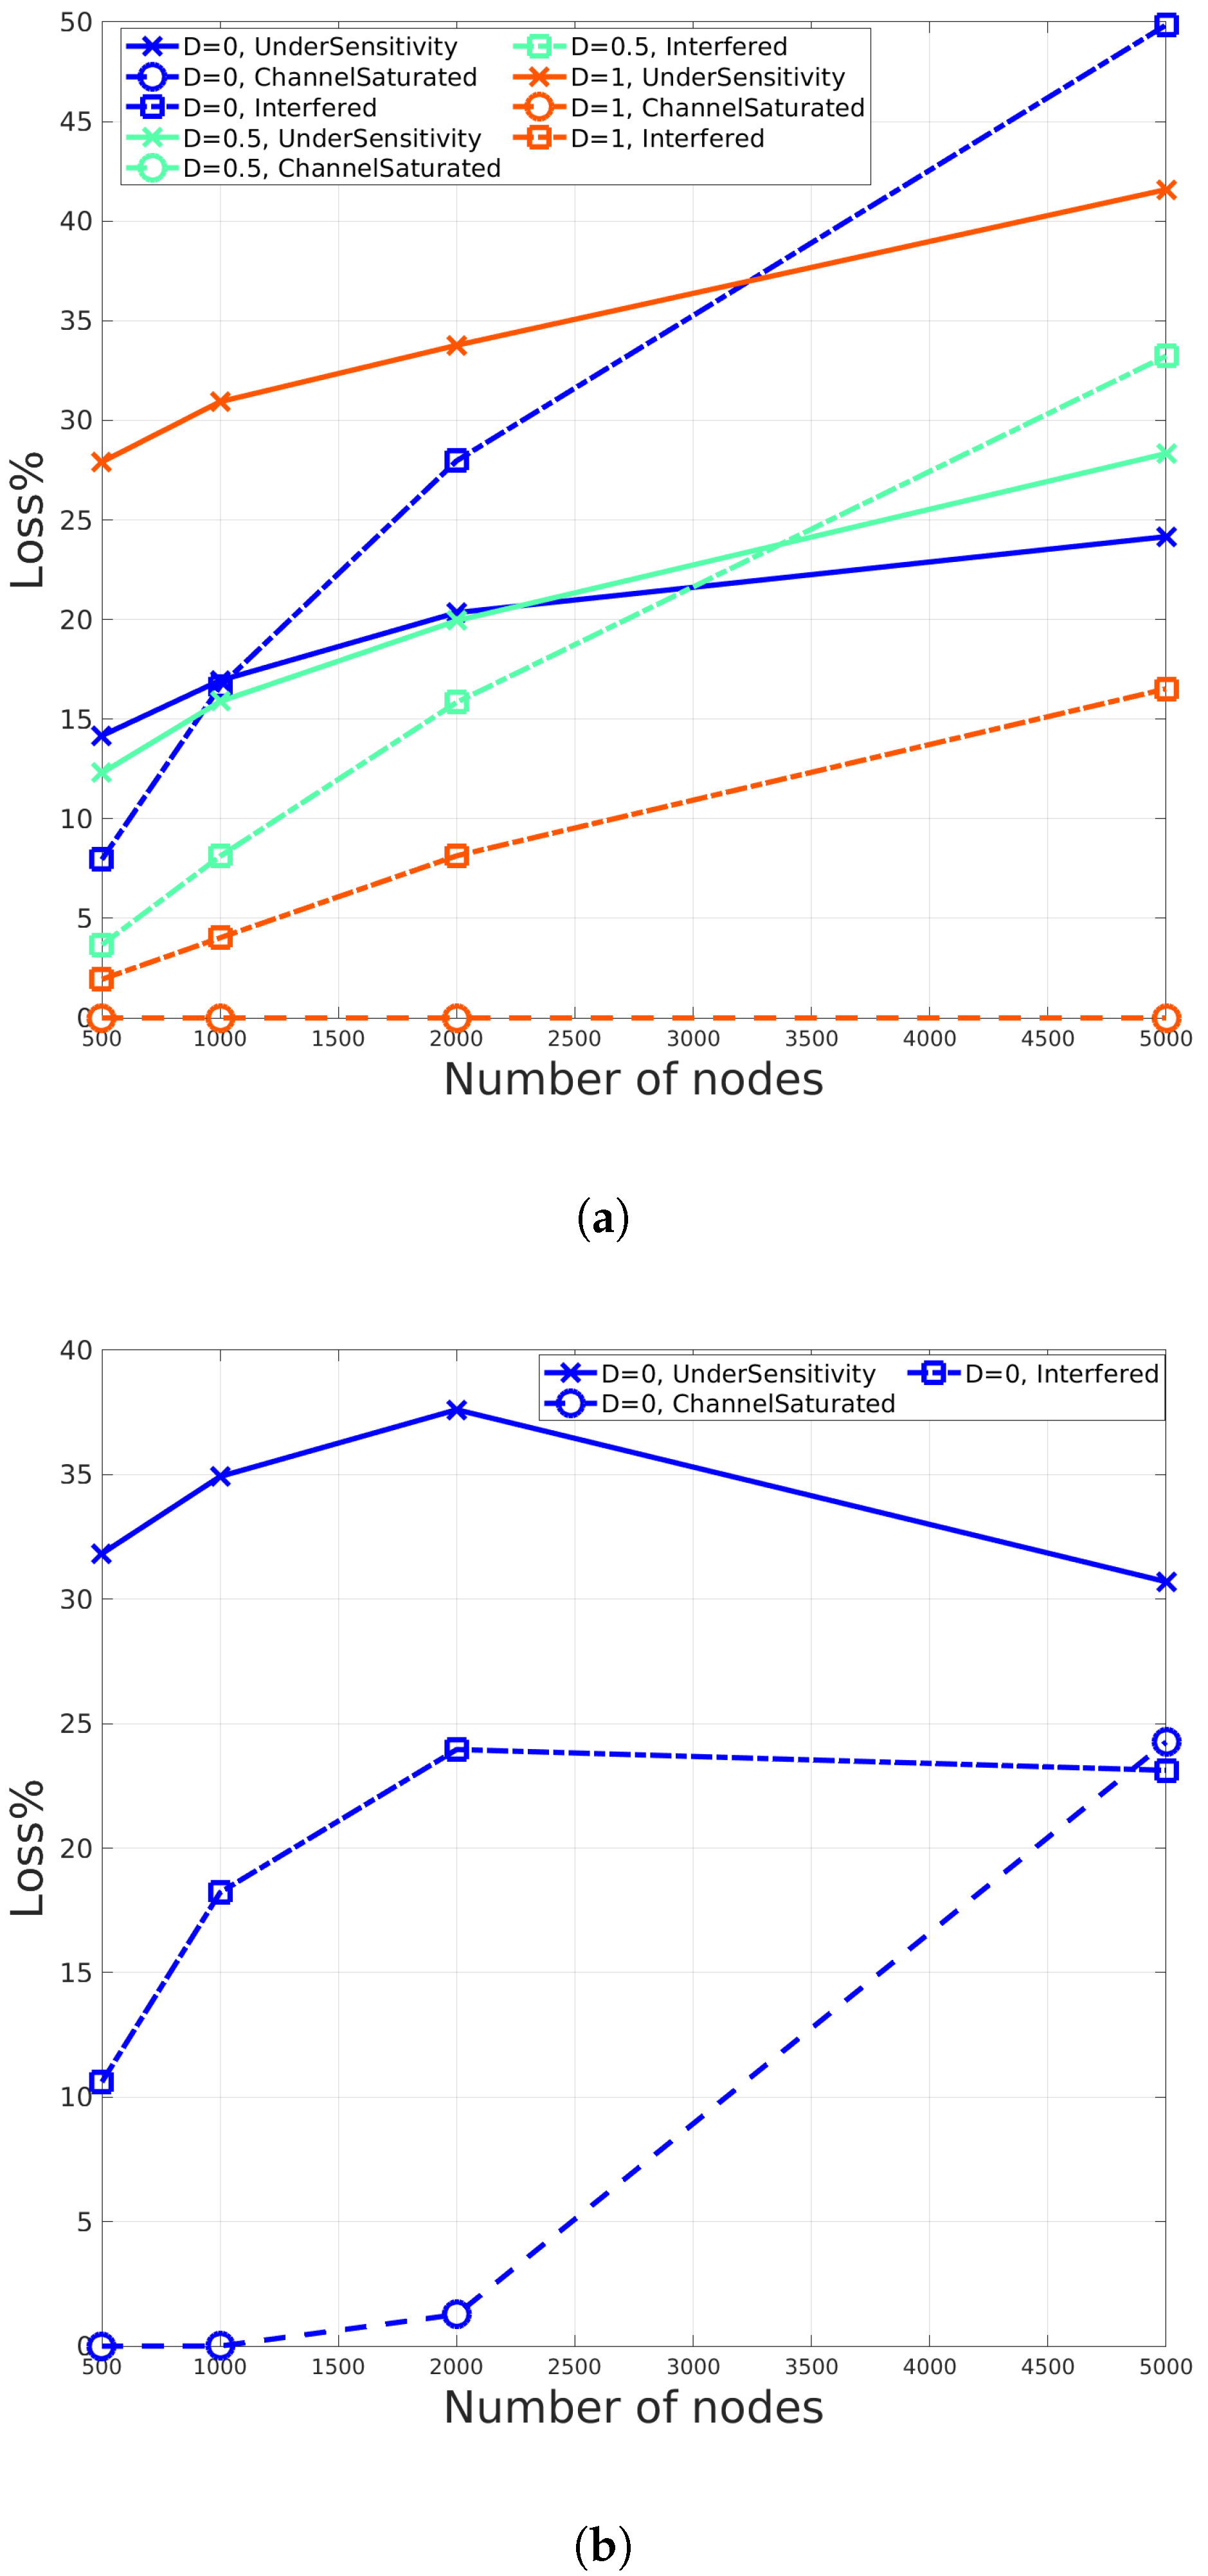
| N | R | D | Under Sensitivity Loss% | Collision Loss% | Ch. Saturation Loss% |
|---|---|---|---|---|---|
| 500 | 3011 | 0 | 14.17 | 7.95 | 0 |
| 500 | 3011 | 1 | 27.91 | 1.94 | 0 |
| 5000 | 3011 | 0 | 24.1605 | 49.8485 | 0 |
| 5000 | 3011 | 1 | 41.585 | 16.522 | 0 |
| 500 | 4089 | 0 | 21.395 | 4.255 | 0 |
| 500 | 4089 | 1 | 38.41 | 1.64 | 0 |
| 5000 | 4089 | 0 | 31.8035 | 31.291 | 0.0445 |
| 5000 | 4089 | 1 | 47.639 | 13.258 | 0.044 |
| 500 | 6473 | 0 | 31.825 | 10.605 | 0 |
| 5000 | 6473 | 0 | 30.697 | 23.1245 | 24.2625 |
Publisher’s Note: MDPI stays neutral with regard to jurisdictional claims in published maps and institutional affiliations. |
© 2021 by the authors. Licensee MDPI, Basel, Switzerland. This article is an open access article distributed under the terms and conditions of the Creative Commons Attribution (CC BY) license (https://creativecommons.org/licenses/by/4.0/).
Share and Cite
Citoni, B.; Ansari, S.; Abbasi, Q.H.; Imran, M.A.; Hussain, S. Impact of Inter-Gateway Distance on LoRaWAN Performance. Electronics 2021, 10, 2197. https://doi.org/10.3390/electronics10182197
Citoni B, Ansari S, Abbasi QH, Imran MA, Hussain S. Impact of Inter-Gateway Distance on LoRaWAN Performance. Electronics. 2021; 10(18):2197. https://doi.org/10.3390/electronics10182197
Chicago/Turabian StyleCitoni, Bruno, Shuja Ansari, Qammer Hussain Abbasi, Muhammad Ali Imran, and Sajjad Hussain. 2021. "Impact of Inter-Gateway Distance on LoRaWAN Performance" Electronics 10, no. 18: 2197. https://doi.org/10.3390/electronics10182197