
Designing a Multiaxial Extensometric Force Platform: A Manufacturing Experience

 ,
, 
 , ,
, , 
Abstract
:1. Introduction
Literature Survey
2. Materials and Methods
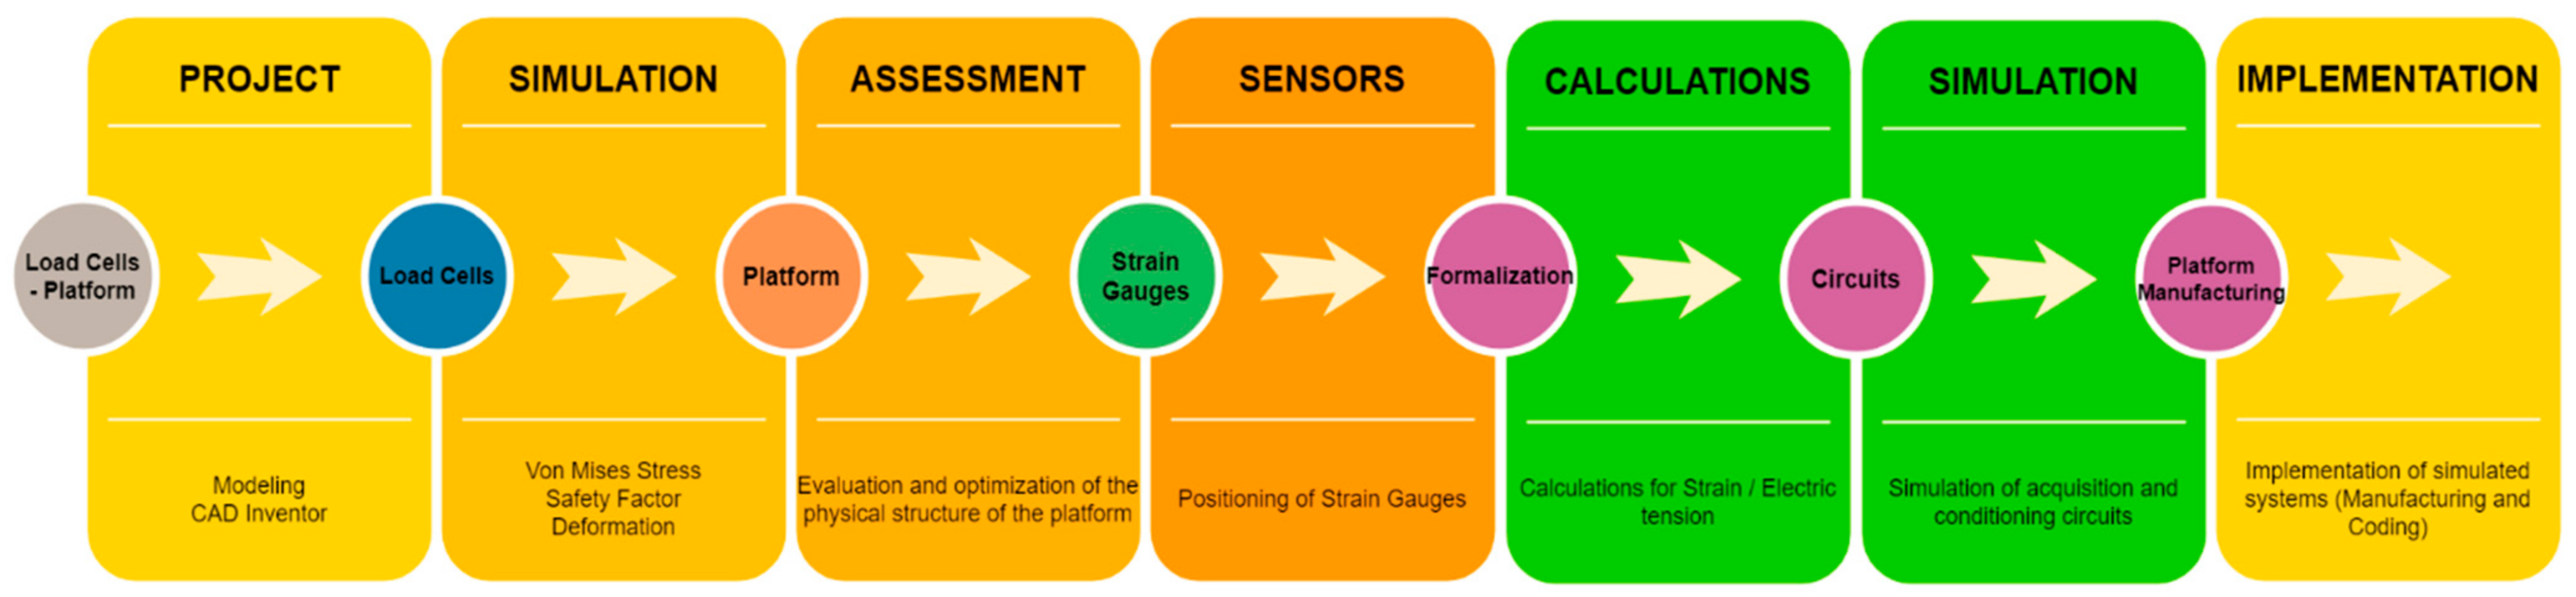
2.1. An Architecture Overview
- —
- The design of the load cells;
- —
- Simulation and optimization;
- —
- Evaluation and optimization of the force platform physical structure;
- —
- Sensor positioning project (strain gauges);
- —
- Implementation of simulated structures and systems.
2.2. Design and Manufacture of the Force Platform
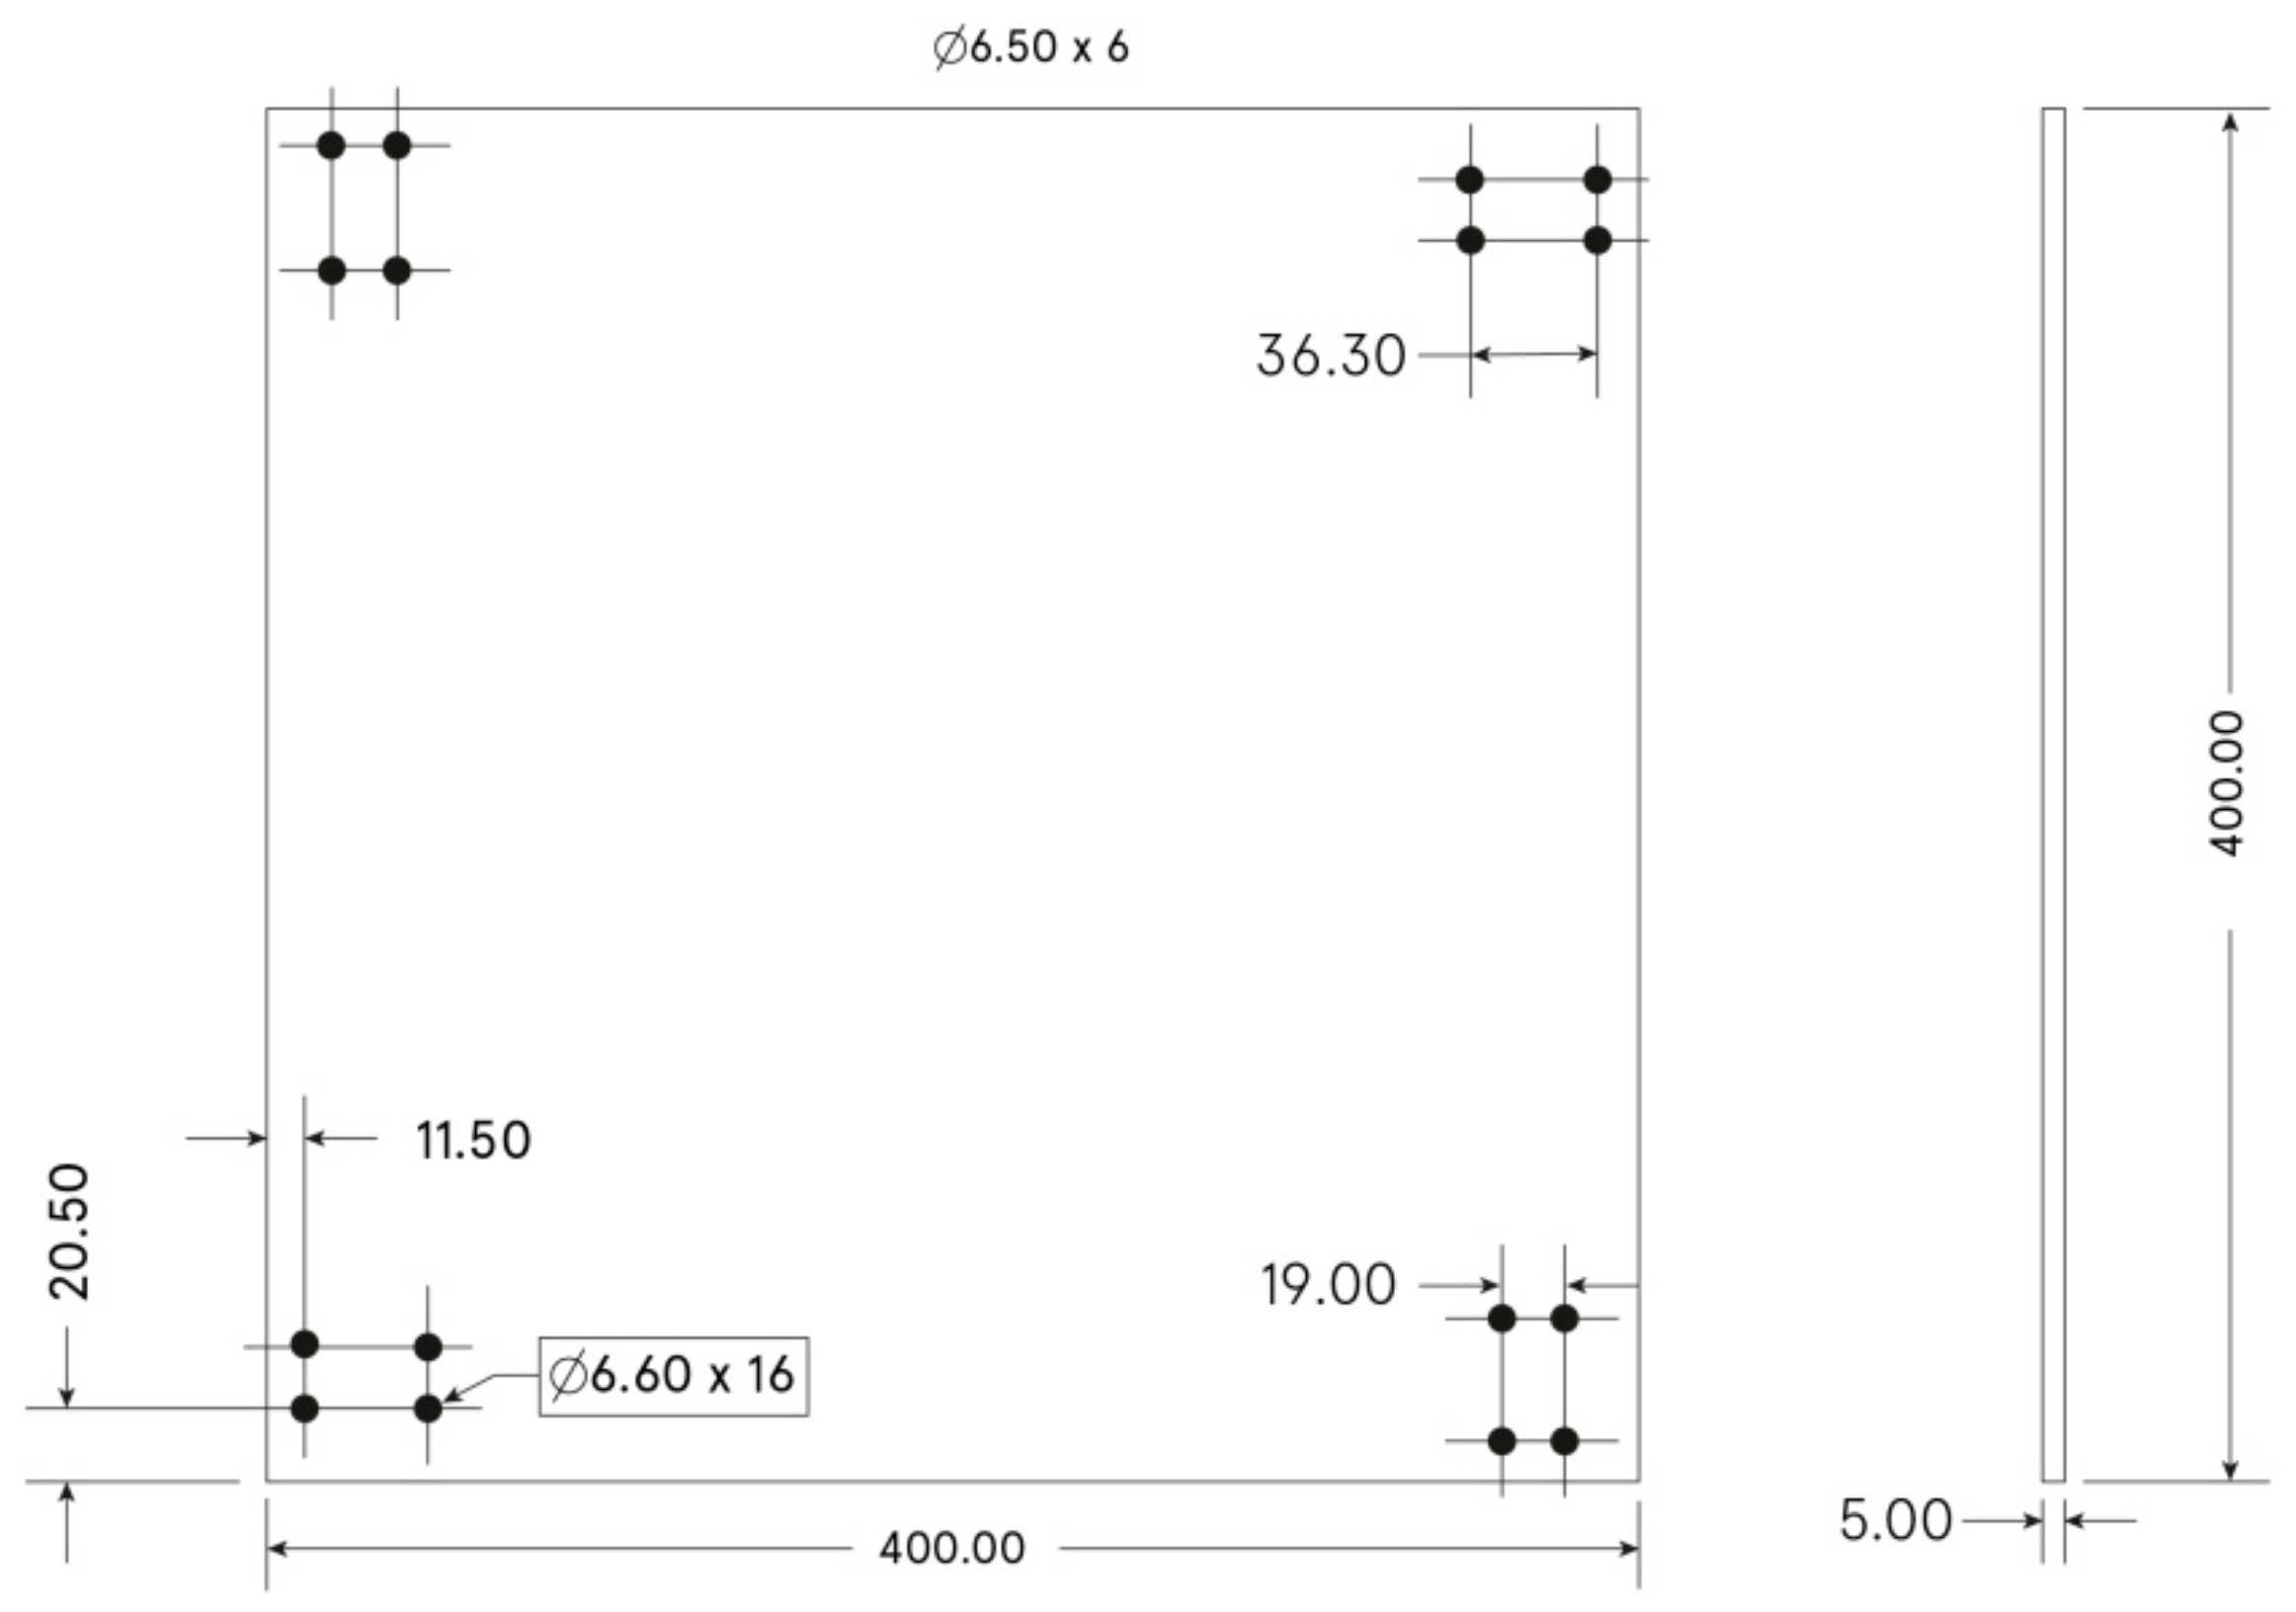
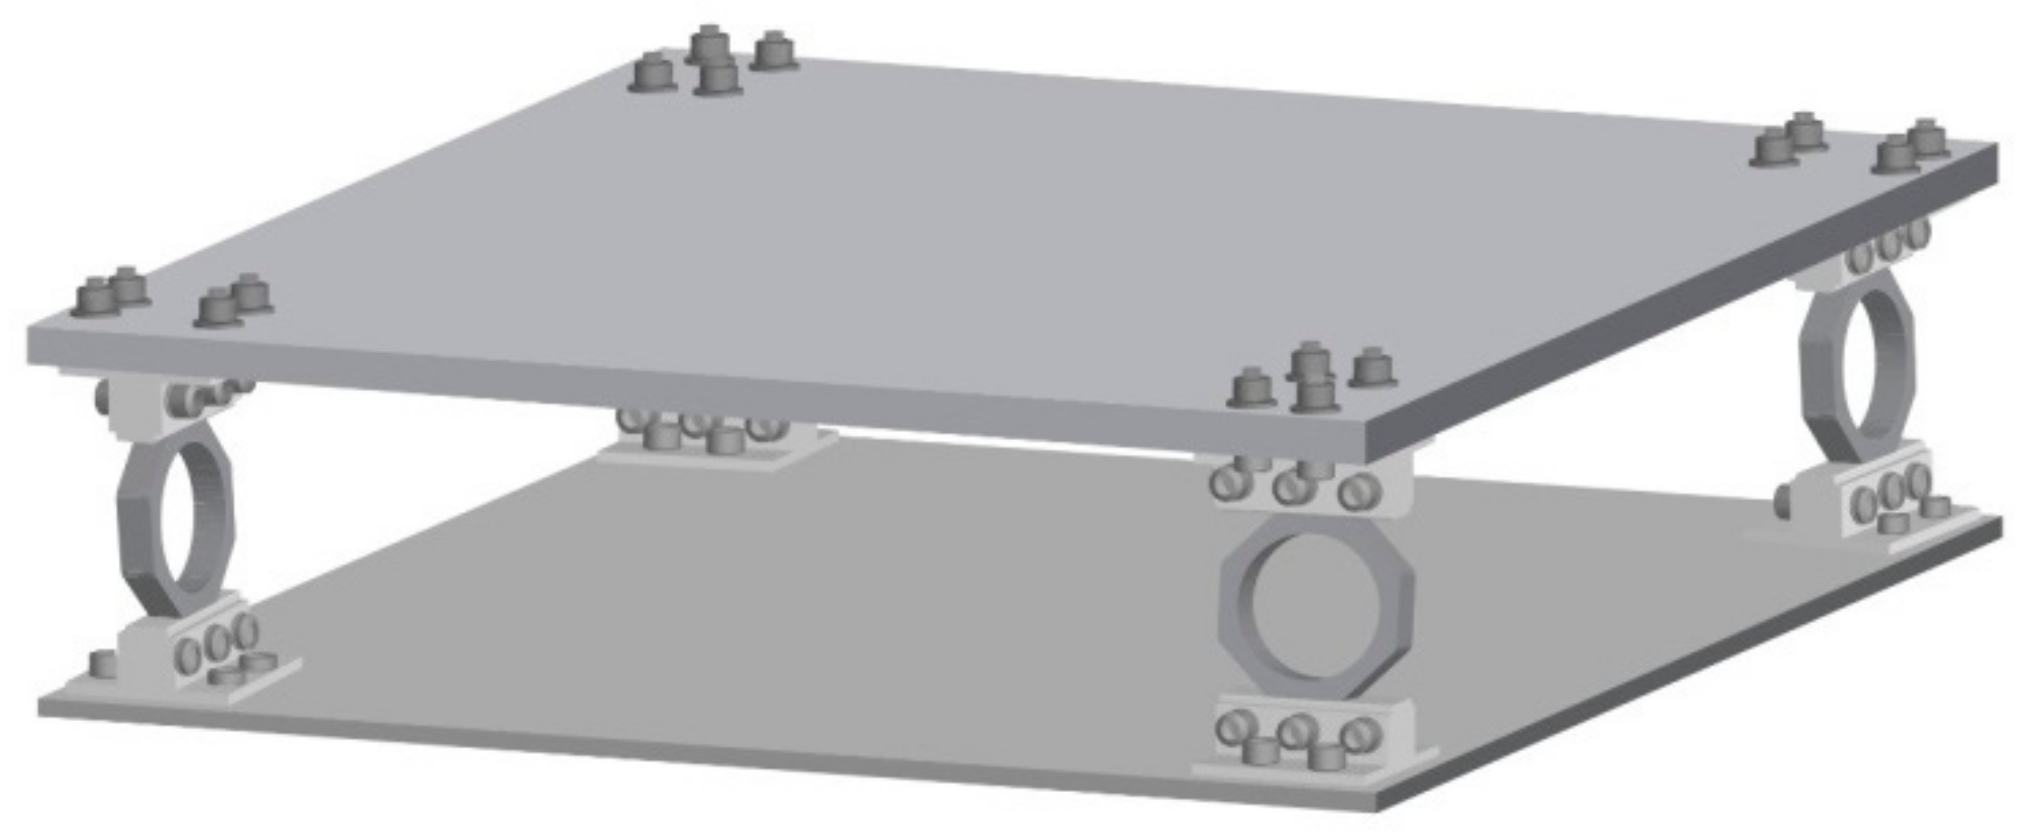
2.2.1. Platform Design
- —
- Lower and upper bases;
- —
- Load cells;
- —
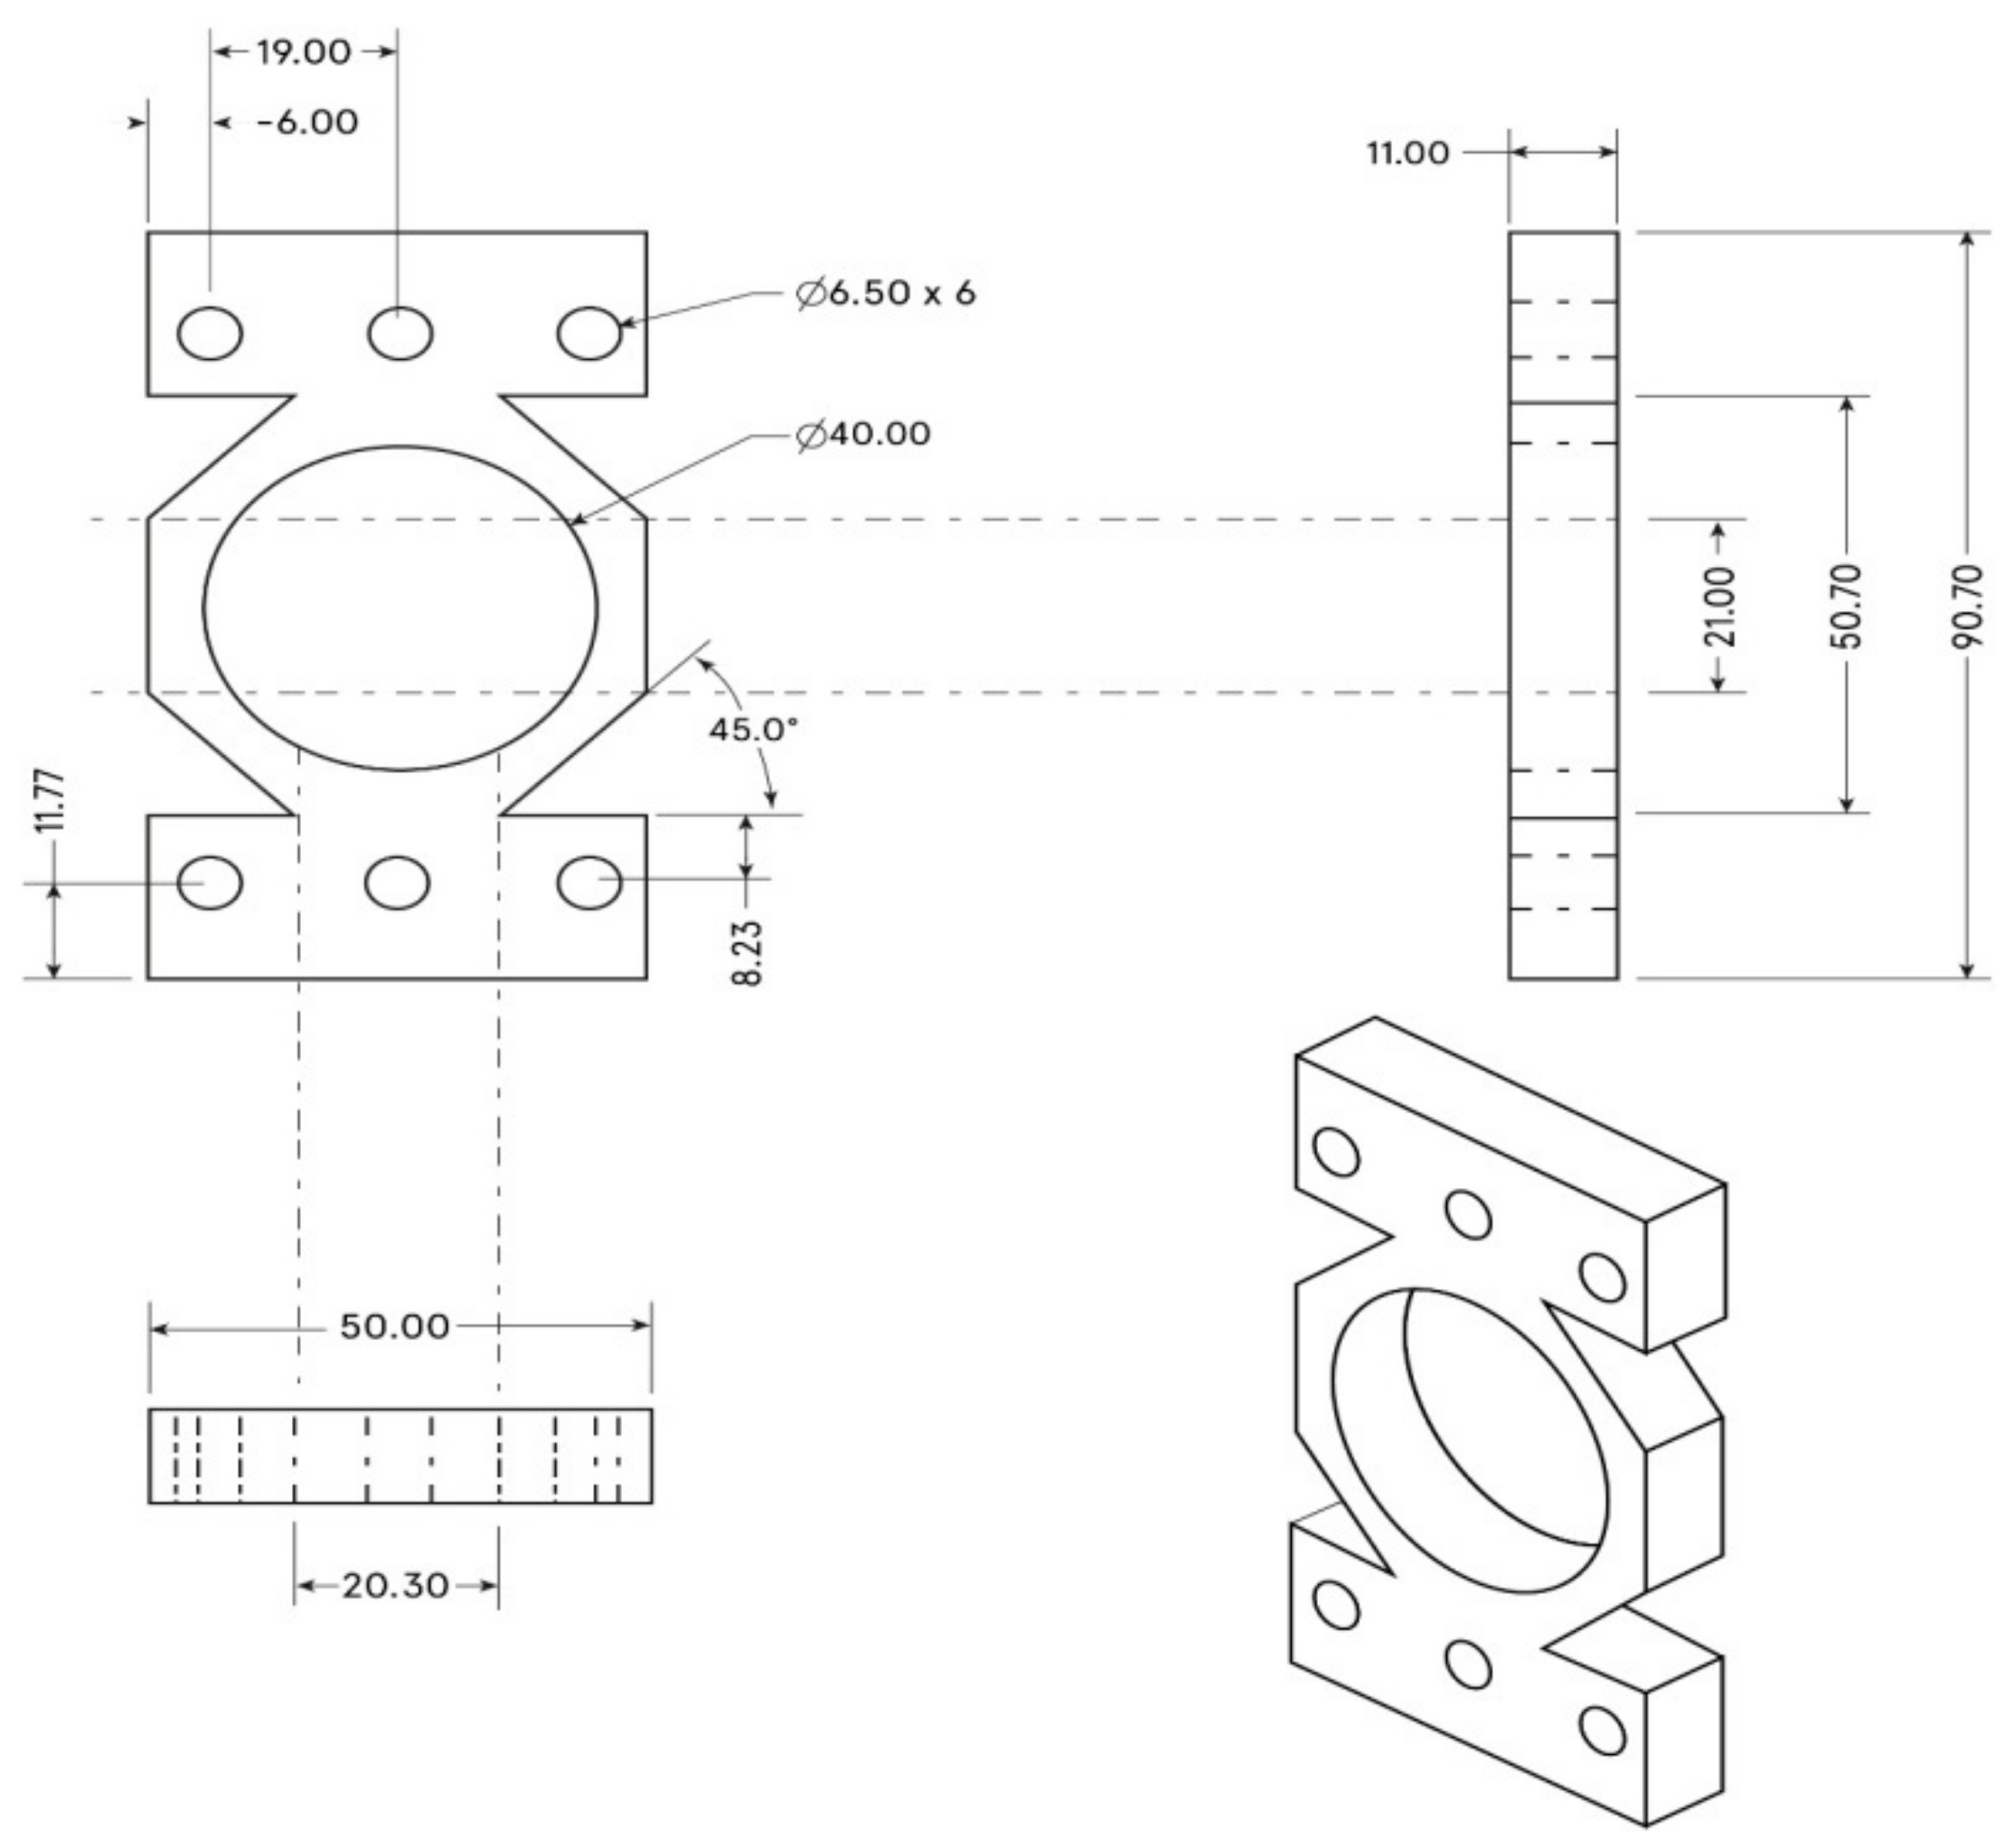
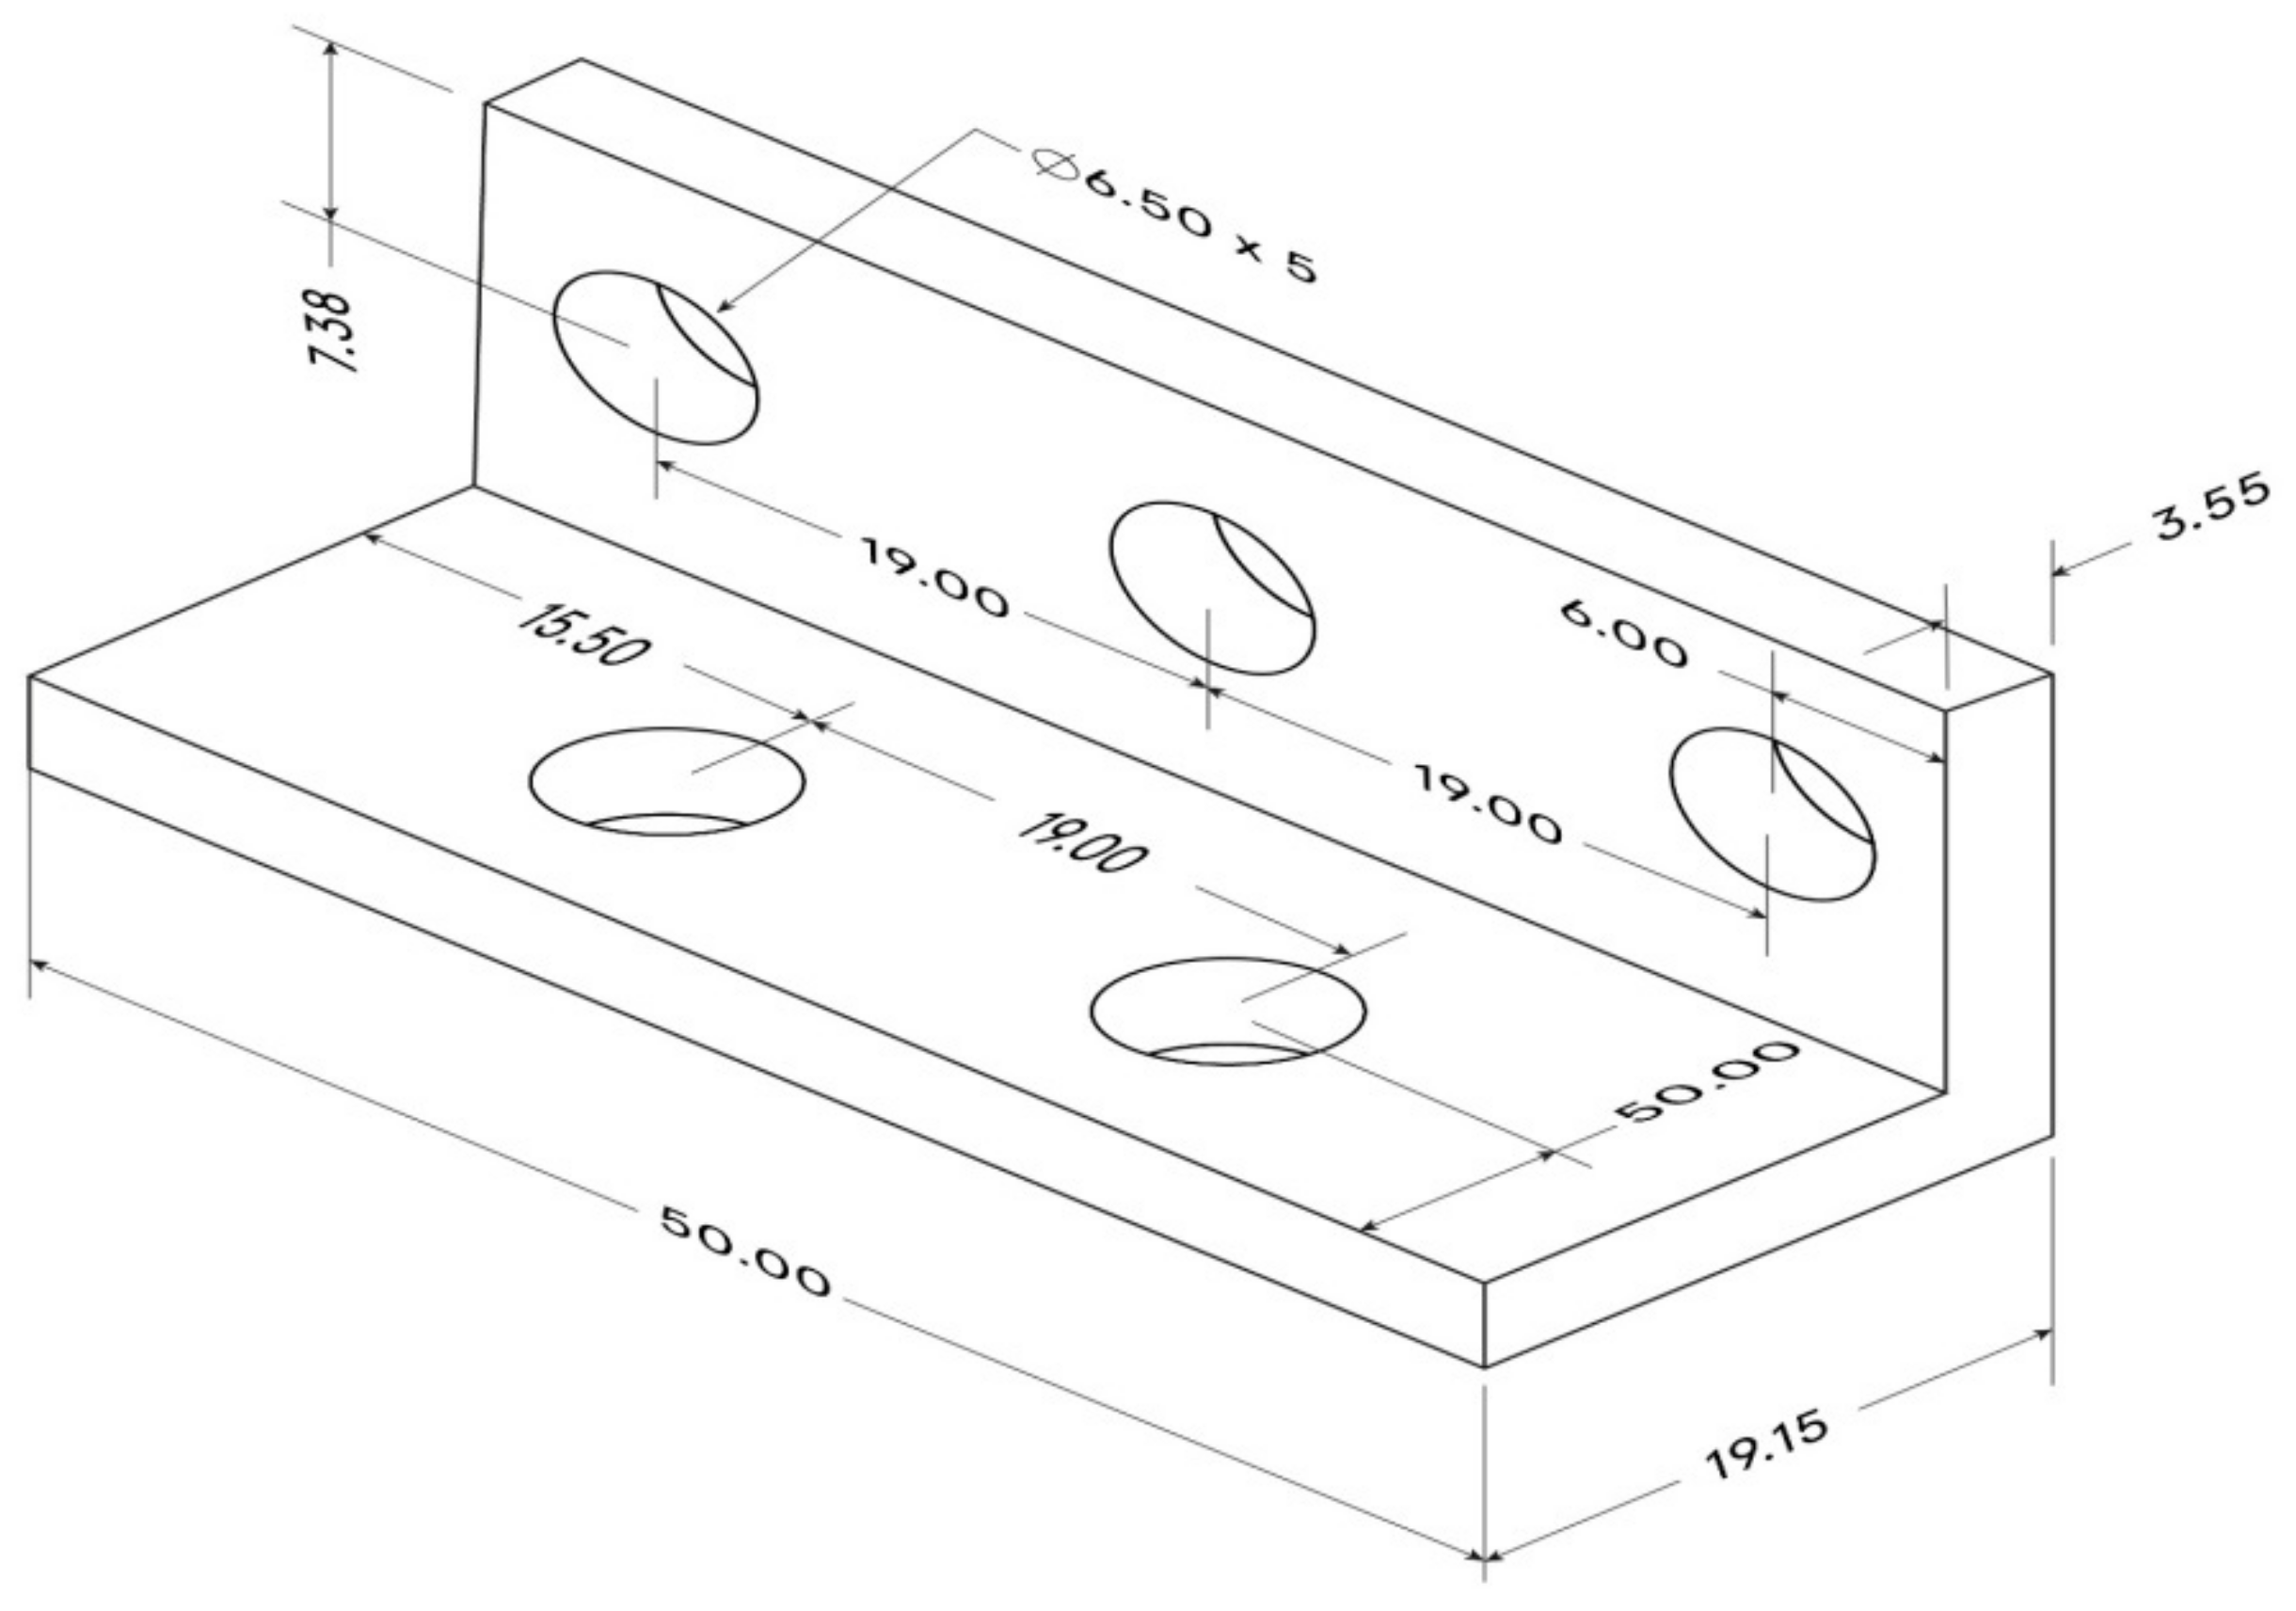
- Load cell mounting and bearing bracket
- Lower and Upper Bases
- 2.
- Load Cells
- 3.
- Load Cell Mounting and Bearing Bracket
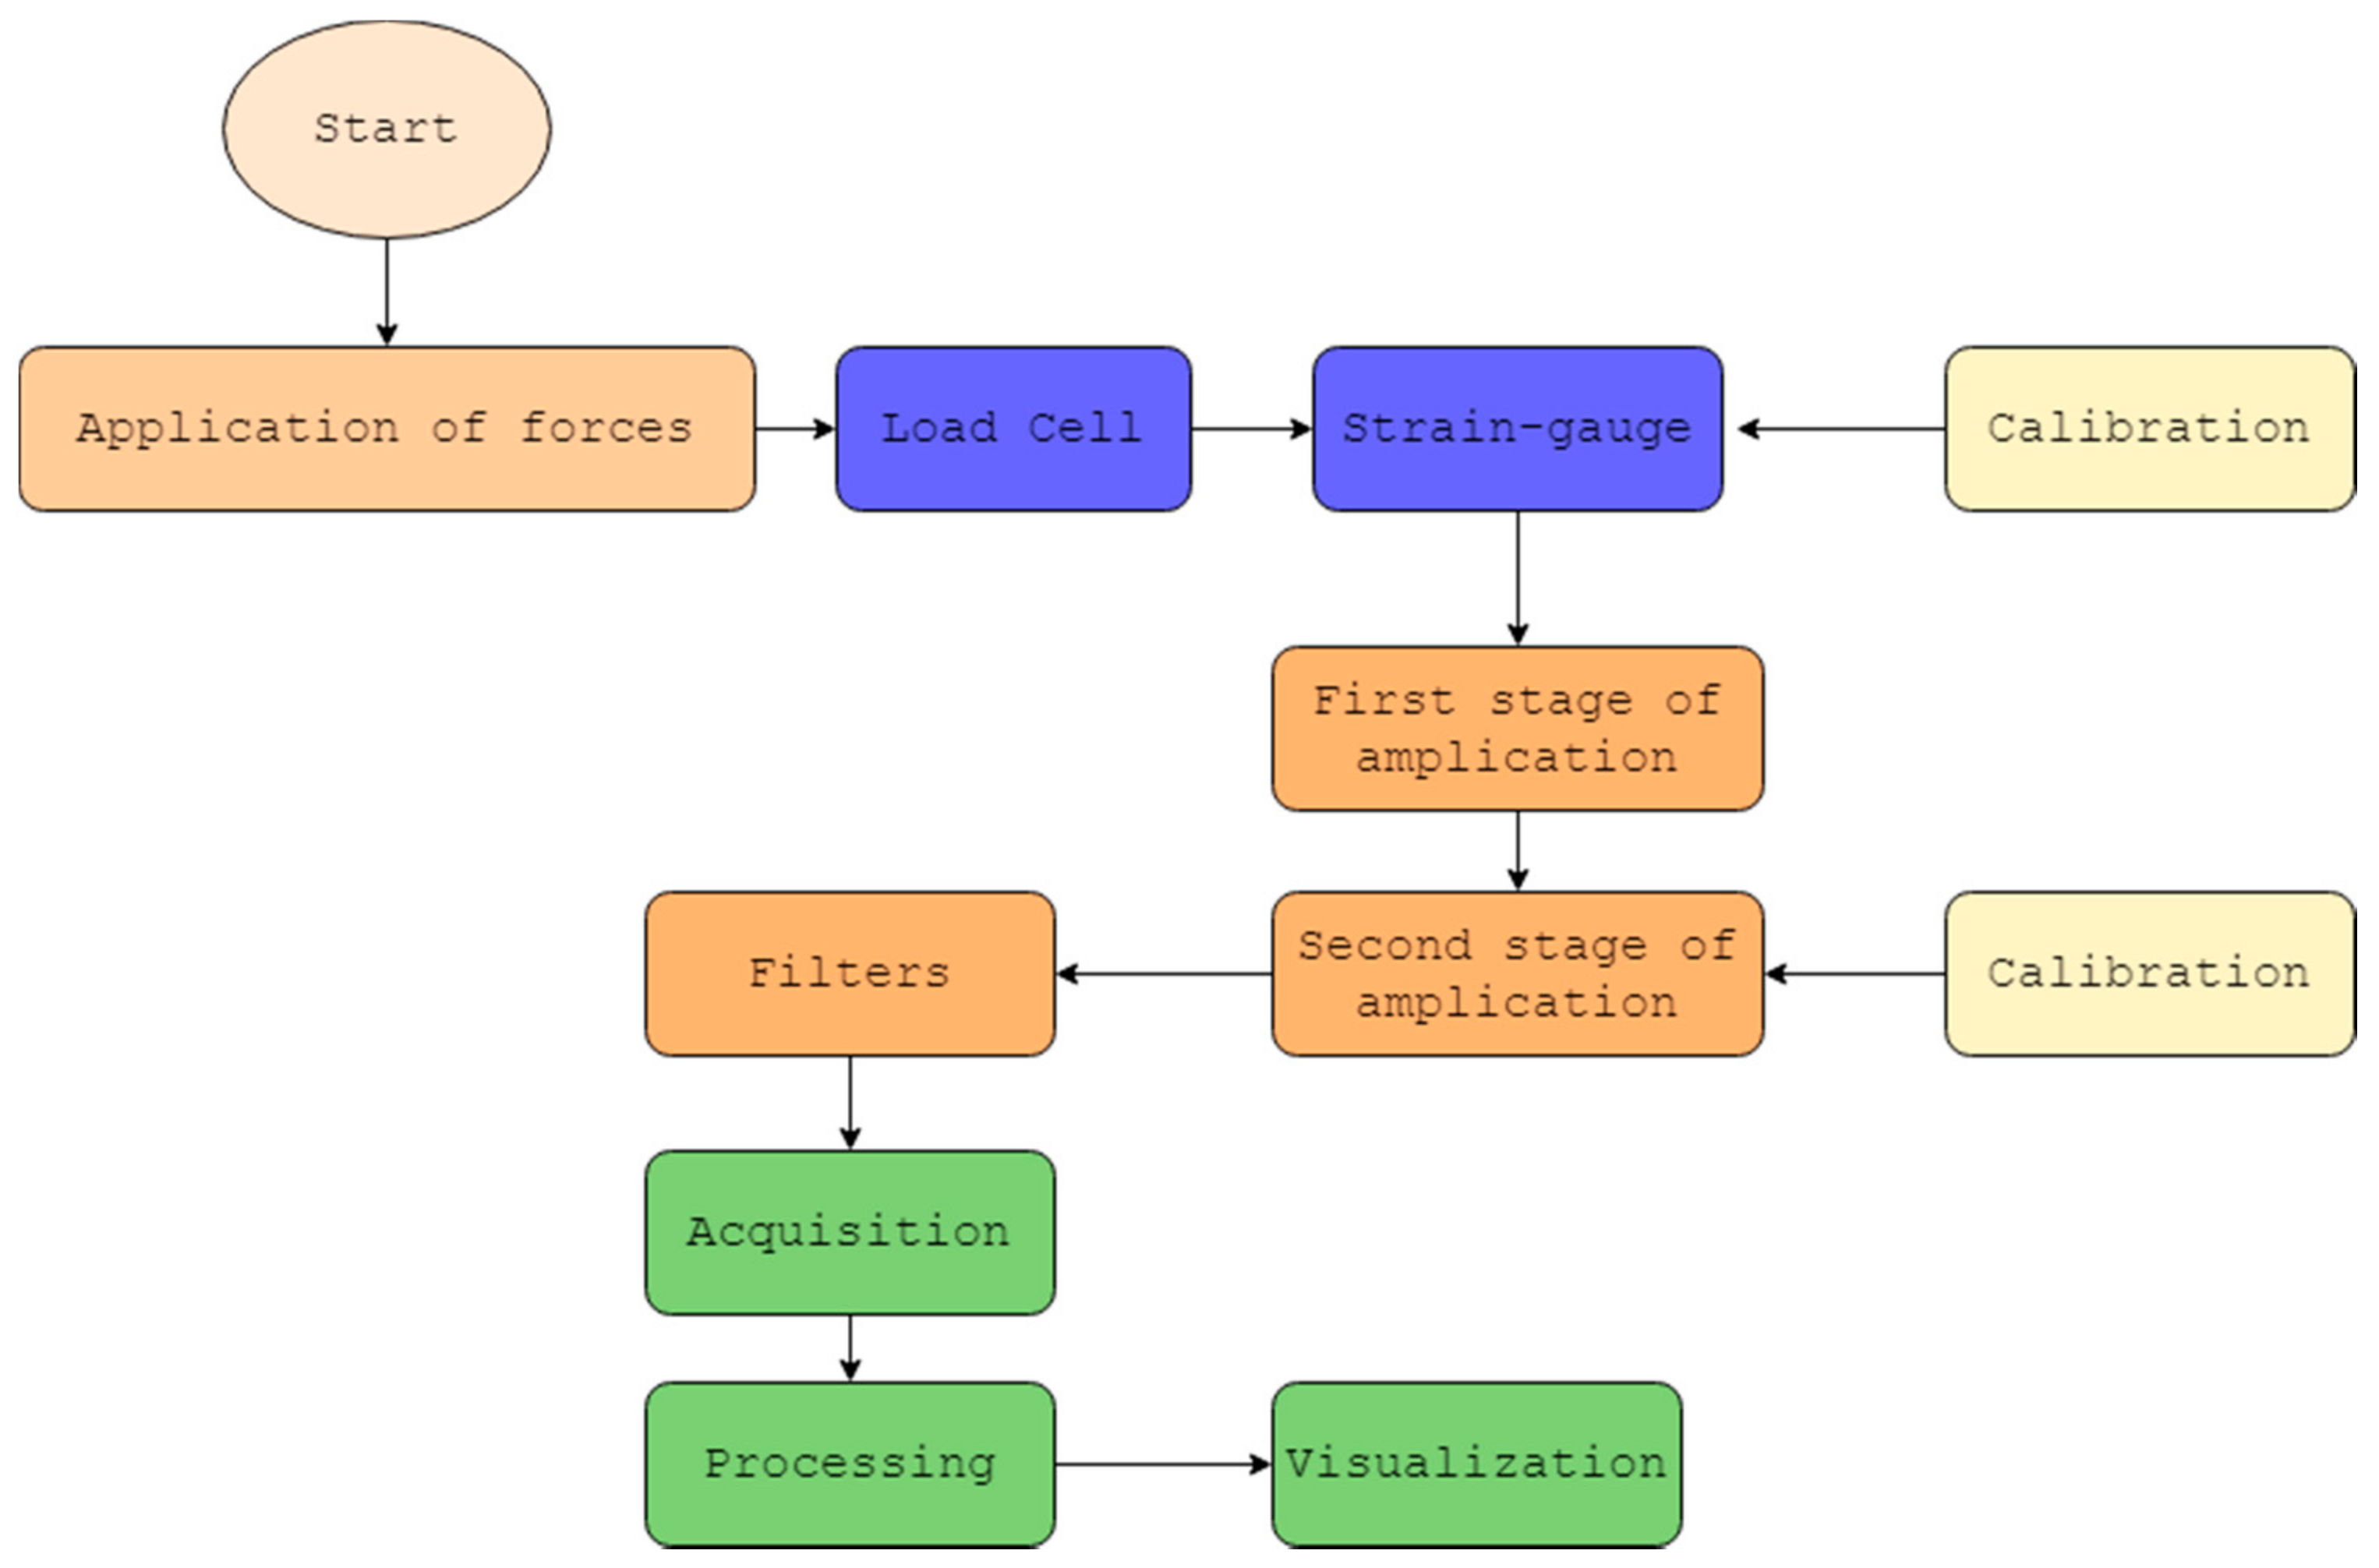
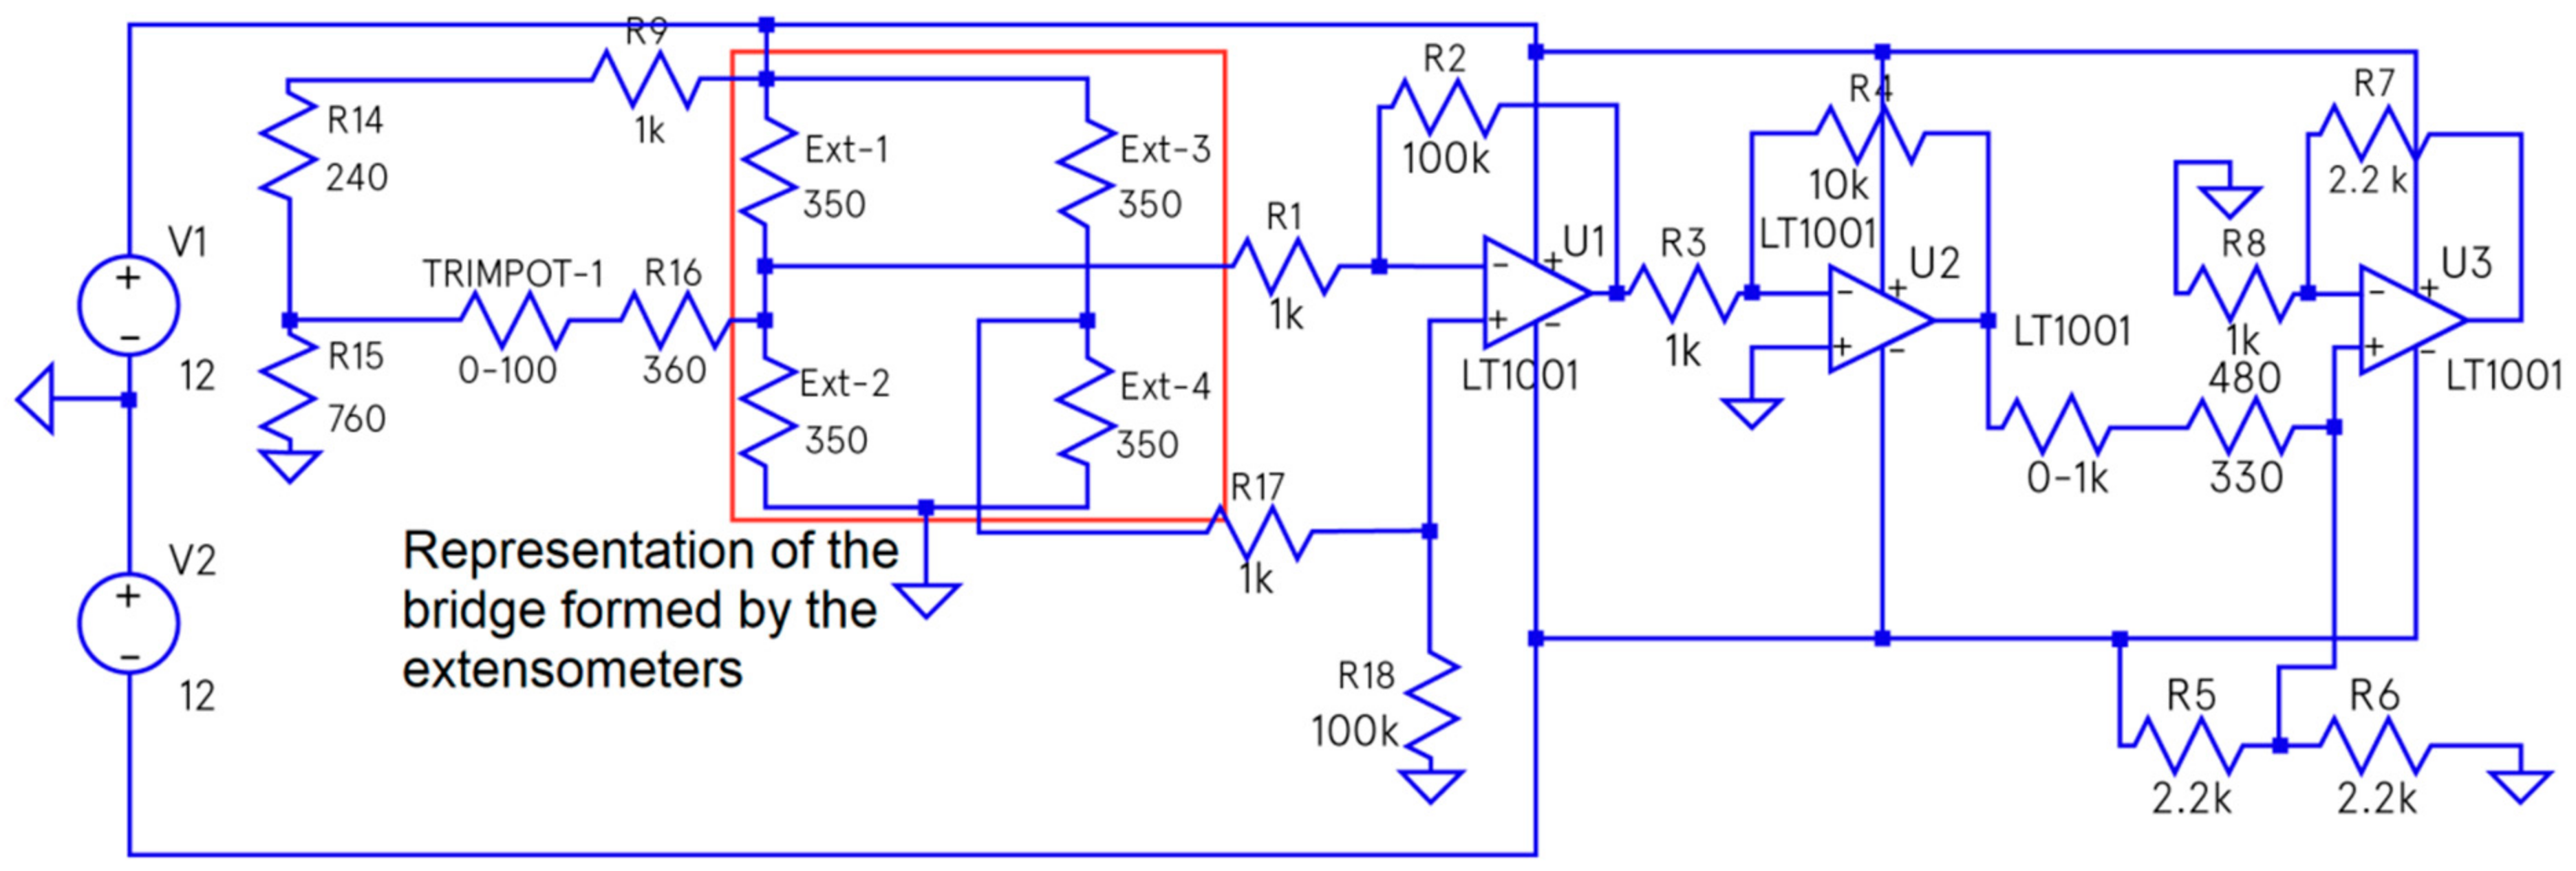
2.2.2. Design of the Conditioning Circuit and Amplification
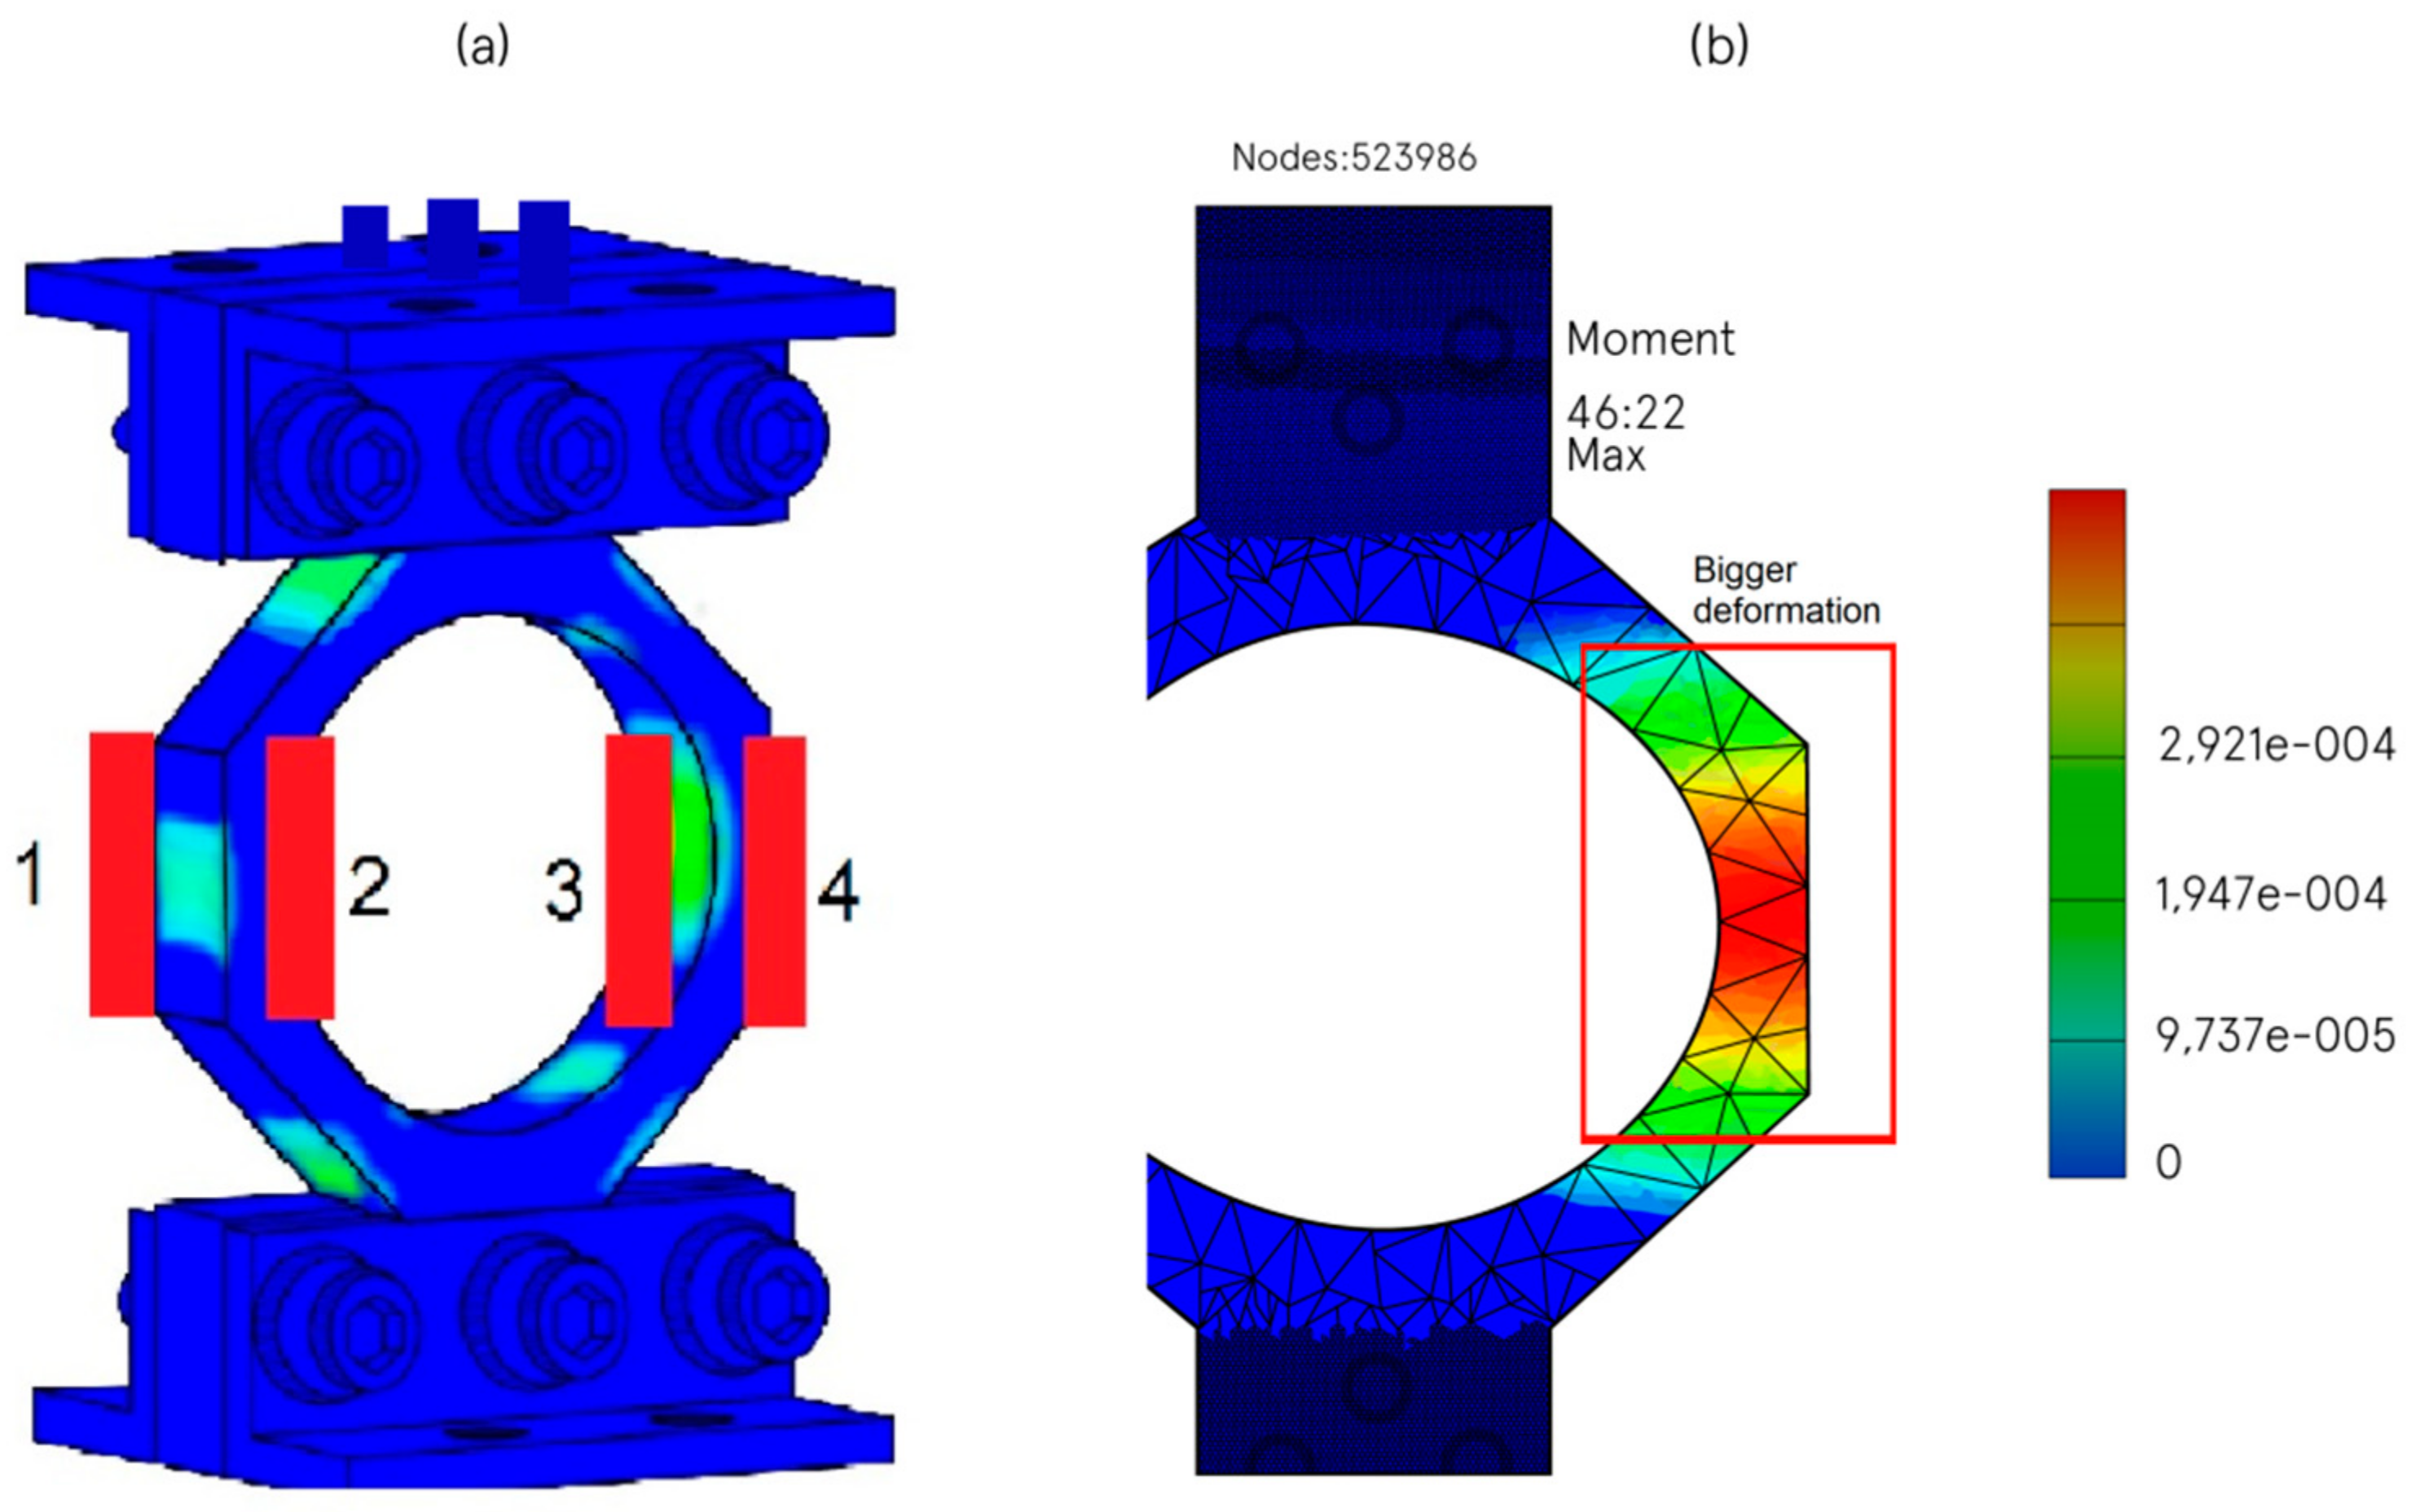
2.2.3. Component Simulations and Validation
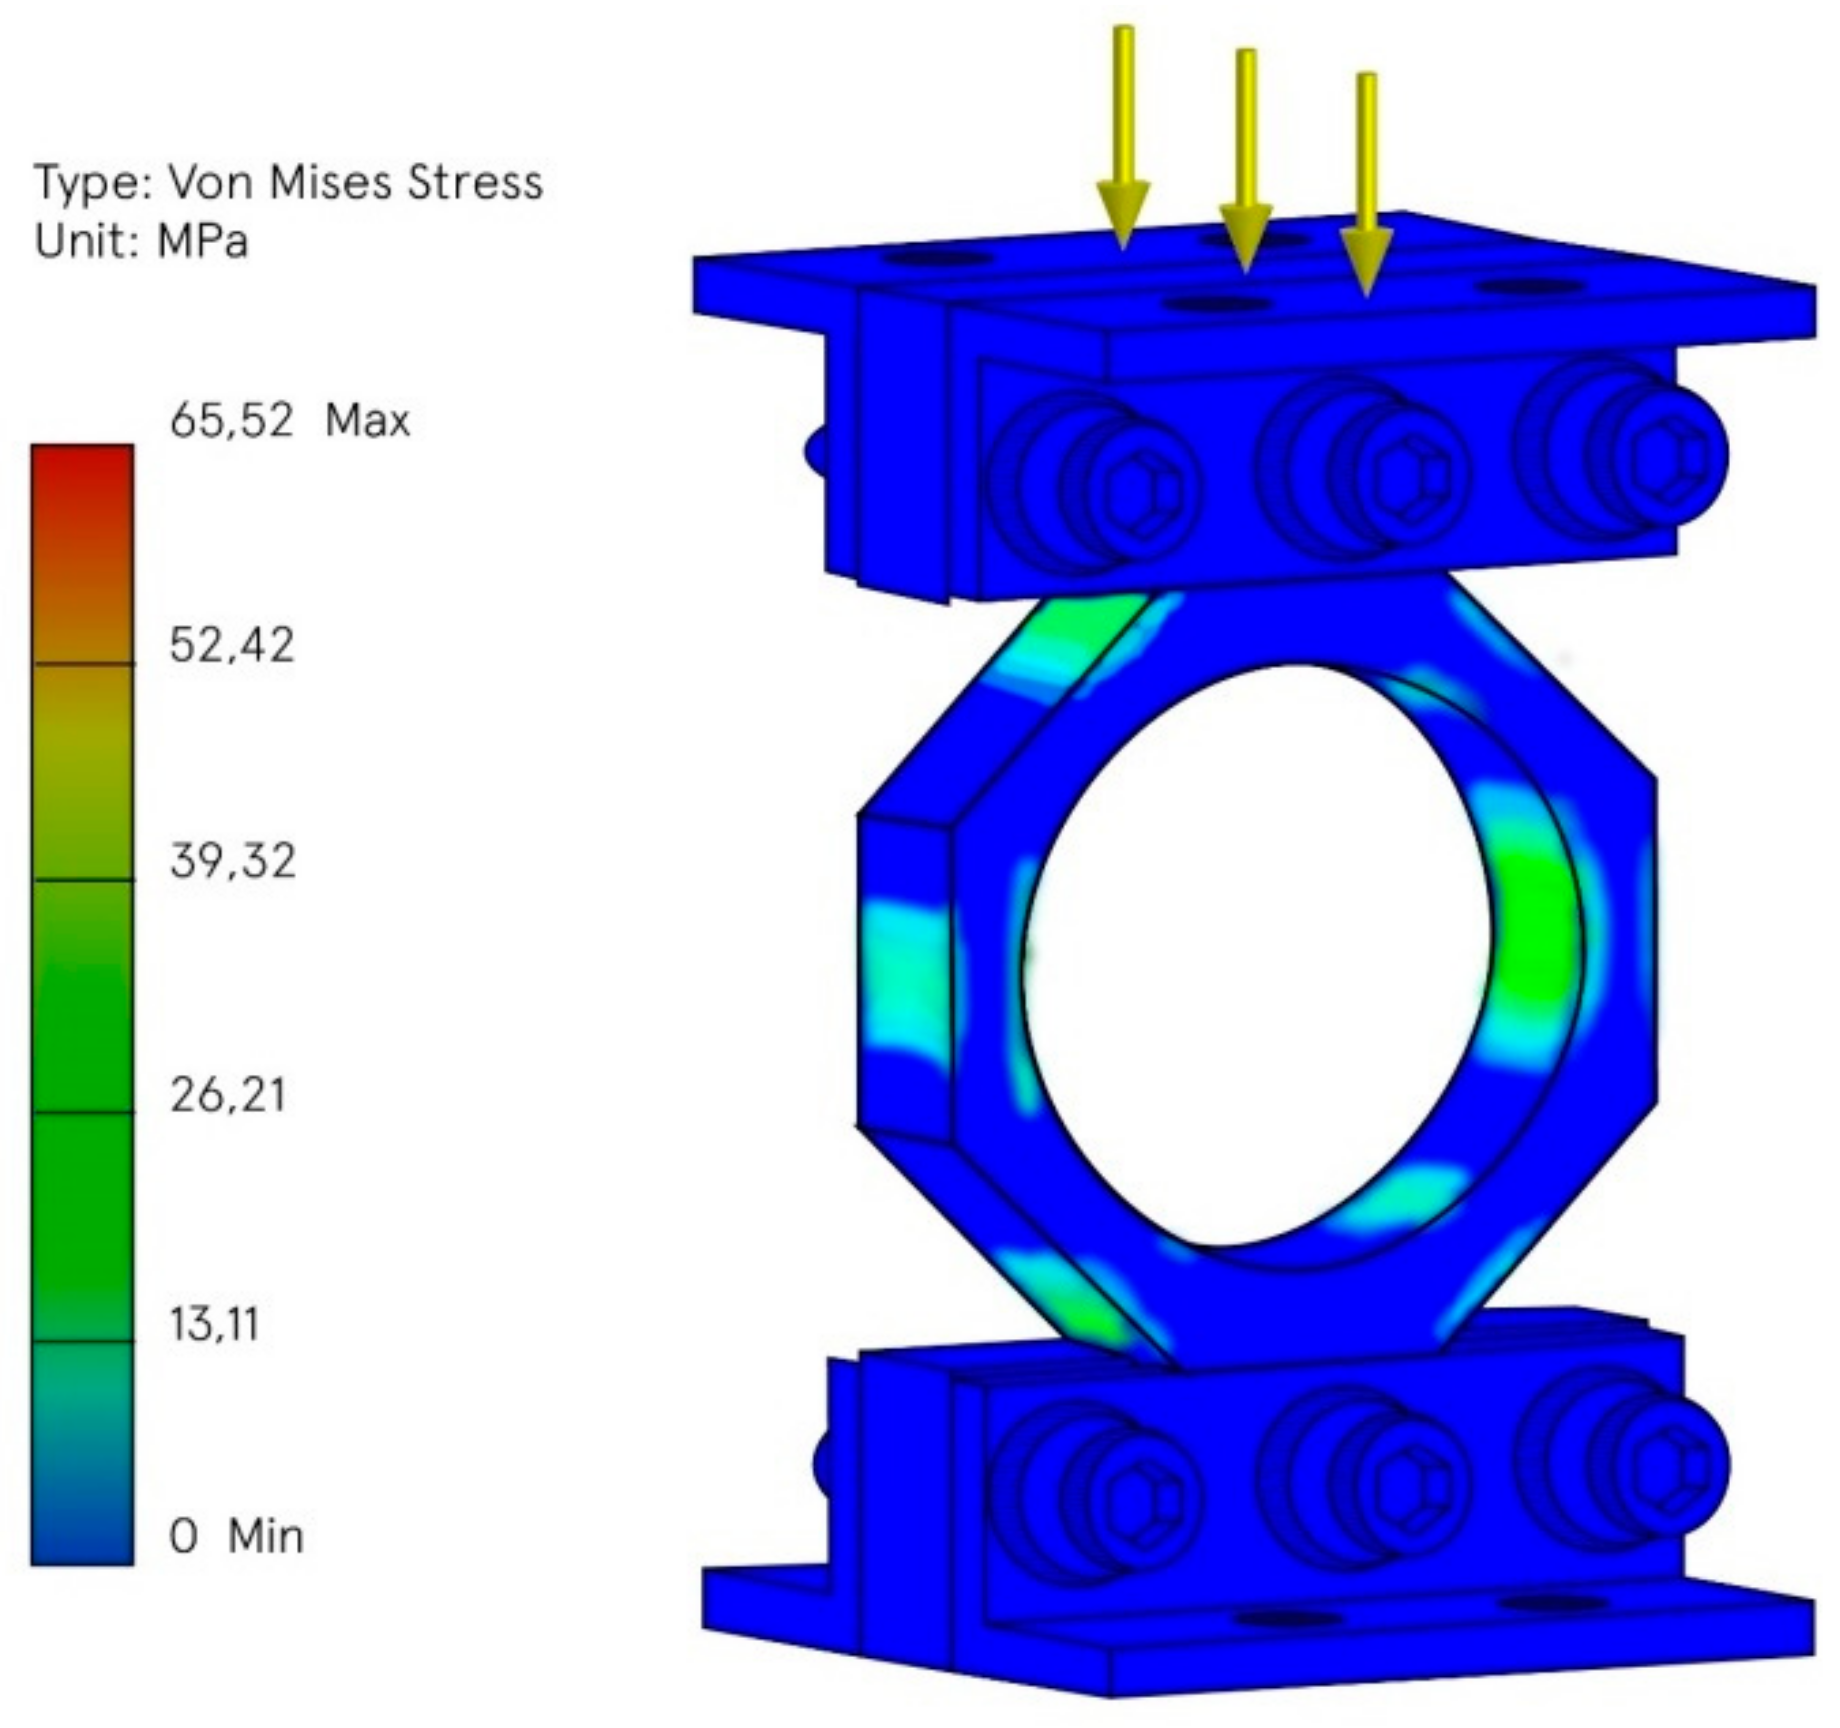
- Von Mises Stress Analysis
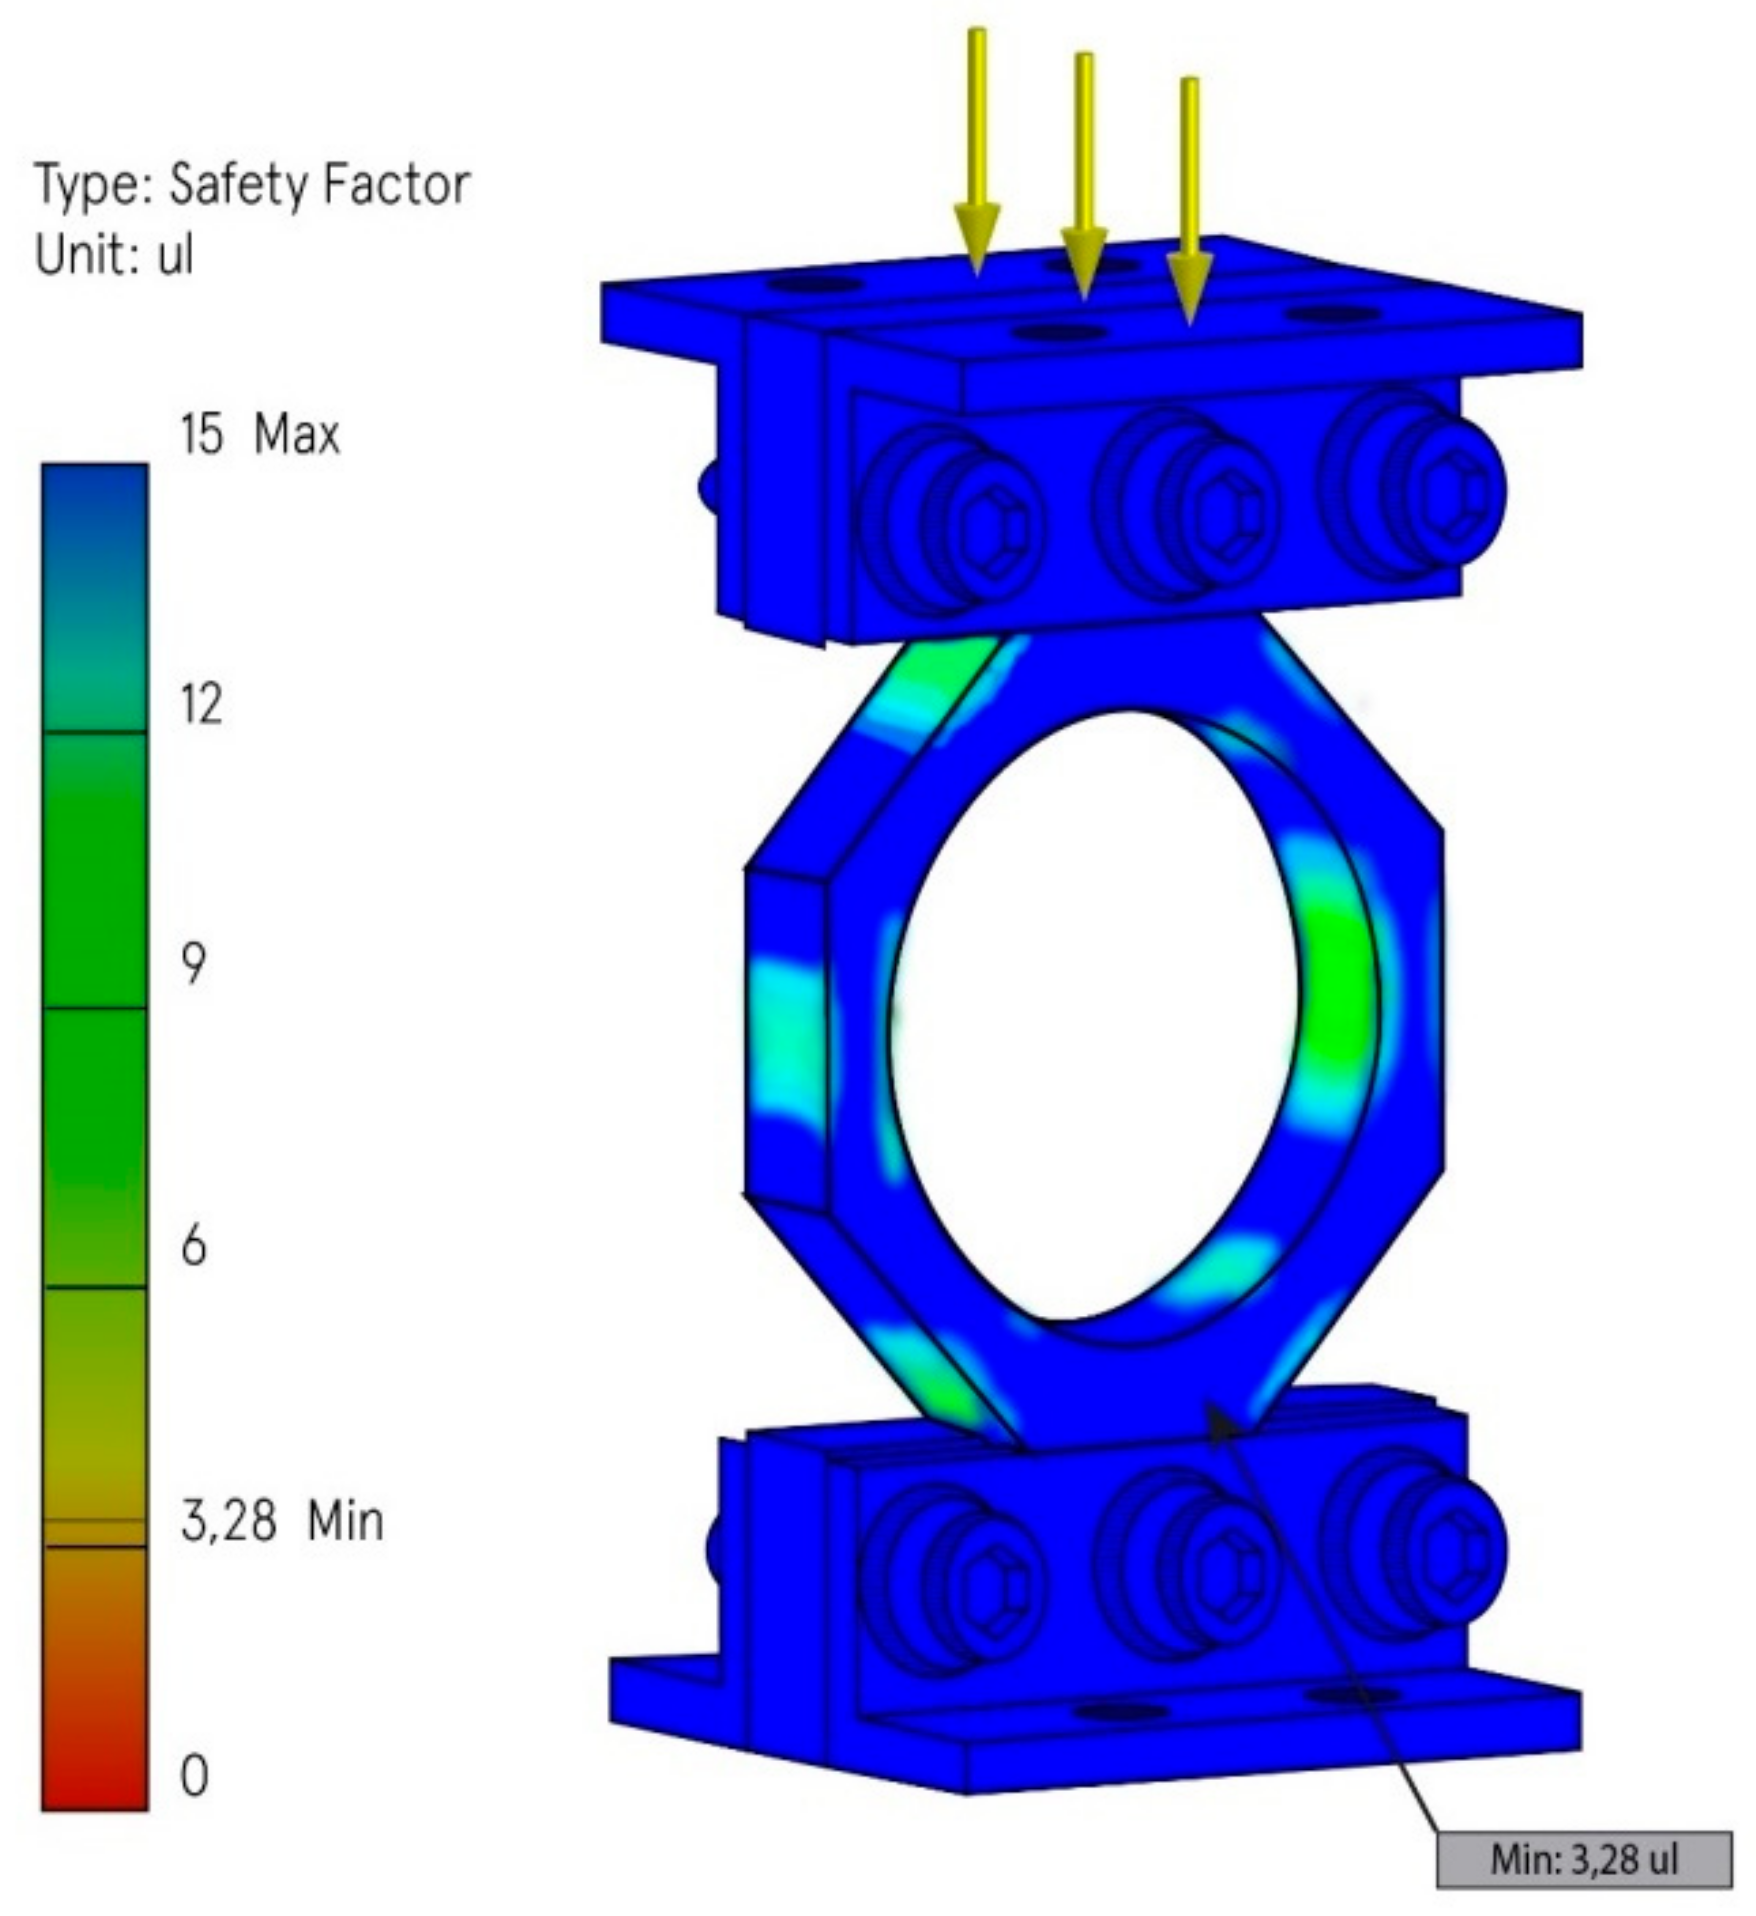
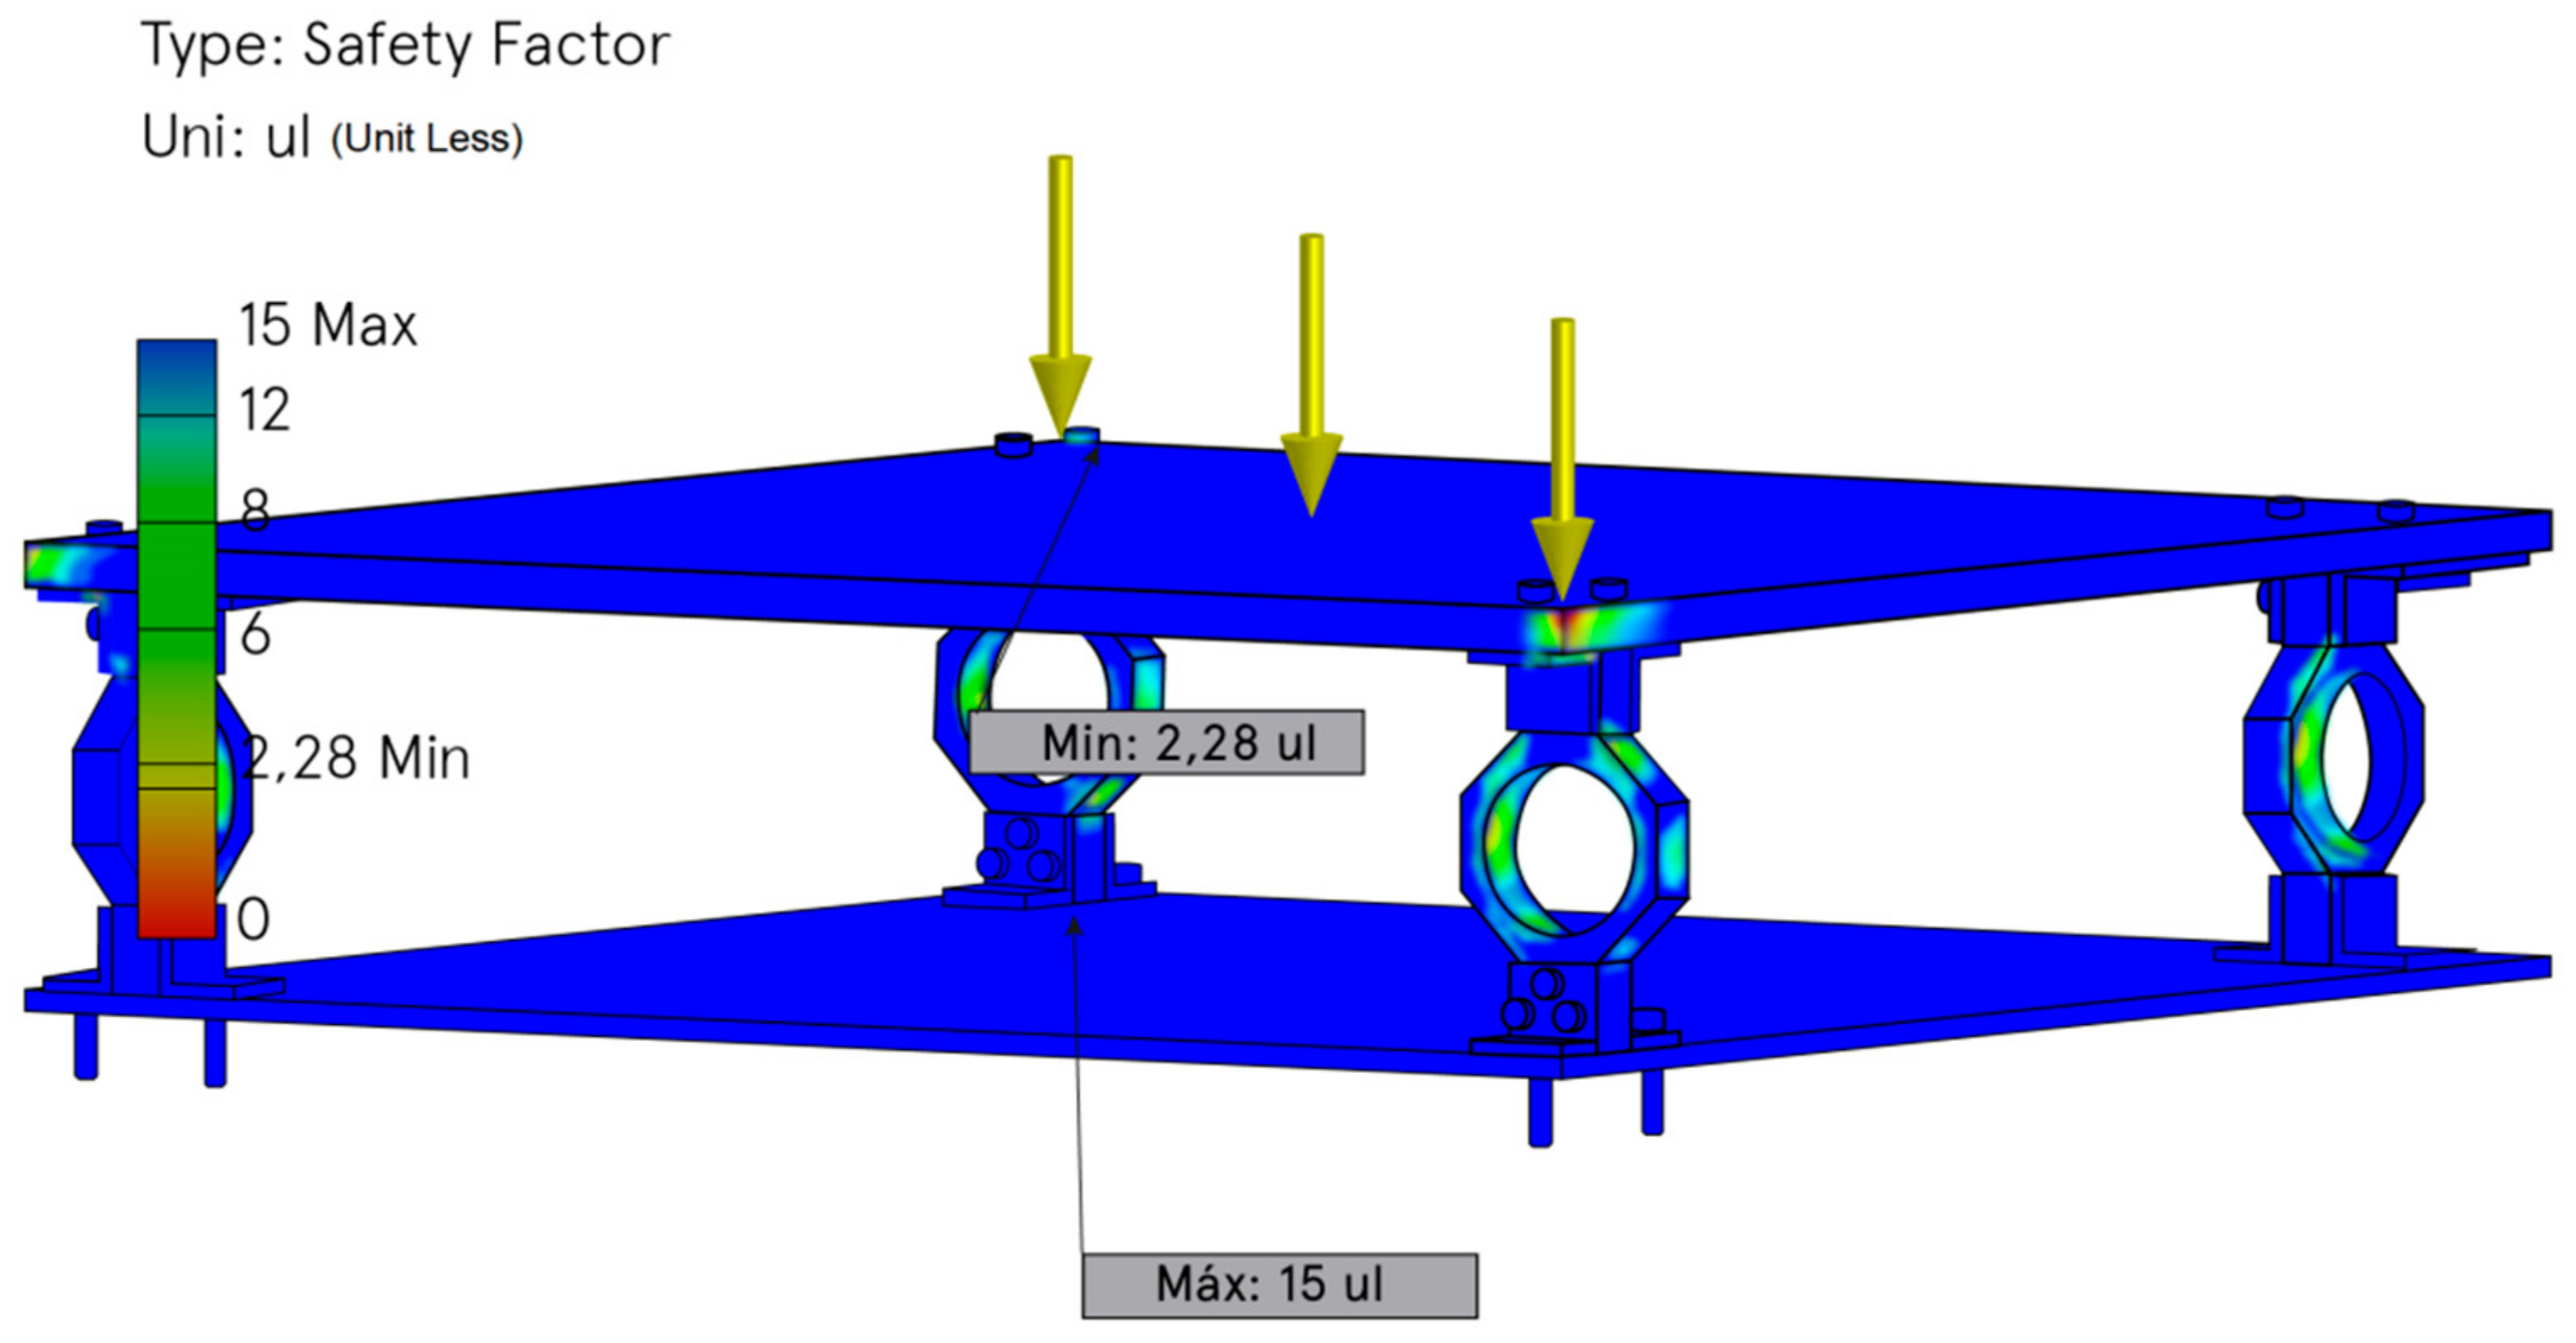
- Safety Factor Analysis
- —
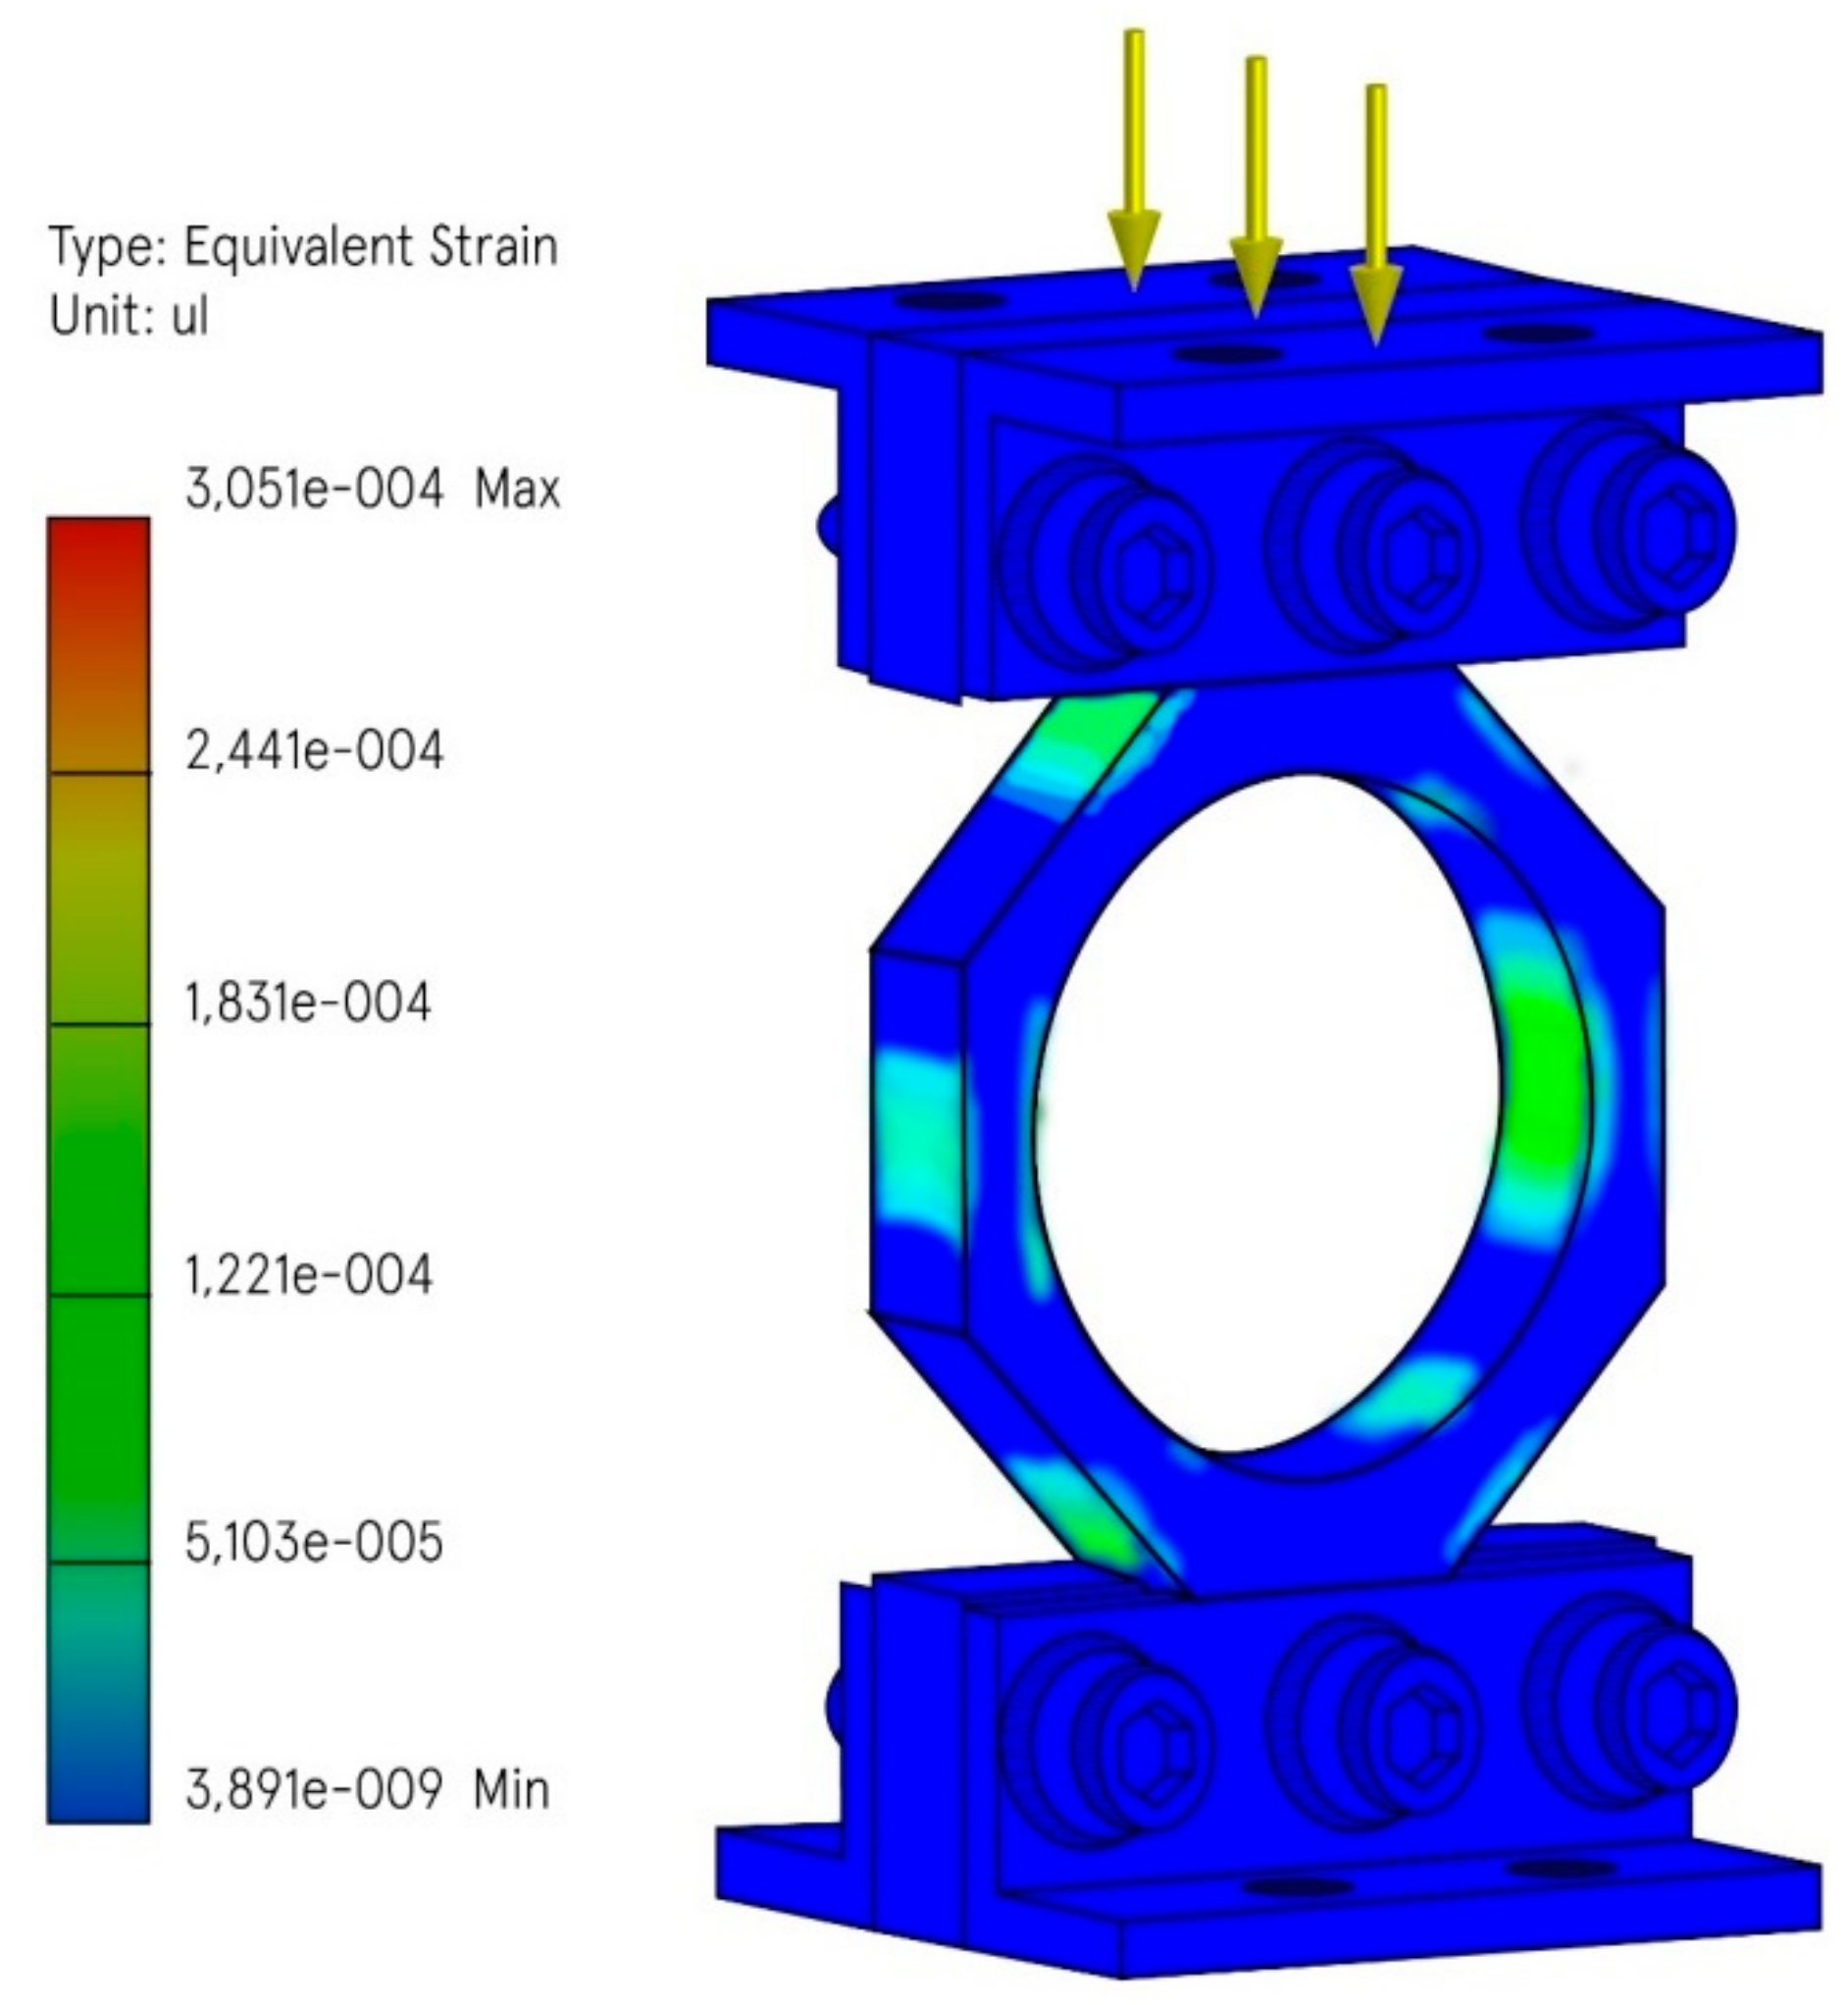
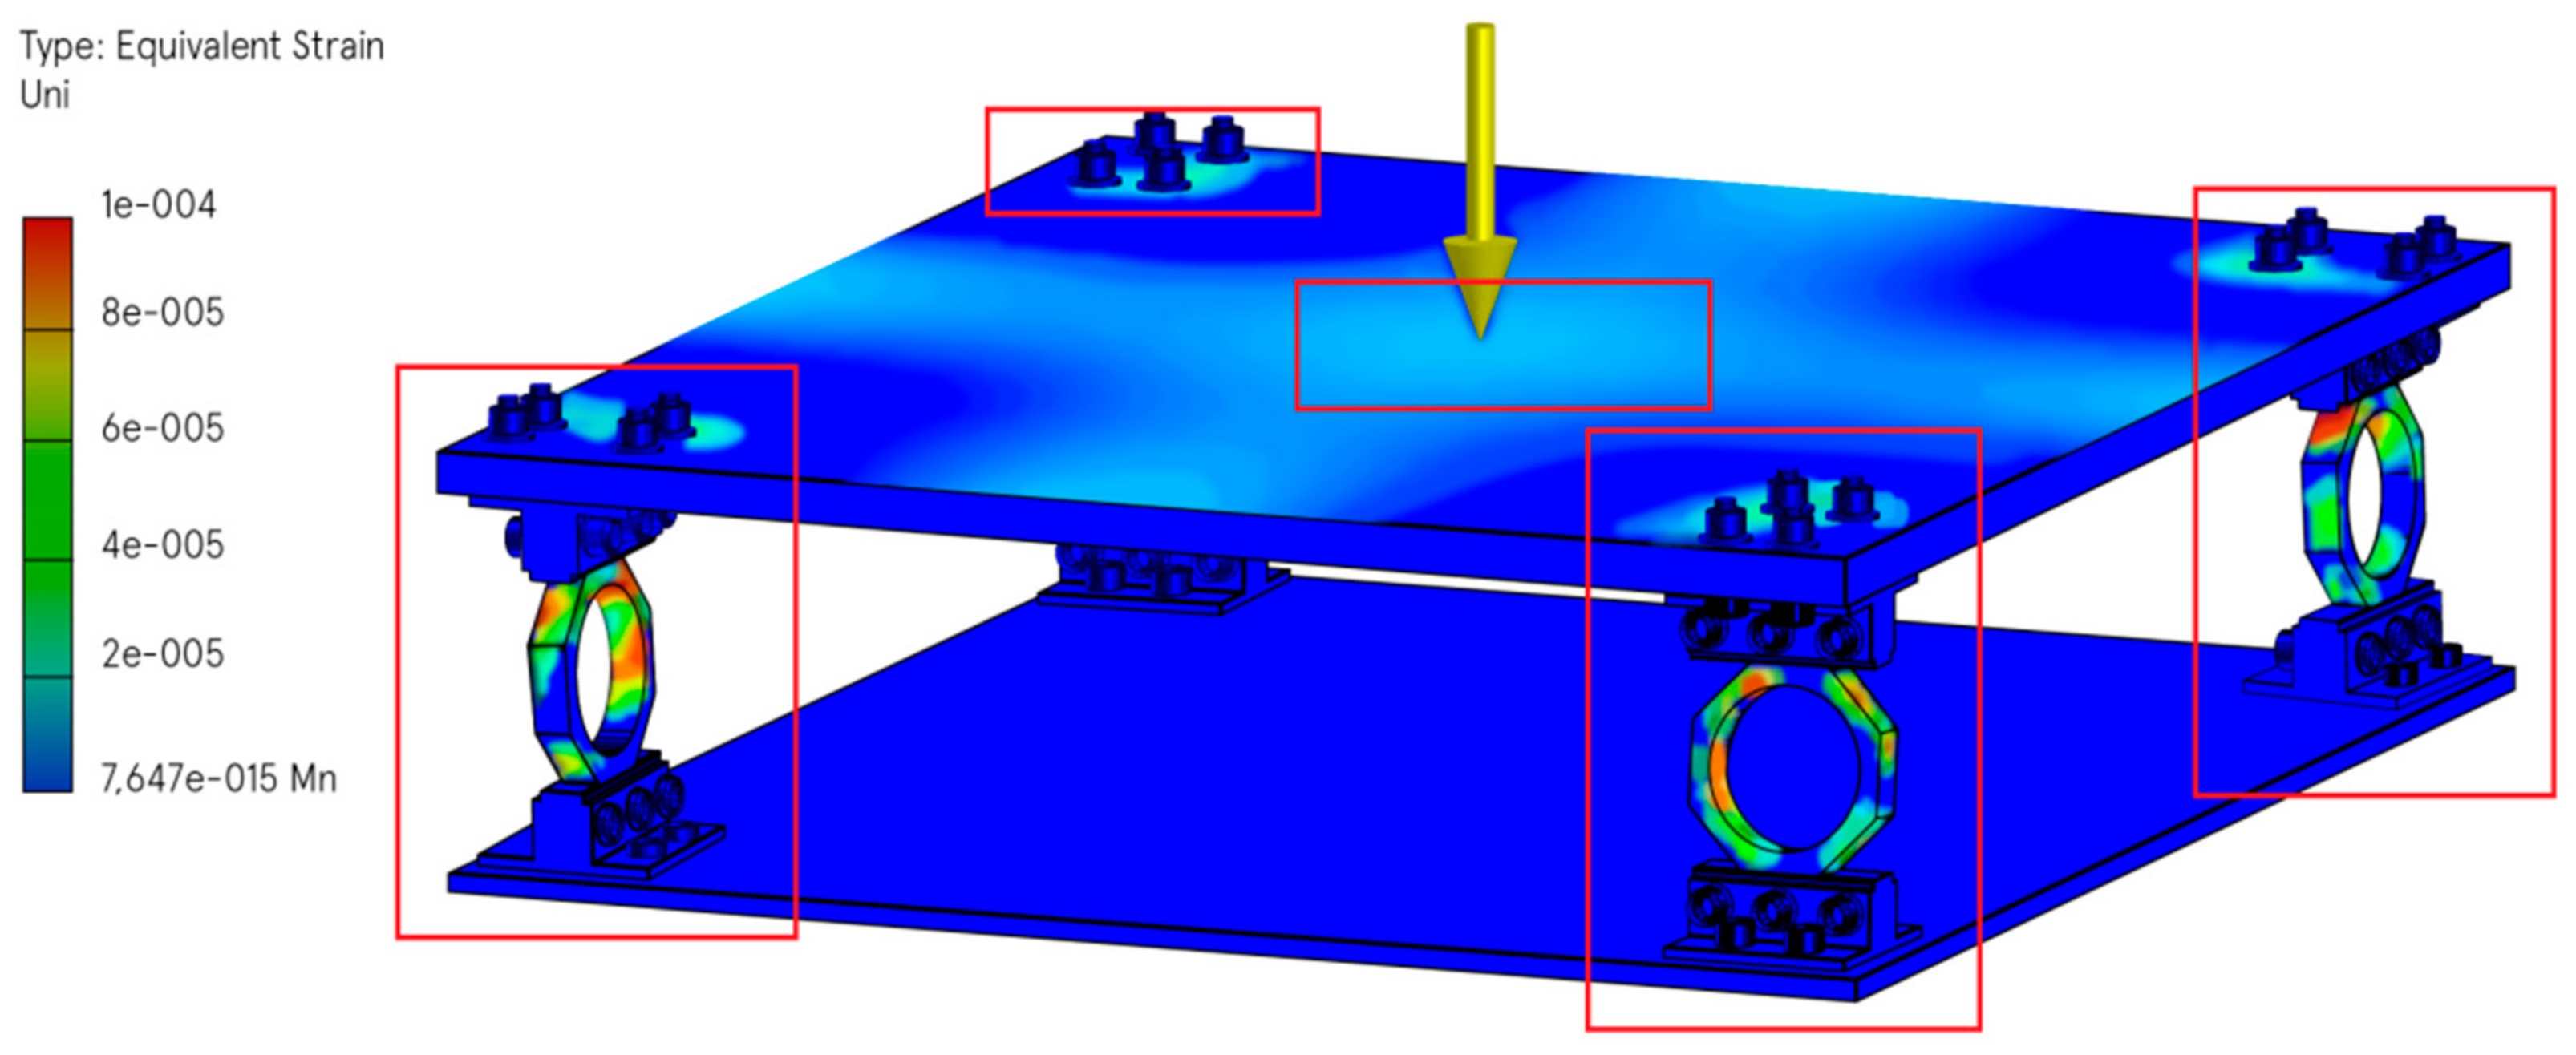
- Strain Analysis
- (a)
- Load Cells
- —
- Von Mises Stress Analysis
- —
- Safety Factor Analysis
- —
- Strain Analysis
- (b)
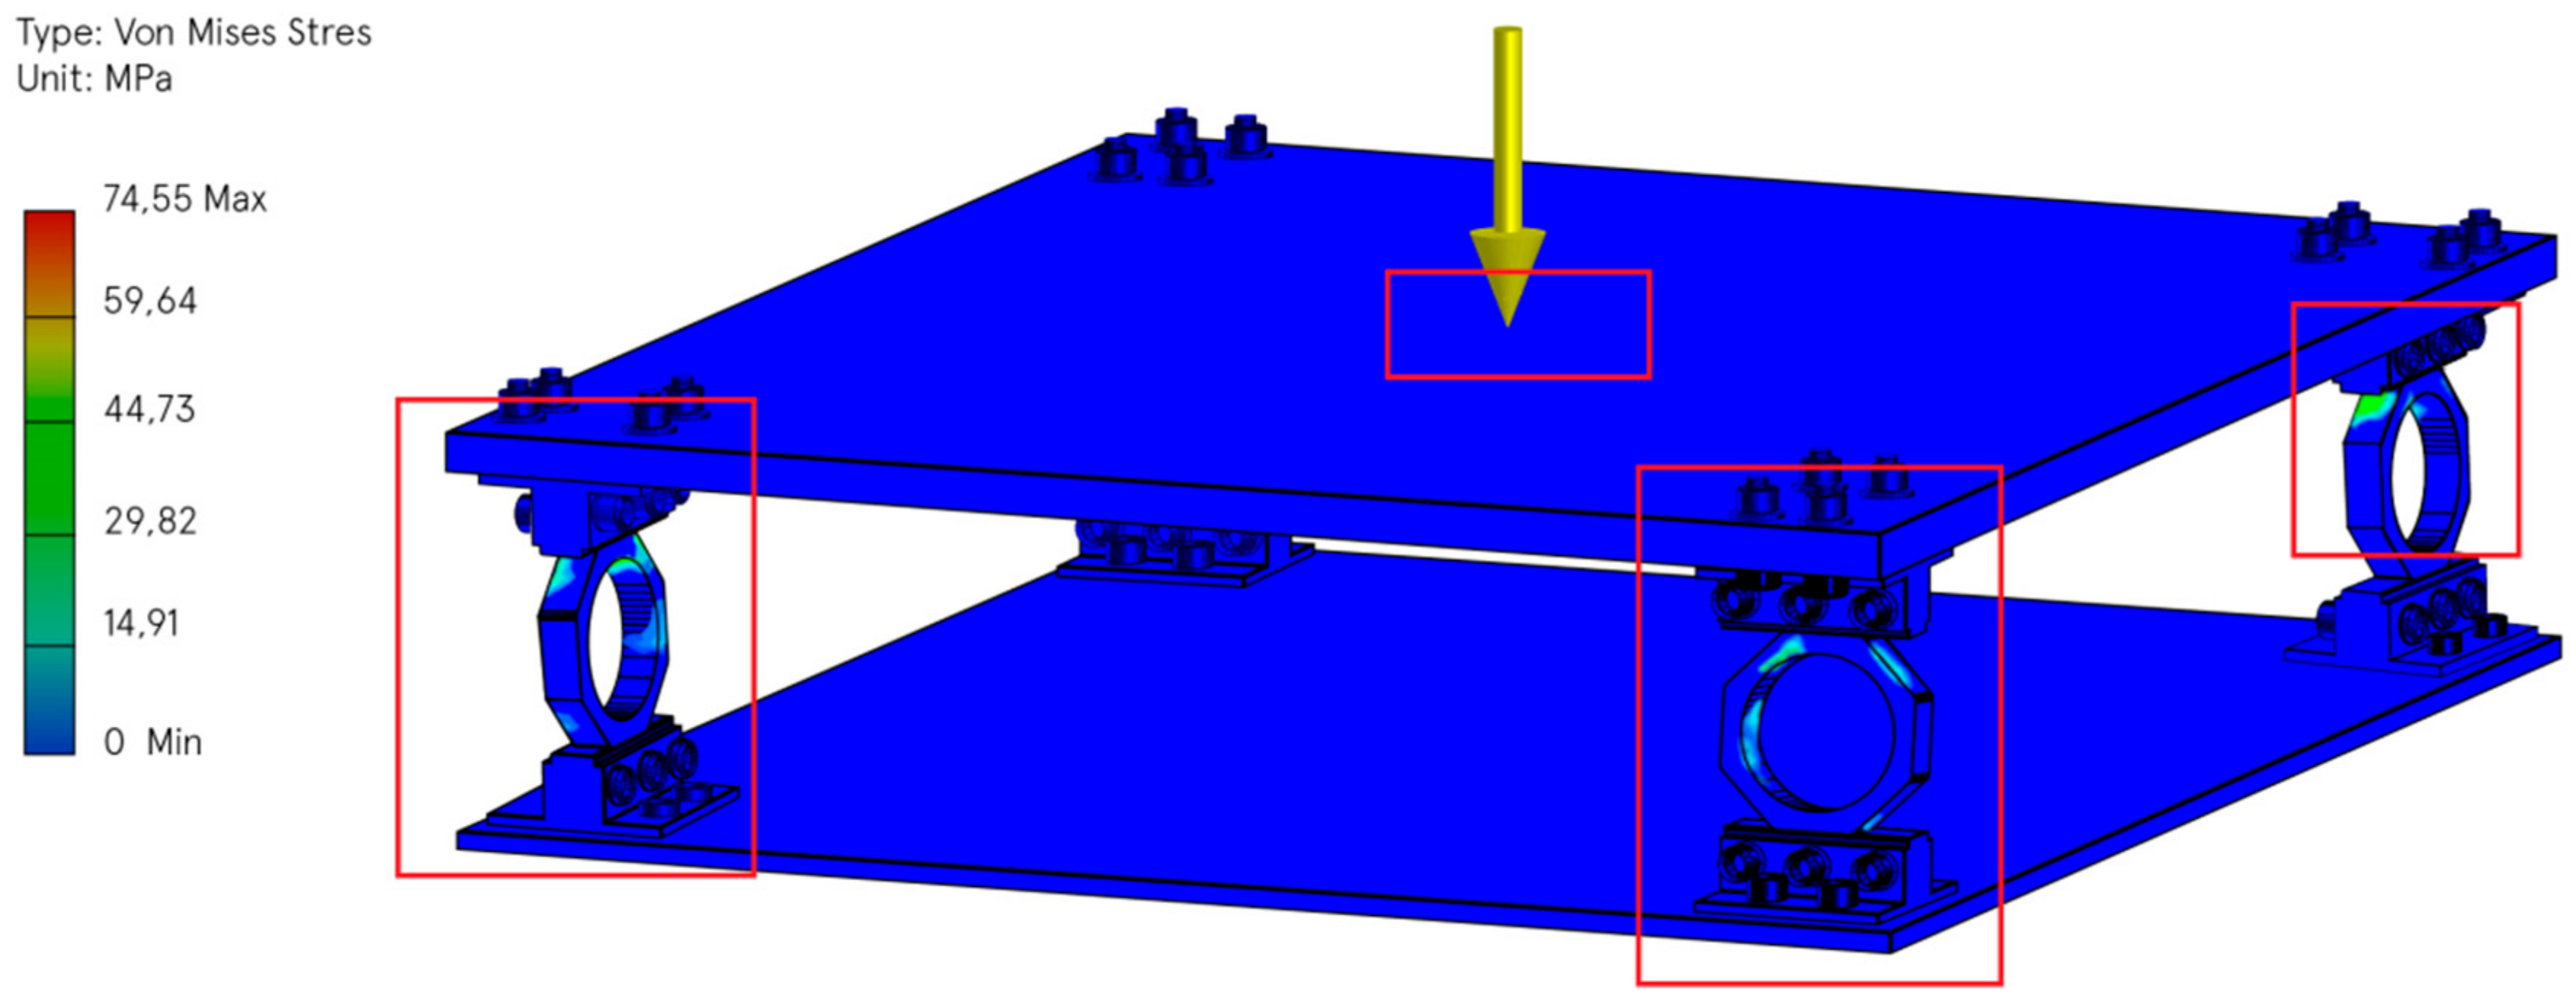
- Lower and Upper Bases—Complete Platform
- —
- Von Mises Stress Analysis
- —
- Safety Factor Analysis
- —
- Strain Analysis
- (c)
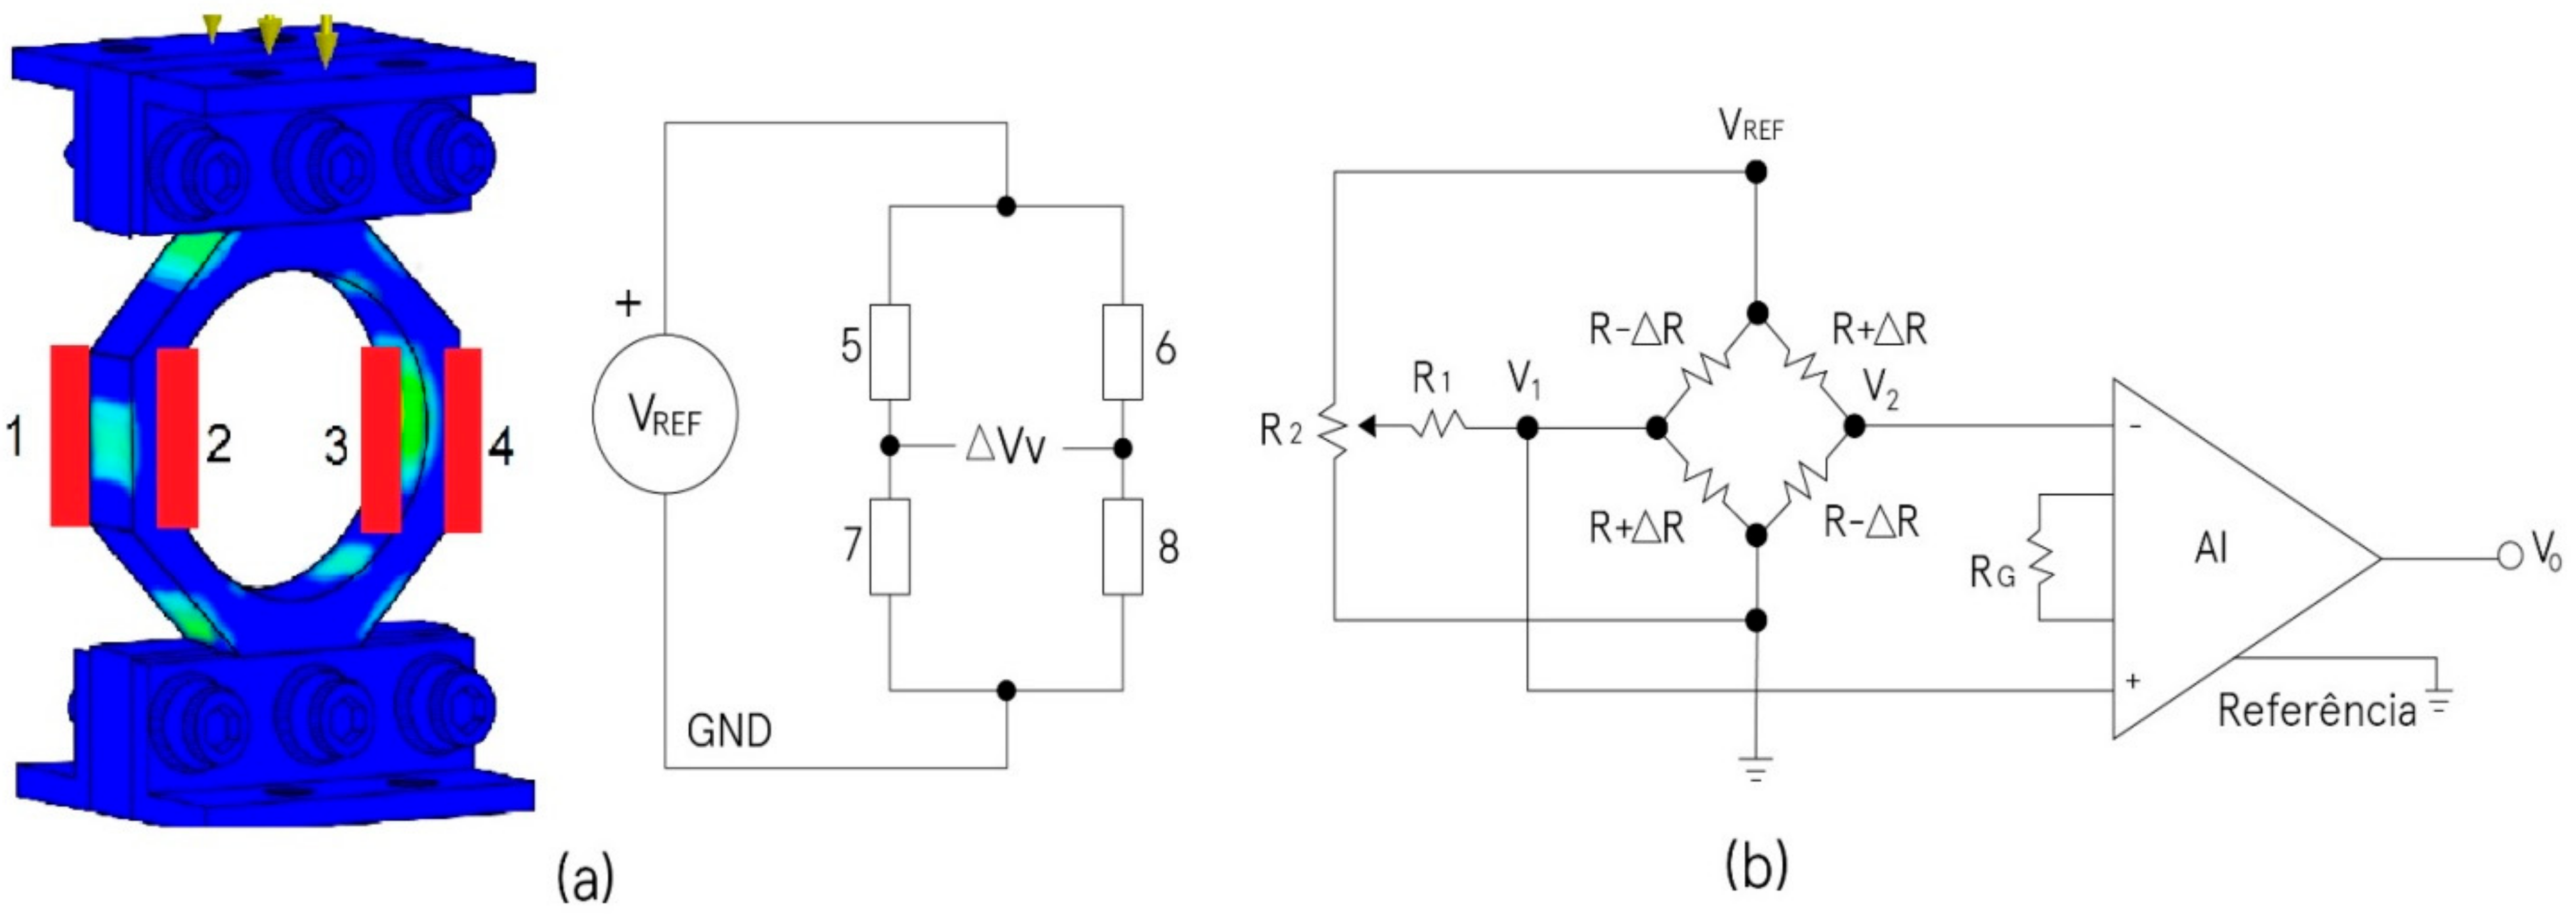
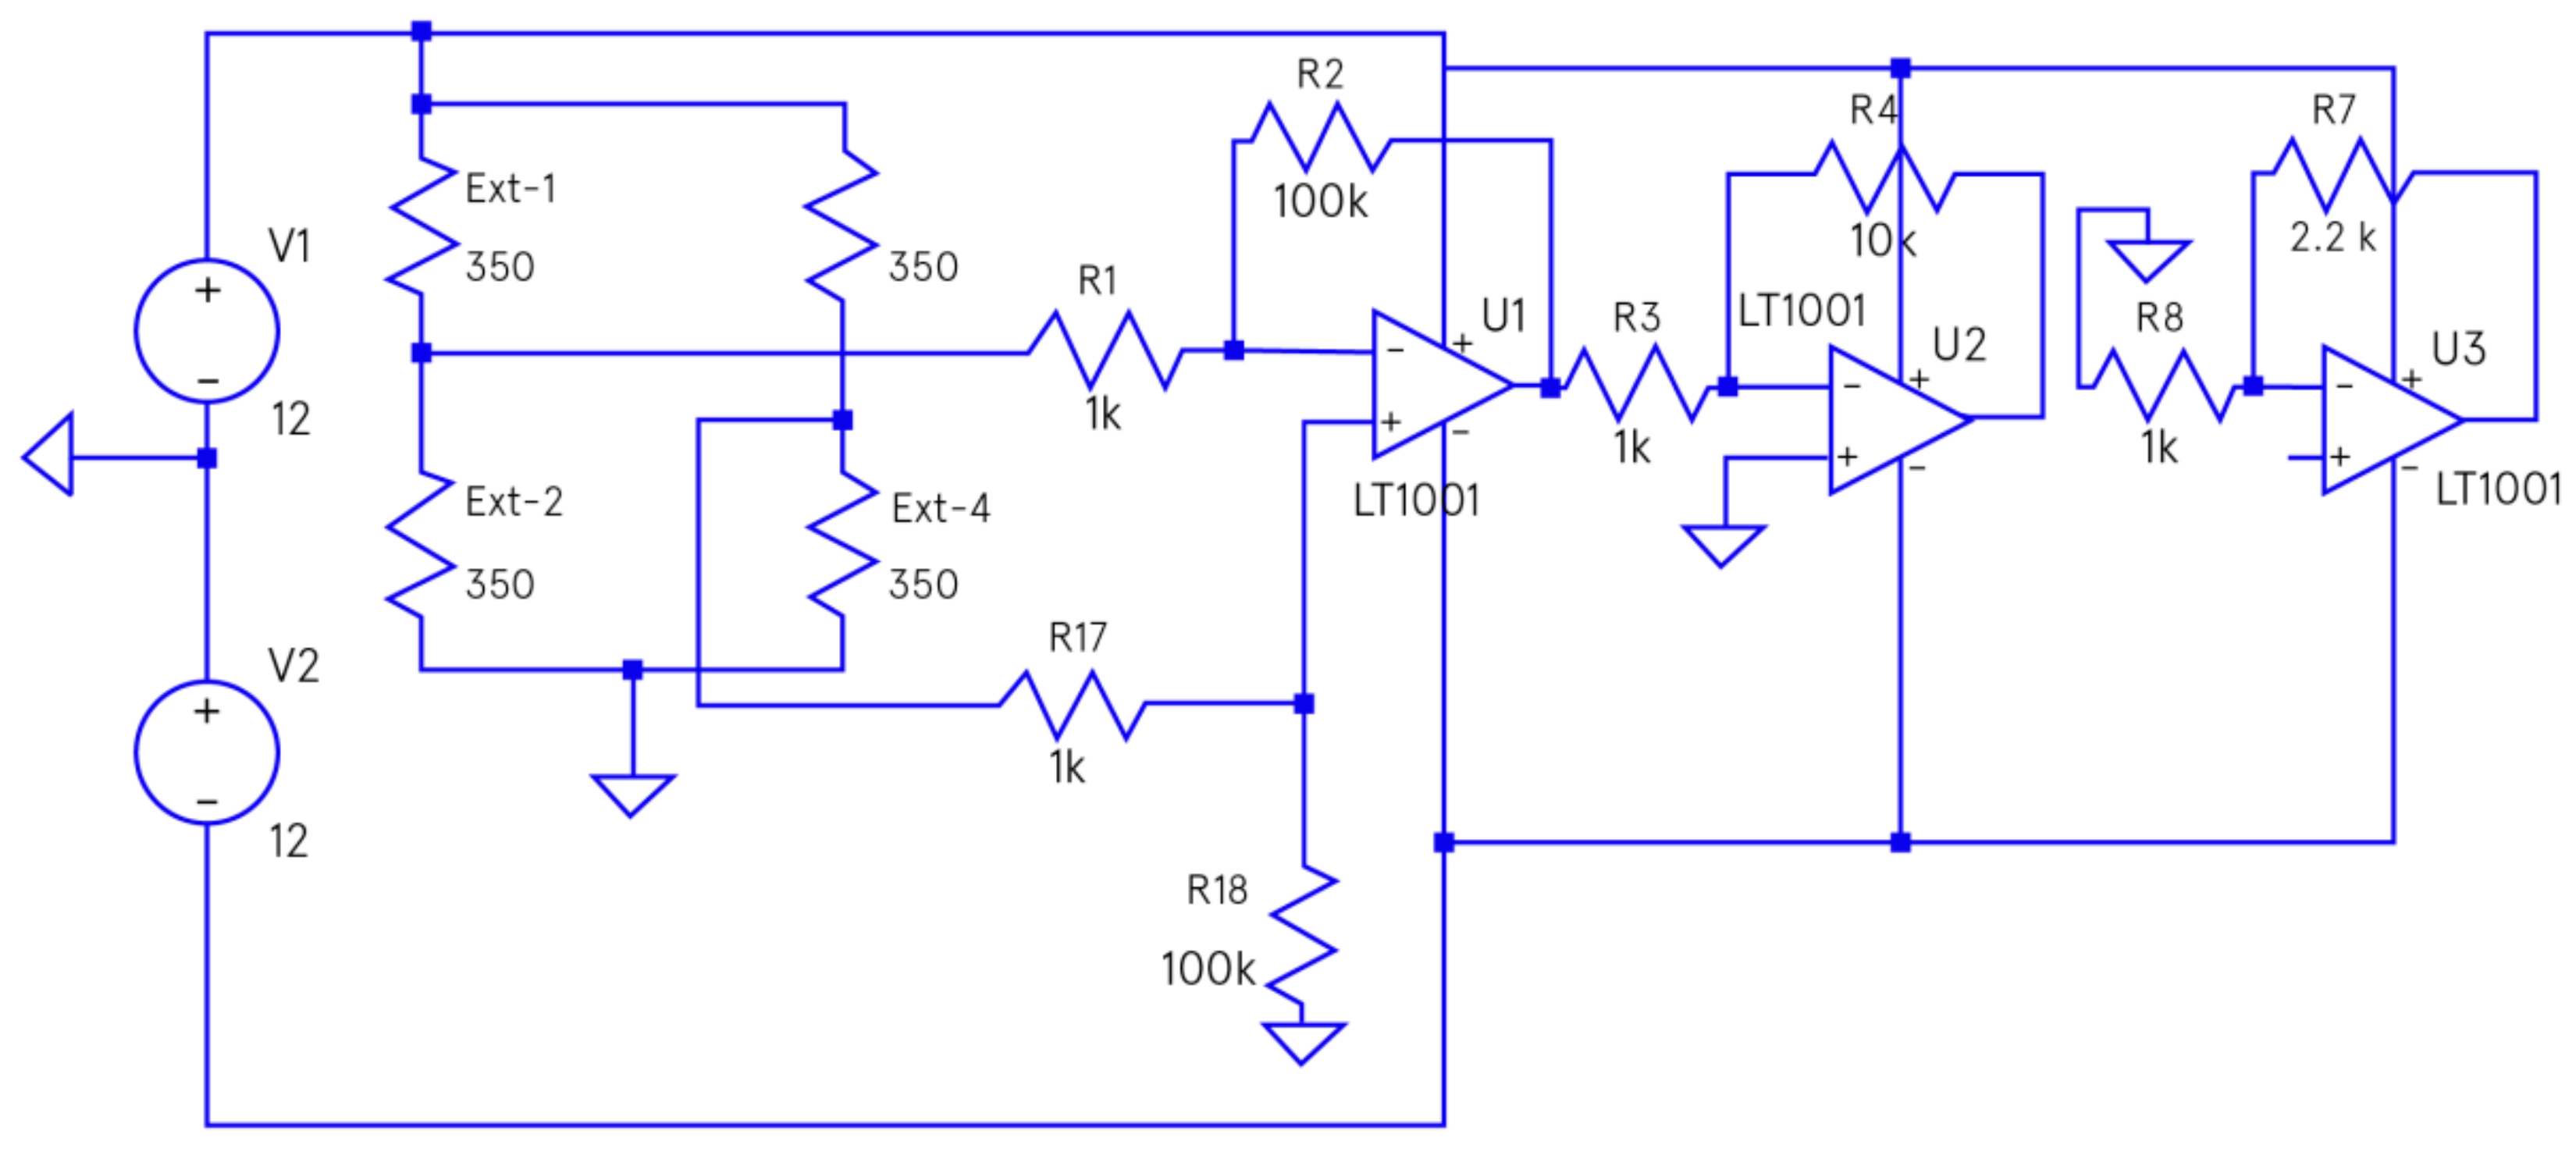
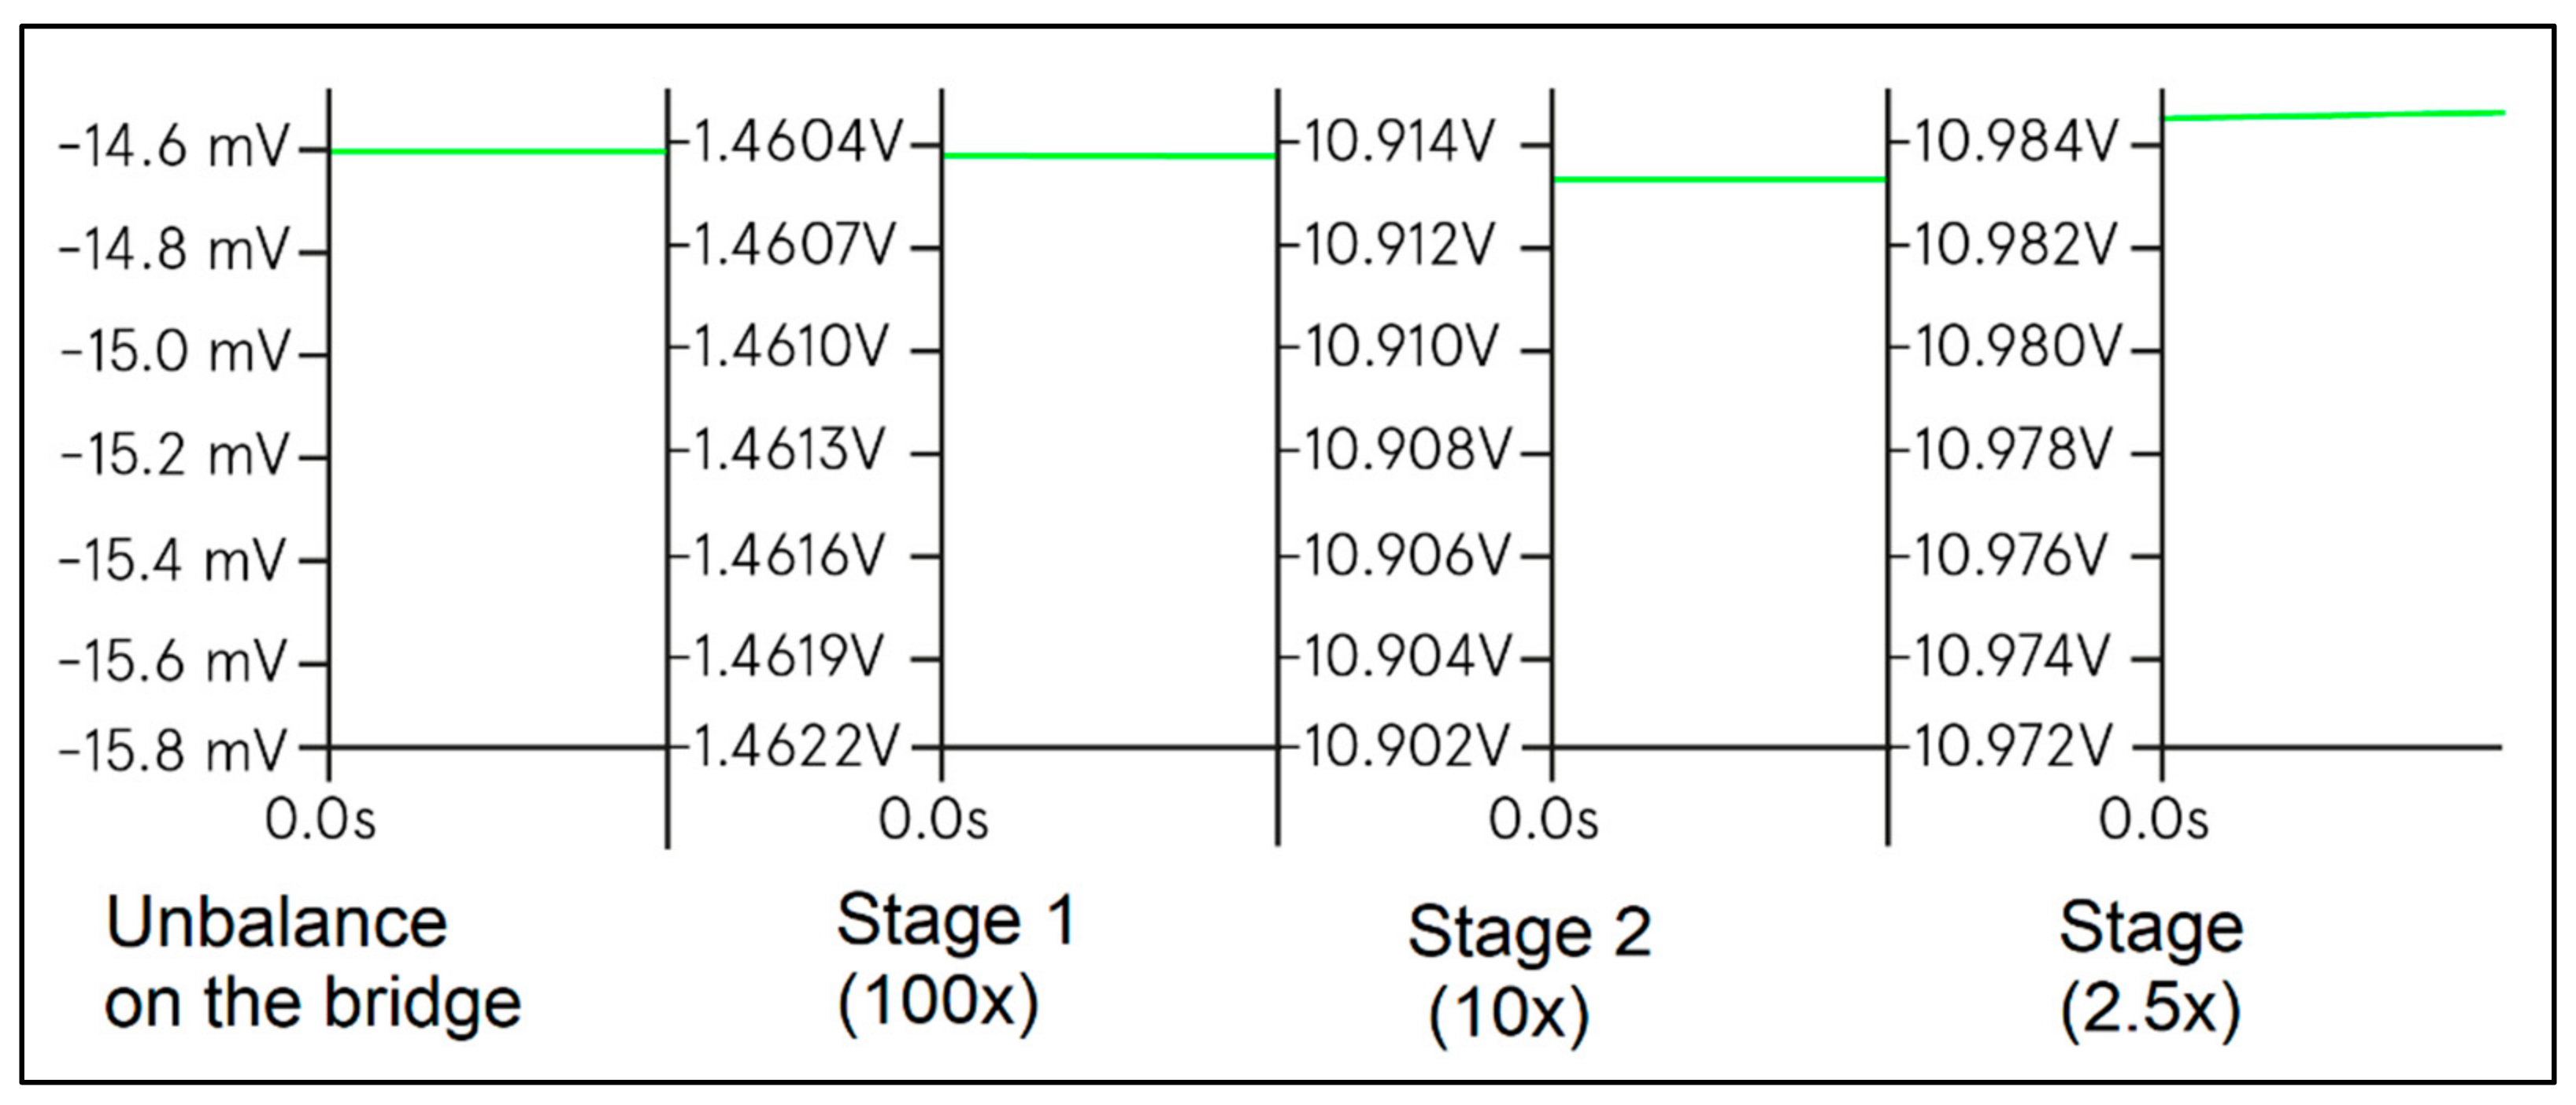
- Amplification Circuit for Wheatstone Bridge
- —
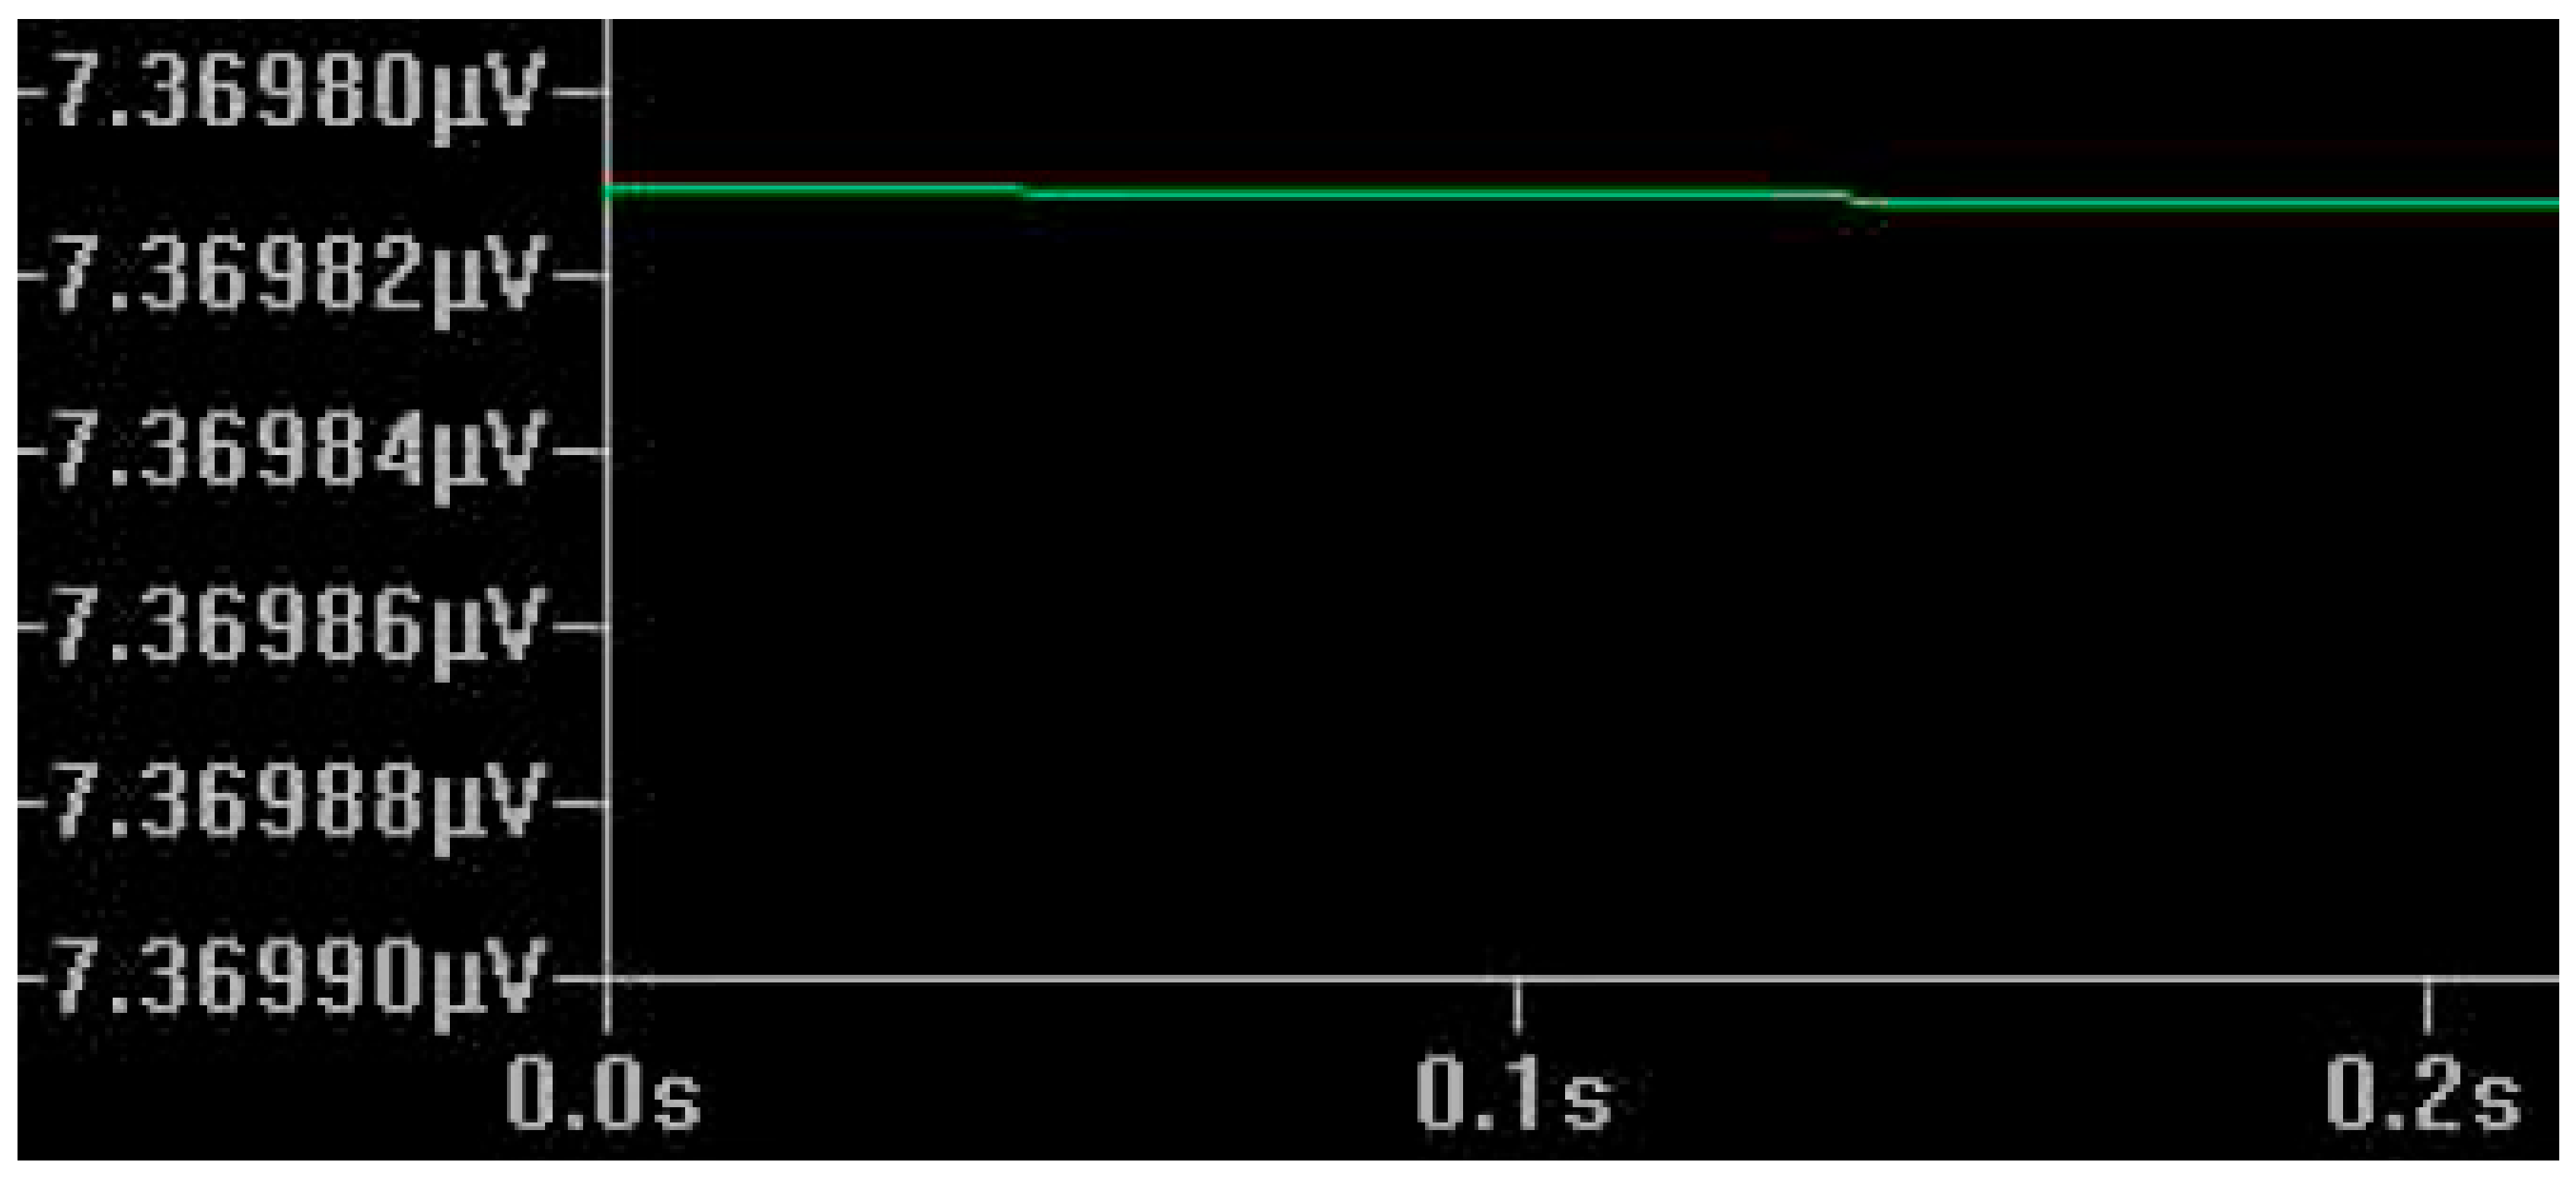
- Acquisition of the signal from the Wheatstone bridge;
- —
- DC level control (offset);
- —
- Amplification stages.
2.2.4. Sampling System
3. Results
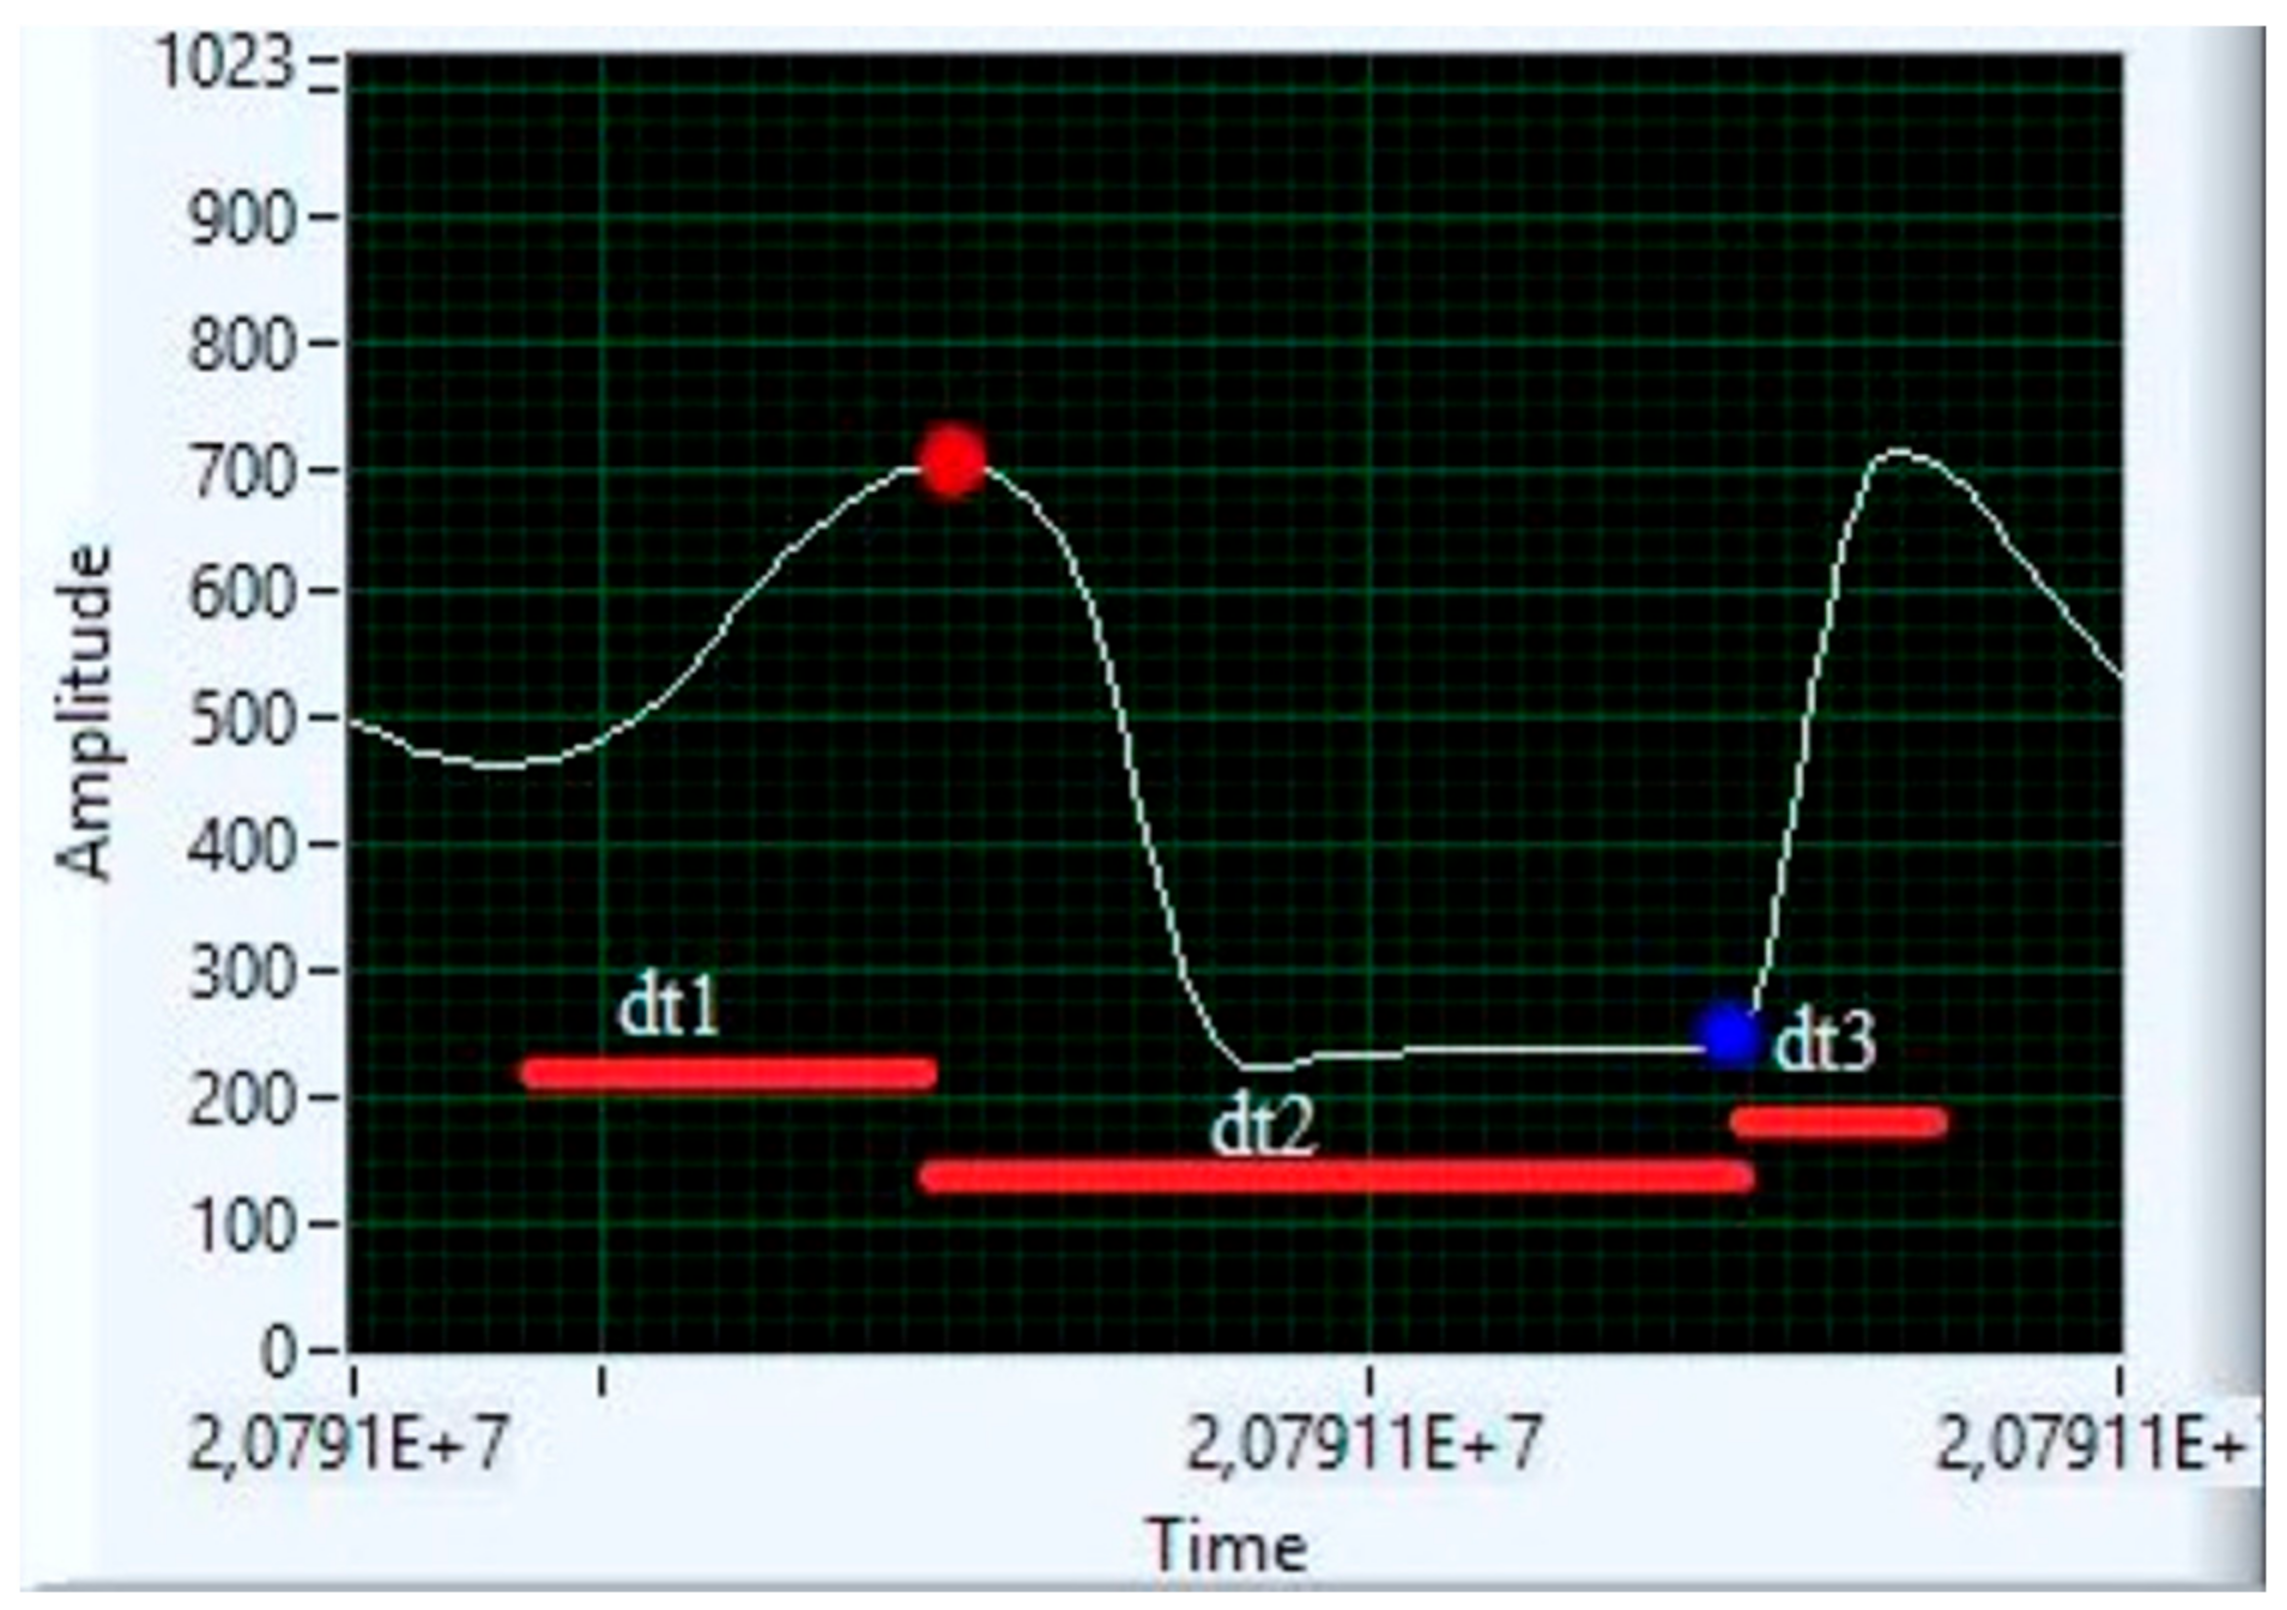
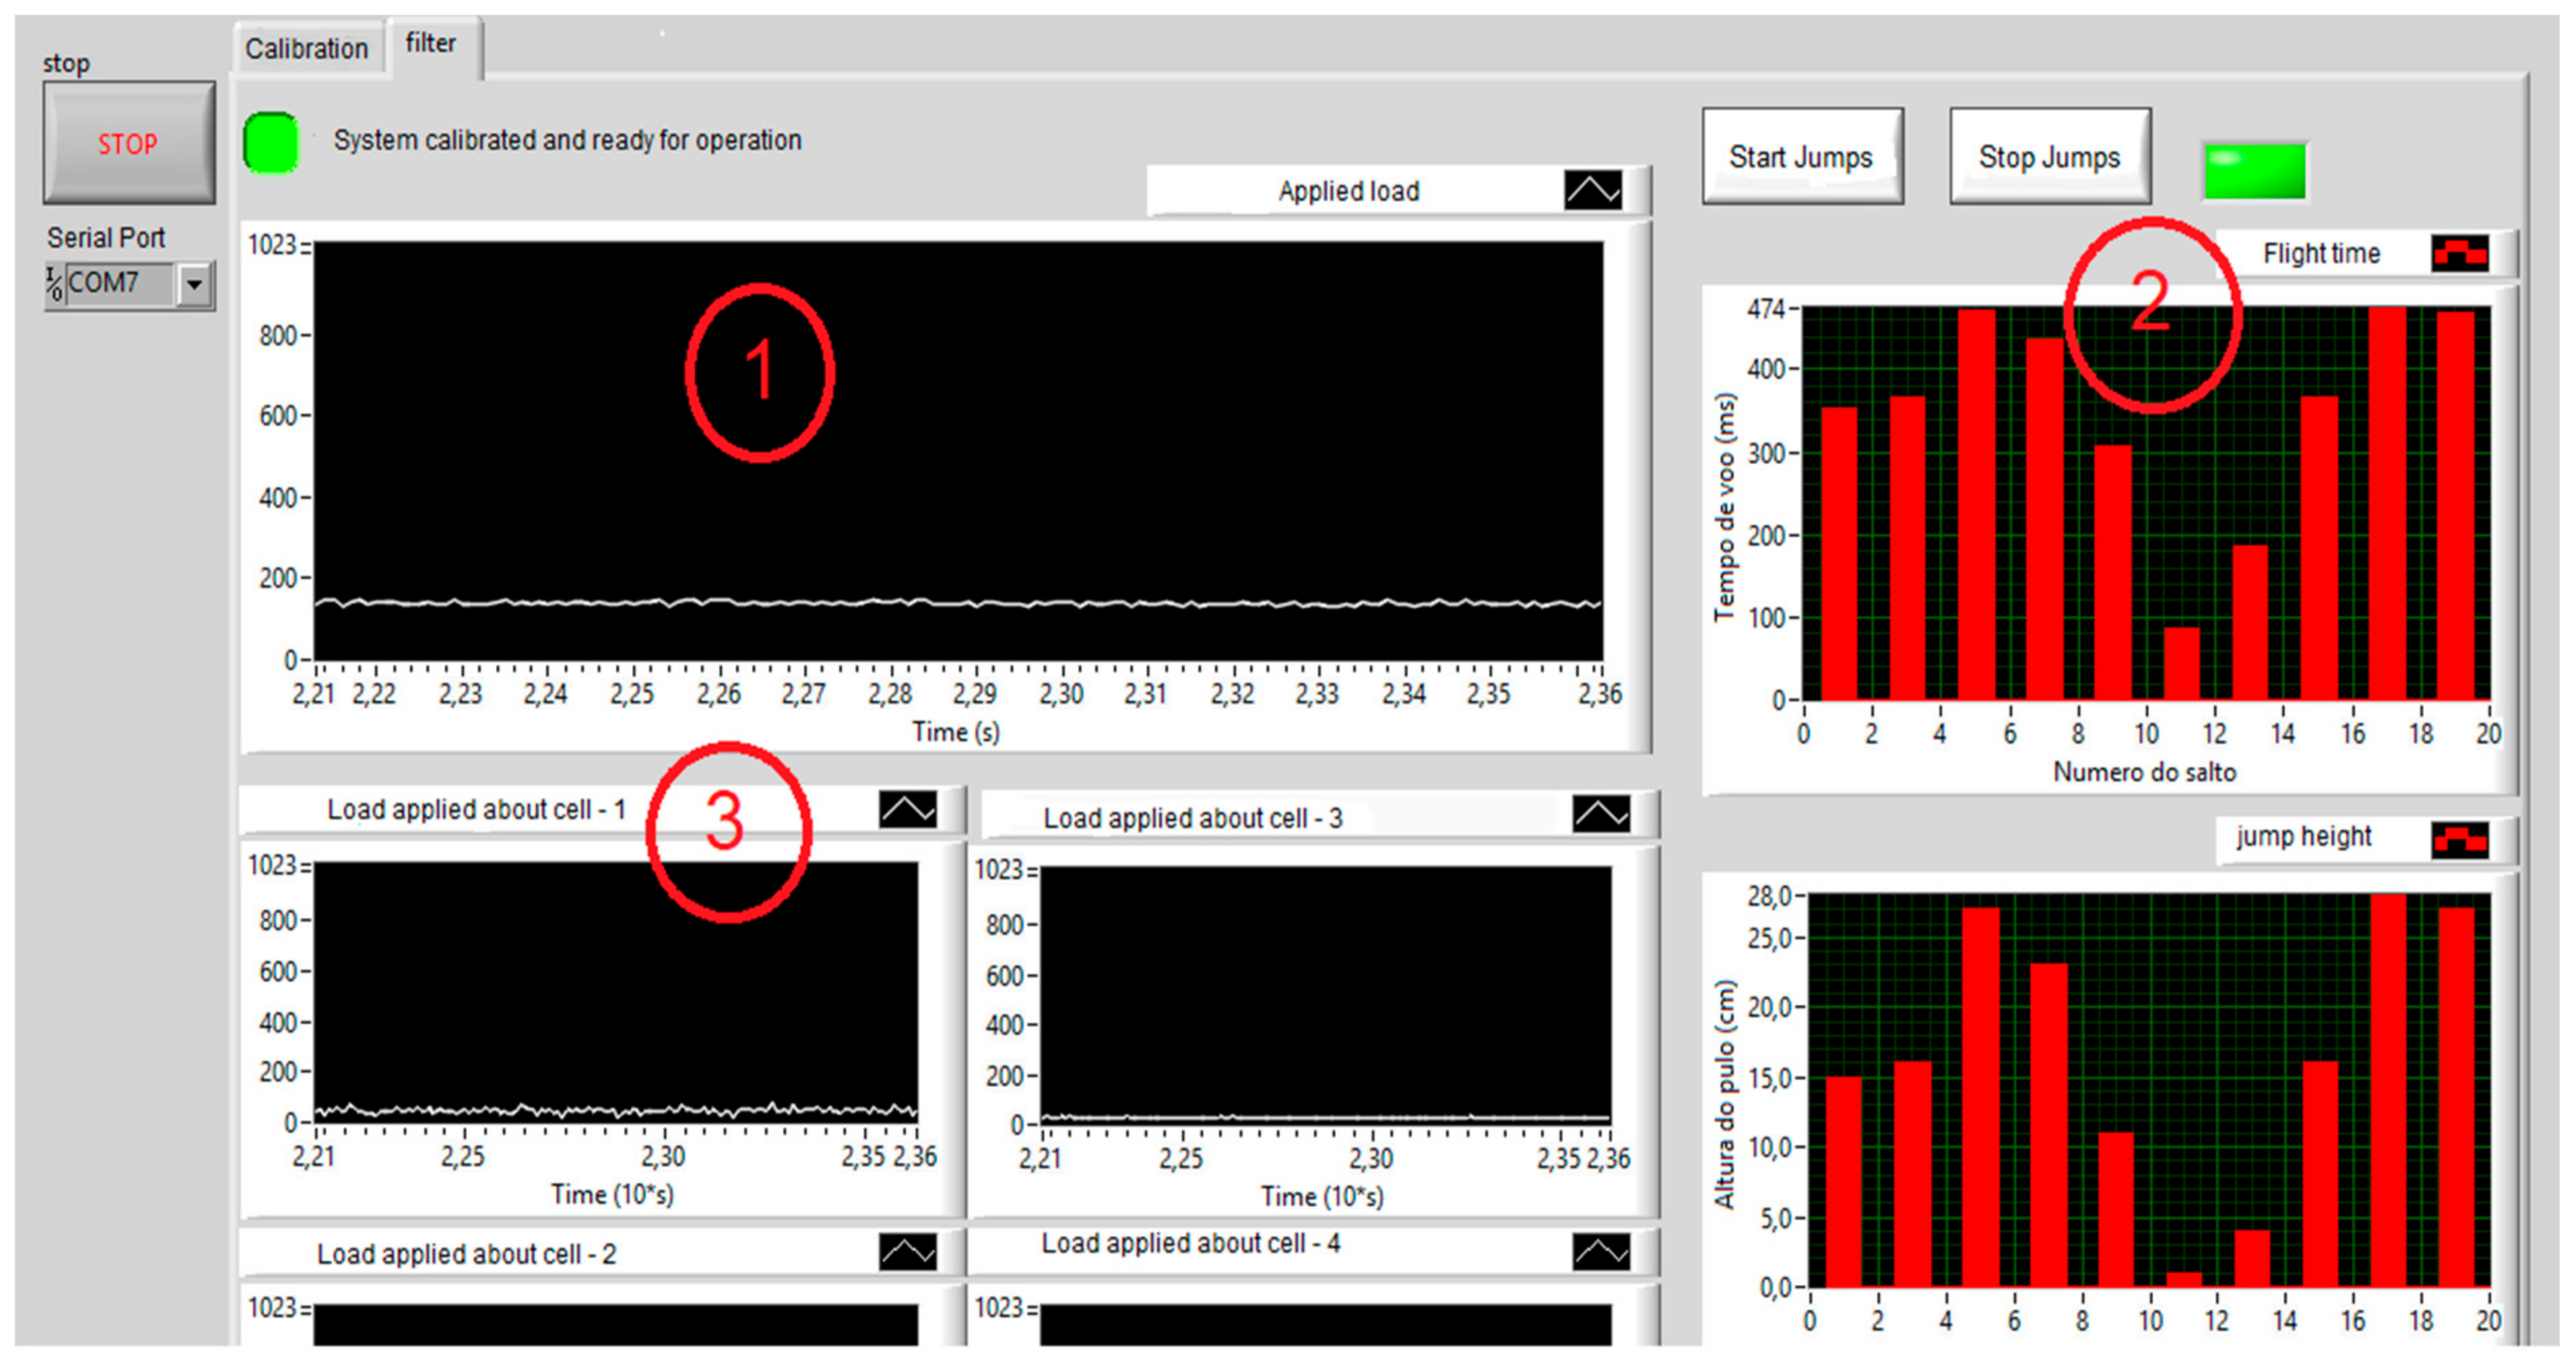
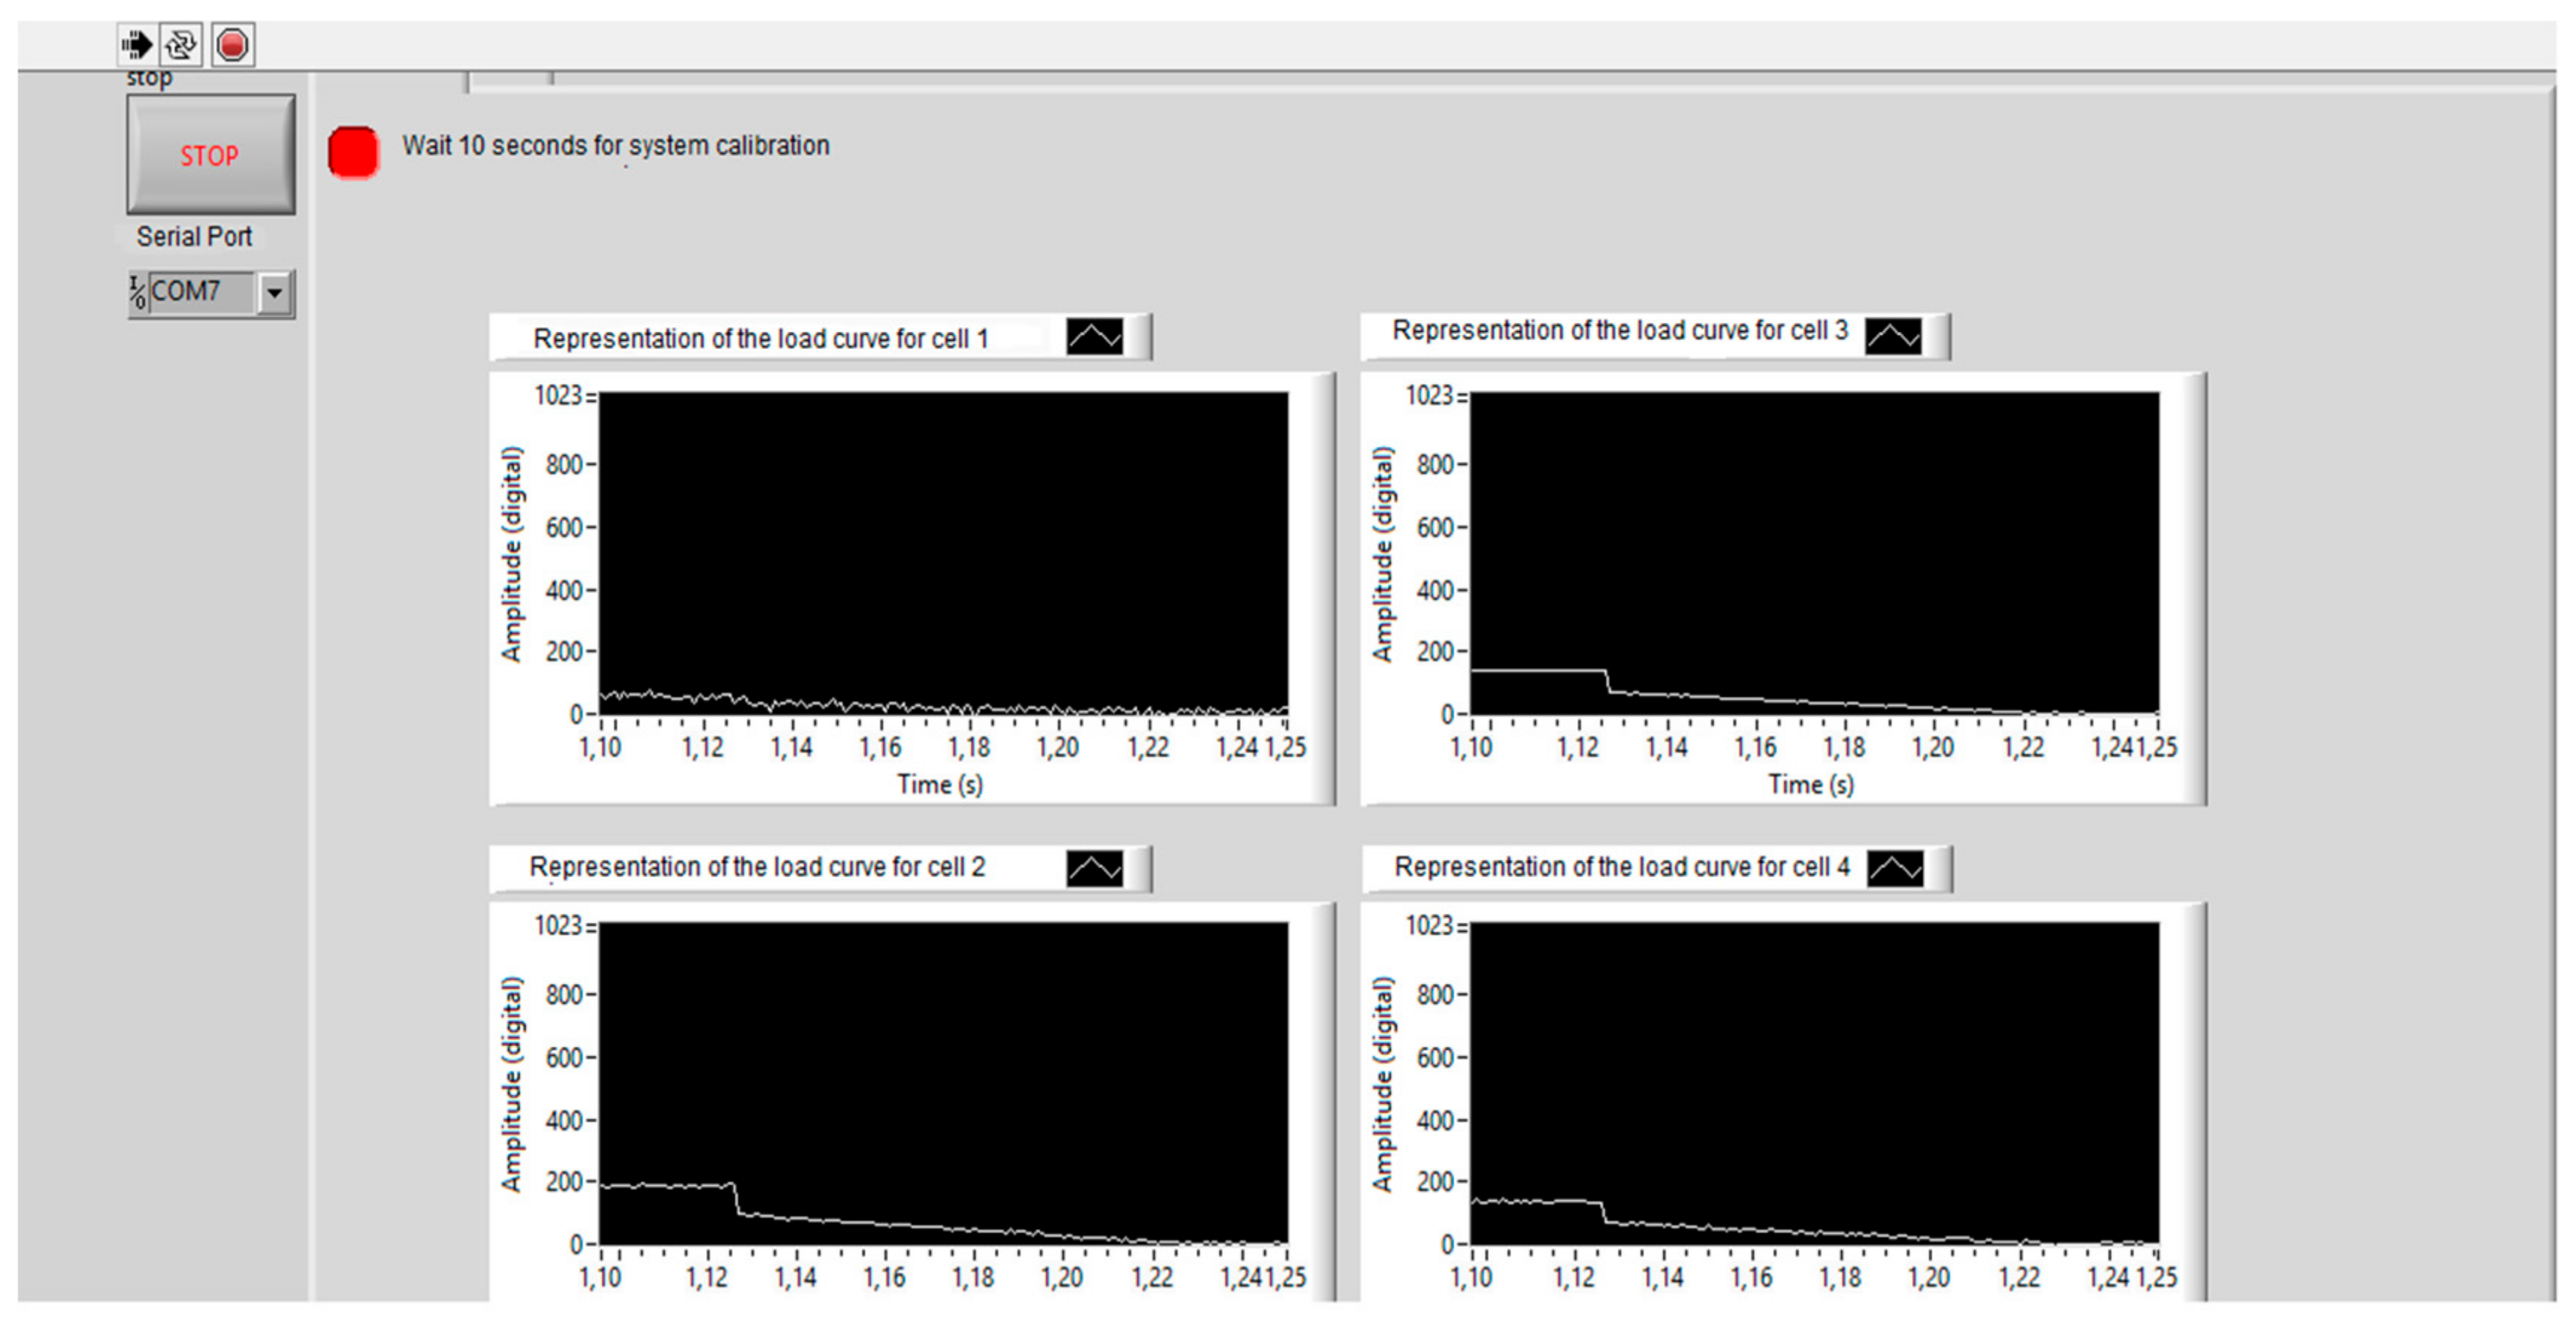
3.1. User Interface
- Time of impulse for the jump, moment when the body prepares to jump (dt1);
- Flight time, moment when the body is in the air (dt2);
- Fall time, moment when forces dissipate (dt3).
3.2. Force Platform
4. Discussion
- —
- Load Cells and Extensometers
- —
- Sampling System
- —
- User Interface (Data Normalization)
- —
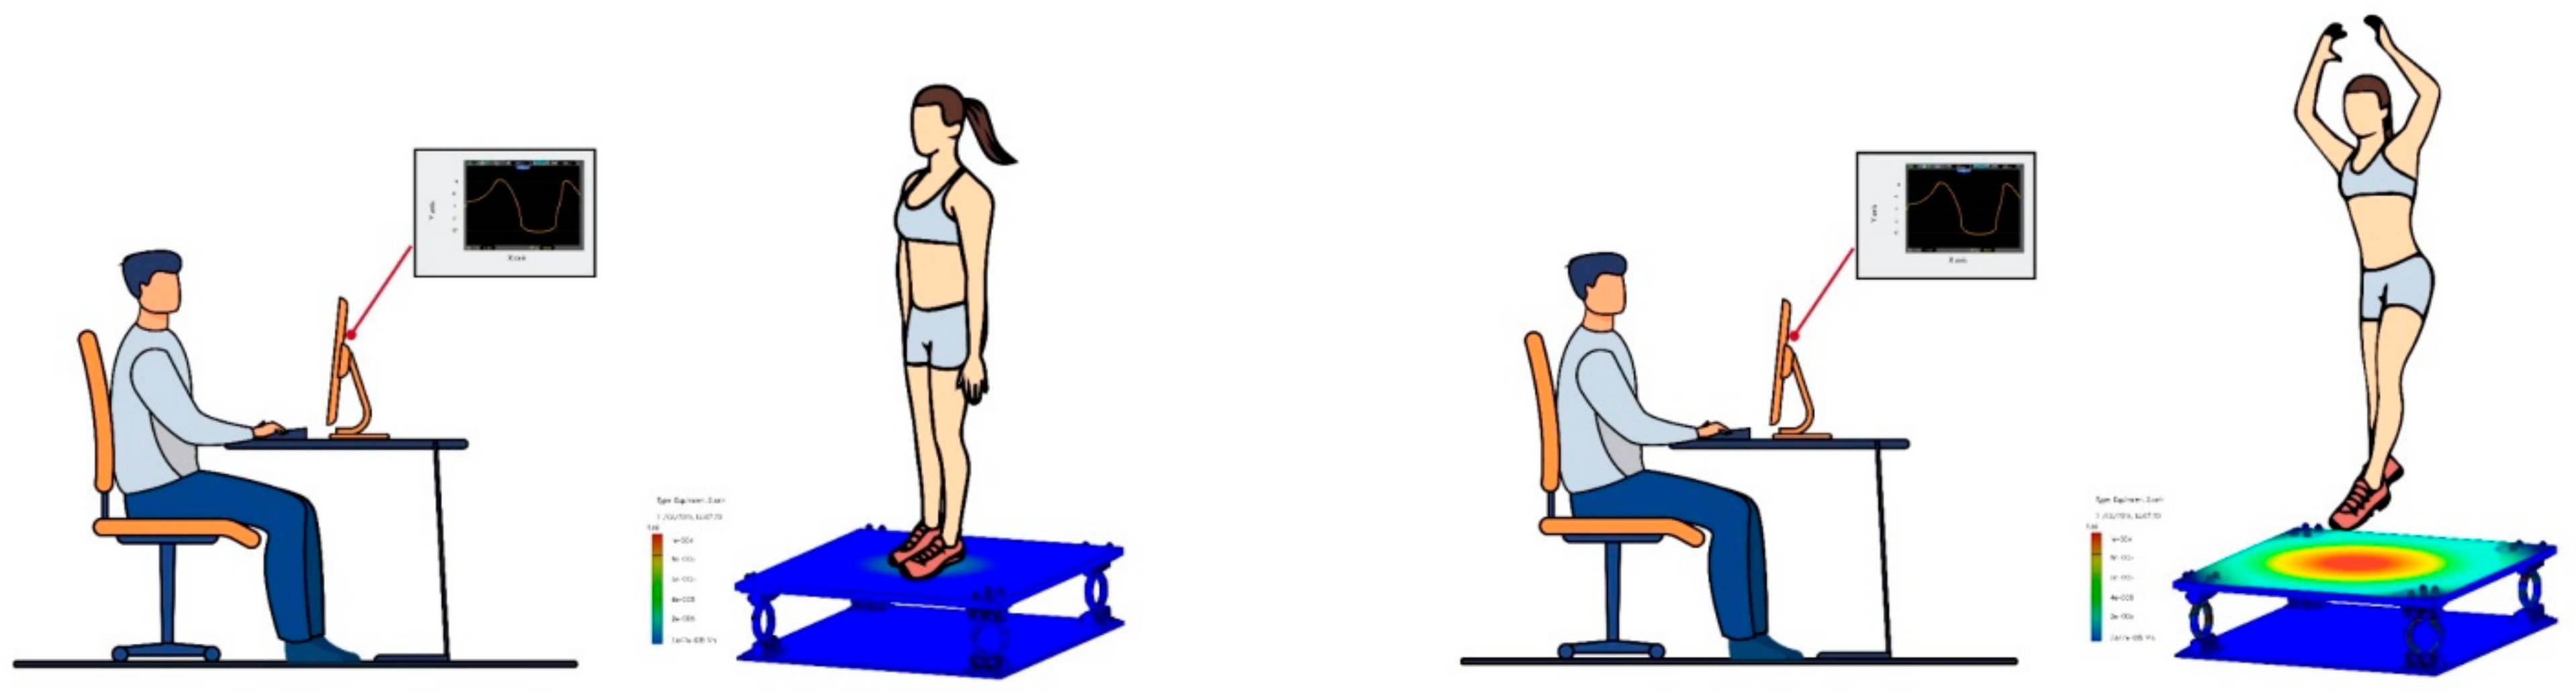
- Application of the Force Platform in the Flight Analysis of Volleyball Athletes
5. Conclusions
Author Contributions
Funding
Acknowledgments
Conflicts of Interest
References
- Barry, B.K.; Carson, R.G. The consequences of resistance training for movement control in older adults. J. Gerontol. Ser. A Boil. Sci. Med. Sci. 2004, 59, M730–M754. [Google Scholar] [CrossRef] [Green Version]
- Pacheco, M.M.; Teixeira, L.A.C.; Franchini, E.; Takito, M.Y. functional vs. Strength training in adults: Specific needs define the best intervention. Int. J. Sports Phys. Ther. 2013, 8, 34–43. [Google Scholar]
- Schaap, L.A.; Koster, A.; Visser, M. Adiposity, Muscle Masss, and Muscle Strength in Relation to Functional Decline in Older Persons. Epidemiol. Rev. 2013, 35, 51–65. [Google Scholar] [CrossRef] [Green Version]
- Samadi, B.; Raison, M.; Detrembleur, C.; Ballaz, L. Real-time detection of reaction forces during gait on a ground equipped with a large force platform. In Proceedings of the 2014 Global Information Infrastructure and Networking Symposium (GIIS), Montreal, QC, Canada, 15–19 September 2014; pp. 1–3. [Google Scholar] [CrossRef]
- Kutilek, P. Gait Evaluation in Patients with Transtibial Prosthesis using Force Platforms. In Proceedings of the 2018 18th International Conference on Mechatronics—Mechatronika (ME), Brno, Czech Republic, 5–7 December 2018; pp. 1–4. [Google Scholar]
- Begg, R.; Rahman, S. A method for the reconstruction of ground reaction force-time characteristics during gait from force platform recordings of simultaneous foot falls. IEEE Trans. Biomed. Eng. 2000, 47, 547–551. [Google Scholar] [CrossRef] [PubMed]
- Orsini, F.; Scorza, A.; D’Anna, C.; Pompeo, N.; Silva, E.; Sciuto, S.A.; Leccese, F. A Method For Force Platforms Dynamic Performances Characterization In Clinical Applications. In Proceedings of the 2018 IEEE International Symposium on Medical Measurements and Applications (MeMeA), Rome, Italy, 11–13 June 2018; pp. 1–6. [Google Scholar] [CrossRef]
- Orsini, F.; Rossi, A.; Scorza, A.; Sciuto, S.A. Development and preliminary characterization of a novel system for the force platforms dynamic calibration. In Proceedings of the 2017 IEEE International Instrumentation and Measurement Technology Conference (I2MTC), Turin, Italy, 22–25 May 2017; pp. 1–6. [Google Scholar] [CrossRef]
- Boukhenous, S.; Attari, M.; Remram, Y. Force platform for postural balance analysis. In Proceedings of the 2012 11th International Conference on Information Science, Signal Processing and their Applications (ISSPA), Montreal, QC, Canada, 2–5 July 2012; pp. 854–858. [Google Scholar] [CrossRef]
- Ridwan, M.; Lan, M.F.; Fauzi, M.; Weeratunga, K. Development and validation of a force platform to measure ground reaction forces of national athletes. In Proceedings of the 2017 12th IEEE Conference on Industrial Electronics and Applications (ICIEA), Siem Reap, Cambodia, 18–20 June 2017; pp. 95–98. [Google Scholar] [CrossRef]
- Ameen, M.J.; Hassan, A.A.; Al-Salakh, A.M.S.; Saadie, J.H.; Alnajem, A.M. Ring-Shaped Force Platform for Developing Instrumented Throwing and Shifting Forces Due to Rotation Analysis. In Proceedings of the 2020 IEEE International IOT, Electronics and Mechatronics Conference (IEMTRONICS), Vancouver, BC, Canada, 9–12 September 2020; pp. 1–5. [Google Scholar] [CrossRef]
- Wang, H.; Liu, J.; Chen, S. An intelligent 3D force platform for plantar pressure distribution measurement. In Proceedings of the 2009 International Conference on Mechatronics and Automation, Changchun, China, 9–12 August 2009; pp. 4479–4483. [Google Scholar] [CrossRef]
- Jian-Bo, Y.; Jia, R.; Yun-Fang, X. Global calibrating system design of three-dimensional force platform. In Proceedings of the 2017 29th Chinese Control and Decision Conference (CCDC), Chongqing, China, 28–30 May 2017; pp. 6037–6040. [Google Scholar] [CrossRef]
- Hongguang, W.; Mingyang, Z.; Lijin, F.; Bo, Z.; Zhigang, X. Identification of Parameters for a Stewart Platform-based Force/Torque Sensor. In Proceedings of the 2004 IEEE International Conference on Robotics and Biomimetics, Shenyang, China, 22–26 August 2004; pp. 46–50. [Google Scholar] [CrossRef]
- Silva, M.G.; Moreira, P.; Rocha, H.M. Development of a low cost force platform for biomechanical parameters analysis. Res. Biomed. Eng. 2017, 33, 259–268. [Google Scholar] [CrossRef] [Green Version]
- Tamburini, P.; Stagni, R.; Cappello, A. Design of a Modular Small Dimensions Force Platform for Gait Analysis. In 6th European Conference of the International Federation for Medical and Biological Engineering; Lacković, I., Vasic, D., Eds.; Springer: Cham, Switzerland, 2015; Volume 45. [Google Scholar] [CrossRef]
- Rodríguez-Rubio, P.; Bagur-Calafat, C.; López-De-Celis, C.; Bueno-Gracía, E.; Cabanas-Valdés, R.; Herrera-Pedroviejo, E.; Girabent-Farrés, M. Validity and Reliability of the Satel 40 Hz Stabilometric Force Platform for Measuring Quiet Stance and Dynamic Standing Balance in Healthy Subjects. Int. J. Environ. Res. Public Health 2020, 17, 7733. [Google Scholar] [CrossRef] [PubMed]
- Ernandes, R.D.C.; Brech, G.C.; Luna, N.M.S.; Nunes, M.F.; Greve, J.M.D.; Leme, L.E.G.; Alonso, A.C. Relationship of force platform with the clinical balance evaluation systems test in older adults. Acta Ortop. Bras. 2020, 28, 3. [Google Scholar] [CrossRef] [PubMed]
- Neves, J.C.D.J.; Fernandes, K.B.P.; Fujisawa, D.S. What is the number attempts are necessary to evaluate postural control on a force platform in healthy children? J. Phys. Educ. 2019, 30, 1–7. [Google Scholar]
- Madruga-Armada, Ó.; Becerro-De-Bengoa-Vallejo, R.; Losa-Iglesias, M.; Calvo-Lobo, C.; Rodriguez-Sanz, D.; Martínez-Jiménez, E.; Mazoteras-Pardo, V.; San-Antolín, M. Reliability and Repeatability of Pressure Center Analysis with Low-Dye Taping Using Force Platform Podiatry Sensors in Feet with Excessive Pronation. Int. J. Environ. Res. Public Health 2021, 18, 3265. [Google Scholar] [CrossRef]
- Lueken, M.; Mueller, L.; Decker, M.G.; Bollheimer, C.; Leonhardt, S.; Ngo, C. Evaluation and Application of a Customizable Wireless Platform: A Body Sensor Network for Unobtrusive Gait Analysis in Everyday Life. Sensors 2020, 20, 7325. [Google Scholar] [CrossRef] [PubMed]
- Ghirardelli, S.; Asay, J.; Leonardi, E.; Amoroso, T.; Andriacchi, T.; Indelli, P. Kinematic Comparison between Medially Congruent and Posterior-Stabilized Third-Generation TKA Designs. J. Funct. Morphol. Kinesiol. 2021, 6, 27. [Google Scholar] [CrossRef] [PubMed]
- Konrad, A.; Reiner, M.; Bernsteiner, D.; Glashüttner, C.; Thaller, S.; Tilp, M. Joint Flexibility and Isometric Strength Parameters Are Not Relevant Determinants for Countermovement Jump Performance. Int. J. Environ. Res. Public Health 2021, 18, 2510. [Google Scholar] [CrossRef]
- Arachchige, S.K.; Chander, H.; Turner, A.; Knight, A. Impact of Prolonged Exposure to a Slippery Surface on Postural Stability. Int. J. Environ. Res. Public Health 2021, 18, 2214. [Google Scholar] [CrossRef]
- Cappello, A.; Bagalà, F.; Cedraro, A.; Chiari, L. Non-linear re-calibration of force platforms. Gait Posture 2011, 33, 724–726. [Google Scholar] [CrossRef]
- Santos, B.R.; Delisle, A.; Larivière, C.; Plamondon, A.; Imbeau, D. Reliability of center of pressure summary measures of postural steadiness in healthy young adults. Gait Posture 2008, 27, 408–415. [Google Scholar] [CrossRef]
- Russo, L.; D’Eramo, U.; Padulo, J.; Foti, C.; Schiffer, R.; Scoppa, F. Day-time effect on postural stability in young sportsmen. Muscle Ligaments Tendons J. 2015, 5, 38–42. [Google Scholar] [CrossRef]
- Yanyan, Z.; Feng, G. Modal stimulation analysis for acoustic-structure coupling system of the aluminum alloy metro vehicle cavity. In Proceedings of the 2011 International Conference on Electric Information and Control Engineering, Wuhan, China, 15–17 April 2011; pp. 5951–5956. [Google Scholar] [CrossRef]
- Bose, A.K.; Maddipatla, D.; Zhang, X.; Panahi, M.; Masihi, S.; Narakathu, B.B.; Bazuin, B.J.; Atashbar, M.Z. Screen Printed Silver/Carbon Composite Strain Gauge on a TPU Platform for Wearable Applications. In Proceedings of the 2020 IEEE International Conference on Flexible and Printable Sensors and Systems (FLEPS), Manchester, UK, 16–19 August 2020; pp. 1–5. [Google Scholar] [CrossRef]
- Ghallab, Y.; Badawy, W. A new topology for a current-mode wheatstone bridge. IEEE Trans. Circuits Syst. II Express Briefs 2006, 53, 18–22. [Google Scholar] [CrossRef]
- Jiang, H.; Ren, Y.; Zhang, S.; Liu, Z.; Yu, G.; Xiang, J. Damage and perforation resistance behaviors induced by projectile impact load on bonding-patch repaired and scarf-patch repaired composite laminates. Int. J. Damage Mech. 2018, 28, 502–537. [Google Scholar] [CrossRef]
- Xu, Y.-X.; Juang, J.-Y. Measurement of Nonlinear Poisson’s Ratio of Thermoplastic Polyurethanes under Cyclic Softening Using 2D Digital Image Correlation. Polymer 2021, 13, 1498. [Google Scholar] [CrossRef] [PubMed]
- Faries, M.D.; Greenwood, M. Basic training: Stabilizing the confusion. Strength Cond. J. 2007, 29, 10–25. [Google Scholar] [CrossRef]
- Zemková, E. Instability resistance training for health and performance. J. Tradit. Complement. Med. 2017, 7, 245–250. [Google Scholar] [CrossRef] [PubMed] [Green Version]
- Zemková, E.; Hamar, D. Sport-Specific Assessment of the Effectiveness of Neuromuscular Training in Young Athletes. Front. Physiol. 2018, 9, 264. [Google Scholar] [CrossRef] [PubMed] [Green Version]
- Singh, A.; Calixto, G.M.; Felisbino, C.H.D.; Zuffo, M.K.; Garay, J.R.B. EMG instrumentation for educational physiotherapy research. In Proceedings of the 2016 IEEE International Symposium on Consumer Electronics (ISCE), Sao Paulo, Brazil, 28–30 September 2016; pp. 101–102. [Google Scholar] [CrossRef]
- Huamani, R.; Talavera, J.R.; Mendoza, E.A.S.; Davila, N.M.; Supo, E. Implementation of a real-time 60 Hz interference cancellation algorithm for ECG signals based on ARM cortex M4 and ADS1298. In Proceedings of the 2017 IEEE XXIV International Conference on Electronics, Electrical Engineering and Computing (INTERCON), Cusco, Peru, 15–18 August 2017; pp. 1–4. [Google Scholar] [CrossRef]


| No. | Plataform Type | Technologies | Application | Reference |
|---|---|---|---|---|
| 01 | force plates FP4060-07 (square) | strain gauge technology/load transducers. | vertical GRF | [5] |
| 02 | force platform developed at BioLab in Roma Tre University (square) | electro-mechanic actuator. | clinical applications | [6] |
| 03 | standard force platform (square) | strain gauges in each wheatstone bridge of each composite sensor. | postural balance analysis | [9] |
| 04 | standard force platform (square) | load cells (beam type), an amplifier, data acquisition device. | GRF | [10] |
| 05 | standard force platform (square) | load cells (beam type) | throwing and shifting forces due to rotation analysis | [11] |
| 06 | 3D platform system | Structure of the flexible sensor array | plantar pressure distribution measurement | [12] |
| 07 | standard force platform (square) | load cell (beam type) and wheatstone bridge. | ground reaction force (GRF) and displacement of the center of pressure (COP) | [15] |
| 08 | modular force platform | gait analysis of children and neurologic patients | [16] | |
| 09 | stabilometric force platform (model PF2002; SATEL SARL, 6 rue du limousin—31700 blagnac; france) | load cell (SP4 mark HBM) | measuring quiet stance and dynamic standing balance in healthy subjects | [17] |
| Properties | Value | Units |
|---|---|---|
| Elastic module | 1.9 × 10+11 | N/m2 |
| Poisson’s ratio | 0.29 | N/A |
| Shear Module | 7.5 × 10+10 | N/m2 |
| Density | 8000 | Kg/m3 |
| Tensile strength | 517,017,000 | N/m2 |
| Flow limit | 206,807,000 | N/m2 |
| Coefficient of thermal expansion | 1.8 × 10⁻⁵ | 1/K |
| Thermal Conductivity | 16 | W/(m.k) |
| Specific Heat | 500 | J/(kg.k) |
Publisher’s Note: MDPI stays neutral with regard to jurisdictional claims in published maps and institutional affiliations. |
© 2021 by the authors. Licensee MDPI, Basel, Switzerland. This article is an open access article distributed under the terms and conditions of the Creative Commons Attribution (CC BY) license (https://creativecommons.org/licenses/by/4.0/).
Share and Cite
Beingolea, J.R.; Rodrigues, H.A.; Zegarra, M.; Sulla-Espinoza, E.; Torres-Silva, R.; Rendulich, J. Designing a Multiaxial Extensometric Force Platform: A Manufacturing Experience. Electronics 2021, 10, 1907. https://doi.org/10.3390/electronics10161907
Beingolea JR, Rodrigues HA, Zegarra M, Sulla-Espinoza E, Torres-Silva R, Rendulich J. Designing a Multiaxial Extensometric Force Platform: A Manufacturing Experience. Electronics. 2021; 10(16):1907. https://doi.org/10.3390/electronics10161907
Chicago/Turabian StyleBeingolea, Jorge Rodolfo, Helder Andrade Rodrigues, Milagros Zegarra, Erasmo Sulla-Espinoza, Romildo Torres-Silva, and Jorge Rendulich. 2021. "Designing a Multiaxial Extensometric Force Platform: A Manufacturing Experience" Electronics 10, no. 16: 1907. https://doi.org/10.3390/electronics10161907