1. Introduction
The technological progress of optoelectronics, especially over the last two decades, allowed for a significant development of optical fiber sensors. Those become more reliable, precise, and offer a number of advantages over other existing technologies, which is especially important for sensors that are susceptible to moisture, corrosion, and high magnetic fields. The increased demand for monitoring of industrial structures and installations operating in hazard conditions has resulted in increased interest in optical fiber sensors. Such devices measure strain, temperature, acceleration, pressure, displacement, and many other physical parameters.
The continuous development of fiber optic techniques enabled the creation of sensors such as: Bragg gratings, Fabry–Perot (F–P) sensors [
1] and based on Brillouin or Raman scattering effects [
2]. Those have a broad range of applications: Engineering [
3], aviation industry [
4], science, and healthcare [
5]. The theoretical background of distributed fiber optics sensors (DFOS) for civil engineering, together with an extended review of measurement methods, has been presented by Barrias et al. [
6]. The thousands of sensing points that the DFOS provides enable mapping of strain and temperature distributions in two or three dimensions. One of the most common engineering structures are sheet piles. Such constructions are commonly used for retaining walls, land reclamation, underground structures, or flood prevention [
7,
8]. Real-time sheet piles monitoring is essential to prevent catastrophic failures like landslides, debris flows, flooding, etc. [
9]. Kechavarzi et al. [
10] presented the development of a strain DFOS with high spatial resolution and accuracy used for reinforced concrete piles. Kania et al. [
11] showed Rayleigh-based DFOS systems deployed in concrete piles by attaching 250 µm fiber directly into steel bars. Guo et al. presented BOTDR (Brillouin Optical Time Domain Reflectometer) method for monitoring the deformation of the bored cast-in-place pile [
12] and bored pile during concrete curing [
13]. In this case, a reinforced 5 mm optical fiber cable fixed along steel bars was used. Moffat et al. [
14] showed a comparison between BOTDR, strain gauges, inclinometers, and topographic survey methods to monitor a multiple-anchor pile wall in 28.5 m deep excavation.
Nowadays, steel-based sheet piles are very often replaced by hybrid composite materials like a polyvinyl chloride matrix locally reinforced with glass fibers [
15]. Such materials are characterized by extremely high resistance to scratches or cracks, high tightness, and lack of corrosion. PVC (polyvinyl chloride) based sheet piles are typically manufactured in the production facility using the co-extrusion process. The most commonly used methods of PVC sheet piles installation are: Mechanical pushing them into the soil, or additionally the use of vibratory hammers along the preinstalled templates [
16,
17]. To fully protect the piling against damage, light equipment with small impact energy or guide bars called mandrels are used. Therefore, the sensor design and its integration into PVC are significant. There are several requirements for sensor construction: Minimalistic dimensions, strong adhesion to PVC surface, and operation under high deformation (low bending radius).
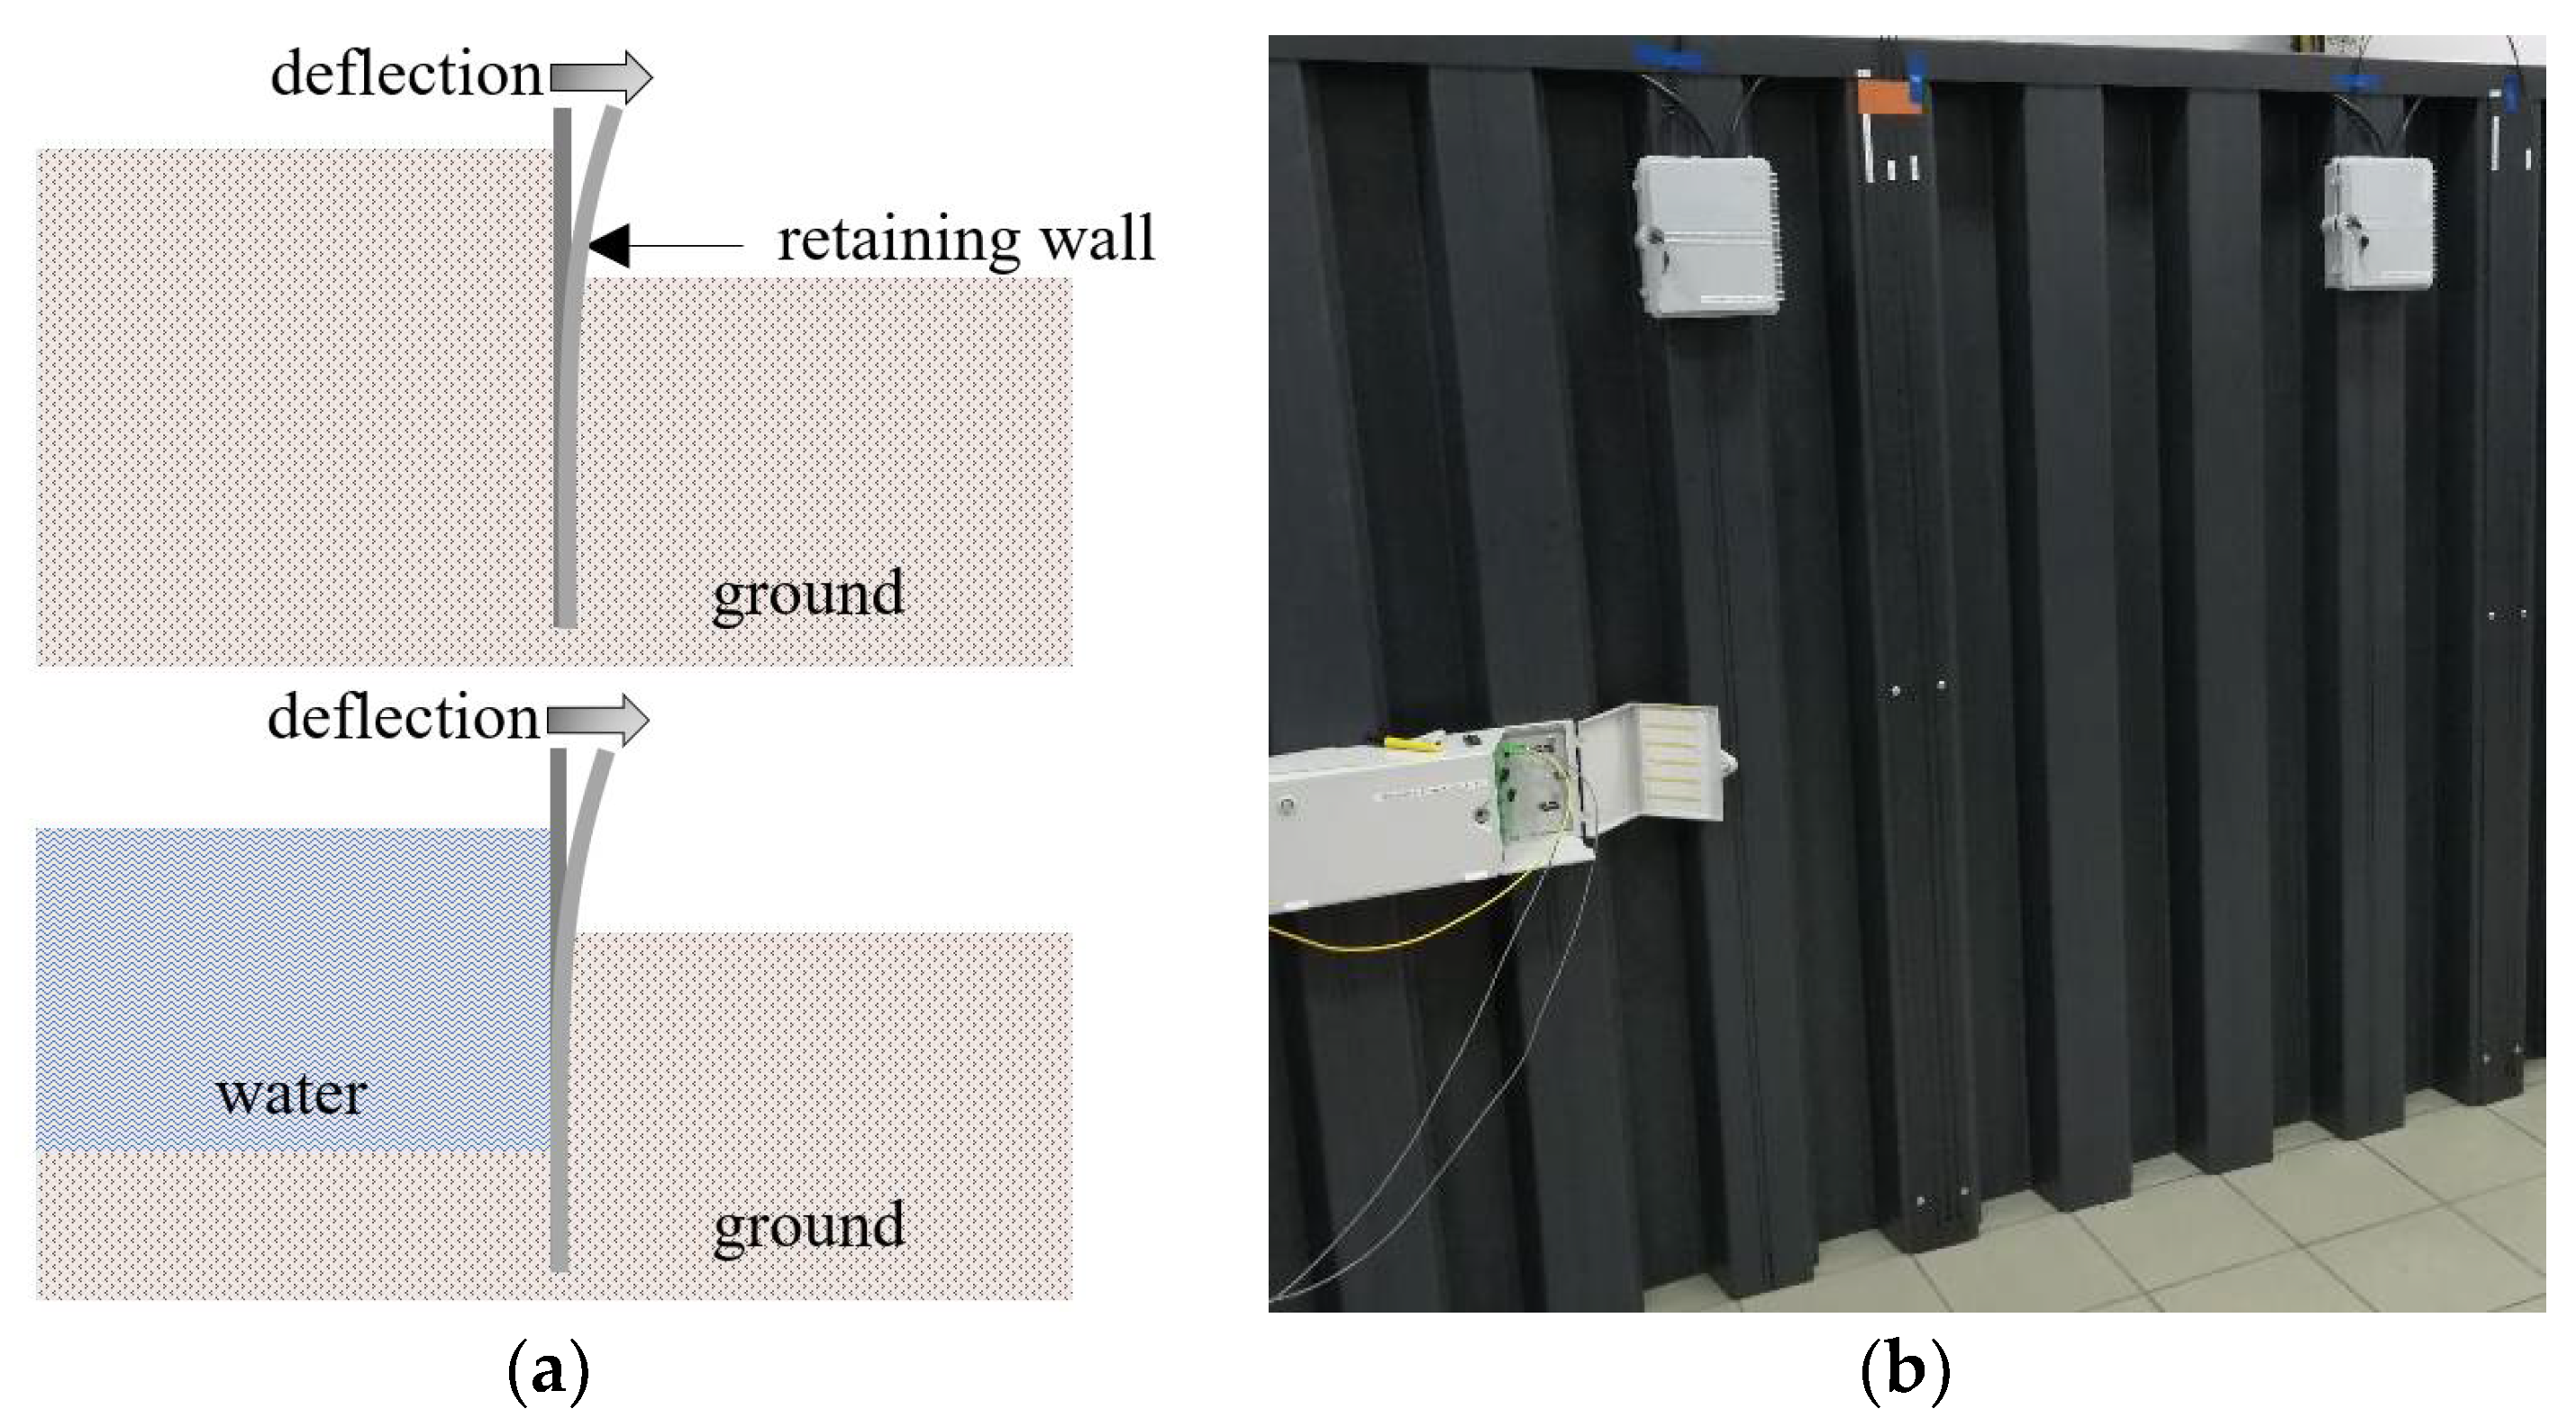
Figure 1 shows the PVC geotechnical profiles for applications in the area of civil engineering as retaining walls. Those types of beams are exposed to significant ground pressure and are designed to withstand heavy loads [
15].
This paper focuses on direct integration of optical fiber sensor to PVC profile using standard communication cable coatings (250 µm, 900 µm, and 3 mm). Since accessing the sensing fiber embedded into PVC profile during the co-extrusion process is very challenging, sensors have been integrated on PVC surface with adhesive bonding. Three types of adhesives (epoxy resin, ethyl acetate, and cyanoacrylate) have been evaluated. BOTDR testing, in terms of the compressive and tensile strain of the optical fiber sensors, has been performed for deflection distance ranging from 0–24 cm. A correction coefficient has been provided to estimate the strain on the PVC surface. Direct integration of optical fiber sensor to PVC is a new approach that has several advantages. The proposed design does not affect the structure of the PVC material and does not require reinforced sensing cables. Therefore, PVC sheet piles strength and stiffness remain unchanged. As the sensing capability is added to PVC profiles during manufacturing process, the sheet piles installation time is not increasing.
2. Materials and Methods
Brillouin light backscattering is a nonlinear process that can occur in optical fibers at large power intensity. Optical power launched into the fiber generates spontaneous propagation of backward Stokes wave. The backscattered Stokes wave interferes with the input optical wave and generates an acoustic wave as a result of the effect of electrostriction. The forward-moving acoustic wave periodically varies the refractive index
neff along the fiber, which scatters even more light in the backward direction. Effectively, the input wave creates a moving refractive index grating from which it scatters. The Brillouin frequency
νB0 depends on the acoustic velocity, refractive index
neff of the fiber, and input wavelength [
18]:
where
neff—effective refractive index of the fiber,
VA—speed of the acoustic wave in the fiber,
λL—wavelength.
Physical quantities, such as temperature or strain, have an influence on the refractive index
neff. Thus, the shift of Brillouin frequency
νSBS can be used for the detection of these quantities, which is described by the relationship [
19]:
where
νB0—initial Brillouin frequency,
CT,
Cε—temperature and strain coefficient of the fiber,
T,
ε—measured temperature and strain value,
T0,
ε0—reference temperature and strain value.
Based on the initial Brillouin spectrum analysis, the ITU-T G.657 compliant fiber has been chosen for sensor design [
20].
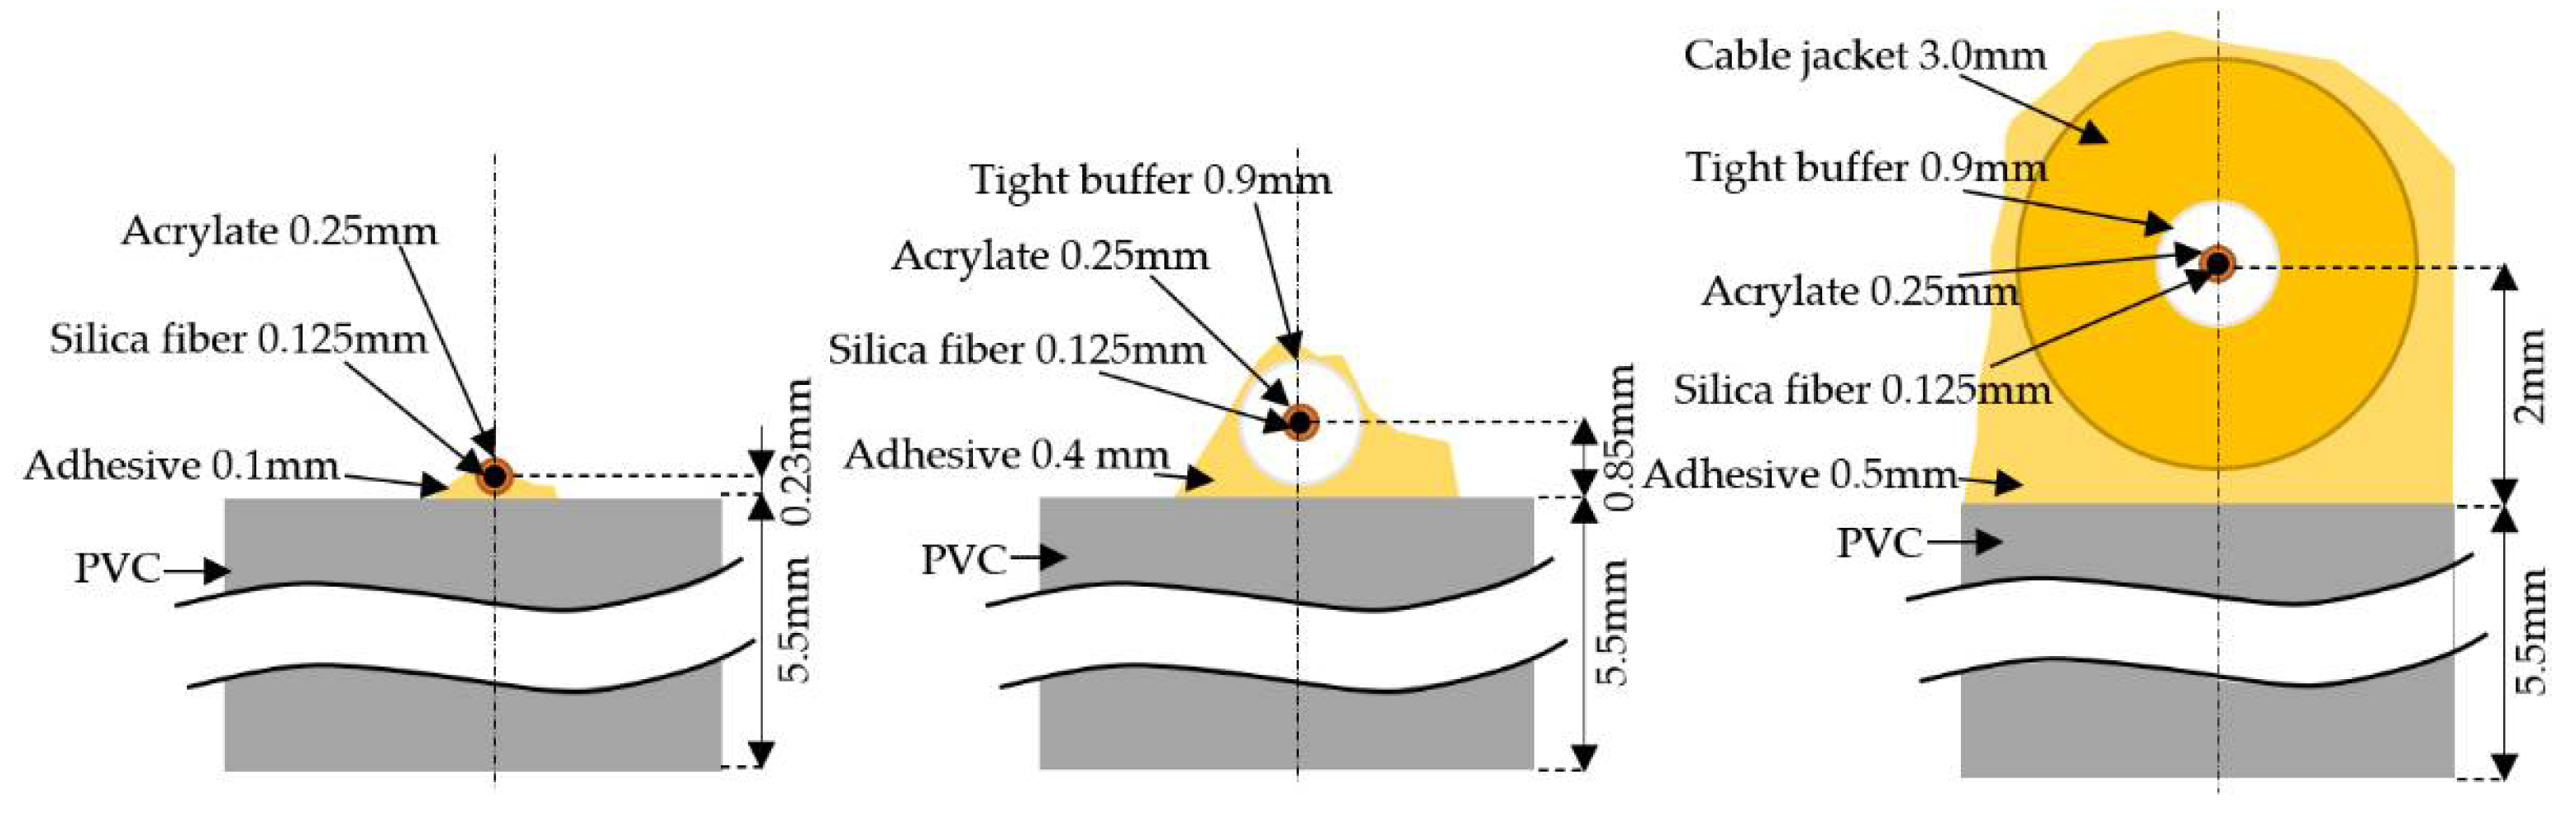
Figure 2 presents cross-sections of three types of optical fiber cable integrated into PVC. The first one is a bare fiber with a typical acrylate coating with an outside diameter equal to about 250 µm. The second has a construction of tight buffer with 900 µm outside diameter. The last one is a typical drop cable for external application with 3.0 mm diameter. All three coating types have been integrated into PVC surface with adhesive.
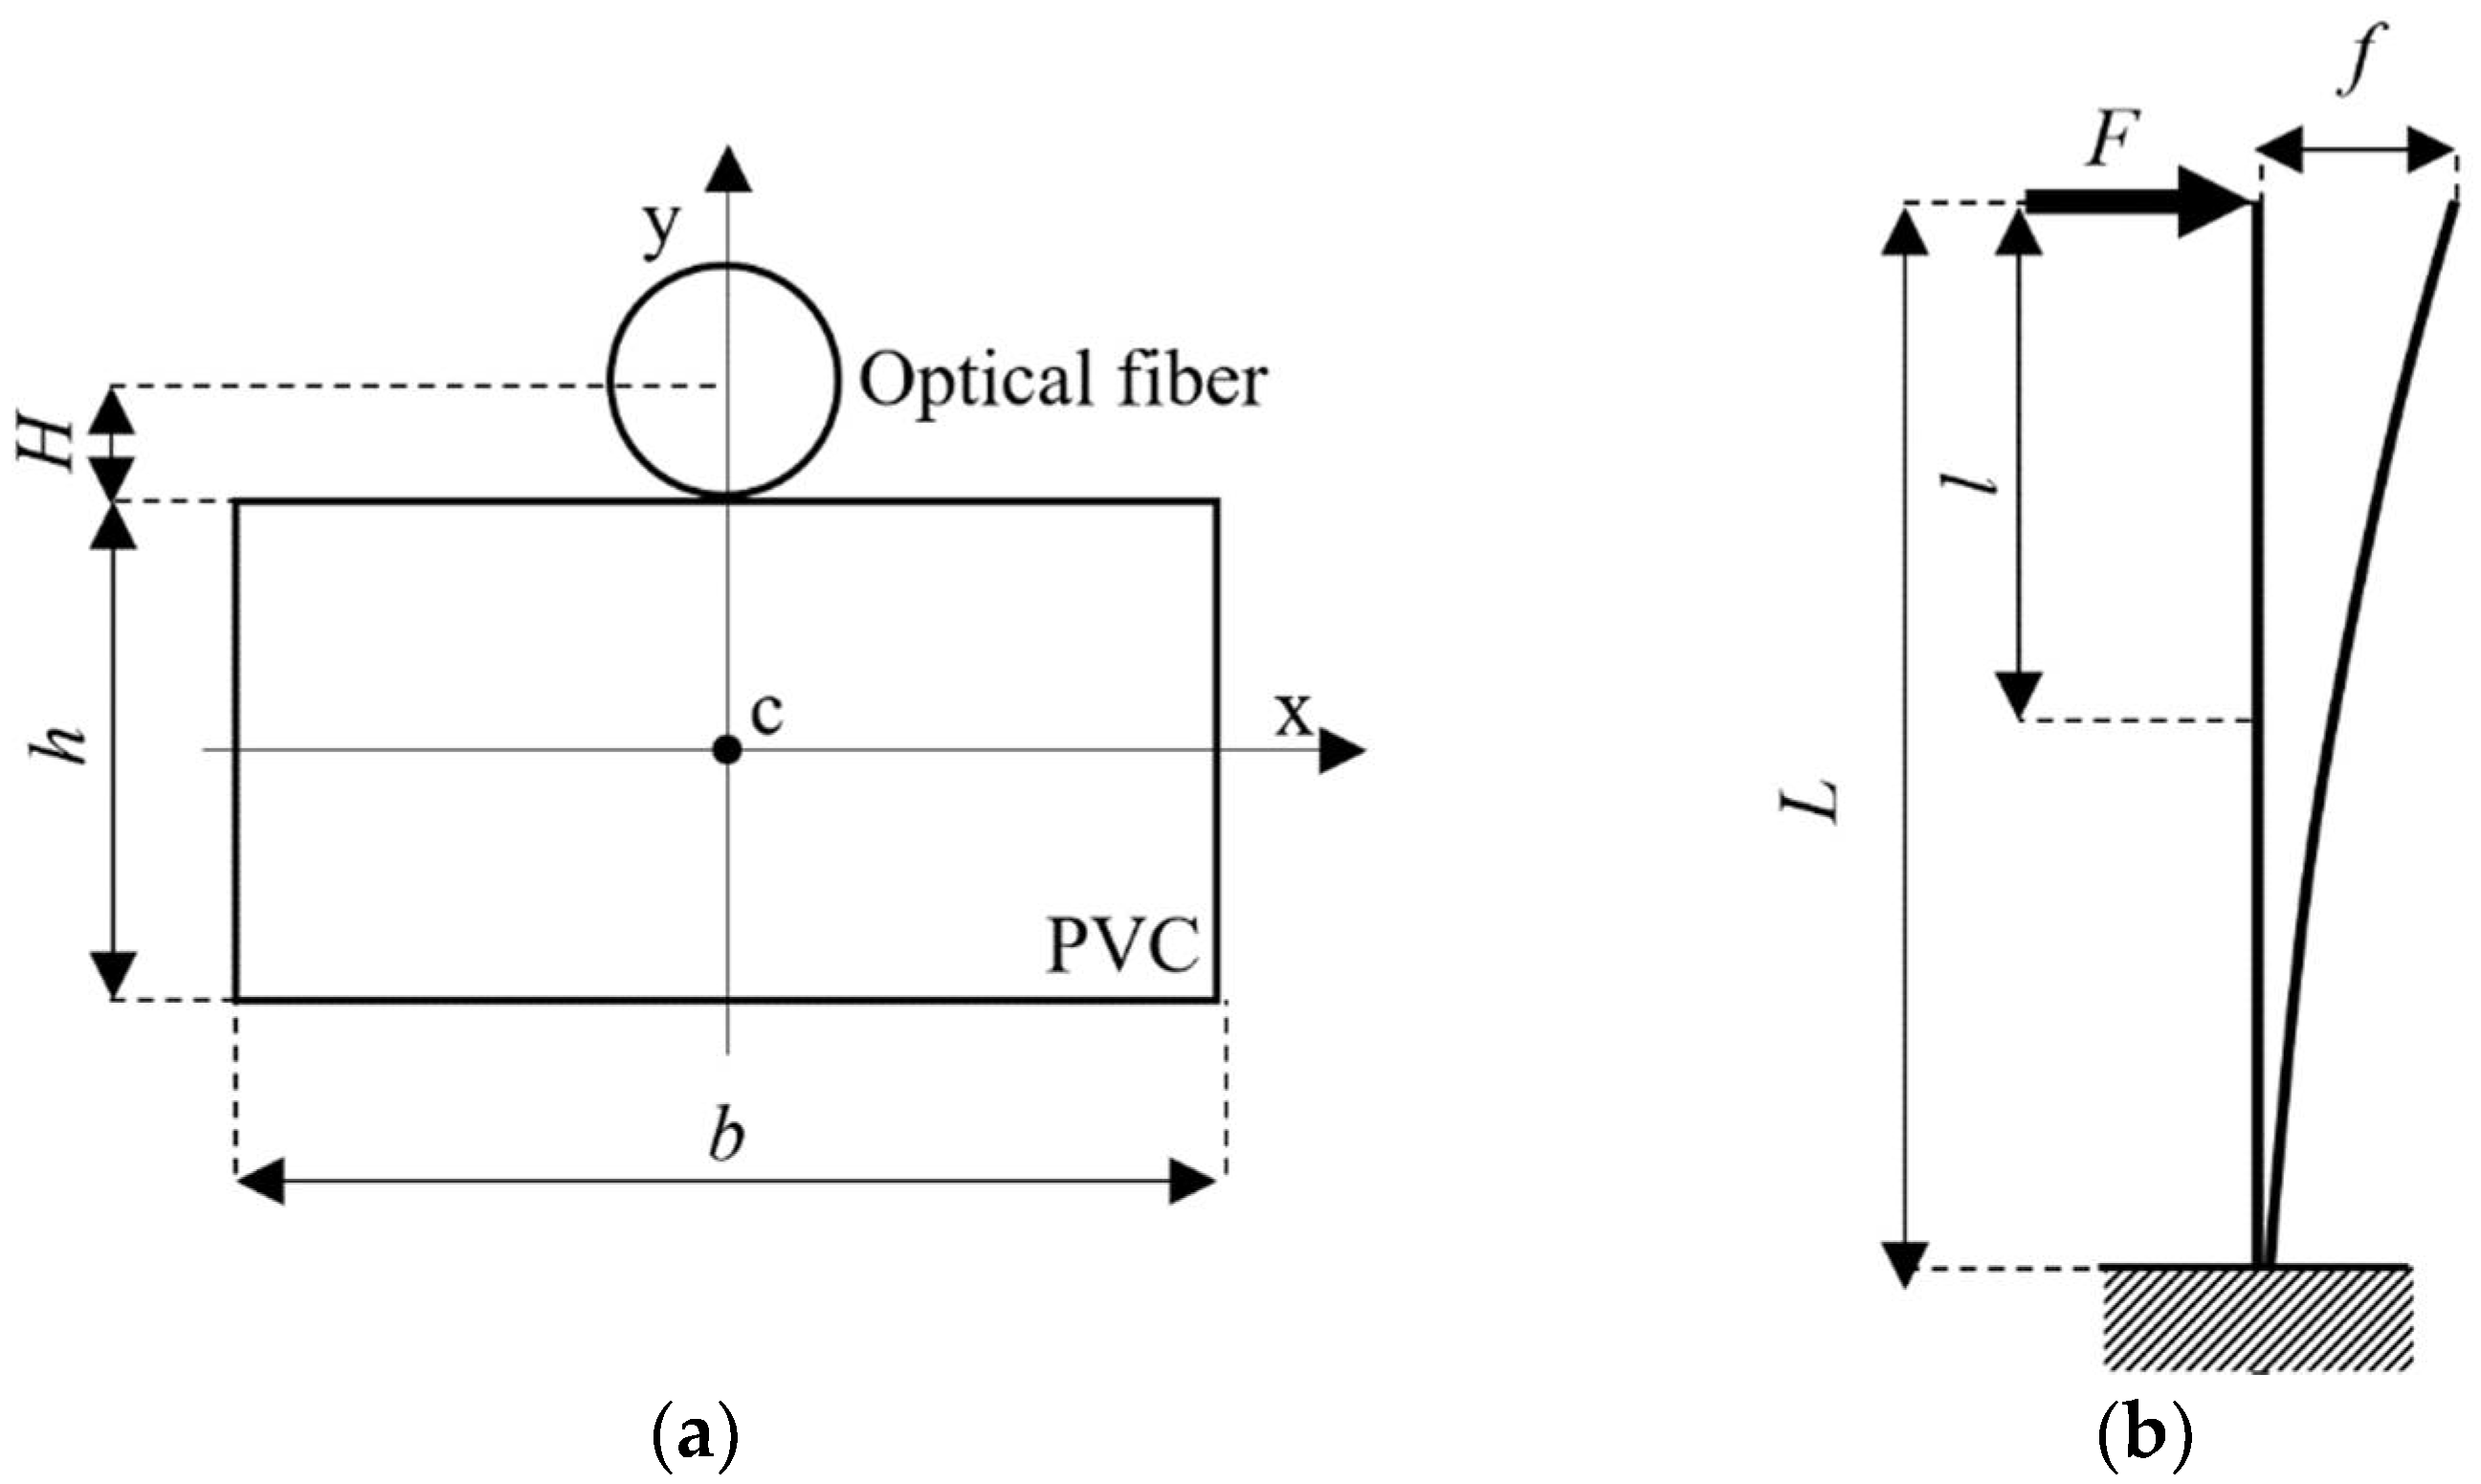
In order to examine the relationship between the method of integrating of optical fiber with PVC surface and measured strain, a piece of the PVC structural element of retaining walls was used. The rectangle cross-section of the PVC sample is presented in
Figure 3a, where
h (5.5 mm) and
b (50 mm) are the height and width of the beam, respectively. Fiber core to surface distance
H depends on used optical fiber coating. PVC sample moment of inertia
I and shear strength
W are equal:
Figure 3b shows a schematic of a cantilever beam deflection. The force
F is applied at the highest point of the PVC beam sample. For that case, the deflection distance
f and bending moment
M are equal [
21]:
where
E—Young’s modulus,
L—length of beam, and
l—distance from applied force point.
Based on Hook’s law, the strain on the surface of the cantilever beam is as follows:
Then, to make the strain ε dependent on the deflection distance
f, Equation (5) should be transformed into the form:
Substituting the expression for force
F into Equation (7), the theoretical strain value is equal:
To calculate theoretical strain value on integrated optical fiber
εf, the fiber core to surface distance
H must be included:
In our research, the strain on optical fiber
εf_meas was measured using BOTDR. Based on this measurement, the strain value of PCV profile can be determined using the correction coefficient
C. Measured strain has to be decreased due to the difference resulting from fiber core to surface distance
H:
To measure strain on optical fiber, the BOTDR system and the frame for PVC profile deformation were used. The BOTDR device is designed to work with single-mode optical fibers (SMF). For optical fiber sensor applications, it is necessary to select the appropriate type of this fiber. In our research, the single-mode optical fiber compliant with ITU-T G.657.A2 standard was used.
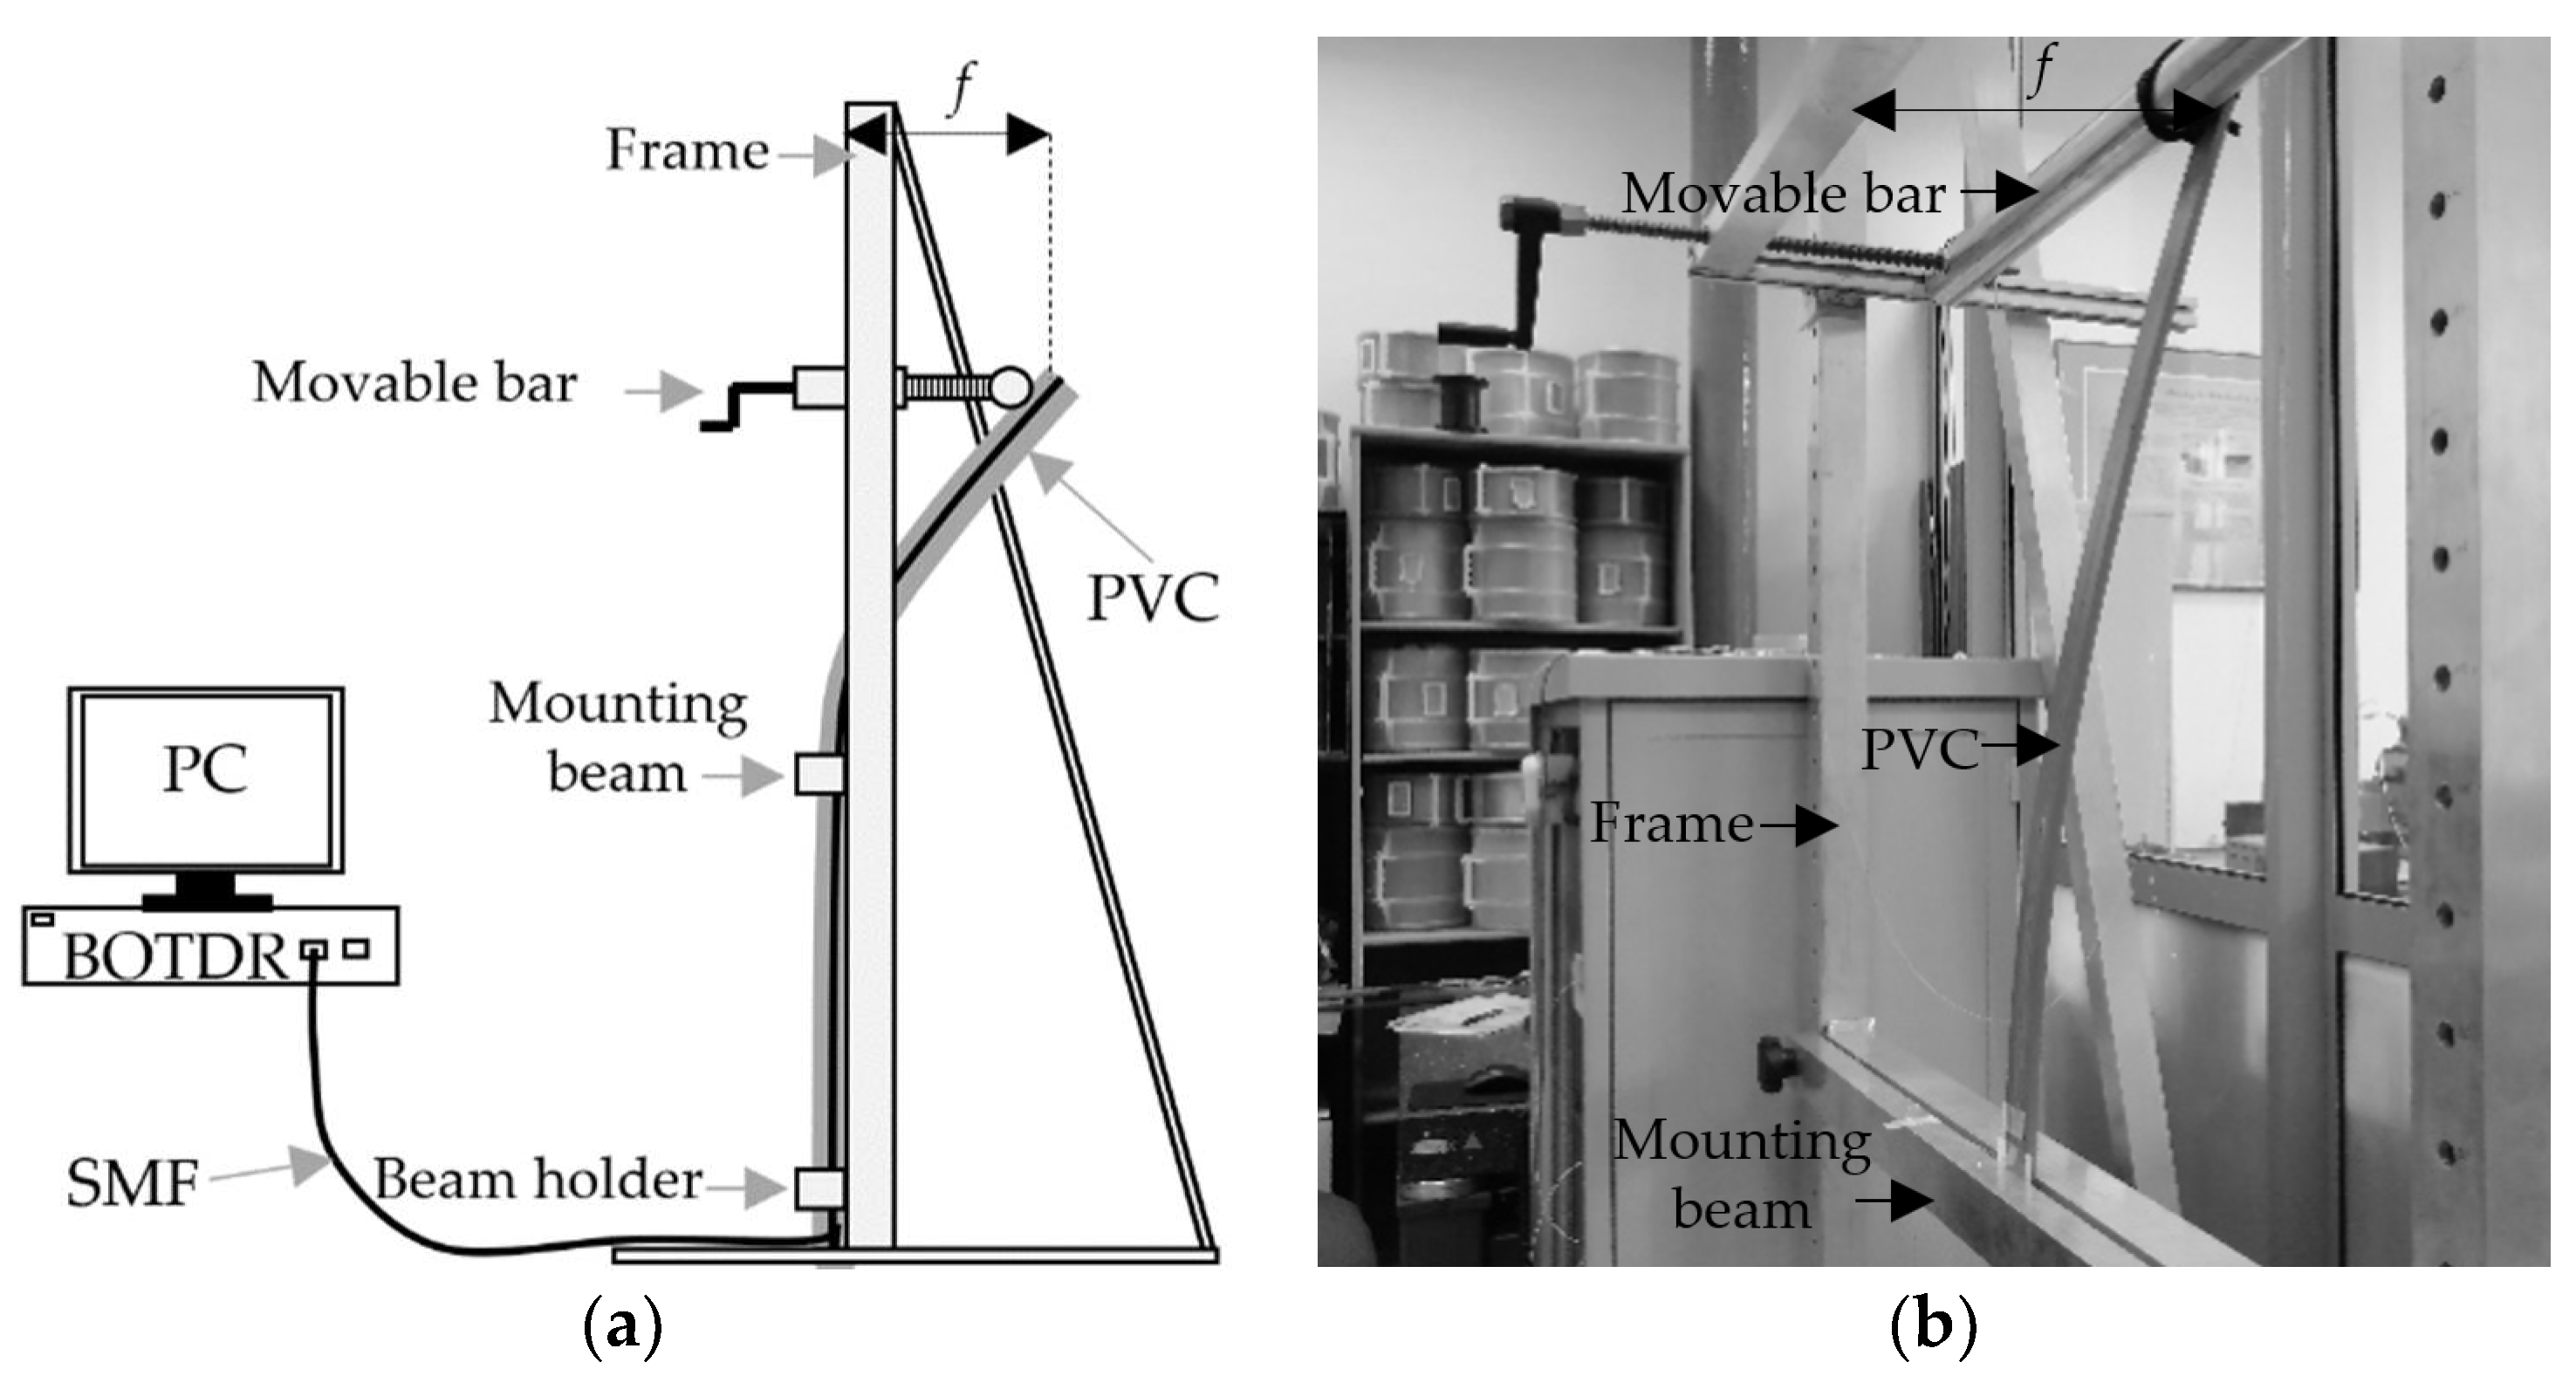
Figure 4 shows a scheme of the measurement setup.
Measurement system contains BOTDR DSTS (Distrusted Strain and Temperature Sensor) unit from OZOptics connected to PC for data acquisition and analysis. BOTDR is based on λL = 1550 nm laser source, whereas the accuracy of measured strain and temperature are equal to ±16 µε and ±0.8 ºC, respectively. The spatial step of the device is equal to 5 cm, whereas the spatial resolution equals 1 m. Optical fiber integrated with PVC profile was connected to BOTDR unit through the thermally spliced optical fiber pigtail. All measurements were conducted at a room temperature equal to 21 ± 0.5 ºC. Deflection distance f of the tested PVC profile with an integrated optical fiber was in the range of 0–24 cm. The height of the movable bar and higher mounting beam is adjustable in the range of 5–300 cm. On the other hand, PVC profile with a length of up to 300 cm can be mounted in one or two points by mounting beams. In our research, the PVC profile lengths are defined as the distance between the mounting beam and movable bar. Due to the increase of the deflection distance of PVC profile, its bending radius decreases, which can affect optical fiber macrobending loss. During our experiment, the radius was not lower than 30 cm and had no influence on optical signal loss in optical fiber.
3. Results and discussion
First of all, based on the dimensions presented in
Figure 2, the theoretical characteristics of strain on a deflected beam were calculated using Equation (9). Then experimental measurements were conducted.
Figure 5a shows the theoretical dependence of used optical fiber cable types on their strain value. Three constructions were analyzed: Acrylate coating, tight buffer, and cable jacket. Outside diameters were equal to 250 µm, 900 µm, and 3.0 mm, respectively. PVC profile length
L used in calculation equals 1.8 m. As can be noticed, with the increase of fiber outside diameter, the strain value of fiber also increases. Due to the fact that silica fiber has additional coating, it is further away from the neutral axis of the PVC sample. In the second characteristic presented in
Figure 5b, the influence of cantilever beam length
L on strain value on PVC surface was shown. In that case, the strain value increases for the shorter length of PVC due to higher deformation and bending moment
M.
Figure 6,
Figure 7 and
Figure 8 present the influence of optical fiber cable type on measured strain values for different lengths of PVC sample equal to: 1.8 m, 1.2 m, and 0.6 m. For each case, tensile (positive slope) and compressive (negative slope) stresses were measured. As presented in
Figure 6a, for the longest beam length, a linear response to deflection up to 24 cm can be observed for all three types of fiber coating. An increase of strain with an increase of cable diameter can be noticed, which is in line with conducted theoretical analysis. To determine strain on PVC surface, it is necessary to apply correction coefficient
C, described in Equation (11).
Figure 6b shows the measured beam strain with the proposed correction coefficient. In this case, surface strains determined by all three cable types are comparable and in line with theory.
Table 1 presents the statistic parameters of PCV strain characteristics. Correlations
a were specified between estimated (theoretical) and measured values of strain using the least-squares method. The value equal to 1 of parameter
a indicates perfect correlation. On the other hand, the linearity of experimental strain to deflection distance dependence was also determined. For the data presented in
Figure 6b, the high linear fitting (
R2 > 0.99) and the high correlation to theory (
a > 0.94) are observed. The only exception is an acrylate fiber used for compressive measurements (
a = 0.87).
As it is shown in
Figure 7b, for a shorter beam length (1.2 m), only 250 µm coating provides PVC surface strain values close to theory. In this case, the highest correlation
a of about 0.79, was achieved. Even though 900 µm and 3 mm coatings exhibit a linear response, as shown in
Figure 7a, the determined strain
εPCV has a poor correlation to theory (
a < 0.59). It is worth to mention that, in this case, theoretical strain value is two times higher than for 1.8 m beam length. Such high deformations are very challenging for fiber integration to PVC surface. Surface strain for 900 µm and 3 mm coatings is not fully transferred into the fiber due to soft cable construction. However, the dependence of deflection distance
f on measured strain for all three optical fibers is still on a high level of linearity equal
R2 > 0.99.
For the highest deformation case, beam length of 0.6 m and deflection
f up to 24 cm, neither fiber coating provides proper strain reading. As presented in
Figure 8b, strain readings with correction coefficient are not in line with theory (
a equals about 0). Starting from 10 cm deflection distances are decreasing, which indicates too high strain for sensor design. However, as shown in
Figure 8a, 3 mm fiber coating based sensor is still producing a linear response for tensile strain (
R2 > 0.99). Therefore, it can be used to estimate the deflection after sensor calibration.
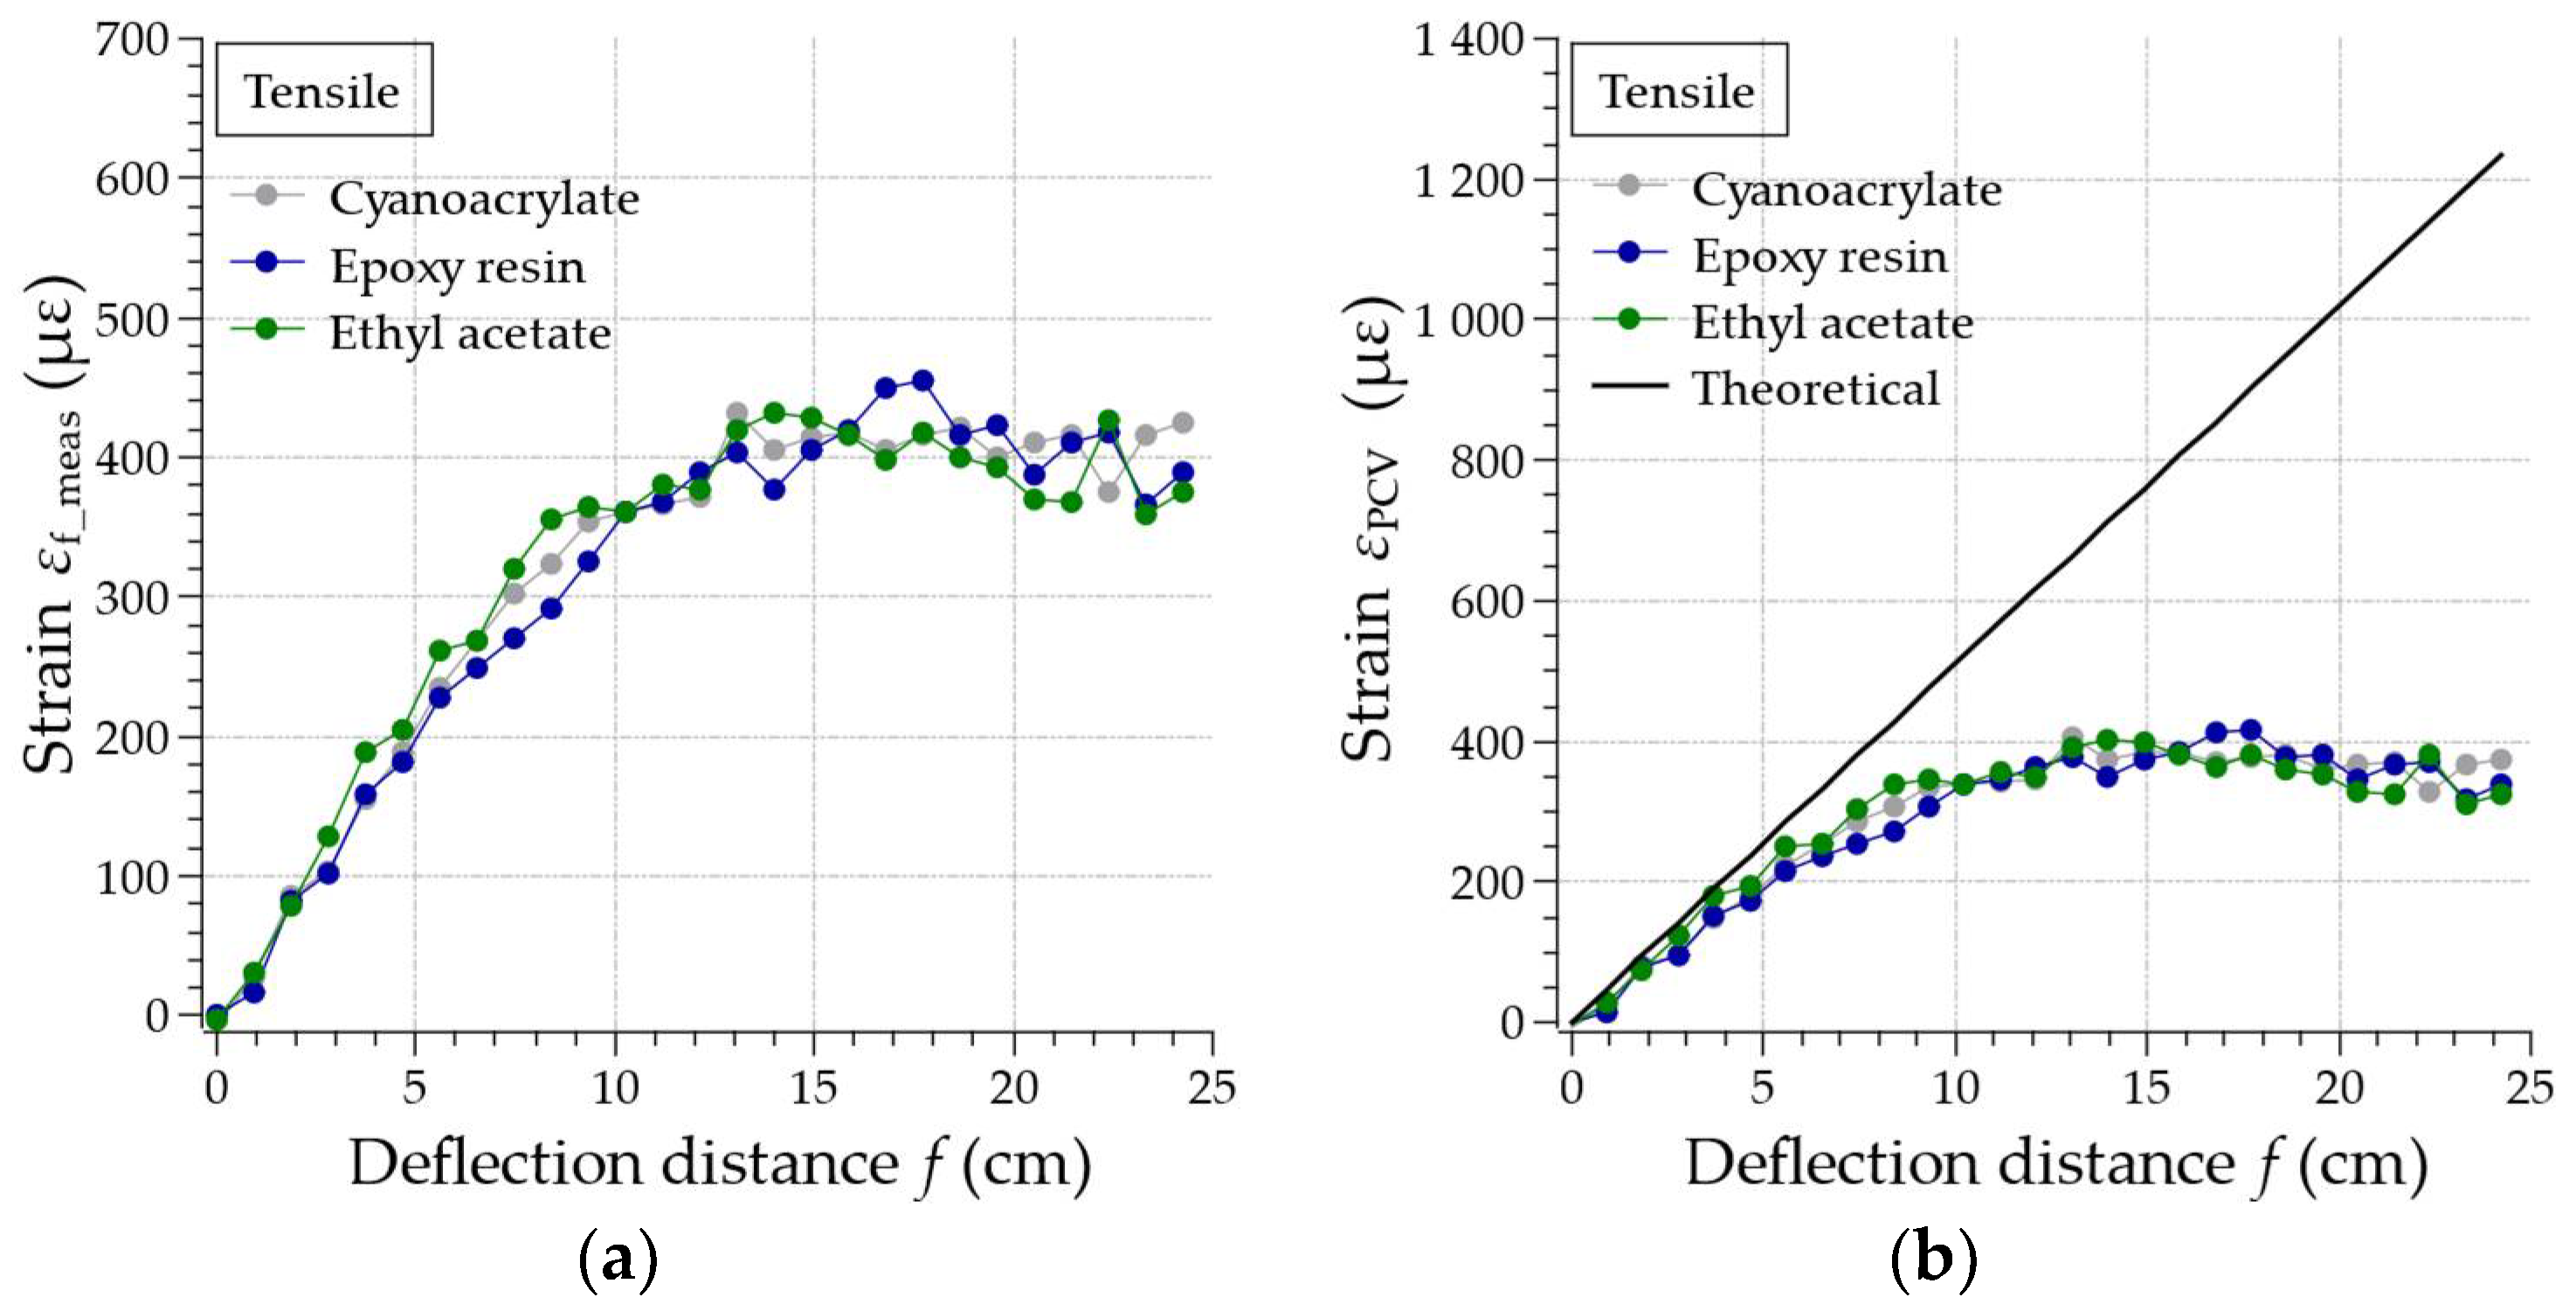
Improper strain readings at high deformation (0.6 m beam length) indicate an issue with fiber integration on PVC surface, fiber separates from the surface. To overcome this problem, two other types of epoxy have been tested (ethyl acetate and cyanoacrylate) with 250 µm coating fiber.
Figure 9 presents the influence of three different types of adhesives for optical fiber integration on the measured strain. The length
L of PVC sample was chosen to be 1 m as a midpoint between linear and nonlinear responses presented previously. Despite the use of different adhesives, the linearity of the characteristic is still observed only in the limited range of deflection distance, up to 10 cm. Deviations of the presented values are related to the accuracy of the measuring equipment rather than used adhesives.
4. Conclusions
This paper focuses on the impact of optical fiber sensor design and its integration to PVC sheet piles on the deformation and strain monitoring. Proper sensor design is significant, as PVC sheet piles are co-extruded in the production facility and then mechanically pressed into the soil by vibratory hammers. Such sensors need to be well integrated with PVC to sustain piles transportation and installation process. Furthermore, these sensors need to measure strain correctly, even under high deformation. Three types of optical fiber coating and their integration with PVC have been tested. It was shown that all three options are able to integrate into PVC surface and measure the strain value. Obtained results are in line with theory for high deflection of the PVC profile (up to 25 cm) and typical 1.8 m of beam length. Correction coefficients necessary for 900 µm and 3 mm coating options have been proposed and used to ensure proper strain measurement. It has been proved that for the shorter beam length (1.2 m), only 250 µm coating provides PVC surface strain readings close to the theory. Even though 900 µm and 3 mm coatings are showing a linear response, the determined strain has a poor correlation to theory. Due to the soft cable construction in these cases, strain is not fully transferred into the fiber. At very high deformation (beam length equals 0.6 m for the same deflection distance range), the strain value measurement is distorted, even for 250 µm fiber coating. However, 3 mm cable jacket still exhibits linear response and can be used to estimate deflection distance, after sensor calibration.
It has been experimentally proven that BOTDR based PVC sheet piles monitoring can be realized with 250 µm, 900 µm, and 3 mm fiber coatings. Achieved results are in line with theory. As PVC sheet piles are very challenging to sensor design, it is recommended to use 250 µm coating fiber based sensors for strain measurement under low deflection (>1.2 m beam length). On the other hand, 3 mm coating fiber-based sensors, with proper calibration, can be applied for deflection distance measurement under high deformation (>0.6 m beam length).


