1. Introduction
With the advancement of semiconductor technology, digital systems have become an inseparable part of our daily lives, such as smartphones, tablet computers, smart home appliances, and even a car is a carrier of hundreds of microcontrollers. For students majoring in Electrical and Electronics (EE), they are exposed to these microcontrollers, sensors, servo motors and other digital system components in their professional courses. Therefore, Digital Logic (DL) course is arguably the first fundamental subject for EE-majoring students to learn digital systems. The unavailability of this course to these students means the closing of the gateway to the digital world. Given its importance, this course is made compulsory by quite a few universities and colleges. That is to say, students who are absent from this course are not allowed to graduate and unable to take the subsequent courses such as Digital System Design, Sensor Application, FPGA Application, Microcontroller Principle and Application, etc., which materially and adversely impacts their career plan for the future.
The traditional course usually comprises students’ pre-class preparation, teachers’ class instructions, and students’ completion of homework after class [
1]. This is a teacher-centered instruction that induces less motivation for students to learn, and the direct result is that a few students preview before class and many students copy homework after class. Such a traditional course also has the following defects: knowledge absorbed by students varies due to their varied abilities in responding to teachers’ lecturing without distinction. Additionally, it is hard for teachers to know problems of a particular student and offer targeted guidance since the Taiwan students are usually too shy to raise a question. It is difficult to evaluate the homework of students since it is either unsubmitted or copied. Bloom [
2] divided the teaching goals in cognitive domains into six levels: memorization, understanding, application, analysis, evaluation and creation. There is a big problem with traditional course instruction—teachers stereotypically impart knowledge and keep telling students the answers, and students are expected to memorize the answers and show that they have done so by passing the exams. Students in this process only focus on the two levels at the bottom—memorization and understanding—without any improvement in high-level thinking such as application, analysis and evaluation. As a result, college students seldom read until the approaching of exams in school and nearly stop reading for the rest of their lives after graduation [
3].
Lehmann [
4] argued that people are internally driven to accomplish something well. The orientation of internal motivation is not always unchanged; instead, it changes with the situation, atmosphere and theme. This study applied the flipped classroom model in the instruction design of the DL course where students occupy the central position and build recognition over DL by deeper participation in class activities so as to improve the learning performance on this subject.
The remainder of this paper is organized as follows:
Section 2 introduces the theoretical background regarding this study;
Section 3 details the study methods and experimental design, including purposes of this study, experimental design, subject of this study and course design;
Section 4 presents the experimental results;
Section 5 and
Section 6 are the discussion and summary.
2. Literature Review
Under the Flipped Course (FC) model which reforms the Traditional Course (TC) one, students learn independently before class, ask questions and answer in a collaborative way, as well as generate ideas and discuss with others during the class. The concept of FC has long been applied in the teaching of humanities and social sciences—teachers often ask students to read the course content ahead of time and ask questions and discuss during class, which is precisely the flipped classroom model [
5]. In terms of the form of technology application, as early as 1977, scholars have proposed the use of electronic equipment to record lecture videos for studies on student learning [
6]. As Internet devices have found their way into our daily lives, the bandwidth of the Internet connection becomes ever larger, bringing about richer online audio–video resources. In 2006, teaching videos of Khan Academy came into vogue, allowing students from different continents to watch and learn anytime and anywhere [
7]. In 2007, two high school chemistry teachers posted videos recording their class lecturing on the Internet for students who were absent from class to watch and for students who attended the class to review. With the surprisingly good responses, the two teachers released videos before class, allowing students to practice and have a deep discussion in class, and finally achieving the purpose of better learning performance [
8]. That is the beginning of the FC wave. From then on, more and more flipped classrooms were employed in the design of mathematics and science teaching in primary and secondary schools. The general FC model is to explain to students what a flipped classroom will change. Teachers make or find relevant and suitable lecture videos and materials and release them on the websites in advance. On this basis, students study independently and record their problems in learning before class. Teachers then respond to the students’ problems raised during self-study and design learning activities for students to thoroughly understand and further apply what they learn, of which such activities are implemented during class [
9,
10].
The FC emphasizes the use of digital technology to flip the learning role of students, encouraging students to read the learning content through teaching videos before class, and then discuss the topics during class to complete the learning. Because of this student-centric learning, the method is generally affirmed, and the learning effect of students is quite significant. Therefore, the FC has become a learning model that has attracted much attention in the education field.
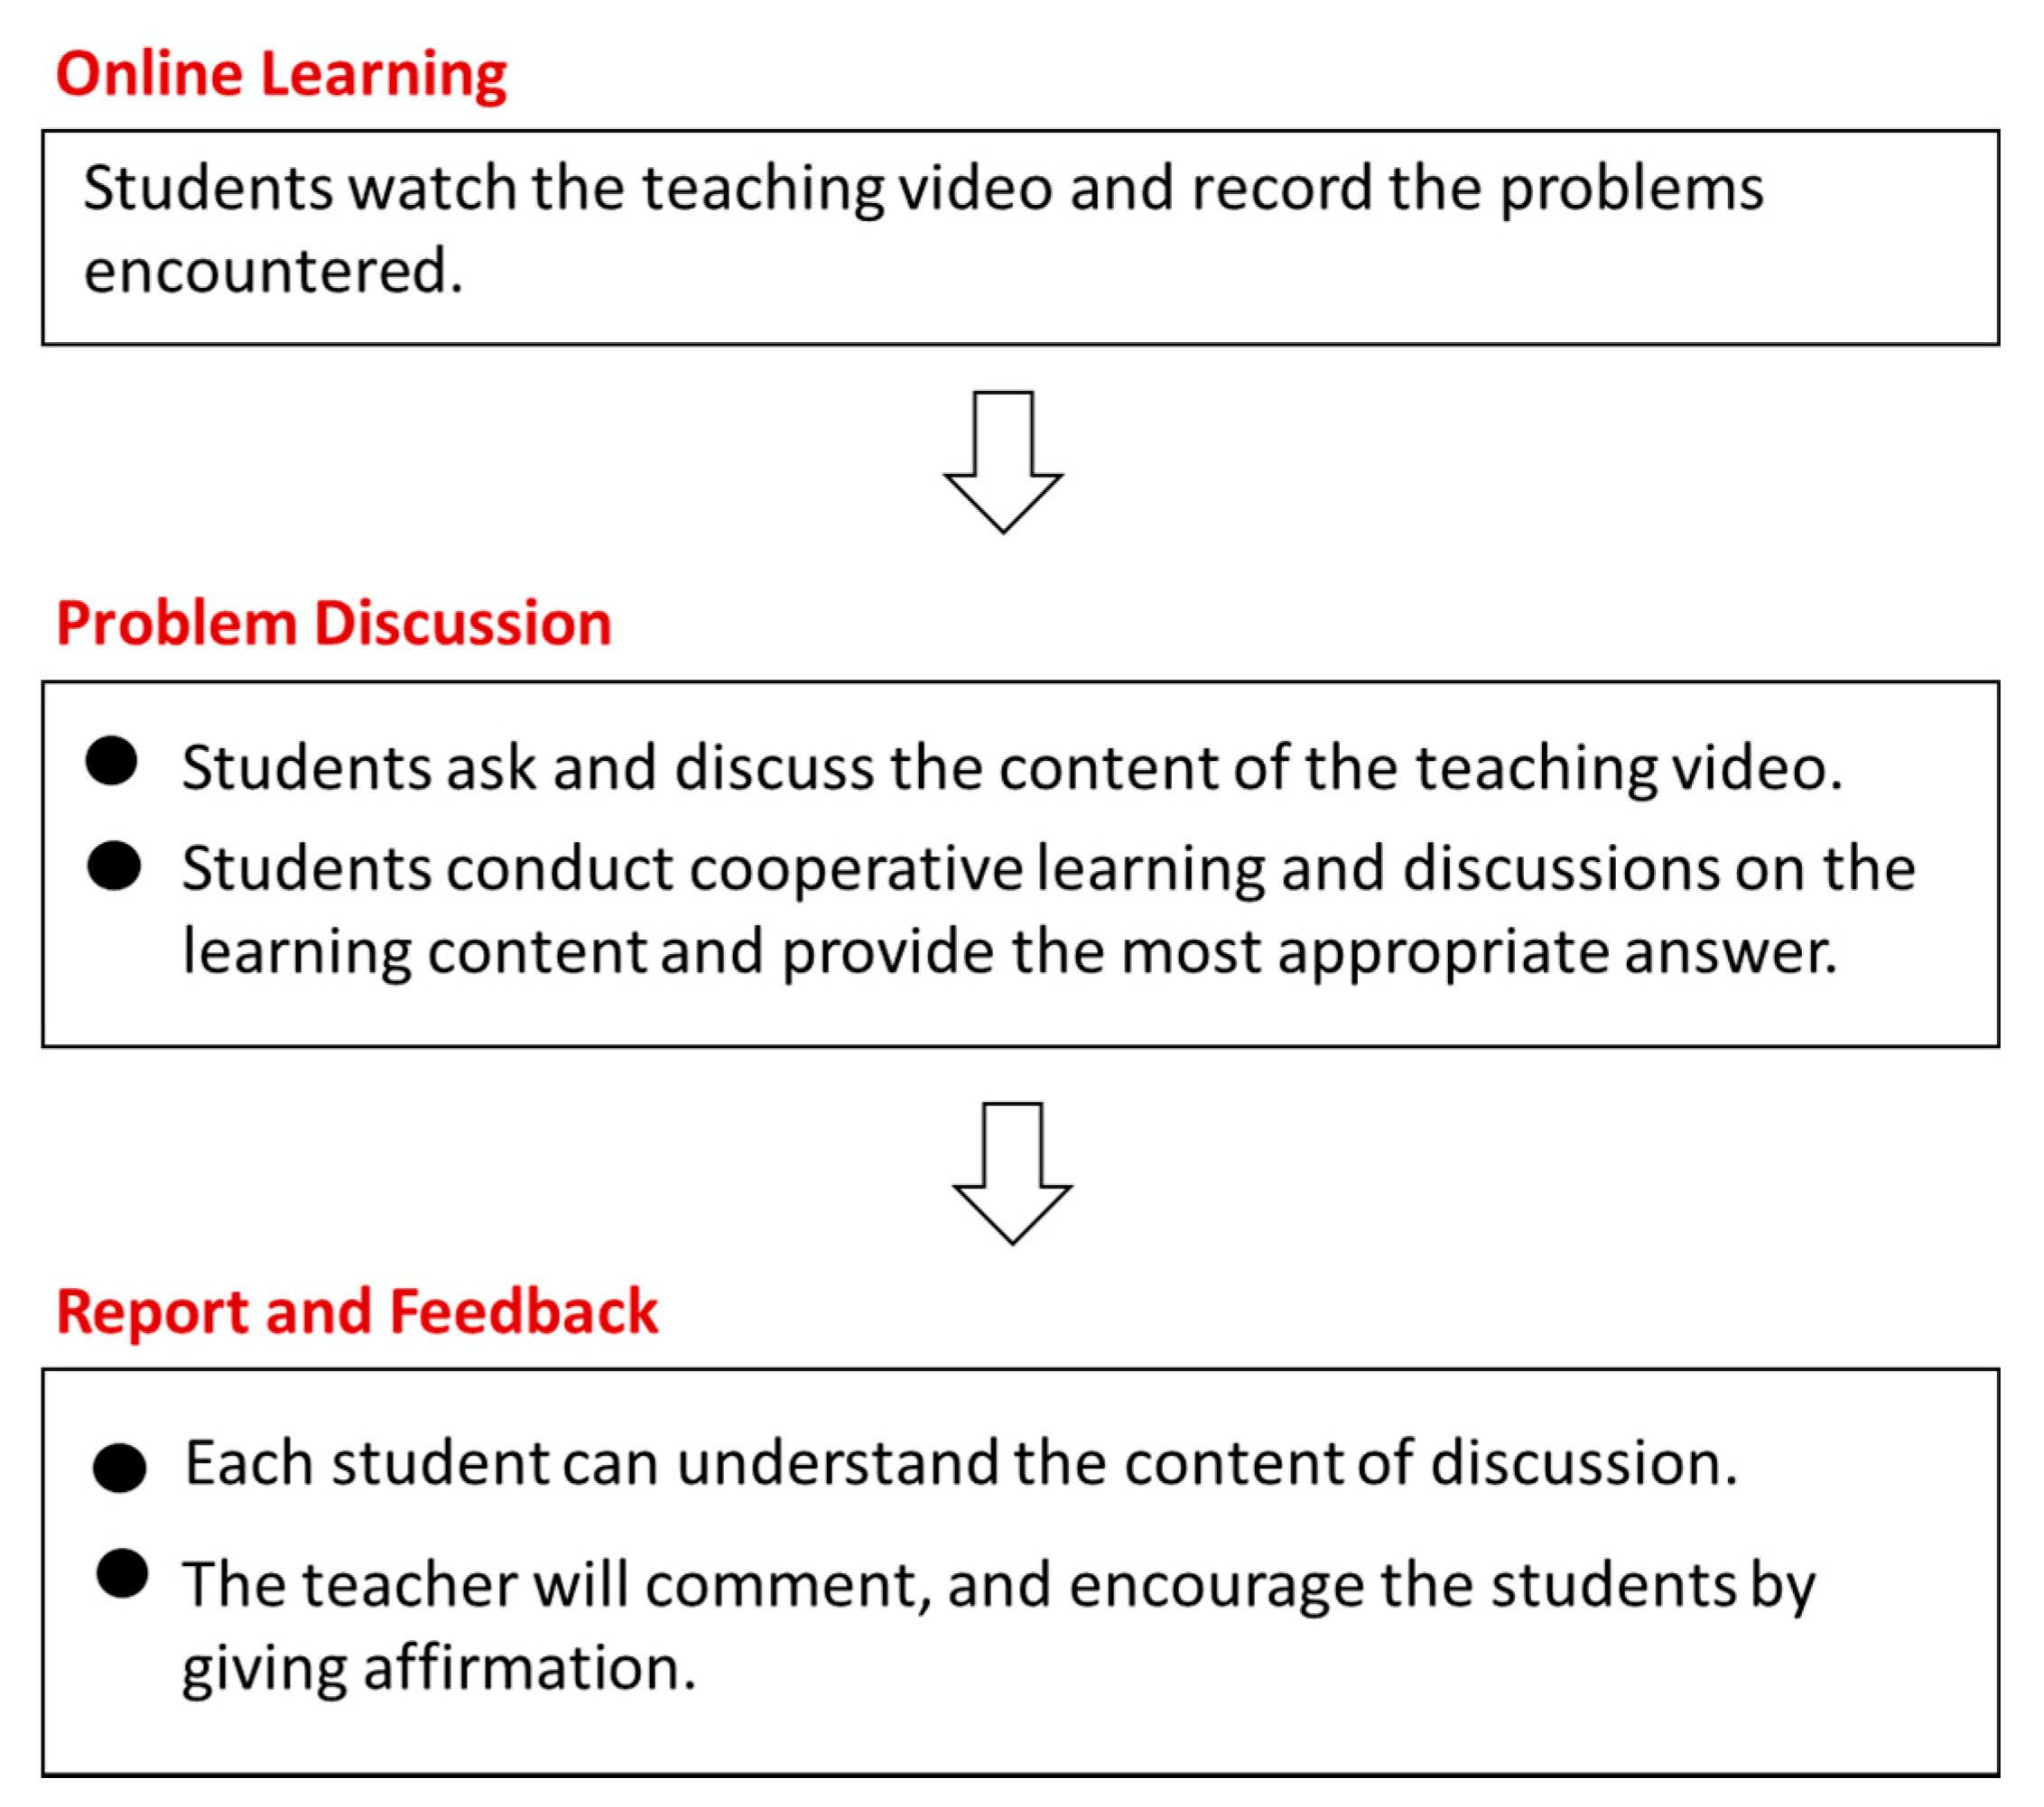
Figure 1 shows the implementation process and steps of the flipped course. The first stage is online learning, and students watch the teaching video, record the problems encountered. In the second stage, they ask and discuss the content of the teaching video. Then, students’ questions are collected and answered. Students conduct cooperative learning and discussions on the learning content and provide the most appropriate answer. The third stage is to report and give feedback. The group members guide each other to ensure that each student can understand the content of the discussion. Following the student report, each team will feed back, then the teacher will comment, and encourage the students by giving affirmation to the students [
5].
It is known that bystanders in an activity usually do not necessarily find the activity interesting, and only the participants who are involved do so, which coincides with the learning model of the flipped classroom popular in recent years. Under the FC model, students are required to watch the teaching videos designated by teachers before class, and focus on accomplishing tasks, projects or discussions collaboratively during class. The adaptation of this model comes with the hope that students, being in the center of teaching activities, will have the initiative and bear the responsibility of learning. Meanwhile, teachers can interact with their students more effectively in class [
5]. This idea seems very good for EE engineering students because many previous studies have given quite positive conclusions. For example, after the application of the flipped classroom in high school mathematics and English courses, Strayer [
11] found that the failure rate of the English class dropped from 19% to 13%, and that of mathematics dropped from 50% to 44%. In the engineering department, students who studied Computer Programming under the FC model obtained a higher GPA than those who studied under the TC model [
12]; in upper-division engineering courses, students who studied with the FC model also performed better and learned more in tests and examinations than those who studied under the TC model [
13]. In the Circuits I course, when compared with those who studied under the TC model in the previous year, the proportion of students who obtained a C-level (inclusive) test score increased from 56% to 83% after applying the FC model [
14].
Through the active learning strategy of the FC model in the digital circuit course of the freshmen year, college students improved their learning performance, course interest and participation [
10]. The application of the flipped classroom and inquiry learning in the System Modeling and Control course is conducive for students to broaden achievements, effectively prolong learning time and acquire more knowledge, and for groups to be motivated to take responsibility in learning [
15]. In a four-year study on software engineering topics, the application of the FC model improved students’ test scores [
16]. Some past studies, however, had also observed that the FC model had no effect on learning [
17,
18,
19]. This might be attributable to the differences caused by the different implementation methods of FC, which might be obstructed by factors such as poor quality of teaching materials used in class, technical issues and inability to control the teaching process. Therefore, Sezer [
20] suggested that successful course design and teaching materials for FC needed good planning and design.
Higher education institutions in Taiwan include two-year junior colleges, two-year technological colleges, four-year technological colleges, four-year universities, technological universities and graduate schools. All undergraduate courses require at least four years to acquire all credits required for graduation. For example, after graduating from a two-year junior college (equivalent to freshman and sophomore), students obtain an associate degree and are required to take a two-year technological college (equivalent to junior and senior) courses in order to obtain a bachelor’s degree. After graduating from a technical high school, most students will take the Technological and Vocational Education Joint University Entrance Examination (TVEJUEE) for four-year technological colleges (universities) and a two-year junior college, which is an important basis for admission. The entrance channels are generally divided into four categories: admission by selection, joint registration and distribution, separate admission and skill-based screening. Nowadays, the TC model remains the major teaching method of formal courses in junior colleges. Comparing the students in four-year technological colleges (technological universities), students in junior colleges usually have weaker basic abilities in mathematics and science. The FC model was rarely applied to junior college students in the past. Therefore, this study focused on whether it was possible to improve the learning performance of junior college students by application of the FC model and proper teaching design planning.
3. Methods
This study compared and evaluated students’ learning performance in DL courses in several autumn semesters: the TC model was applied to three classes in autumn semesters from 2016 to 2018, and the FC model was applied to the classes in the autumn semester in 2019. All participants consisting of grade I (freshman level) students of the EE Department in a junior college in eastern Taiwan were admitted through the open admission channels without application of any specific admission strategy in any semester.
For EE students, the DL course is a two-credit compulsory course with 18 weeks of class per semester and 100 min per week. To evaluate the results, the same teachers, the same textbooks, syllabus and similar homework and exams were employed, and midterm and final exams were held respectively in the ninth and 18th weeks of a semester.
3.1. Traditional Course
From 2016 to 2018, DL courses were conducted in a TC model and the number of students belonging to the control group was 33, 31 and 39 for the respective years. In each 100-min class, teachers explained concepts and examples with PowerPoint slides. Course teaching slides were uploaded to the school’s E-learning platform so that students who took this course could log in to watch and download. Occasionally, students were also asked to solve problems in their notes to deepen their impressions. After finishing each chapter, the teacher selected the exercises in the textbook as homework for students to do after class, and the students were required to hand in such homework before the next class.
3.2. Flipped Course
The FC model implementation procedure referred to the study of Yelamarthi and Drake [
10] and was specifically modified for this study to suit different educational situations. Past studies have indicated that learning by teamwork had been an effective learning method [
21,
22,
23]. Similarly, a game-based class also exerted positive impacts on learning performance and motivation [
24,
25,
26,
27]. Sailer and Homner [
26] pointed out in a meta-analysis that the combination of cooperation and competition might serve as an effective gamification strategy. Therefore, in order to facilitate student learning, this study divided the participants into eight groups. Before class, members of the same group watched videos together and discussed with each other; during class, members of the same group discussed with each other and collaborated to complete the teacher’s requirements for a group-based result.
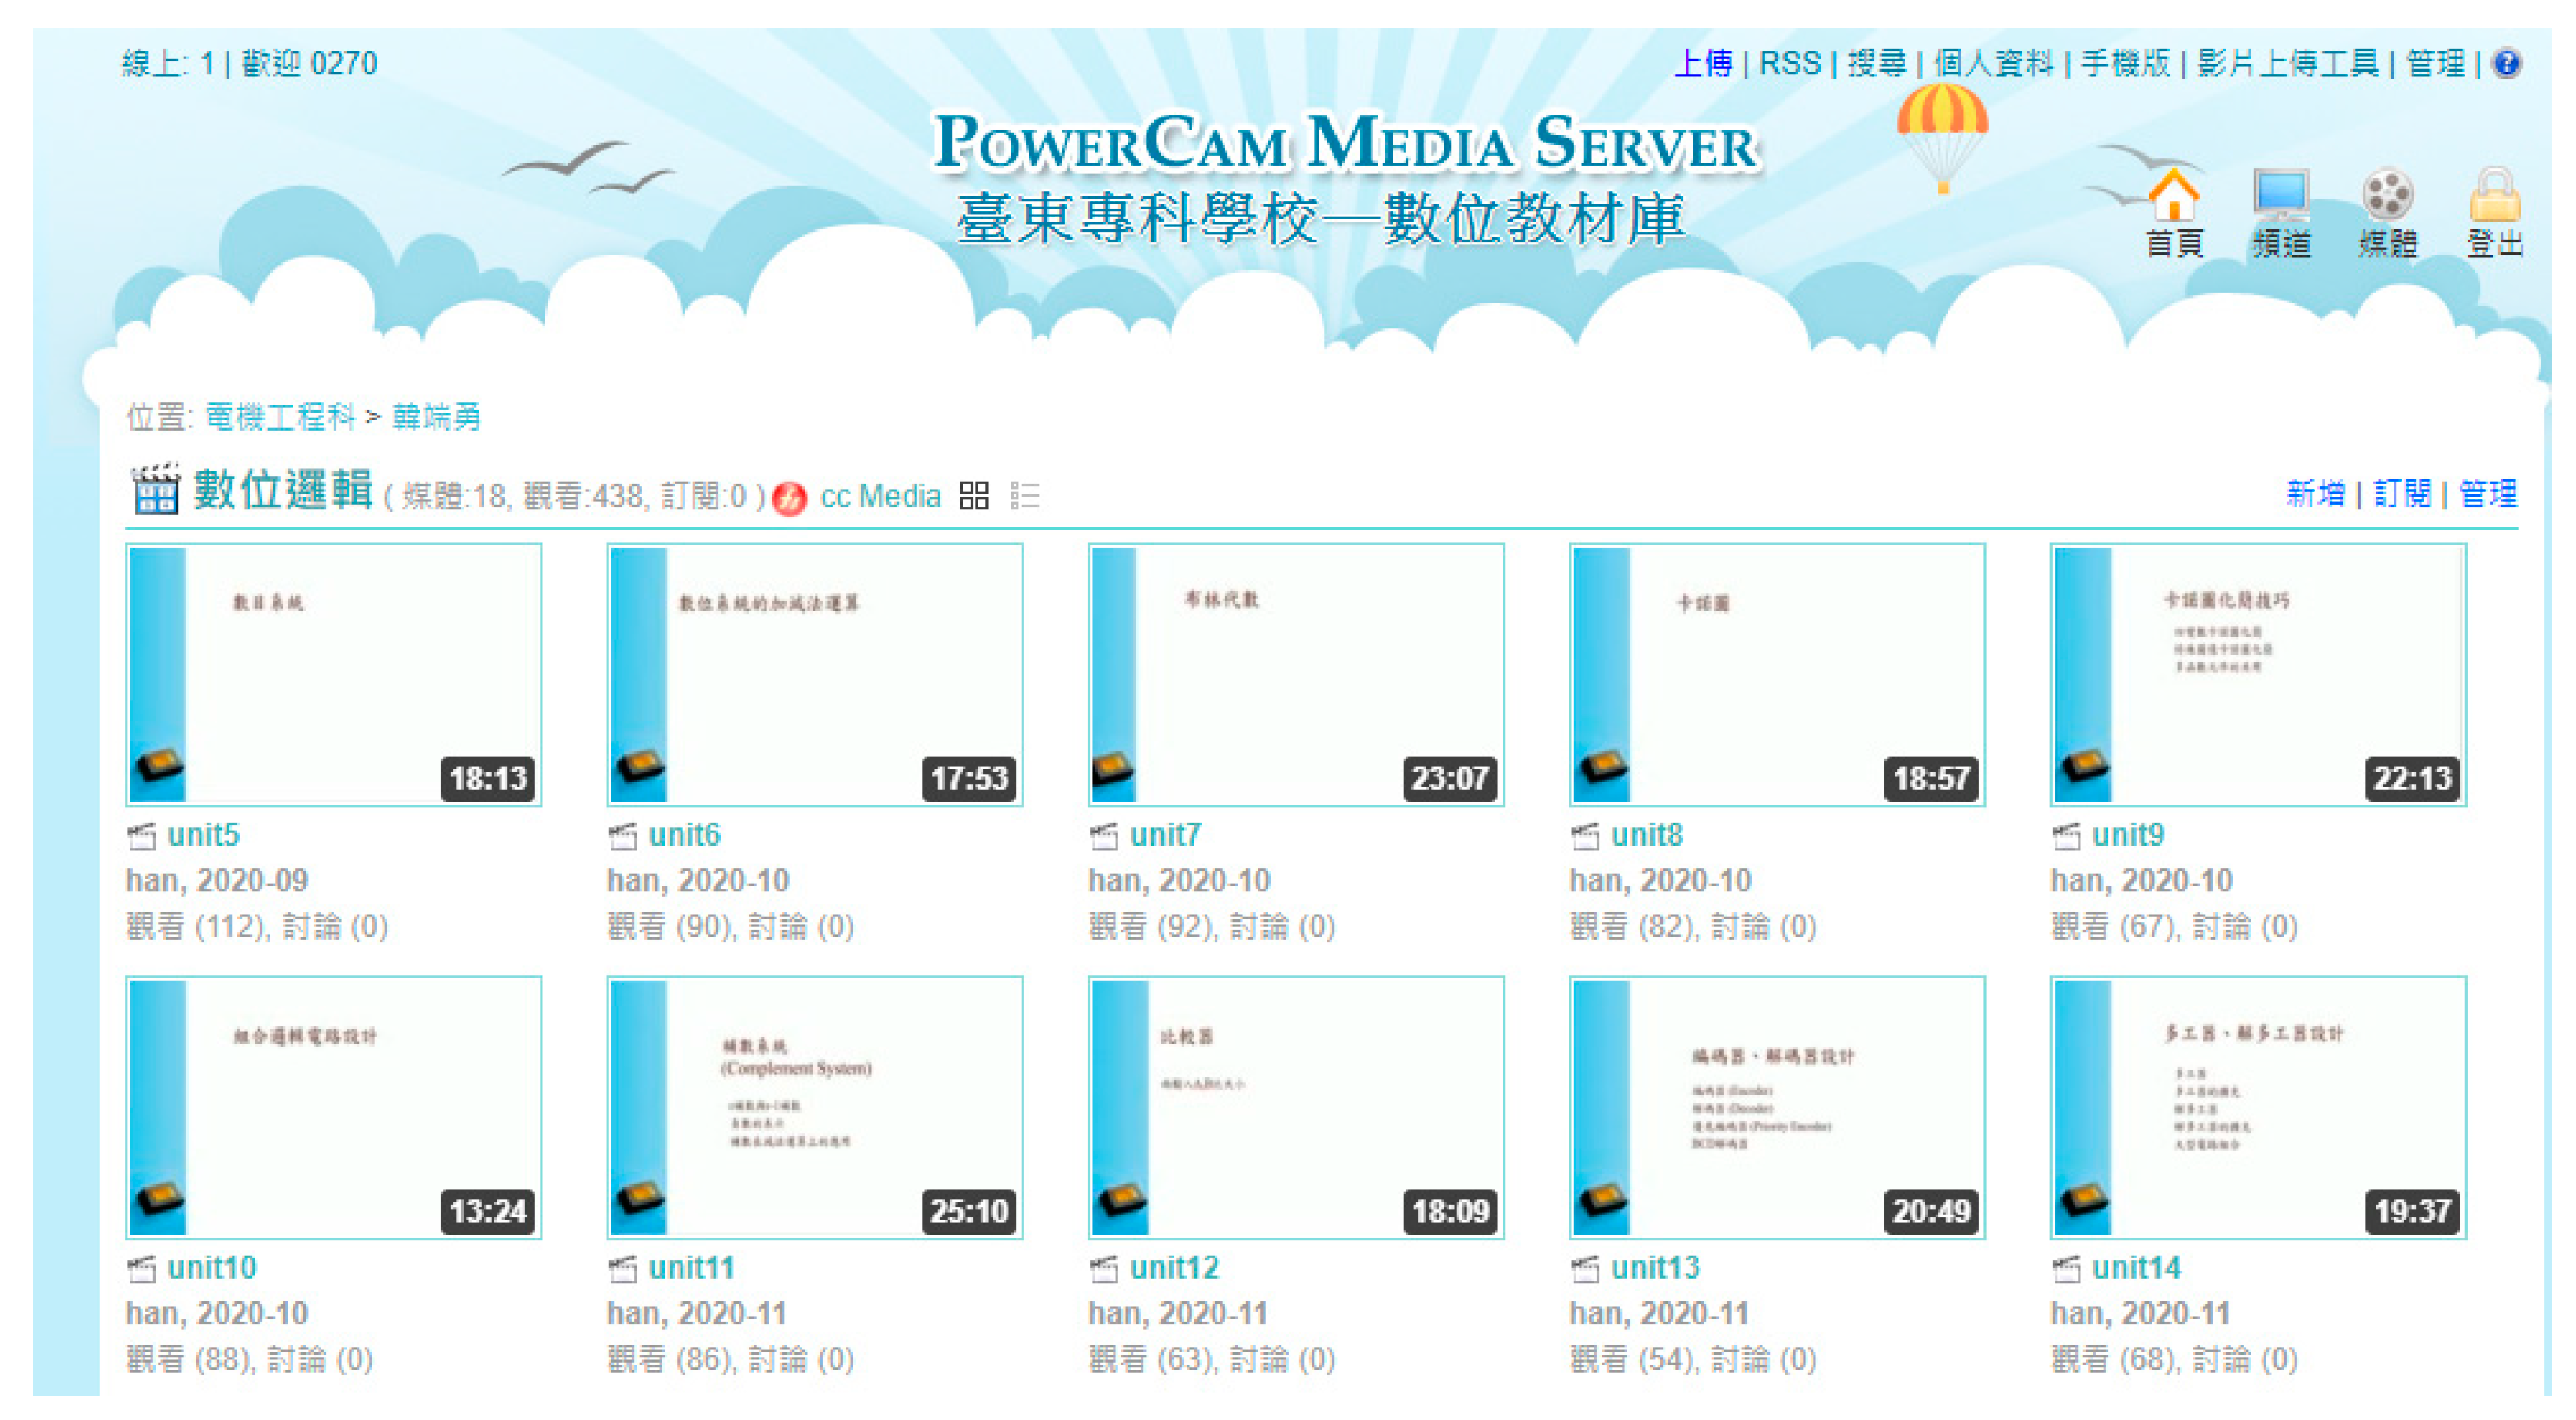
The DL course in 2019 was given in the FC model, with the participation of a total of 31 students who formed an experimental group. The independent variable was the teaching strategy of the FC model and the dependent variable was the learning performance of the learners in the DL course. The lecture video was uploaded to the channel of the lecturing teacher in the school’s E-media cloud and each student had his/her account to log in and watch the video, as shown in
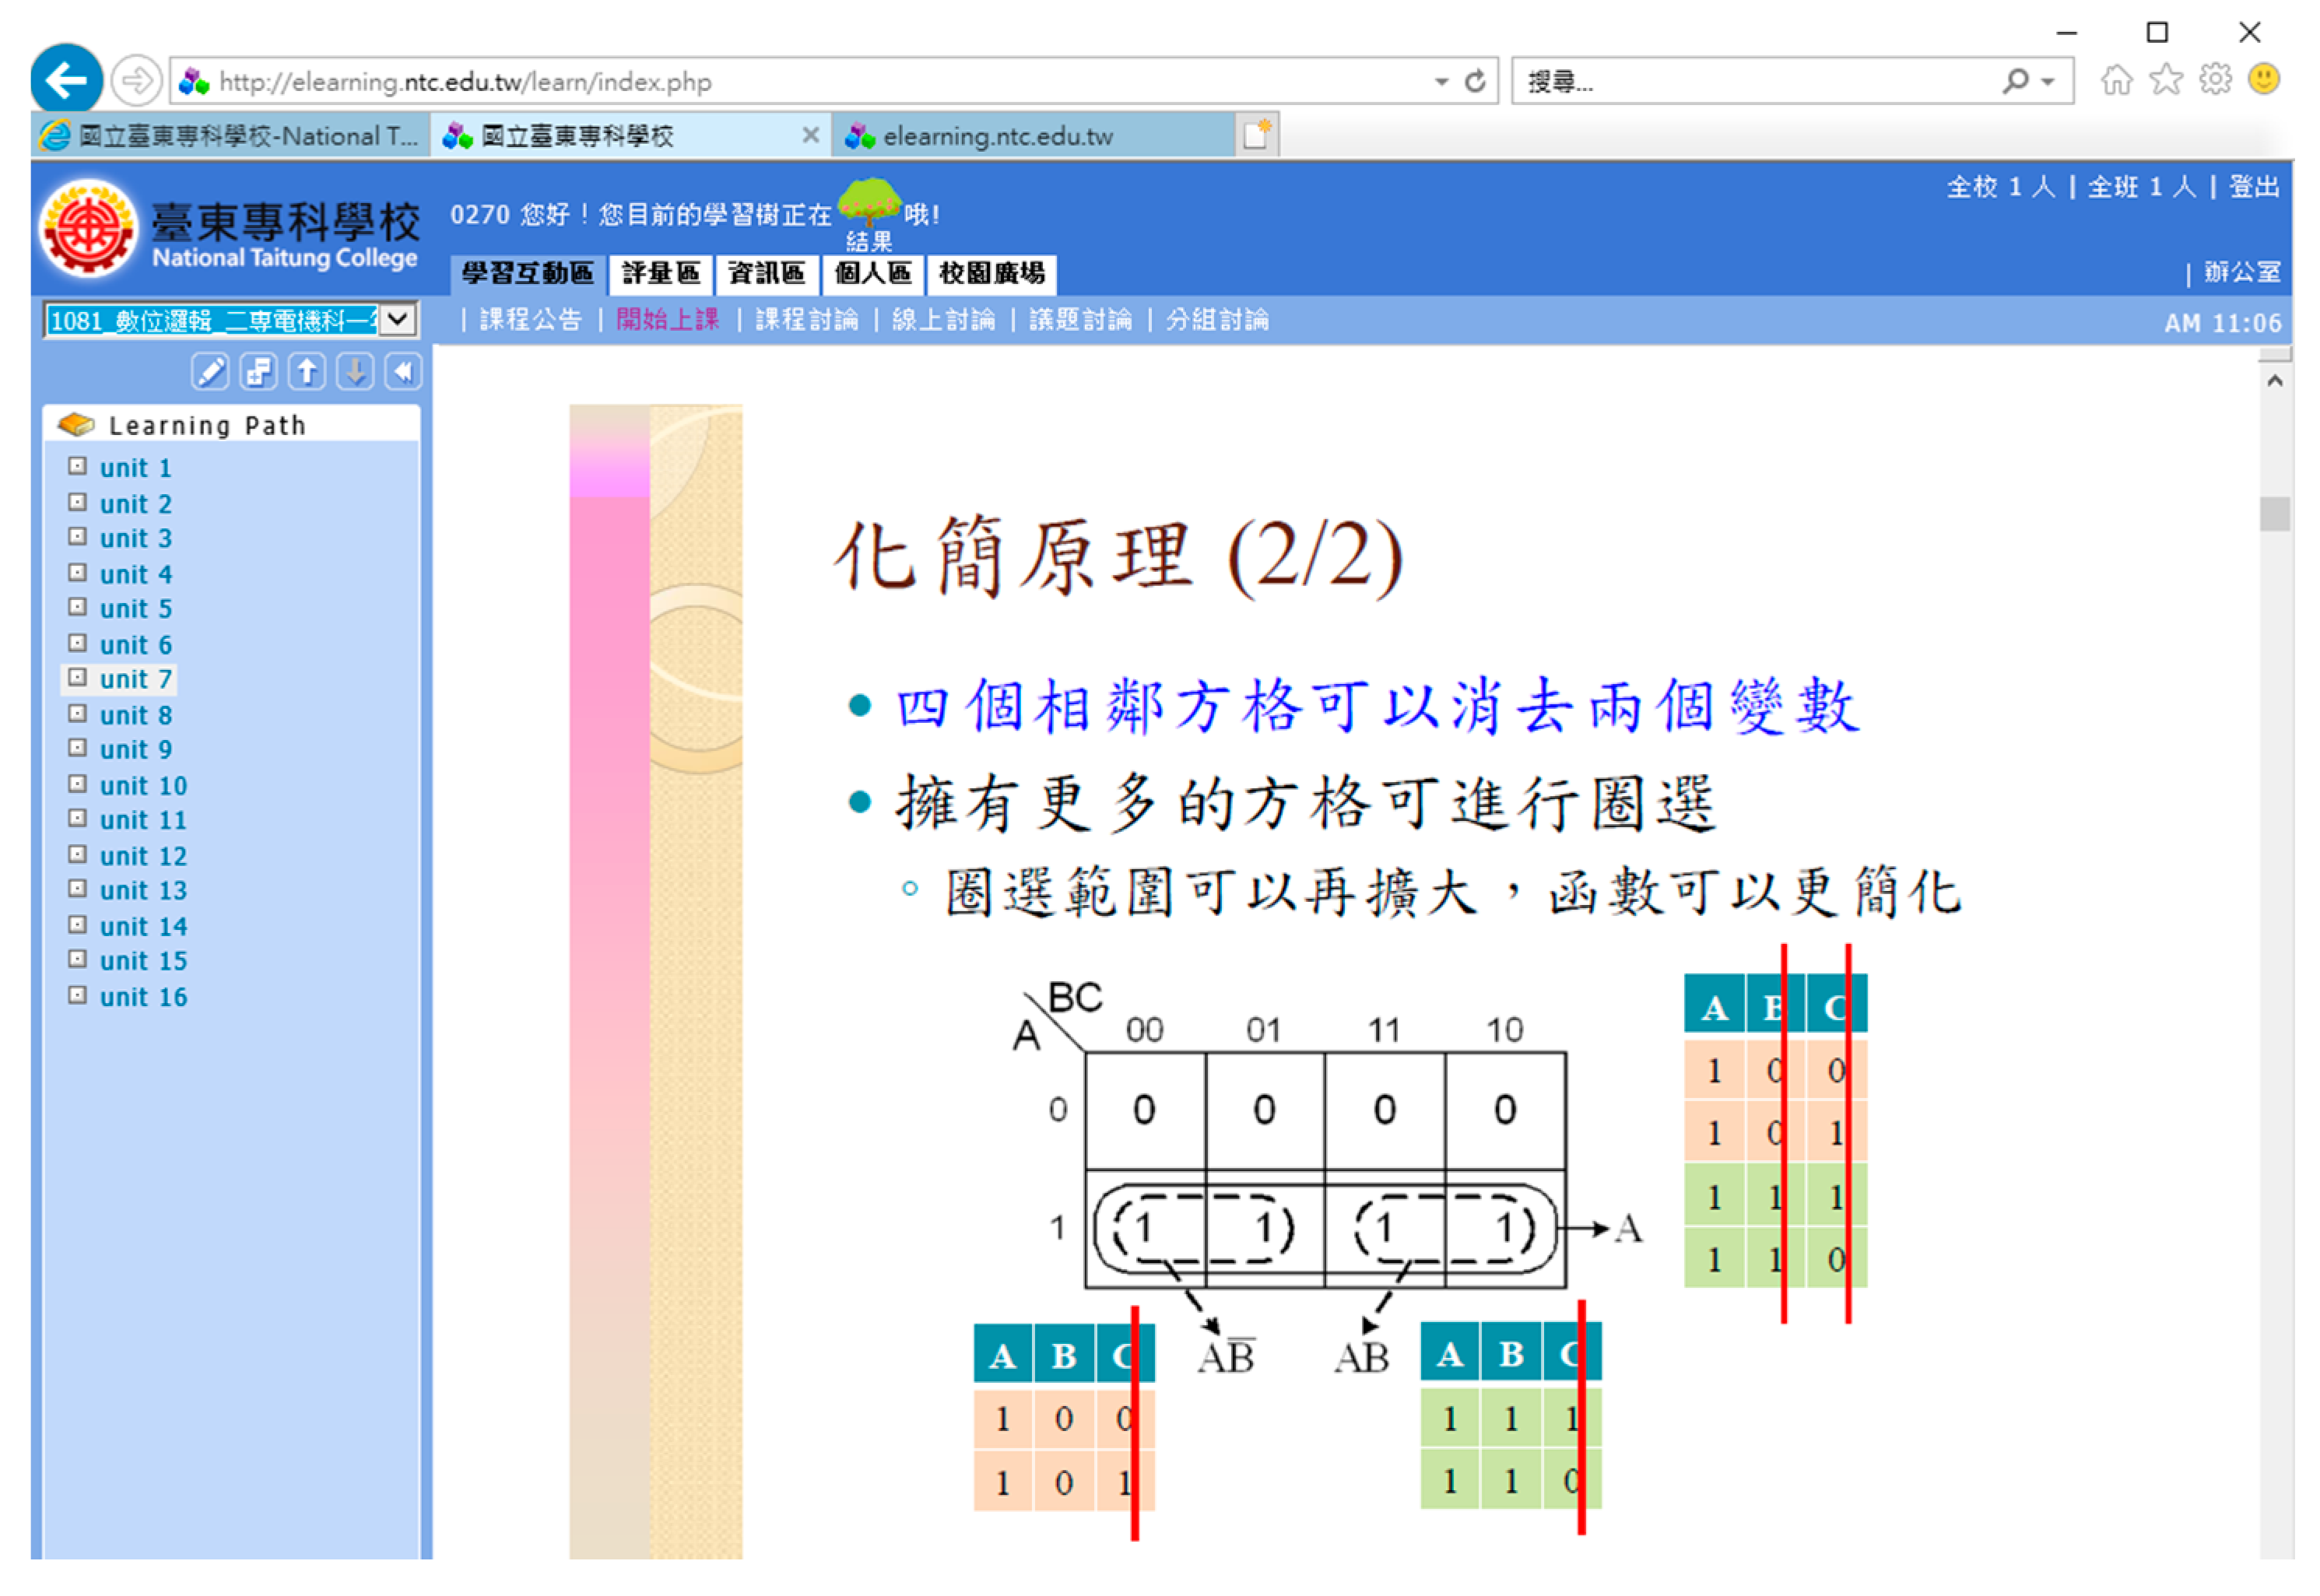
Figure 2. In addition to the lecture video, relevant PowerPoint slides with the content lectured in class were also uploaded to the school’s E-learning platform for students who took the course to watch and download, as shown in
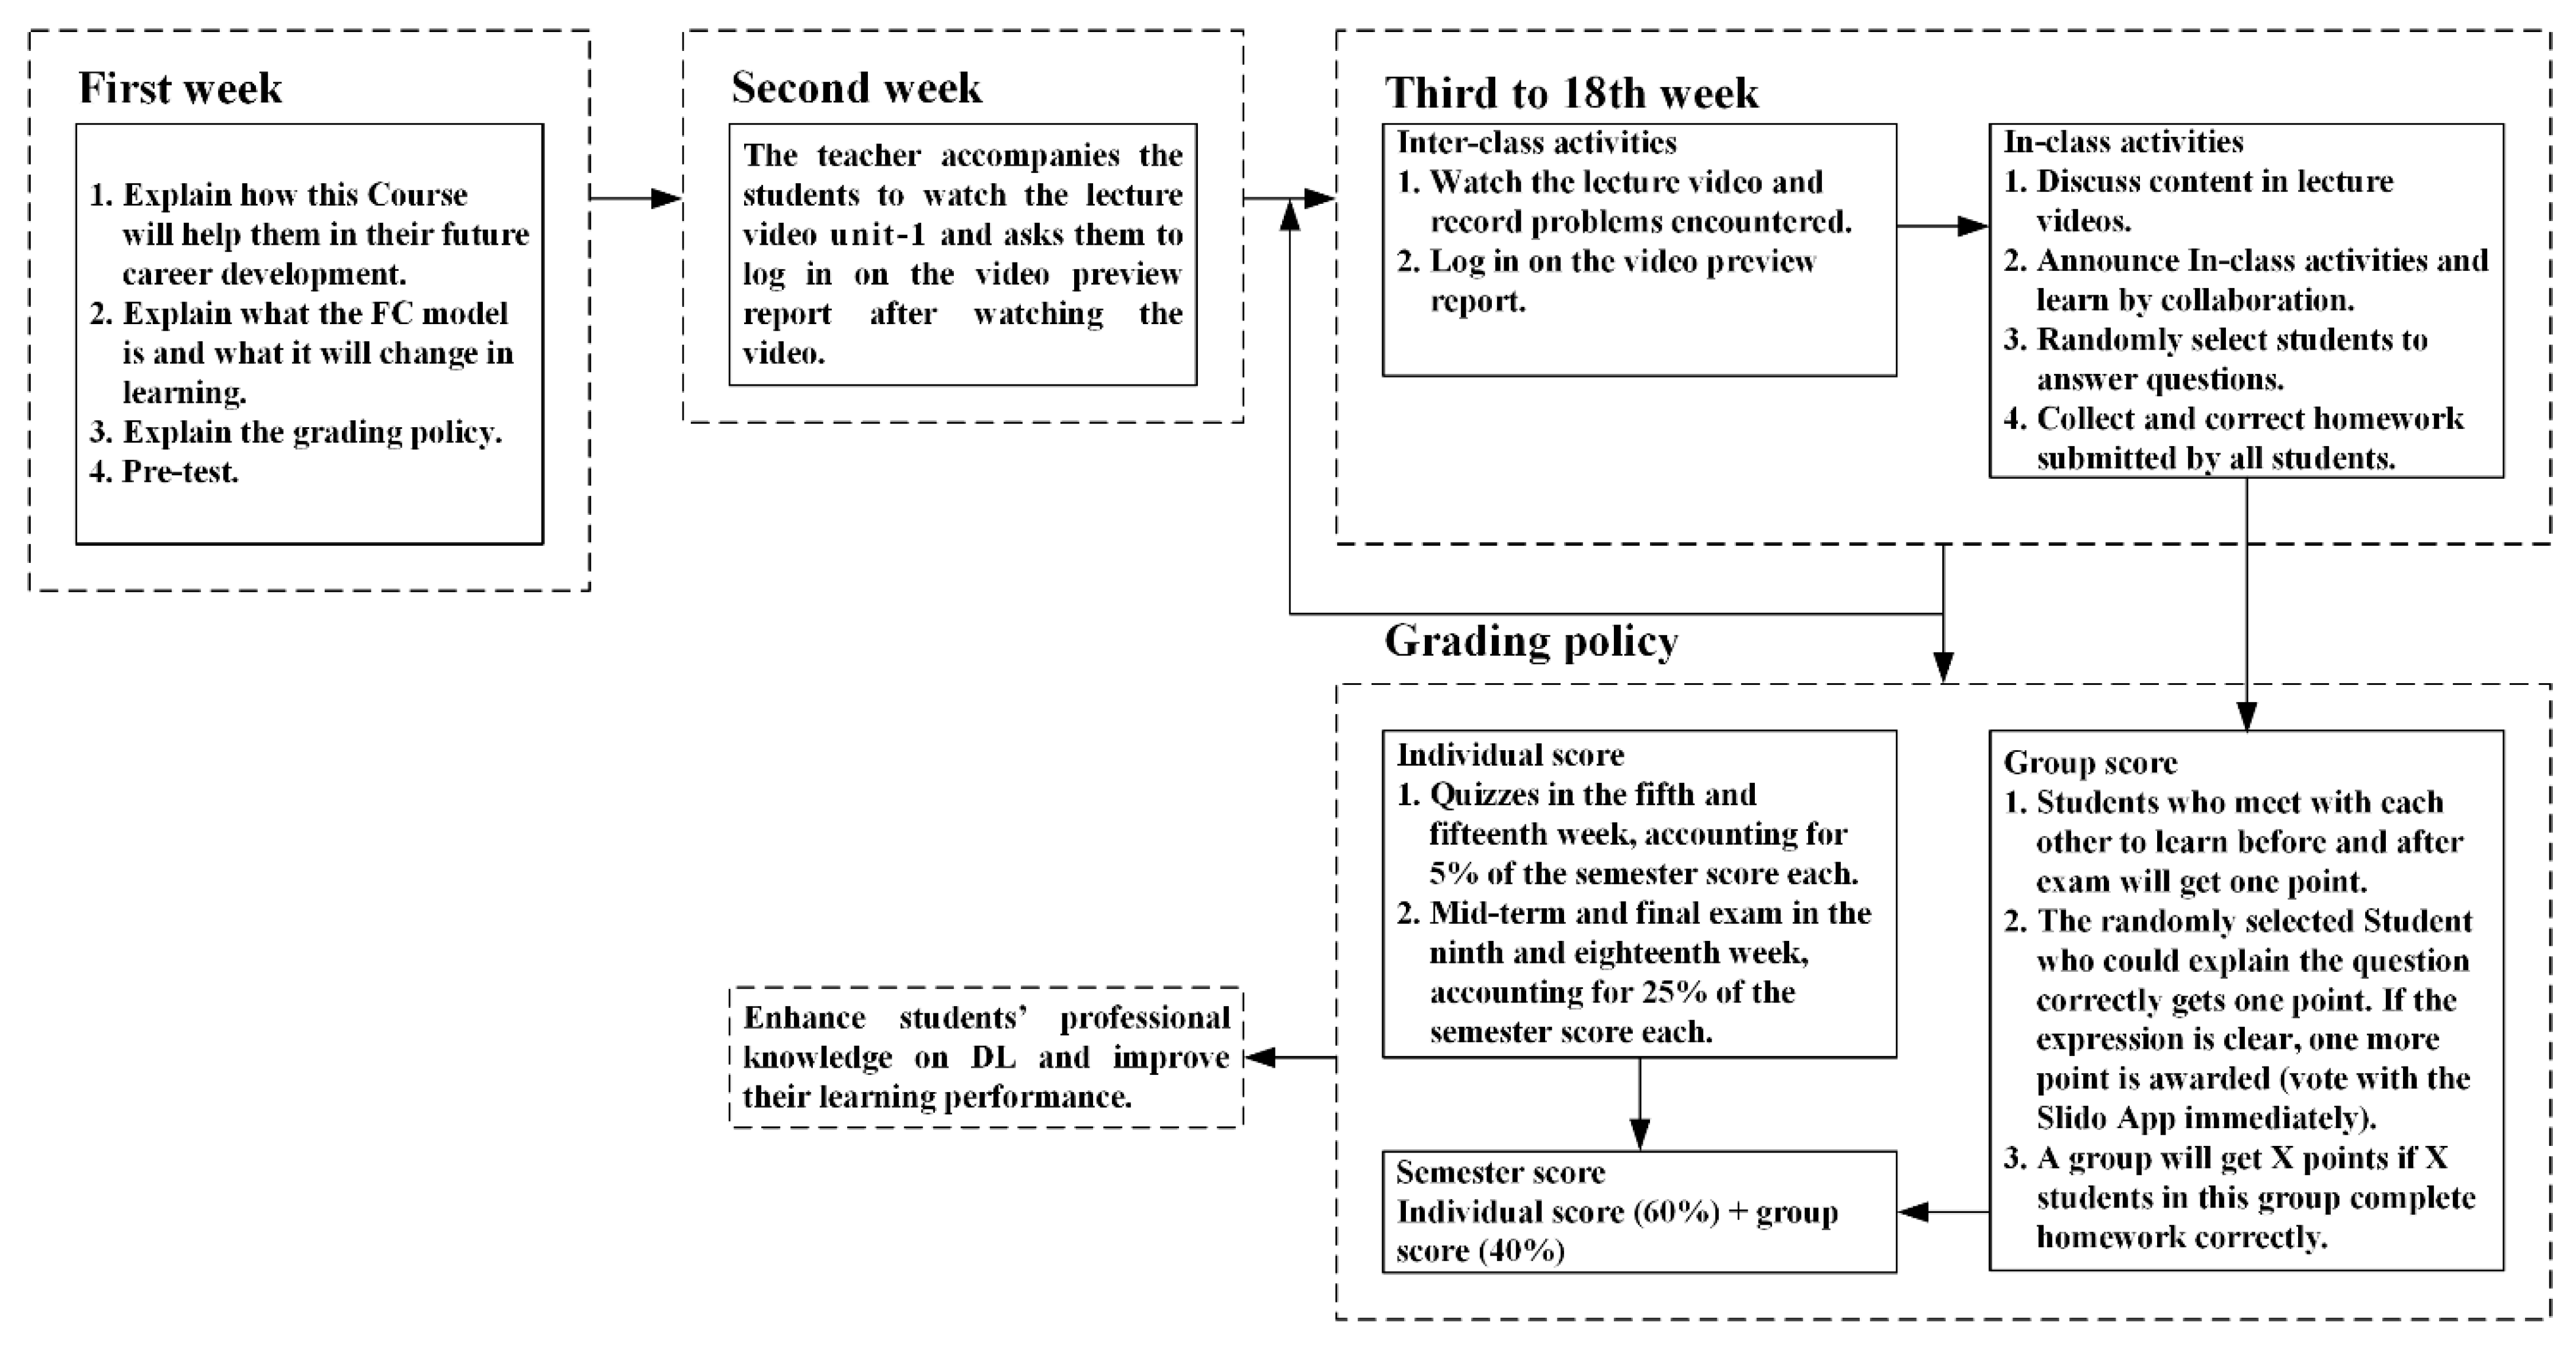
Figure 3. It was confirmed after the survey that all students had personal computers, laptops or mobile phones to access the video and PowerPoint slides. In addition to the above devices, students were also allowed to use computers for such download and watching in the computer room during opening hours of the school’s library. Through the Taiwan Academic Network (TANet) or the telecommunications network provided by the telecommunication providers, students were able to watch the lecture videos and PPT slides at any time. The course implementation process is shown in
Figure 4 with the details as follows:
In the first week, students were told how this course would help them in their future career development, in order to stimulate their learning motivation, whilst what the FC model was and how it could change their learning were also explained to them. The grading policy and the goal to learn the DL course under the FC model by improving their learning motivation and learning performance were also explained to them. Then, the pre-test was conducted. The scores were not included in the semester grade and were only served as a reference for the teacher to understand the students’ levels. After that, students were grouped according to the grade, and the high-scoring students were distributed in each group so that students with weaker foundations could be helped.
In the second week, students were required to sit with their groups and were led to watch the lecture video unit-1. The video was interrupted after the solving of an example and students were reminded that they could practice again to confirm they had indeed acquired the solving method, repeat the aforementioned procedure until the video was finished. After that, in-class activities mentioned in Step 3-2 were held.
The activities in the 3rd to 18th week were divided into inter-class activities and in-class activities, which were described as follows:
- 3-1
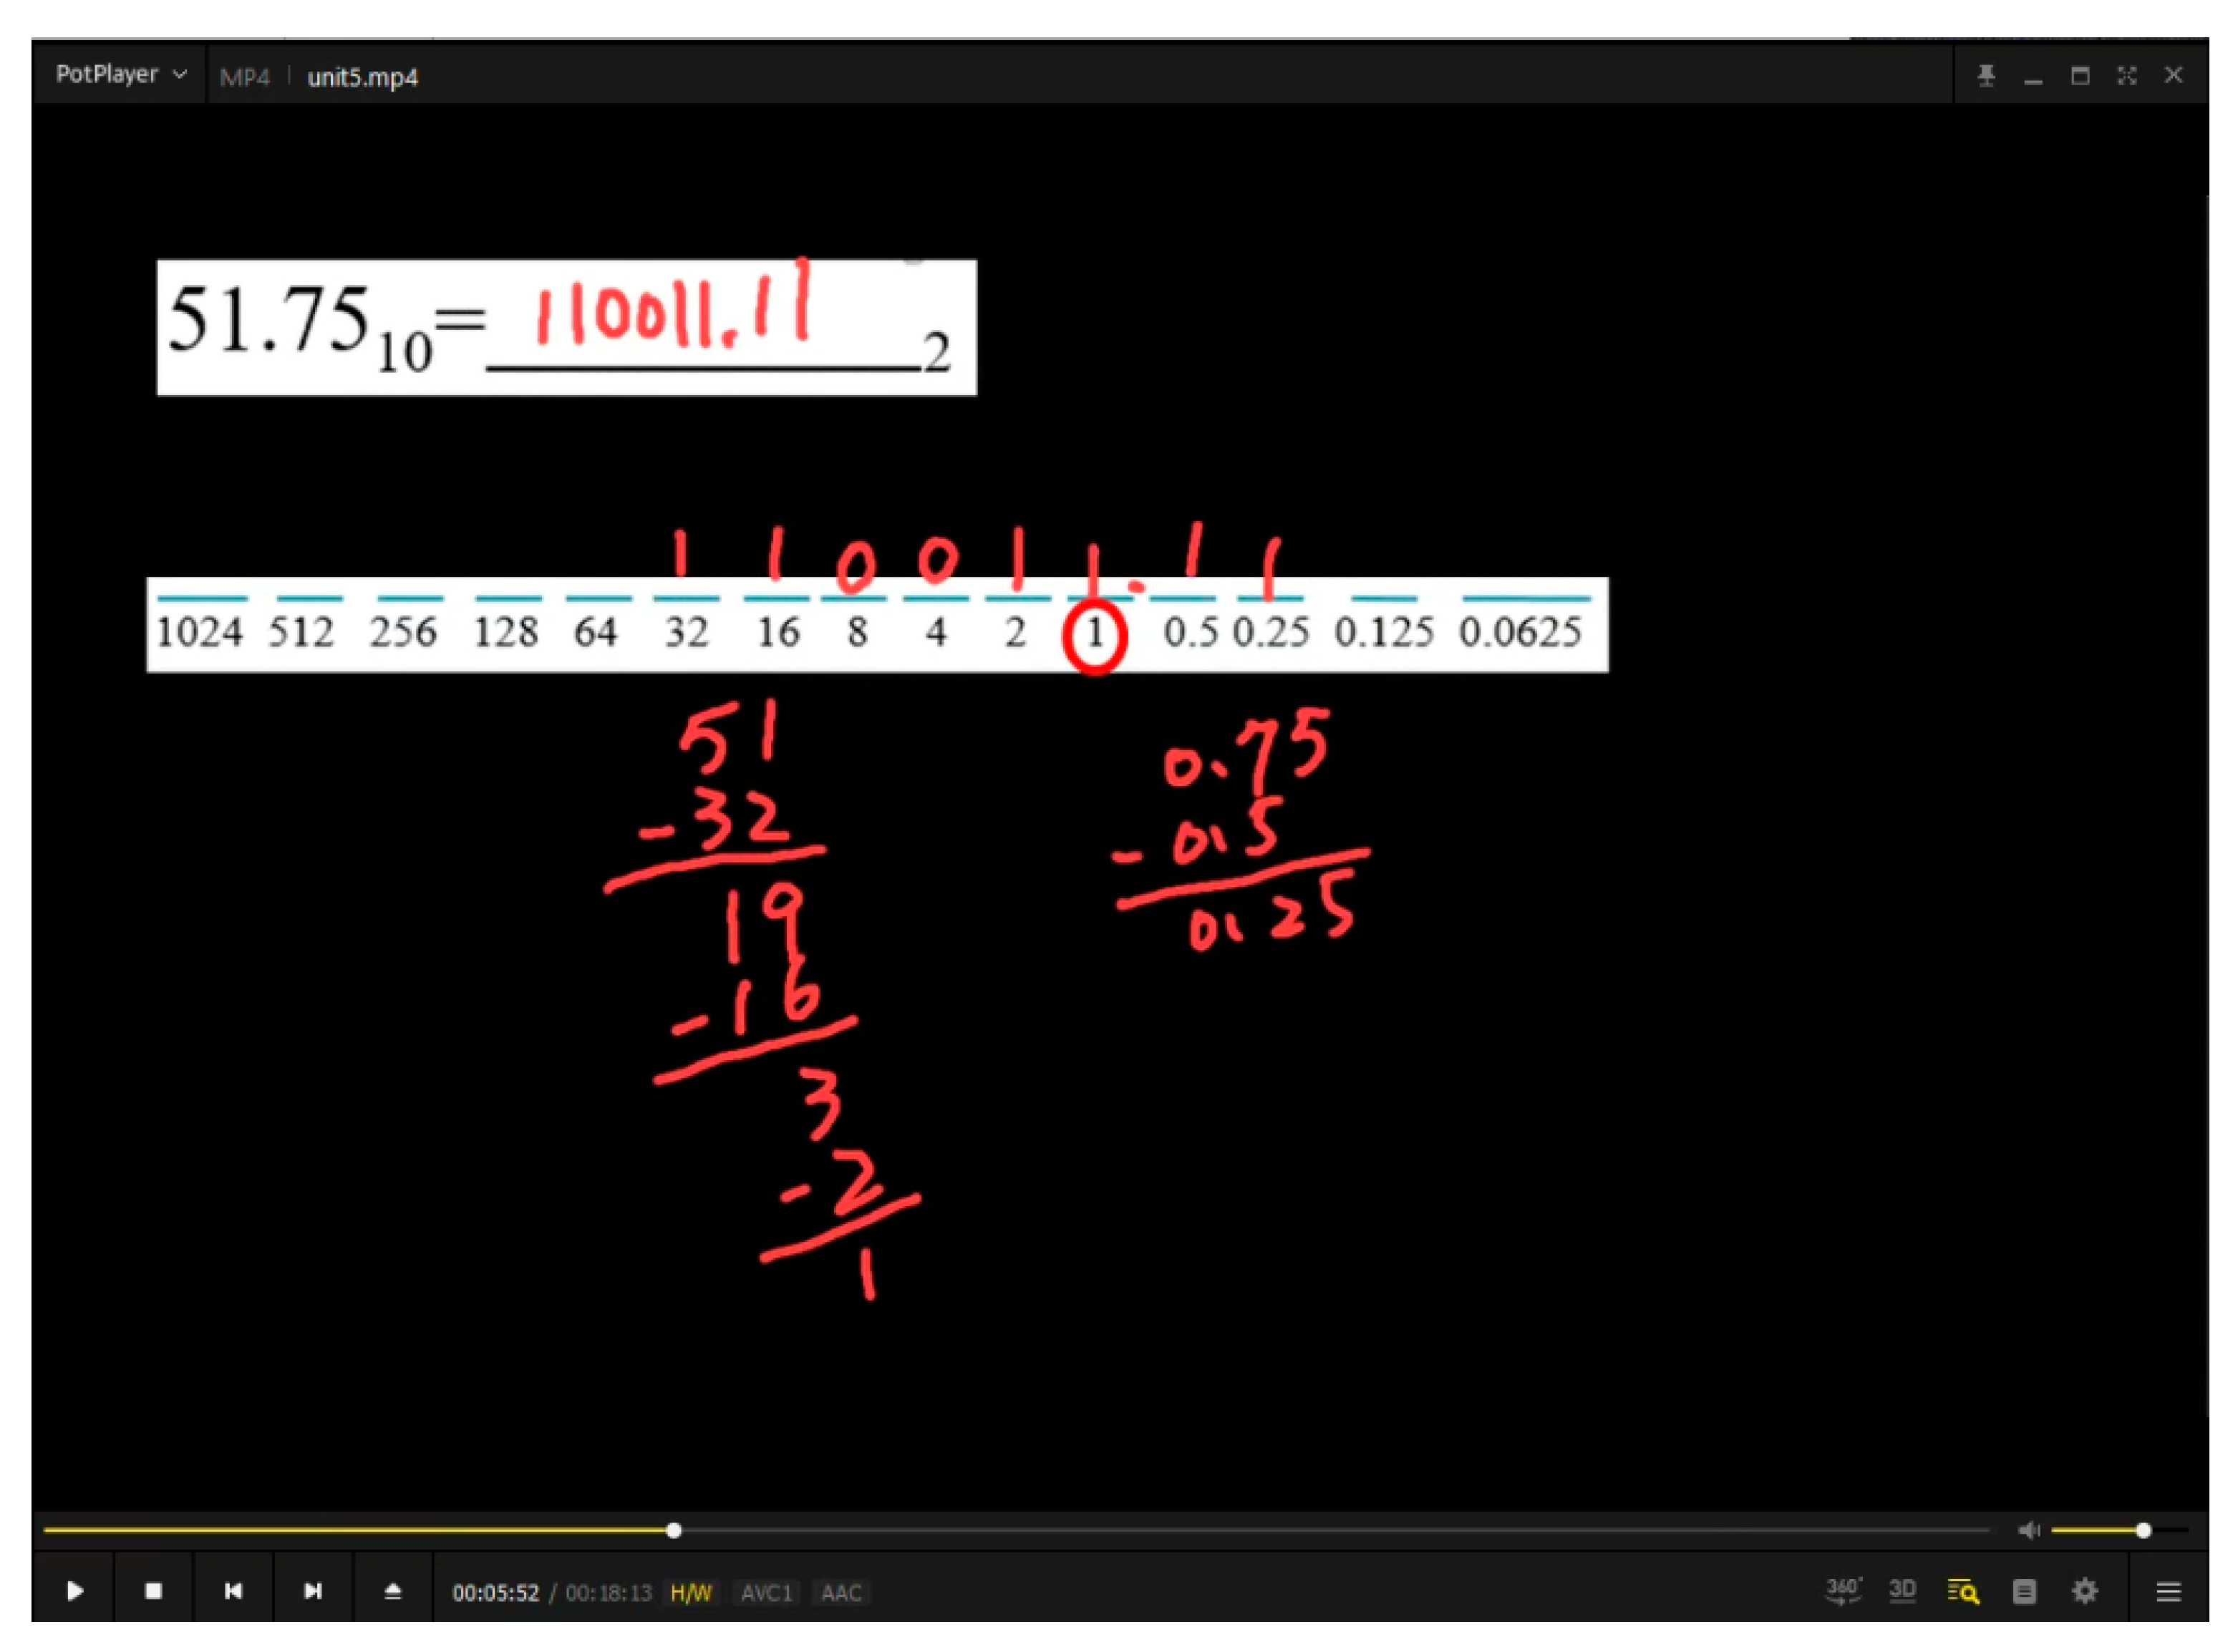
Inter-class activities: In order to ensure that all students actively participated in in-class activities, before each class, they were required to watch two video units. These videos were the main channels for students to gain knowledge of the course content. The teacher extracted key points from the textbook to make PowerPoint slides and adopted such slides in the video to explain the main concepts and gave examples. For these examples, the teacher would demonstrate the problem-solving process on the digitizer tablet, as shown in
Figure 5. Through such a step-by-step process, students understood the problem-solving process and clarified the concepts and ideas to solve relevant problems. Students could interrupt the video after solving the problem and practice again by themselves to deepen the impression.
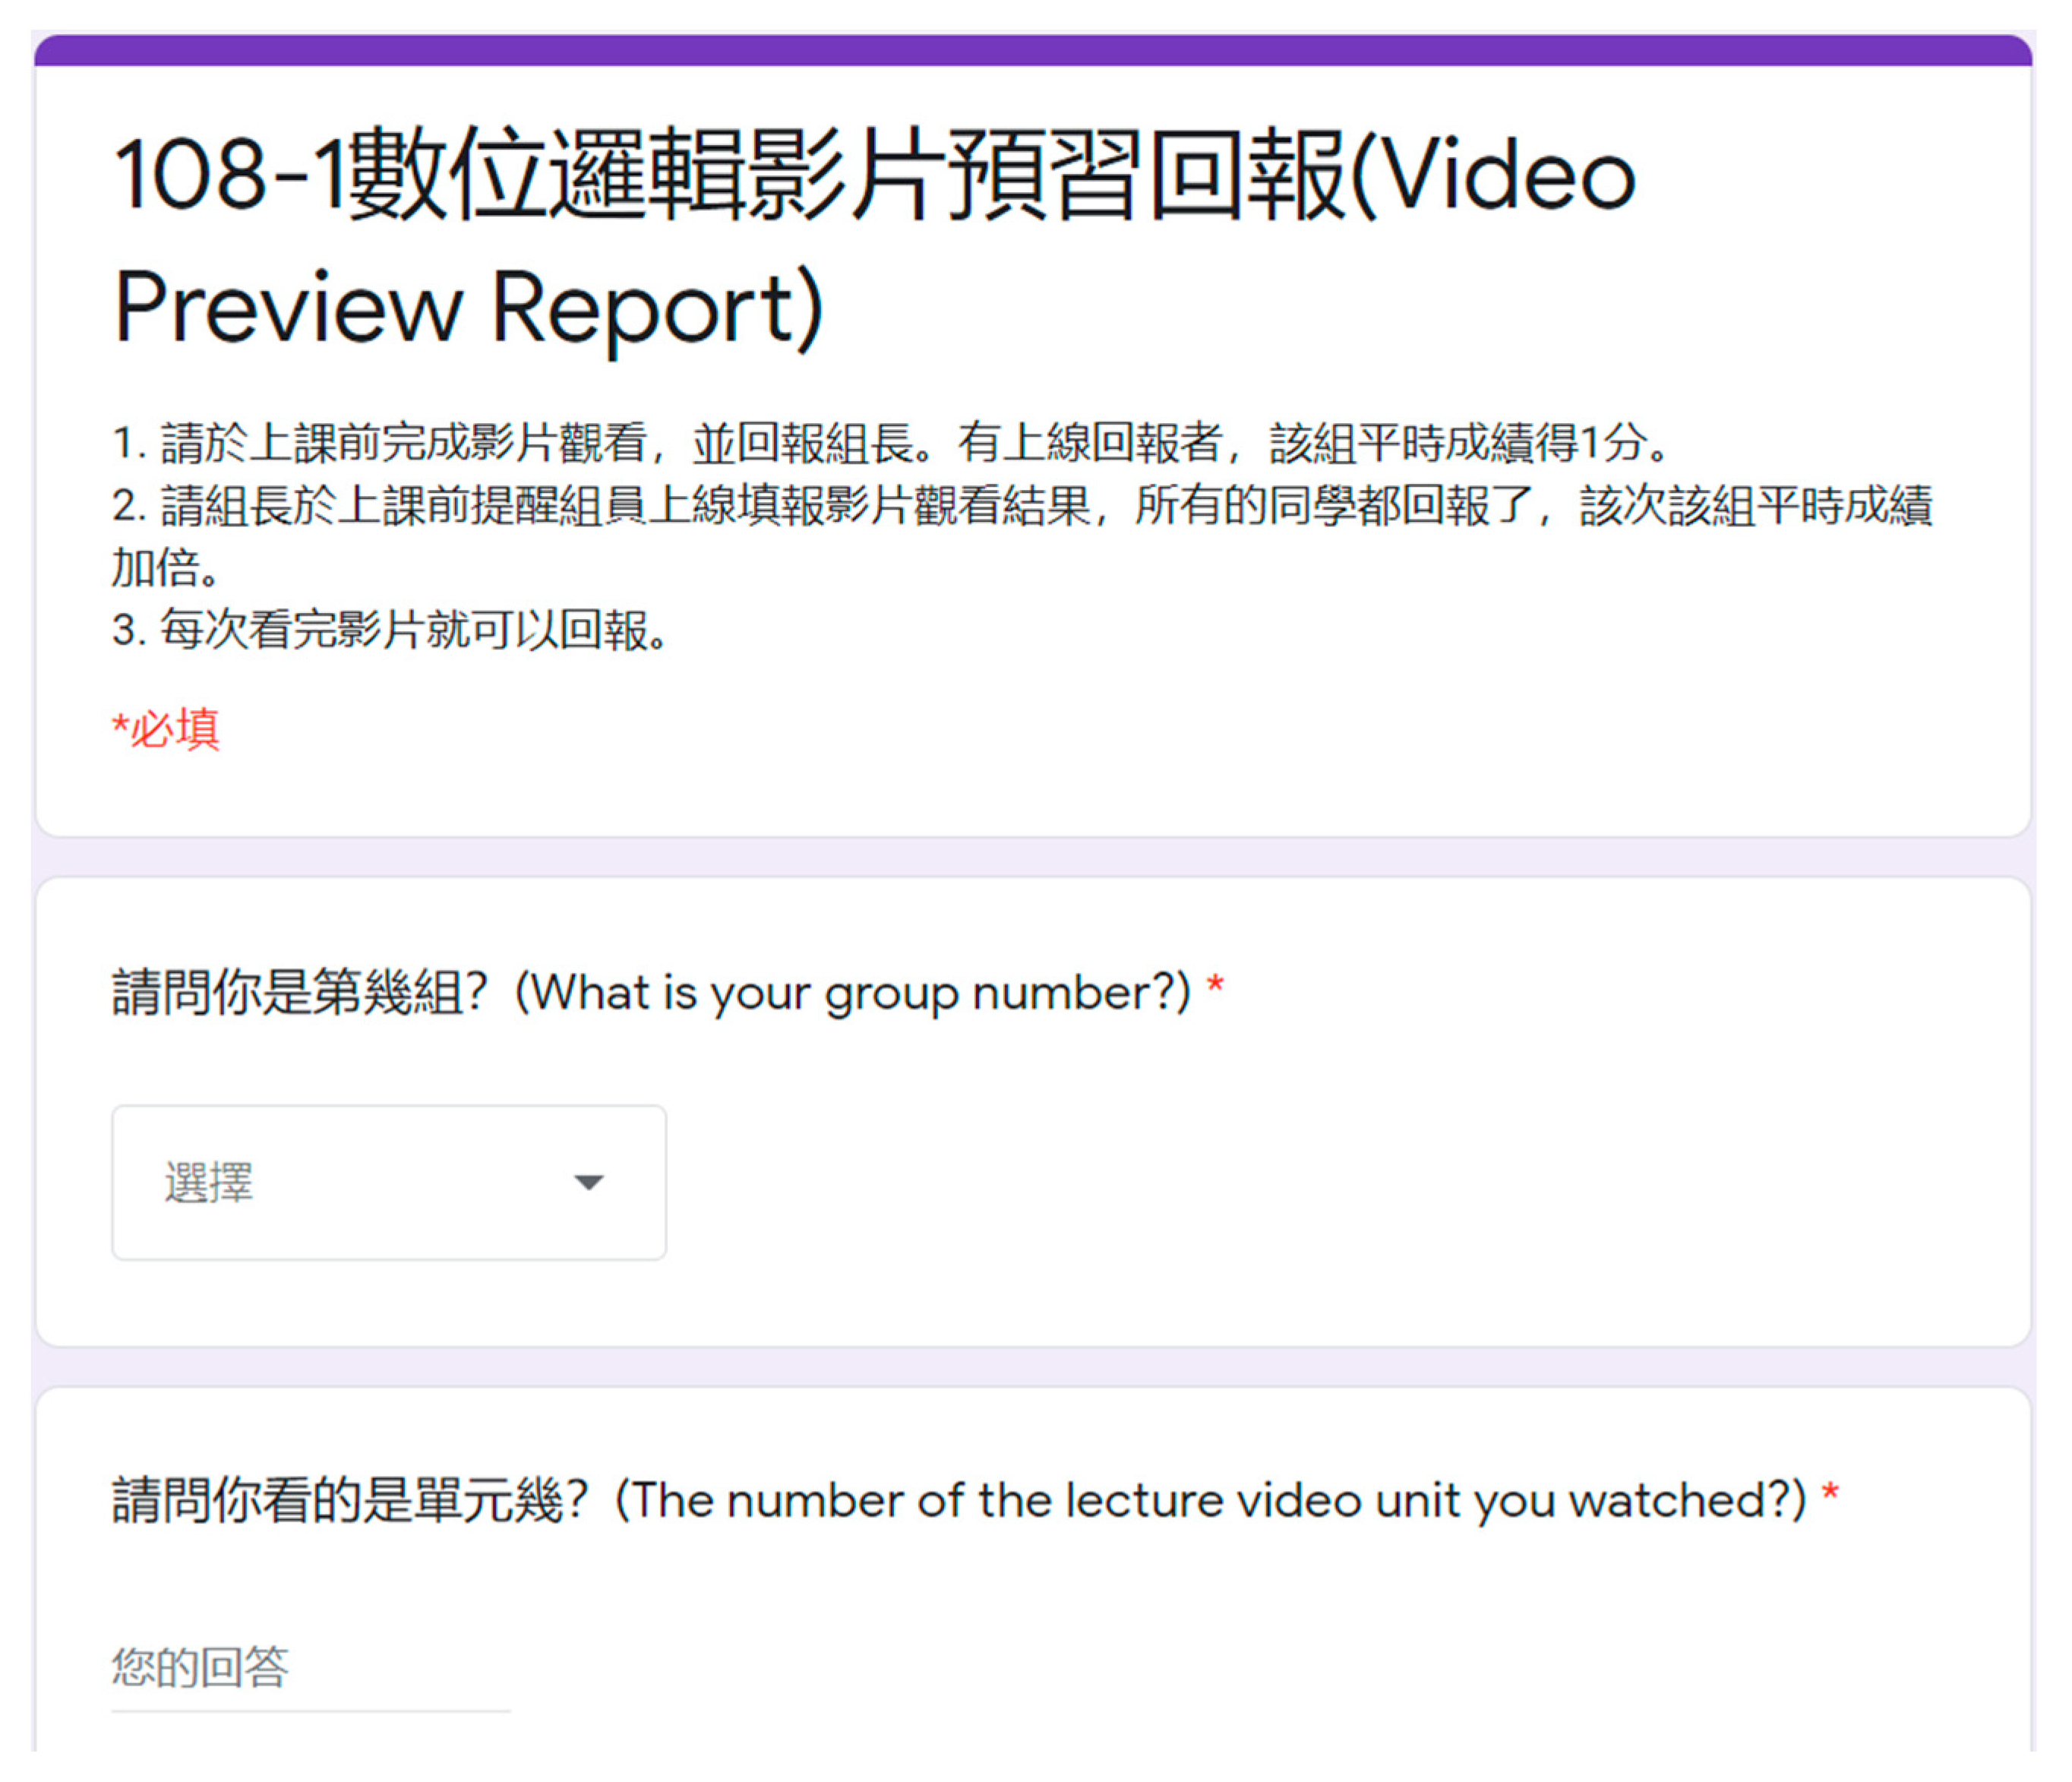
Figure 6 is a video preview report made by the teacher through the Google form. Students with difficulties in self-learning could watch the video with other students in the same group. After acquiring the subject content of the lecture video during the process of inquiry and discussion, students could fill in the form, and the group would get one point. When all members of the group have completed the recording, the score for the group on the unit was doubled. After watching the video, students could further explore the subject content by reading the textbook and completing the questions therein.
- 3-2
In-class activities: By thinking, discussing, collaborating, observing and reflecting on the learning activities, students were promoted to actively learn and design in-class activities. Firstly, the teacher would ask the students if they had any doubts about the video content and discussed them if any; if not, the teacher would summarize the key points of the lecture video. Then, in-class activities were carried out so that members of the same group could discuss and collaborate with each other to complete the teacher’s assignments after thinking. During this period, the teacher would walk by all groups and gave a reminder when spotting wrong concepts. After more than 80% of the students completed the assignments, the teacher randomly selected a student to explain the solution on stage. The selected student could interpret the solution (concept) written on his/her paper with the opaque projector on the stage for other students. If the answer was correct, the group would get one point and other students in the class would vote with the Slido App in real-time. If more than half of the voters agreed with the expression clearly of this student, the group he/she was in would get one more point. Then the teacher would comment on the answer and leave three minutes for the students to correct their answers. If the answer was incorrect, an opportunity to answer this question was provided to all students and the way of scoring was the same as above. The above steps would be repeated until the class was over. The teacher would collect and correct homework submitted by all students. If X (number of students) students in a group answered the question correctly, the group would get X points. If there were Y (number of questions) questions in the in-class activity, the group would get a total of X × Y points.
- 3-3
Group members could decide by themselves on arranging self-study time before and after the exam or not (students were required to fill the after-class discussion report form). Students who met with each other to learn would get one point which would also be included in the group score. All in-class activity scores and self-study scores constituted the group grade of the semester, which will be normalized to 40% of the semester grade at the end of the semester.
Semester grade calculation: The 100-point system was applied. Individual scores included results of quizzes in the fifth and fifteenth weeks, each accounted for 5% of the score. The mid-term and final exam results in the ninth and eighteenth weeks accounted for 25% of the score each. A student’s semester score (100%) could be obtained by adding all individual scores and the group semester scores (40%) in Step 3-3.
4. Results
If enough experiment participants have been equipped, the quasi-experimental design method could be applied to divide the participants into two groups (the control group and experimental group) for comparison. The changes in the dependent variable due to the intervention of the independent variable were observed in this experiment. The subject of this study was the EE engineering students of a junior college locating in southeastern Taiwan. Since there was only one class for each grade in this department, it was not practicable to instruct the control group and experimental group at the same time. Therefore, this experiment applied the Panel Data Method (PDM), a natural experimental method to form natural intervention measures mainly by having some events under non-human control. In the experiment process, intervention measures naturally help us to carry out random allocation, resulting in a design similar to a randomized controlled experiment, which is suitable for small-size sample analyses.
In this study, students of different regions, genders and schools were enrolled through different admission channels, and the students of the four semesters were quasi-randomized allocated. This study collected group data for several periods, and the semester scores of DL autumn courses and the average semester scores of other professional subjects (C-programming, Calculus, Electronic Circuits and Circuit I) of these students from 2016 to 2019 were as follows. The premise of the assumption was that “if no intervention occurred, the average results from the experimental group and control group would be parallel to each other (parallel trend assumption)”.
The teaching objectives and content of the DL courses were the same for both TC and FC models applied for the number of exams and question types. The effectiveness of the FC model was evaluated by comparing the semester grades. The question types of all exams (quizzes, mid-term exams and final exams) included short answer questions or designs, which were consistent with the question types of the sample questions in the lecture video and the in-class exercises.
4.1. Analysis on Learning Performance of DL Course
The paired sample t-test was applied to examine the learning performance of the experimental group, and the test results were shown in
Table 1. The average pre-test score was 7.68 and the standard deviation was 16.530; the average post-test score was 60.03 and the standard deviation was 19.724. The t statistic value of pre-test scores and post-test scores was −17.278 with dual-tailed significant
p-value = 0.000 < 0.05. The null hypothesis was rejected, and the results signified that there was a significant difference between the two exam scores. The post-test scores were significantly higher than the pre-test ones.
4.2. Analysis of Learning Performance with the FC Model Teaching Strategy Intervention
Although the post-test scores of students in the experimental group in DL courses were significantly higher than their pre-test scores, it could not be concluded as a subsequent result of the intervention of the FC model. Therefore, the DL post-test scores of students in 2018 (the control group) and in 2019 (the experimental group) were taken as independent sample t-test to examine the impact of the FC model intervention, and the test results were shown in
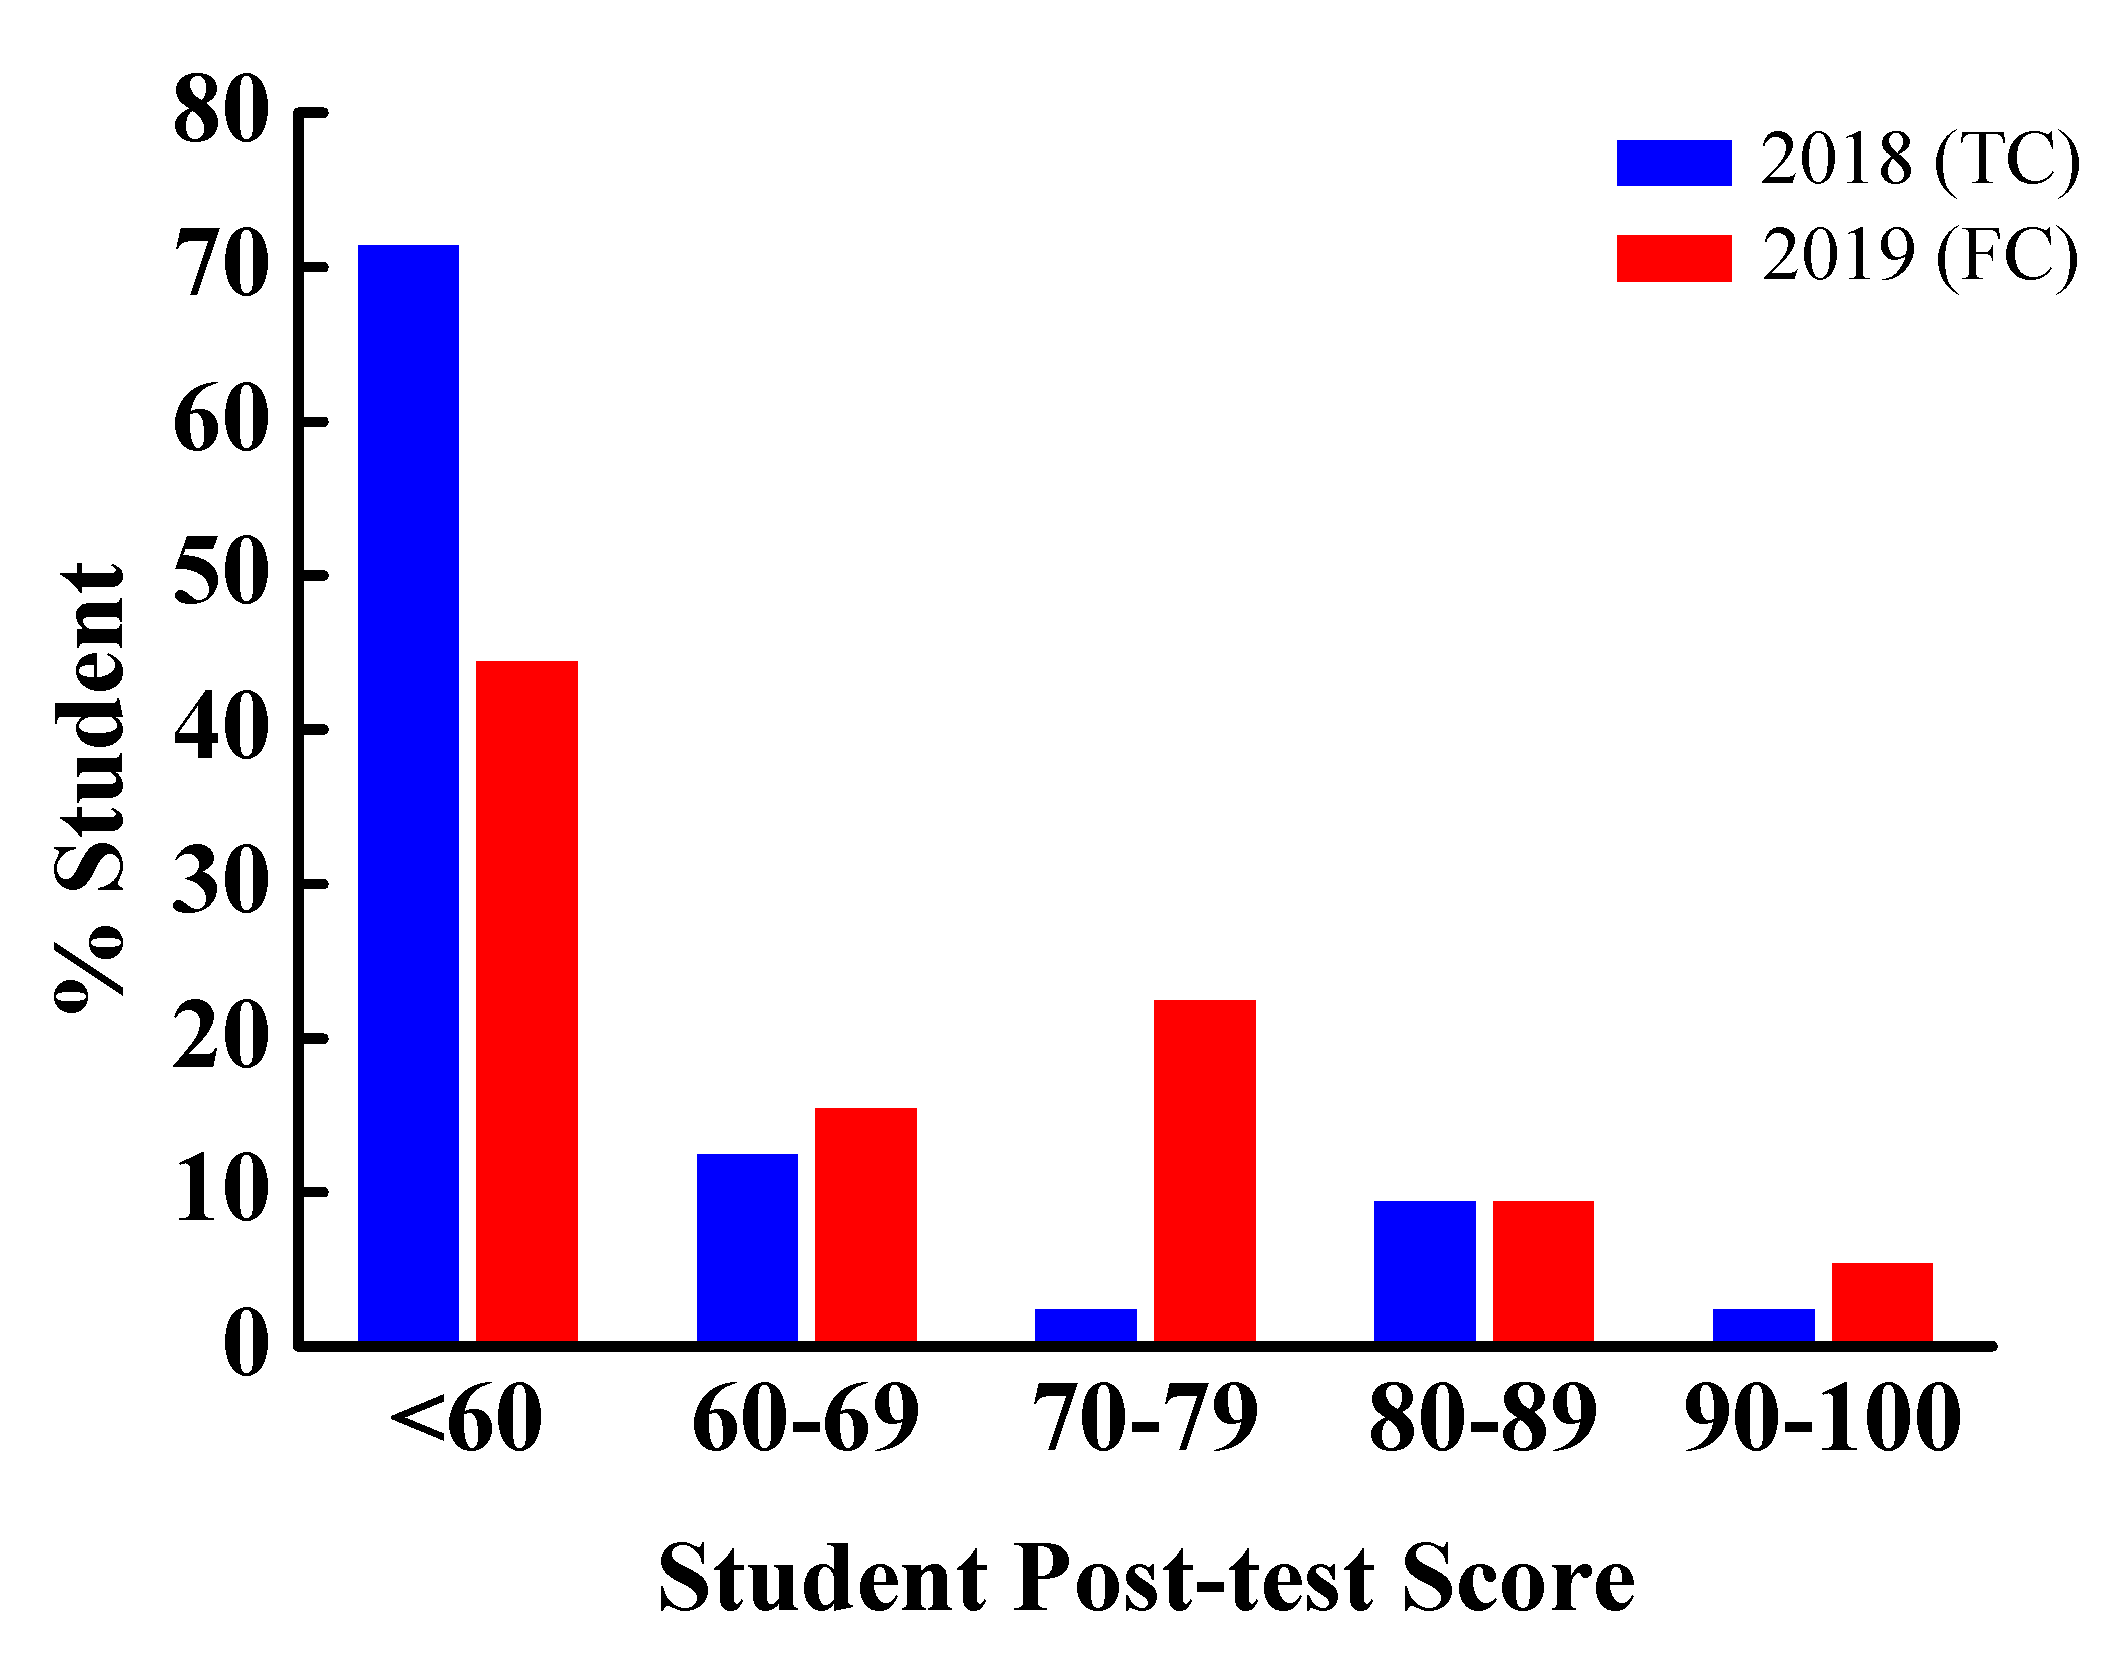
Table 2. The average post-test score in 2019 was 60.0323, displaying a rise in the post-test scores and a fall in the standard deviation than those in 2018. It is worth noting that, in addition to the narrowing of the gap between the lowest score and the highest score under the FC model, the passing rate of students also exhibited a significant increase. As shown in
Figure 7, the percentage of students with a score below 60 decreased while the percentage of students with a score of 60–69, 70–79 and above 90 increased. The examining significance of the Levene test is 0.278 > 0.05 and the null hypothesis assuming that the population variance is equal should be accepted. Therefore, the test results in the “Assuming equal variance” column yielded the conclusion that the t value was −3.012 and
p =
0.004 < 0.05; it has reached a significant level which means that there was a significant difference between the scores of the control group and experimental group. That is to say, followed by the intervention of the FC model, the learning performance of students in the DL courses has significantly improved. This result is consistent with that of previous studies.
4.3. Panel Data Method (PDM)
This study collected semester grades on DL courses and average semester grades on professional subjects for several years, as shown in
Table 3. It could be found that with the advance of time, the semester grades of both categories were on a downward trend and the average downward trend of professional subjects slid slower than that of DL courses, presenting a ratio of 1:3 to 1:9. We observed that the average semester grades of professional subjects continued to decline in 2019, so it could be expected that if the TC model was applied, the downward trend for DL semester grades would remain the same. It was estimated that the DL semester grades in 2019 would be about 52~60 points. However, due to the intervention of the FC model, the actual DL semester grade in 2019 was 72 points, a difference of more than 12 points. To make it easier to understand the trend of semester grades, the formula for calculating the trend ratio is introduced here.
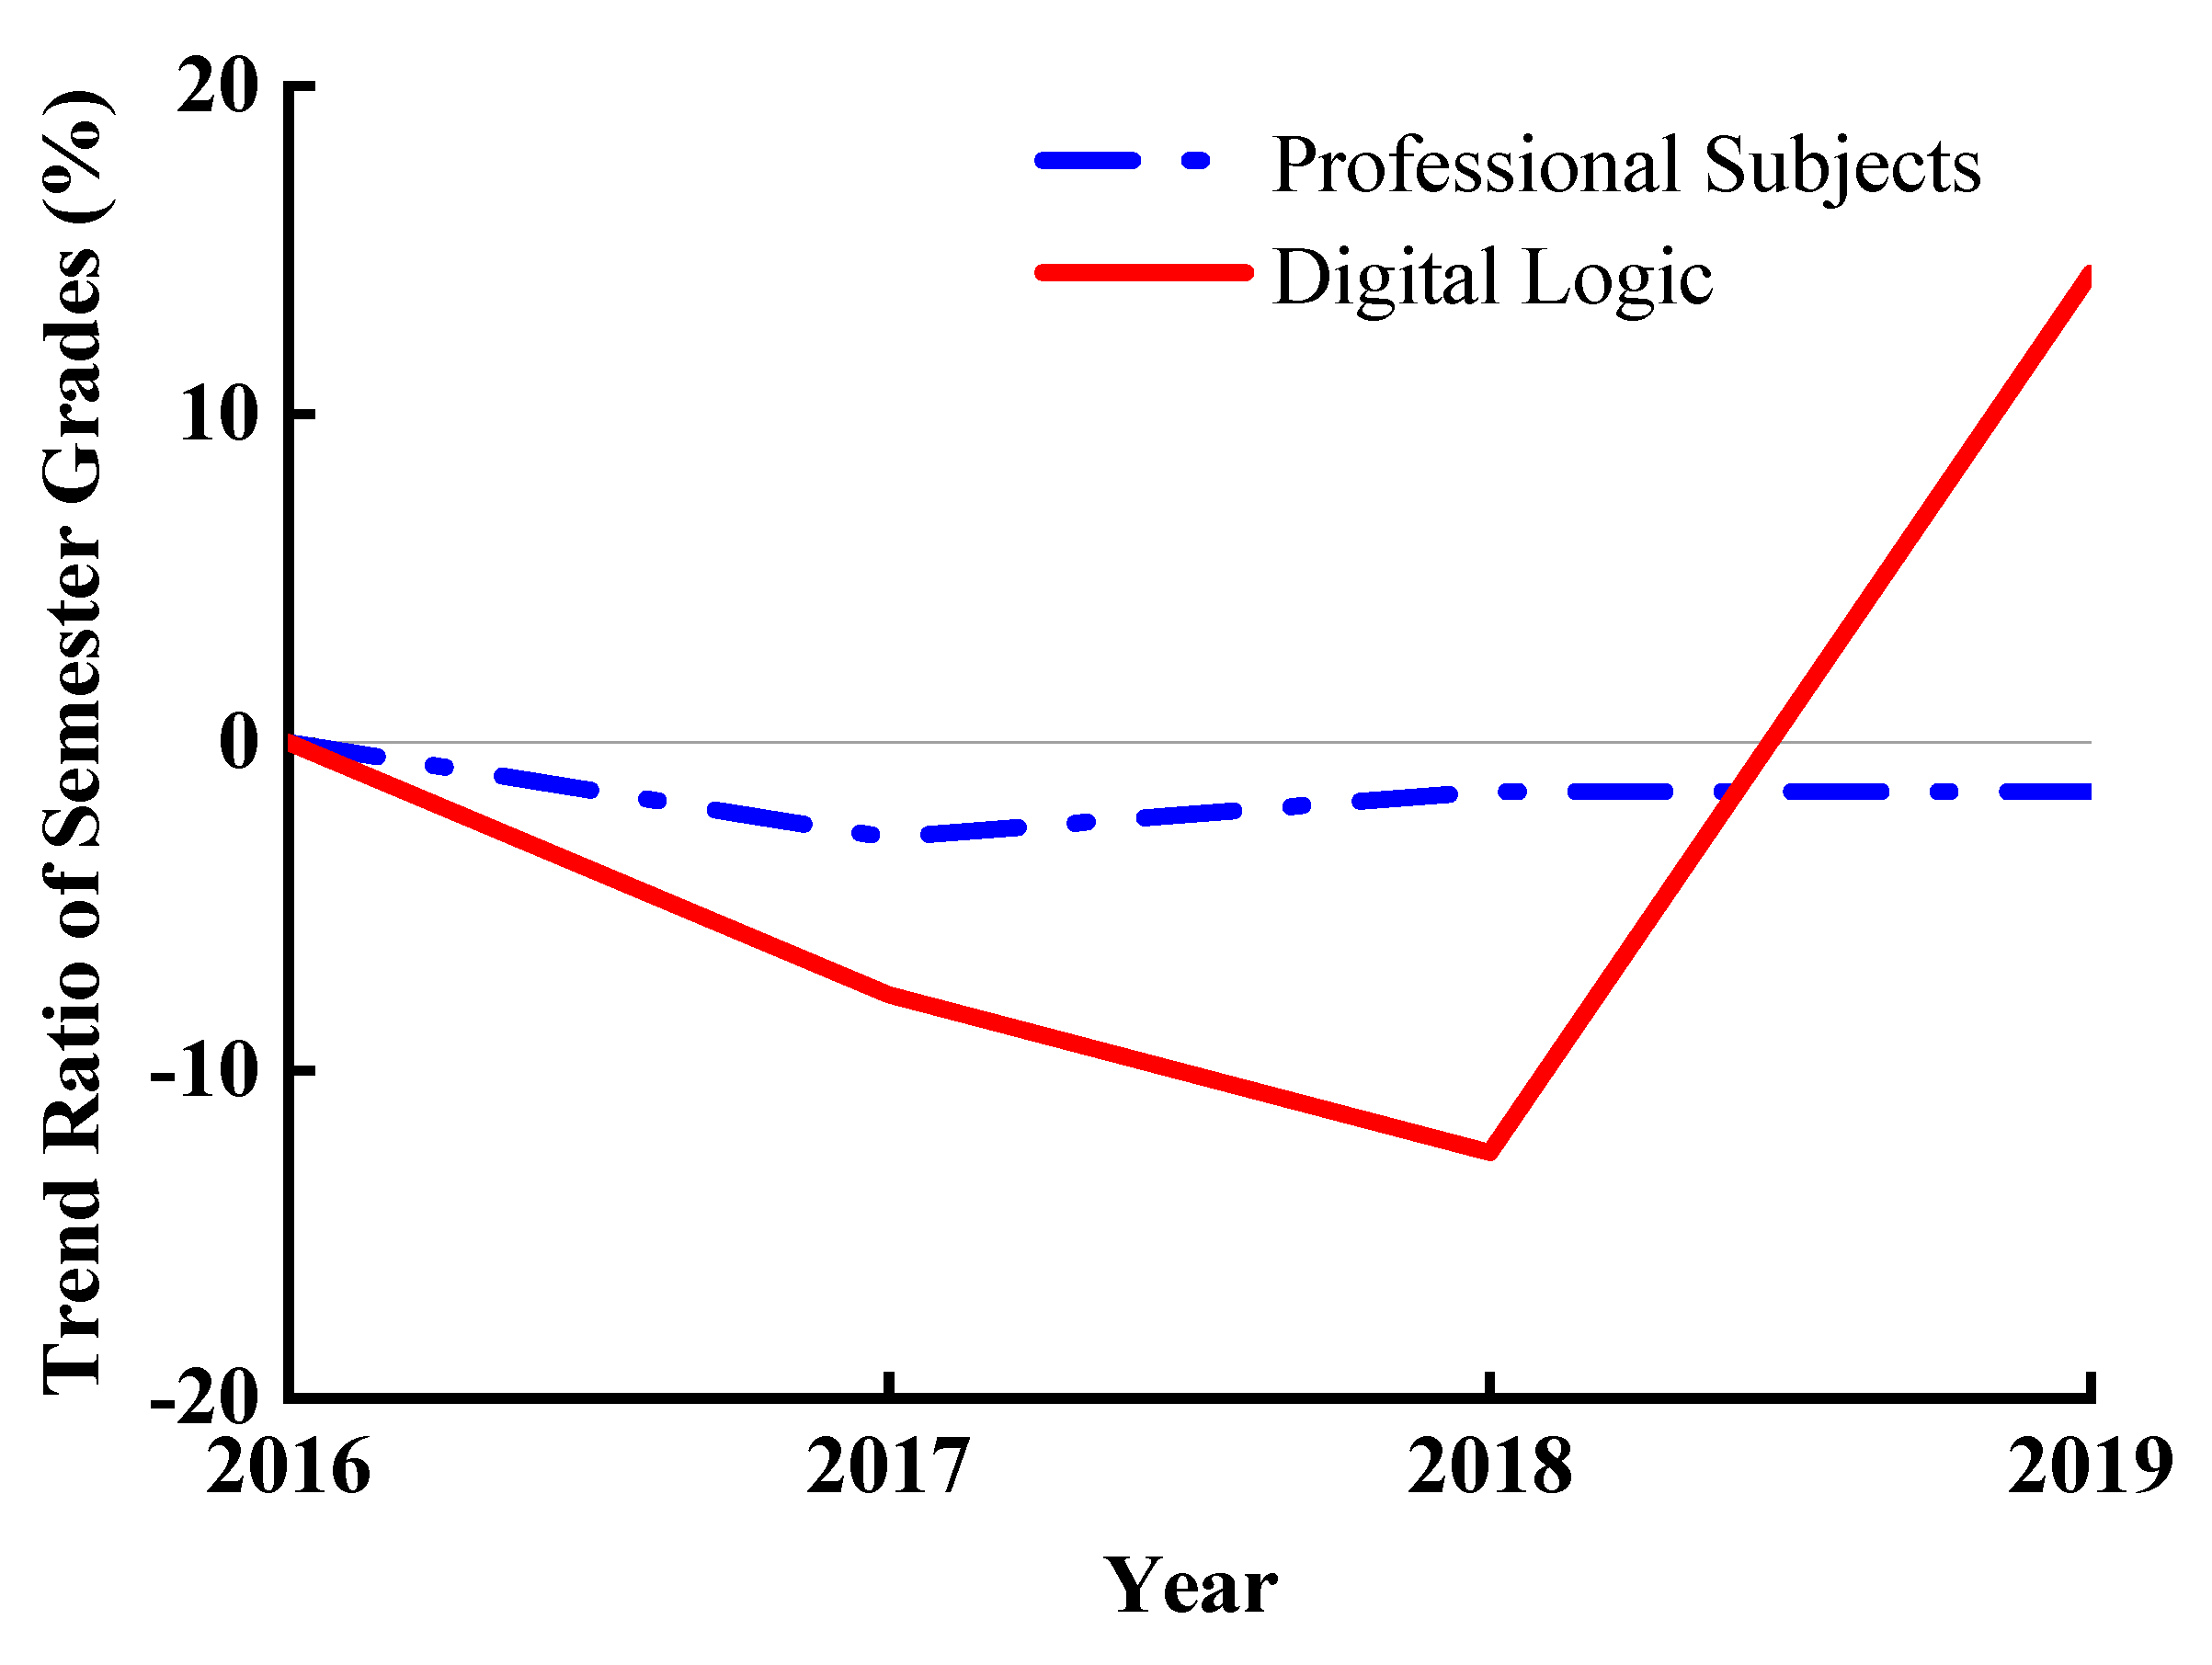
As shown in
Figure 8, it can be found that from 2016 to 2019, the semester average grades of professional subjects (C programming, Calculus, Electronic Circuit, Circuit I) showed a downward trend, which the trend ratio can see is all negative. From 2016 to 2018, DL semester grades also showed a downward trend. Therefore, according to the assumption of parallel trends, in 2019, DL semester grades should also continue to decline. However, after applying the FC model, the average semester grades of professional subjects continued to decline, with a trend ratio of −1.51%. Still, the DL semester grades did not decrease but rose instead, and the trend ratio changed from negative to positive to +14.3%.
4.4. Influence of Different Admission Channels and Categories in FC Model
The main enrollment methods of the four-year technological colleges (technological universities) and two-year junior colleges include admission by selection, joint registration and distribution, separate admission and skill-based screening (because the number of students is too small, the latter two channels will be added), and the scores of unified entrance test occupy different proportions in these channels. The students, in TVEJUEE, is divided into twenty categories, and the exam subjects of each category, in addition to common subjects (Chinese language, English and Mathematics), include two different professional subjects. Students with TVEJUEE scores of the Electrical category or Information-Electronic category can be admitted to the electrical engineering department of the junior college via admission by selection, joint registration and distribution and separate admission (skill-based screening). In addition, the proportion of students enrolled by the above three channels is the same every year. Below is the analysis based on the student admission channels and TVEJUEE categories:
Comparison was made according to different enrollment channels, and the pre-test and post-test scores were listed in
Table 4. In terms of admission methods, the order of the pre-test scores from high to low was registration and distribution, admission by selection and separate admission. Meanwhile, the highest post-test scores came from students who were admitted by separate admission, followed by registration and distribution and lastly admission by selection. It could be found that the FC model yielded the best performance when applied to students who were separate admission. This is a very interesting discovery and worthy of further discussion.
When the different categories of the students’ unified entrance test were compared as shown in
Table 5, it was noted that the pre-test scores were in the Information-Electronic category > Electrical category, and this was true for the post-test scores. This might be attributed to the fact that the DL course was an examination subject in the TVEJUEE of the Information-Electronic category. As a result, students studying the Information-Electronic category (major in Electronics, Information Science) performed better than those studying in the Electrical category (major in Electrical, Automatic control).
5. Discussion
5.1. Pre-Class Preparation
The students who take the DL course are all freshmen and did not know each other. Hence, the phenomena such as group members “doing their own things”, “not participating in group interaction at all”, or “not reading or returning the message after an appointment was made to study together after class” occurred in some groups. During the class interaction, the group members, due to unfamiliarity with cooperative learning, interacted coldly with each other without a sense of teamwork, which resulted in low group semester grades. Schools intending to implement the FC model are therefore recommended to build more collaborative learning workshops as a learning resource so that freshmen can acquire relevant skills.
Tucker [
8] suggested that “the difference is not how to make the lecture videos, but how to integrate them into the entire method to make it different from the traditional method.” However, if an unsuitable lecture video is chosen, students’ learning motivation may be reduced due to language barriers and a lack of prior knowledge. Personal computers, digitizer tablets, opaque projectors, and microphones have become easy to access nowadays, so teachers are suggested to record teaching videos by themselves, which will be helpful to the implementation of the FC model. When recording lecture videos, due to poor sound reception, try not to use the microphone attached to the headset. Instead, it is recommended to use a separate microphone, such as Blue Yeti, Snowball. There are many screen recording and video editing software on the market, and this research uses Camtasia Packages.
5.2. Course Implementation
Under the TC model, many students copy the homework of other students and a small number of students miss the homework, all of which made it difficult for teachers to judge students’ learning status. When a course is conducted based on the FC model, the traditional homework is changed into in-class activities, through which students think, discuss, collaborate, and address on stage during the class. They can get immediate feedback on whether the answers are correct and whether the explanation is clear. In addition to improving the students’ expressive skills, the FC model also allows teachers to grasp the learning status of students. In this study, students’ class performance and test scores clearly showed that the FC model could improve their learning performance and participation. In the TC model, students rarely provide any feedback despite the teachers’ hard work in instructing them and seeking feedbacks; in the small-size FC model, however, teachers can perceive problems earlier and get immediate feedbacks thanks to frequent in-class interactions.
Poorly motivated students may not watch the video before class. To avoid this problem, some teachers checked students’ notes and asked each student to attend the class with a question [
8] while others asked students to retrieve pre-lesson worksheets and creating pre-lesson mind maps [
28]. Some teachers conducted self-regulation activities such as goal setting and reflection for students [
29], and some made read interactive e-books [
30]). We also found some teachers asking students to take a test before class [
31] or applying gamification elements to design teaching activities, such as badges, progress trackers, levels, leaderboards, etc. [
24]. In this study, some students were found to be poorly motivated, and when they were selected to address the question on stage, they often gave up without providing any solution. The possible reason is that these students did not watch the video before class because the video preview report was not included in scoring, in which case, an after-class interview was conducted. After the interview, it was learned that the possible reasons included “the inter-class is supposed to be a break, why should I watch the video”, “I didn’t have time because I was playing on-line games” or “I didn’t watch it because of laziness.” After interviewing these students, a self-learning report was designed so that students with self-learning difficulties could meet with students from the same group to watch videos and recorded them in the report which was included in the scoring. After such interviews, some students watched the video before the class, and some watched the video before the exam. Yet, there were still a few students who did not complete the pre-class activities. More efforts from future studies are expected in motivating students to participate in pre-class activities more.
When students answer incorrectly in the class activities and the opportunity to provide an answer is open, it is often taken by the same students, which led to higher scores in specific groups. Therefore, separate rules are required; for instance, students of a group can answer once in each round, and if the correct answer does not appear, students of this group are allowed to provide an answer again.
Finally, the problems discovered by interaction in the class and the after-class interviews required the teacher to respond to them flexibly and quickly. However, when the number of students in a class exceeds 32, more groups will be formed, which means that the interaction pace becomes slower and it is harder to warm up the class atmosphere. Therefore, there is always a dramatic increase in burden and challenge for teachers who intend to apply the FC model in classes with a large number of students.
6. Conclusions
This paper presented the experiment on and observation results from students in the first-year DL course of the electrical engineering department in a Taiwan junior college under the TC model and FC model. By comparing the data collected during the four years for statistical analysis, it was found that the students’ post-test results under the FC model were significantly better than those under the TC model. After comparing the DL semester scores between 2016 and 2019 with the average semester scores of professional subjects, positive effects from the FC model were also found on students’ learning performance. The results are encouraging as students’ learning performance was greatly improved, both in the average grade and in the passing rate after applying the FC model. This will benefit all students taking DL courses for this school after 2019. In addition, the research results can give teachers who want to improve the teaching scene an additional teaching method to choose. Furthermore, the curriculum design of this research can also be used as a reference for teachers who want to adopt the FC model in future course teaching.
7. Limitations and Future Research
First, all data are collected from a DL course in a junior college in southeastern Taiwan, so care must be taken when generalizing to other contexts. Secondly, all students are grouped according to the pre-test results, and each group will be assigned at least one student with a better level so that students with learning difficulties can discuss and imitate with them. However, because there is no appropriate evaluation instrument, the effect of cooperative learning on the FC model is unknown. Furthermore, when there are more students in a class, more groups will be formed. Assuming that the students in the class have no experience of cooperative learning in their previous learning experience, too many groups will cause poor classroom interaction, thereby affecting learning effectiveness. Therefore, the number of students taking courses should be limited. Finally, in terms of entrance channels, the post-test score of students was the highest from those admitted by separate admission, followed by registration and distribution, and finally admission by selection. The FC model displayed the best performance for students who were enrolled via separate admission channels. This is a fascinating discovery and is worthy of further exploration. In addition, past literature shows that students’ learning motivation, learning attitudes, and learning strategies may affect students’ learning results. The above research variables are not included in this research evaluation and will be discussed in further research.


