Article

Optimal Placement and Sizing of an Energy Storage System Using a Power Sensitivity Analysis in a Practical Stand-Alone Microgrid

1
School of Electrical & Electronic Engineering, Yonsei University, Seoul 03722, Korea
2
Department of Electrical and Control Engineering, Mokpo National University, Mokpo 58554, Korea
*
Authors to whom correspondence should be addressed.
Electronics 2021, 10(13), 1598; https://doi.org/10.3390/electronics10131598
Submission received: 27 May 2021 / Revised: 26 June 2021 / Accepted: 30 June 2021 / Published: 2 July 2021
(This article belongs to the Special Issue Energy Management Systems for Microgrids)

Abstract

:
The energy storage system (ESS) is developing into a very important element for the stable operation of power systems. An ESS is characterized by rapid control, free charging, and discharging. Because of these characteristics, it can efficiently respond to sudden events that affect the power system and can help to resolve congested lines caused by the excessive output of distributed generators (DGs) using renewable energy sources (RESs). In order to efficiently and economically install new ESSs in the power system, the following two factors must be considered: the optimal installation placements and the optimal sizes of ESSs. Many studies have explored the optimal installation placement and the sizing of ESSs by using analytical approaches, mathematical optimization techniques, and artificial intelligence. This paper presents an algorithm to determine the optimal installation placement and sizing of ESSs for a virtual multi-slack (VMS) operation based on a power sensitivity analysis in a stand-alone microgrid. Through the proposed algorithm, the optimal installation placement can be determined by a simple calculation based on a power sensitivity matrix, and the optimal sizing of the ESS for the determined placement can be obtained at the same time. The algorithm is verified through several case studies in a stand-alone microgrid based on practical power system data. The results of the proposed algorithm show that installing ESSs in the optimal placement could improve the voltage stability of the microgrid. The sizing of the newly installed ESS was also properly determined.

1. Introduction

Worldwide, the penetration of distributed generators (DGs) using renewable energy sources (RESs) is increasing to address the air pollution caused by conventional fossil fuel generators and the high maintenance costs of aging generators. Although there are some issues, RESs are generally considered to be eco-friendly and are also considered as sustainable energy sources that do not emit pollutants during the power generation process and avoid power generation costs by mainly using wind and solar power. However, wind and solar power have intermittent and uncontrollable characteristics, and it is difficult to predict the output of DGs that use them. The disadvantages of DGs using RESs pose new challenges to the stable and reliable operation of a power system in which renewable energy sources are connected with high penetration. It is very difficult to accurately predict the output of RESs such as wind and solar power, and fluctuations in the output of DGs using RESs are very large. As a result, generation–load imbalances occur frequently in the power system. This uncertainty in DGs using RESs degrades the stability of the power system and causes recurrent frequency fluctuations [1,2,3]. As the penetration of DGs increases, excessive power generation, as well as a lack of power generation, causes other stability problems. The excessive power generation of DGs can increase the voltages of specific buses and cause congestion in the distribution network, which may cause stability problems in the entire power system.
Recently, the energy storage system (ESS) has been adopted as an important power system element to increase the power quality and to shift the peak-load of a microgrid with high penetration of DGs [4]. The two most important characteristics of an ESS that facilitate an improved stability of the power system are fast charging/discharging and the ability to store surplus energy. The first contribution of the ESS to the stability of the power system is the smoothing of the power output by the use of its fast charging/discharging features. The power output of DGs, especially those using wind and solar power, fluctuates very quickly and drastically. An ESS can mitigate fluctuations in the power output of DGs by rapidly charging if the generated power unexpectedly increases and by discharging if it decreases. The second contribution of an ESS in the power system is the time shifting of the power output which is made possible due to its ability to store surplus energy. As large-scale DGs are connected to power systems, their excessive power output creates new problems, such as a reverse power flow or an increased congestion of lines. When the power output of DGs is excessive and causes a significant mismatch between the power generation and the load, the ESS can store part of the excessive power output in DGs. Then, the stored energy in the ESS can be used when the power generated by the DG is insufficient or when the load increases; as a result, flexibility within the power system can be ensured by using an ESS.
In order to efficiently and economically connect an ESS to a power system, it is essential to optimize the installation placement and sizing of the ESS [5,6,7,8]. Technology for ESSs has been introduced to increase the stability and economy of power systems resulting from the increased penetration of DGs to microgrids. Therefore, the optimal localization of the ESS is a very important issue to ensure the power system stability of the microgrid. In addition, since an excessively sized ESS has high installation costs, many studies on the optimal sizing of ESSs are also being conducted. Because there are so many types of power systems, including microgrids, and the purpose of installing an ESS varies, there is no unique solution for the optimal placement and sizing of newly installed ESSs. As a result, numerous solutions have been studied using the analytical approach, mathematical optimization, and artificial intelligence.
In the analytical approach, the optimal placement and sizing of ESSs are determined according to a set of formulae and algorithms [9,10,11,12]. During the optimization process, pre-defined system constraints are repeatedly examined, and the set of parameters containing the optimal placement and sizing of the ESS corresponding to the objective function are chosen as the optimal solution. In [9,10], to determine the optimal sizing the ESS, the cost-benefit analysis and the algorithm including net power purchase and storage loss were used, respectively. In [11,12], to determine the optimal placement and sizing of the ESS, the algorithm for minimizing the annual electricity cost considering spilled wind energy and a voltage sensitivity analysis were used, respectively. The mathematical optimization approach uses numerical methods to determine the optimal solution [13,14,15,16,17]. As the complexity and dimensions of the power system increase, the computation and the time to find the optimal solution may increase exponentially. To determine the optimal sizing of the ESS, a mixed integer programming (MIP) used by the authors in [13] and a mixed integer linear programming (MILP) used by the authors in [14] were proposed. To determine the optimal placement and sizing of an ESS, a multi-stage operational algorithm used by the authors in [15], a three-stage MILP used by the authors in [16], and a stochastic MILP used by the authors in [17] were proposed. Finally, unlike the analytical approach and the mathematical optimization approach, artificial intelligence does not require complex algorithms and computational processes to determine the optimal placement and sizing of the ESS [18,19,20]. Using a genetic algorithm, which is a kind of artificial intelligence, the optimal placement of the ESS in the study in [18] and the optimal placement and sizing of the ESS in the studies in [19,20,21] were found. Particle swarm optimization and an artificial neural network were adopted in the studies in [22,23,24] to find the optimal solution. While the solutions obtained with artificial intelligence are not guaranteed to provide the mathematically optimal solution, they can obtain largely satisfactory solutions without a complex analysis and mathematical models [25,26]. In addition, a lot of training is required in advance for reliable artificial intelligence optimization results, and for this, large-scale power data collection is essential.
This paper proposes an algorithm for the optimal placements and sizes of newly installed ESSs based on a power sensitivity analysis as an analytical approach. The proposed algorithm analyzed all the candidate placements within the microgrid where the ESS is to be newly installed. The objective function defined in this paper prioritizes the optimal placement, and the optimal size of the corresponding newly installed ESS can be directly determined from the placement of the installation according to the priority. New ESSs were installed in the candidate placements where the value of the defined objective function was the maximum value, and the sizing of each new ESS was determined based on the power sensitivity analysis. In this paper, the ESS was operated by a virtual multi-slack droop control. As a result, the newly installed ESS can significantly contribute to the response to all load changes in the microgrid while ensuring that the voltage stability of the ESS-connected bus as well as the overall buses was increased. The appropriate sizing of the ESS can also be obtained rather than oversizing it.

2. VMS Power Flow Analysis Based on Power Sensitivity Analysis

There is only one actual slack bus in the conventional electric power system, and its purpose is to balance the real and reactive power. It is also called the reference bus of the system. The phase angle and voltage magnitude of this actual slack bus are 0° and 1, which are the only fixed elements in the entire power system. The existing power flow analysis is based on these values, and in this paper, newly installed ESSs operated as virtual multi-slacks (VMSs) in the microgrid. The VMS operation with newly installed ESSs can participate in maintaining the power generation–load balance by supporting the actual slack bus. The real and reactive power imbalance in a microgrid with a total of n buses is given by:
Δ P i = P i j = 1 n | V i | | V j | | Y i j | cos ( θ i j δ i + δ j )
Δ Q i = Q i + j = 1 n | V i | | V j | | Y i j | sin ( θ i j δ i + δ j )
where P i and Q i are the scheduled real and reactive power at the i-th bus, respectively [27,28]. The other terms on the right-hand side of (1) and (2) are the actual values of the real and reactive power at the i-th bus, respectively. | V i | and δ i are the magnitude and phase angle of voltage at the i-th bus, respectively. | Y i j | and θ i j are the magnitude and phase angle of the nodal admittance matrix between the i-th bus and the j-th bus, respectively. By applying the Taylor expansion to (1) and (2) while ignoring the higher-order terms, the linearization equation for the proposed VMS power flow can be expressed as follows:
[ Δ δ E S S Δ δ M G Δ V E S S Δ V M G ] = [ J P δ J P V J Q δ J Q V ] 1 [ Δ P E S S Δ P M G Δ Q E S S Δ Q M G ] ,   K = [ K 11 K 12 K 21 K 22 ] = [ J P δ J P V J Q δ J Q V ] 1
where [ Δ δ | Δ V ] t and [ Δ P | Δ Q ] t are the mismatch vectors of voltage and power, respectively [24]. The subscripts ESS and MG denote the values of the ESSs including buses and the values of the other buses excluding the buses included in the ESSs, respectively. It is noted that the value for the actual slack bus is not considered. The inverse matrix of the Jacobian matrix, J ( 2 ( n 1 ) × 2 ( n 1 ) ), is defined as K. Then, the mismatch vectors of voltage and power at the virtual slack buses can be calculated as:
[ Δ δ E S S Δ δ M G Δ V E S S Δ V M G ] = K E S S [ Δ P E S S Δ Q E S S ] + K M G [ Δ P E S S Δ P M G Δ Q E S S Δ Q M G ]
where K E S S ( 2 ( m 1 ) × 2 ( m 1 ) ) and K M G ( 2 ( m 1 ) × 2 ( n 1 ) ) are reassigned matrices for m virtual slacks (the buses to which the newly installed ESSs are connected) and the entire power system with total n buses as part of K in (3). K E S S includes only the elements of the newly installed ESS-connected buses in K, as shown in (5). On the other hand, all the elements of all buses in K M G , excluding only the actual slack bus, are covered in (6). Due to the fact that the actual slack bus was not considered in (3), K E S S and K M G were also composed from the element of the 2nd bus.
K E S S = [ K 11 ( 2 , 2 ) K 11 ( 2 , m ) K 11 ( m , 2 ) K 11 ( m , m ) | K 12 ( 2 , 2 ) K 12 ( 2 , m ) K 12 ( m , 2 ) K 12 ( m , m ) K 21 ( 2 , 2 ) K 21 ( 2 , m ) K 21 ( m , 2 ) K 21 ( m , m ) | K 22 ( 2 , 2 ) K 22 ( 2 , m ) K 22 ( m , 2 ) K 22 ( m , m ) ]
K M G = [ K 11 ( 2 , 2 ) K 11 ( 2 , n ) K 11 ( m , 2 ) K 11 ( m , n ) | K 12 ( 2 , 2 ) K 12 ( 2 , n ) K 12 ( m , 2 ) K 12 ( m , n ) K 21 ( 2 , 2 ) K 21 ( 2 , n ) K 21 ( m , 2 ) K 21 ( m , n ) | K 22 ( 2 , 2 ) K 22 ( 2 , n ) K 22 ( m , 2 ) K 22 ( m , n ) ]
From the general definition of the slack bus, the ideal voltage magnitudes, and the phase angles of the slack buses, including the virtual slack buses, are specified. Therefore, it is assumed that there are no mismatches in the voltage magnitude(s) or phase angle(s) of the bus to which the newly installed ESS(s) is (are) connected. As a result, the left-hand side in (4), which represents the mismatch vector of the voltage magnitude and the phase angle at the virtual slack buses, is zero, and (4) can be rearranged as follows:
[ Δ P E S S Δ Q E S S ] = [ K E S S ] 1 K M G [ Δ P E S S Δ P M G Δ Q E S S Δ Q M G ] = S E S S [ Δ P E S S Δ P M G Δ Q E S S Δ Q M G ]
where S E S S is the power sensitivity matrix between the newly installed ESS-connected buses and all other buses. Once the power sensitivity matrix is calculated, it is possible to determine the power responses of the ESSs, which are operated as virtual slacks, to the load changes in the microgrid through a simple calculation.

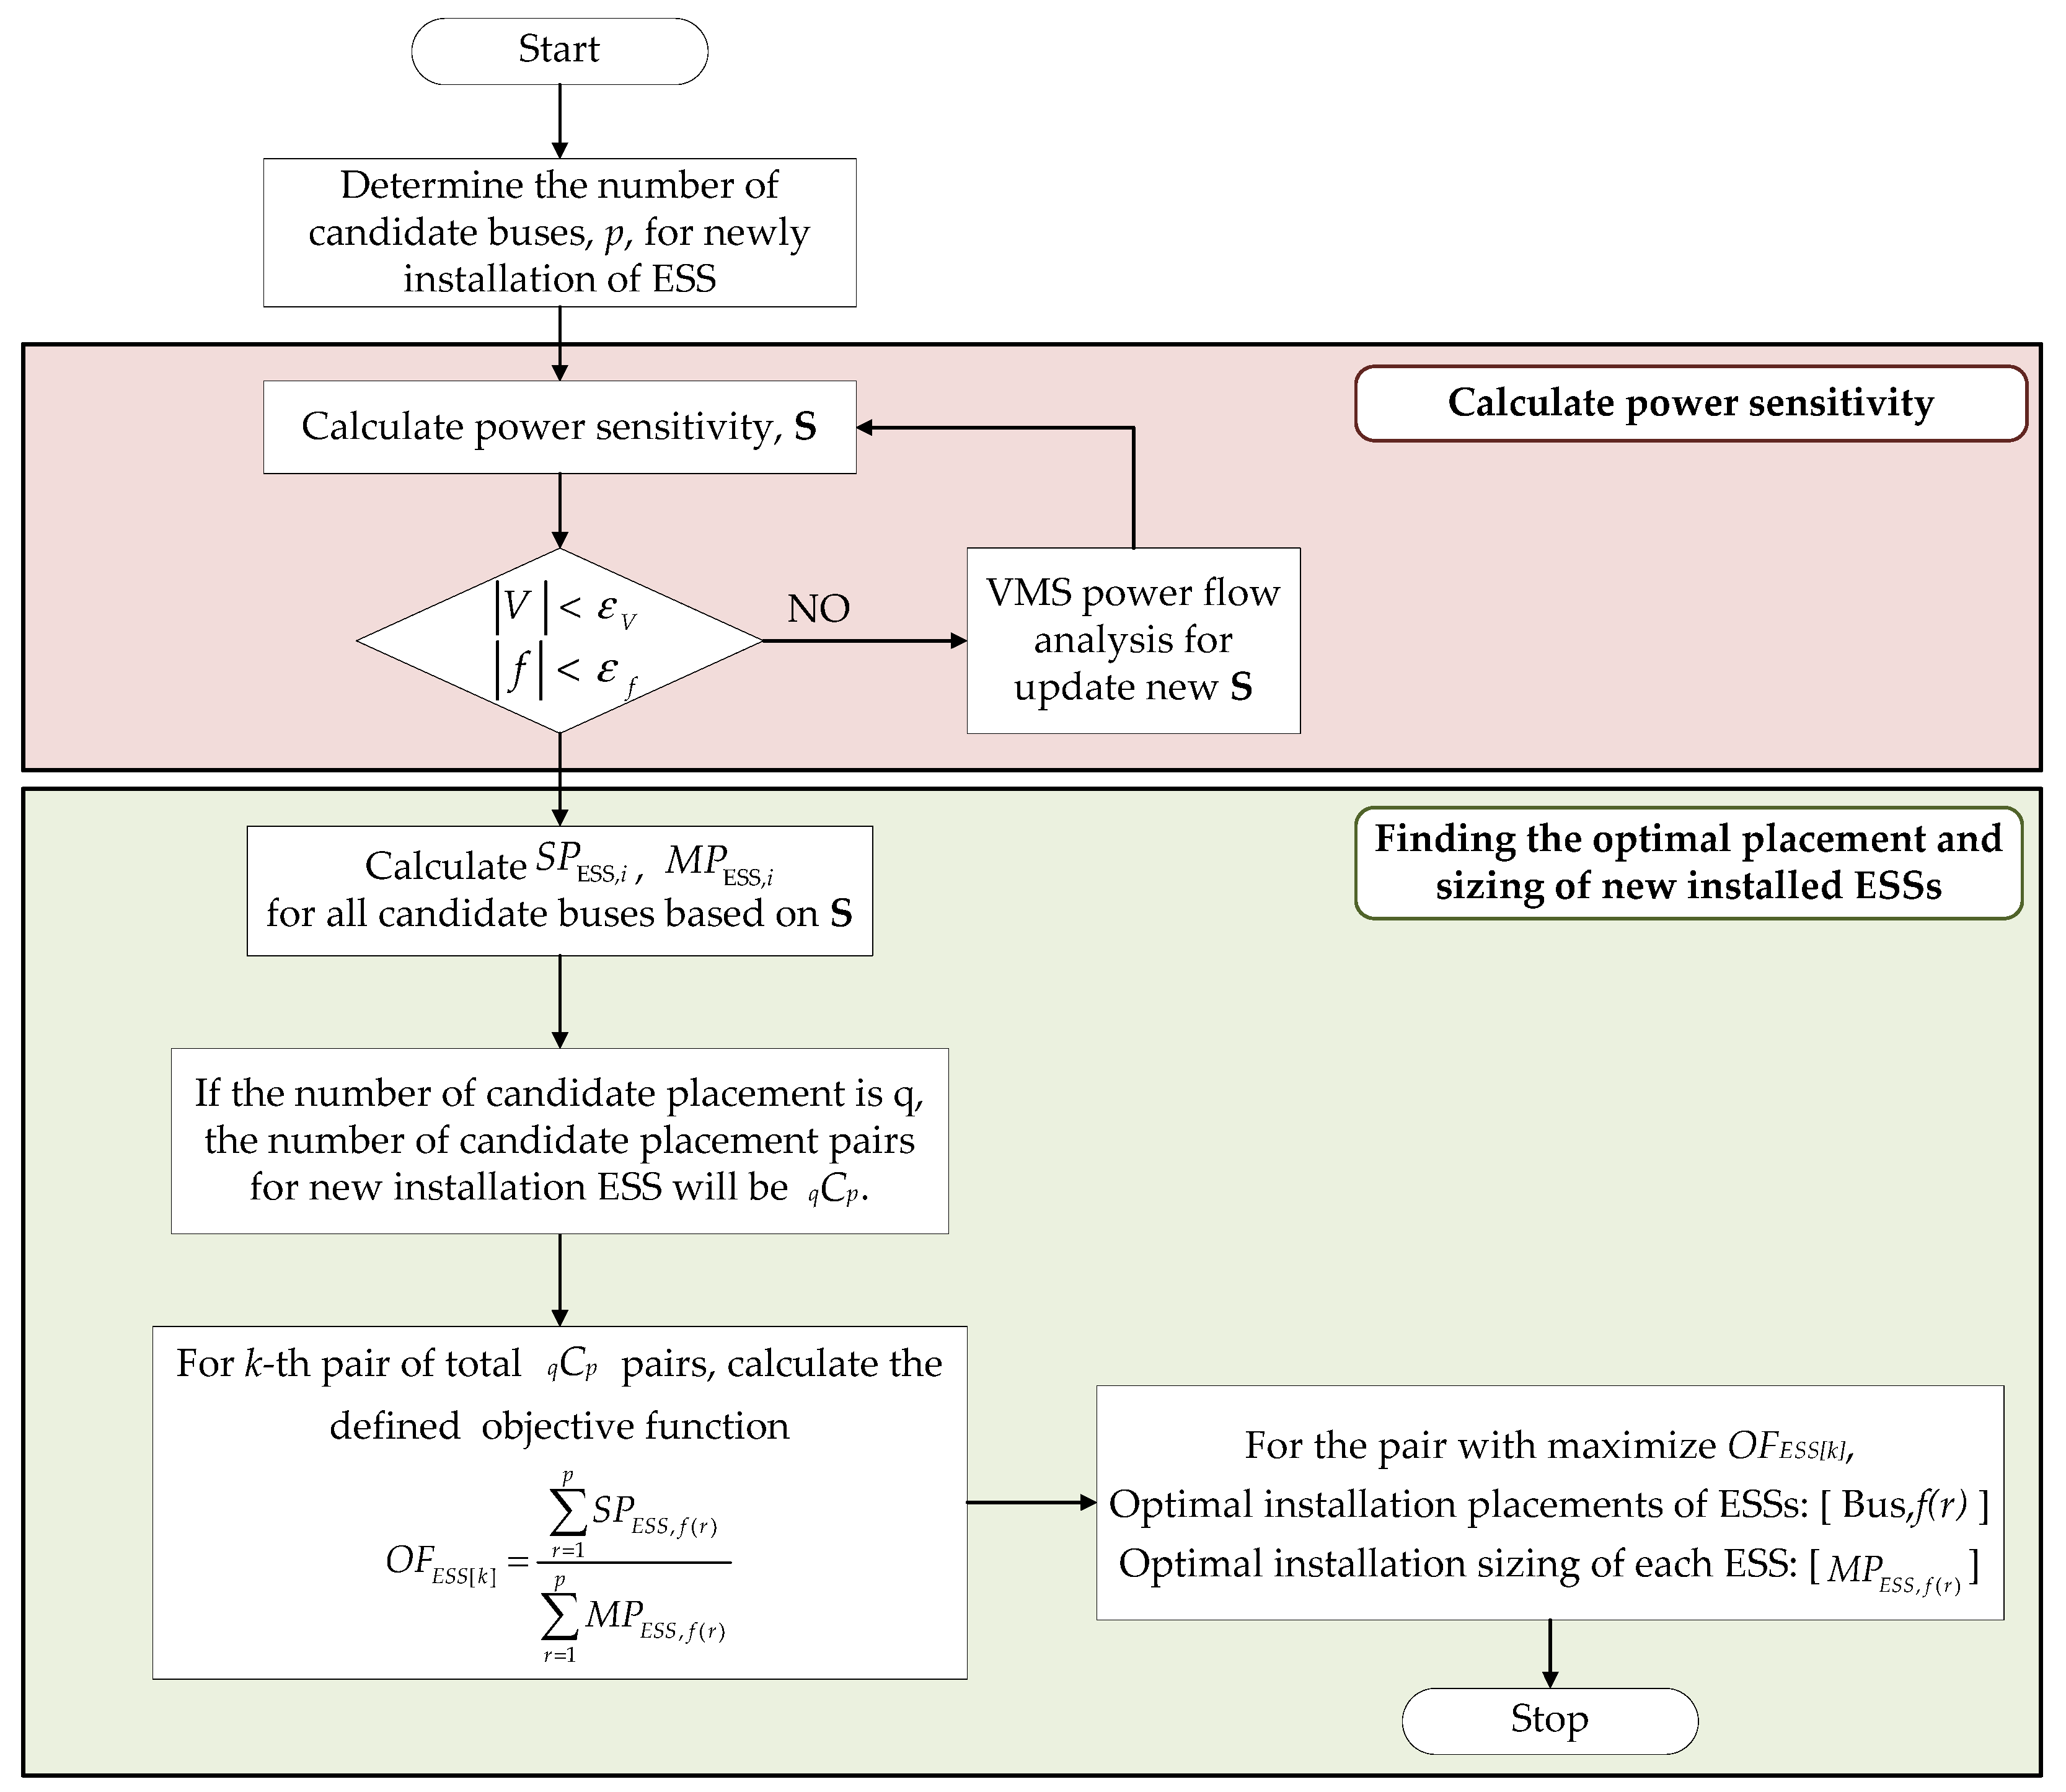
3. Proposed Algorithm for Optimal Placement and Sizing of ESS

Using the Jacobian matrix of the stand-alone microgrid, the power sensitivity between the new ESS installation candidate buses and all other buses can be calculated as shown in (7). Using the calculated power sensitivity matrix, the total power required for the newly installed ESS on the i-th bus to respond to all load changes can be calculated as follows:
L P E S S , ( i , j ) = S E S S , ( i , j ) Δ P j + 1 , L o a d + S E S S , ( i , n 1 + j ) Δ Q j + 1 , L o a d
where L P E S S , ( i , j ) is the real and reactive power changes of the (i + 1)-th bus connected to the ESS at all load changes in the microgrid. S E S S , ( i , j ) is the power sensitivity matrix between the (i + 1)-th bus connected to the ESS and other buses. Δ P i , L o a d and Δ Q i , L o a d are the real and reactive power changes of the i-th bus connected to a load. The required power for the newly installed ESS on the i-th bus to respond to changes in all loads in the microgrid is calculated as follows:
S P E S S , i = j = 1 n 1 L P E S S , ( i , j )
where S P E S S , i is the total real power contributed by the newly installed ESS on the i-th bus responding to all load changes in the microgrid. To respond properly to every load change, the required size of the ESS on the i-th bus is defined as follows:
M P E S S , i = max ( L P E S S , ( i , j ) ) | j = 1 n 1
In this paper, the objective function for the optimal installation placement of the ESS is shown in (11), and the optimal installation placement is determined by priorities according to an analysis of all candidate placements for the new installation of the ESSs.
O F E S S [ k ] = r = 1 p S P E S S , f ( r ) r = 1 p M P E S S , f ( r )
where O F E S S [ k ] is the objective function for the k-th pair of the newly installed ESSs, and f ( r ) is the number of the bus in the k-th pair. When the number of newly installed ESSs is p and the number of candidate placements is q , there are q C p pairs for the placements of ESSs. Each pair of the candidates contained p buses and the values of O F E S S [ k ] for all the pairs were calculated and compared to each other. The larger value of O F E S S [ k ] is the higher priority for the new ESSs installation placements. The optimal placements of the ESSs would be determined by the buses of the pair with the maximum O F E S S [ k ] value, and the size of each ESS would be equal to M P E S S , f ( r ) with r from 1 to p. The installation costs of ESSs would be determined by the total sum of these M P E S S [ k ] values.
In this paper, the objective function for the optimal installation placement of an ESS is shown in (11), and the optimal installation placement was determined by priorities according to an analysis of all candidate placements for the new installation of ESSs. The objective function value can be increased by a higher S P E S S , i value and a lower M P E S S , i value. This means that even low installation costs are influential in all load changes. Figure 1 shows the proposed algorithm for the optimal placement and sizing of newly installed ESSs based on the power sensitivity analysis.
The comparisons between the proposed algorithm and other algorithms in [9,10,11,12,13,14,15,16,17,18,19,20] are summarized in Table 1. An important feature of the proposed algorithm was that it determines the optimal placement and sizing of ESS at the same time. In particular, other algorithms using analytical and mathematical optimizations selected the optimal placement of ESS in the first step and selected the optimal sizing in the second step based on the selected placement. Due to this multi-step problem solving, many calculations were necessary to obtain solutions. On the other hand, in the proposed algorithm, solutions for the placement and sizing of ESS could be obtained at the same time, and as a result, the amount of computation could be significantly reduced compared to other algorithms. The amount of computation of an algorithm using artificial intelligence was determined according to the parameters and termination criterion of the algorithm, and it varied widely. However, in order to increase the reliability of the results, a large amount of accumulated big data was essential, and to use it, sufficient pre-training was required. However, in the proposed algorithm, the optimal placement and sizing of the ESS could be determined according to the objective function defined by the minimum operation using only the power system data of the microgrid without a training process.

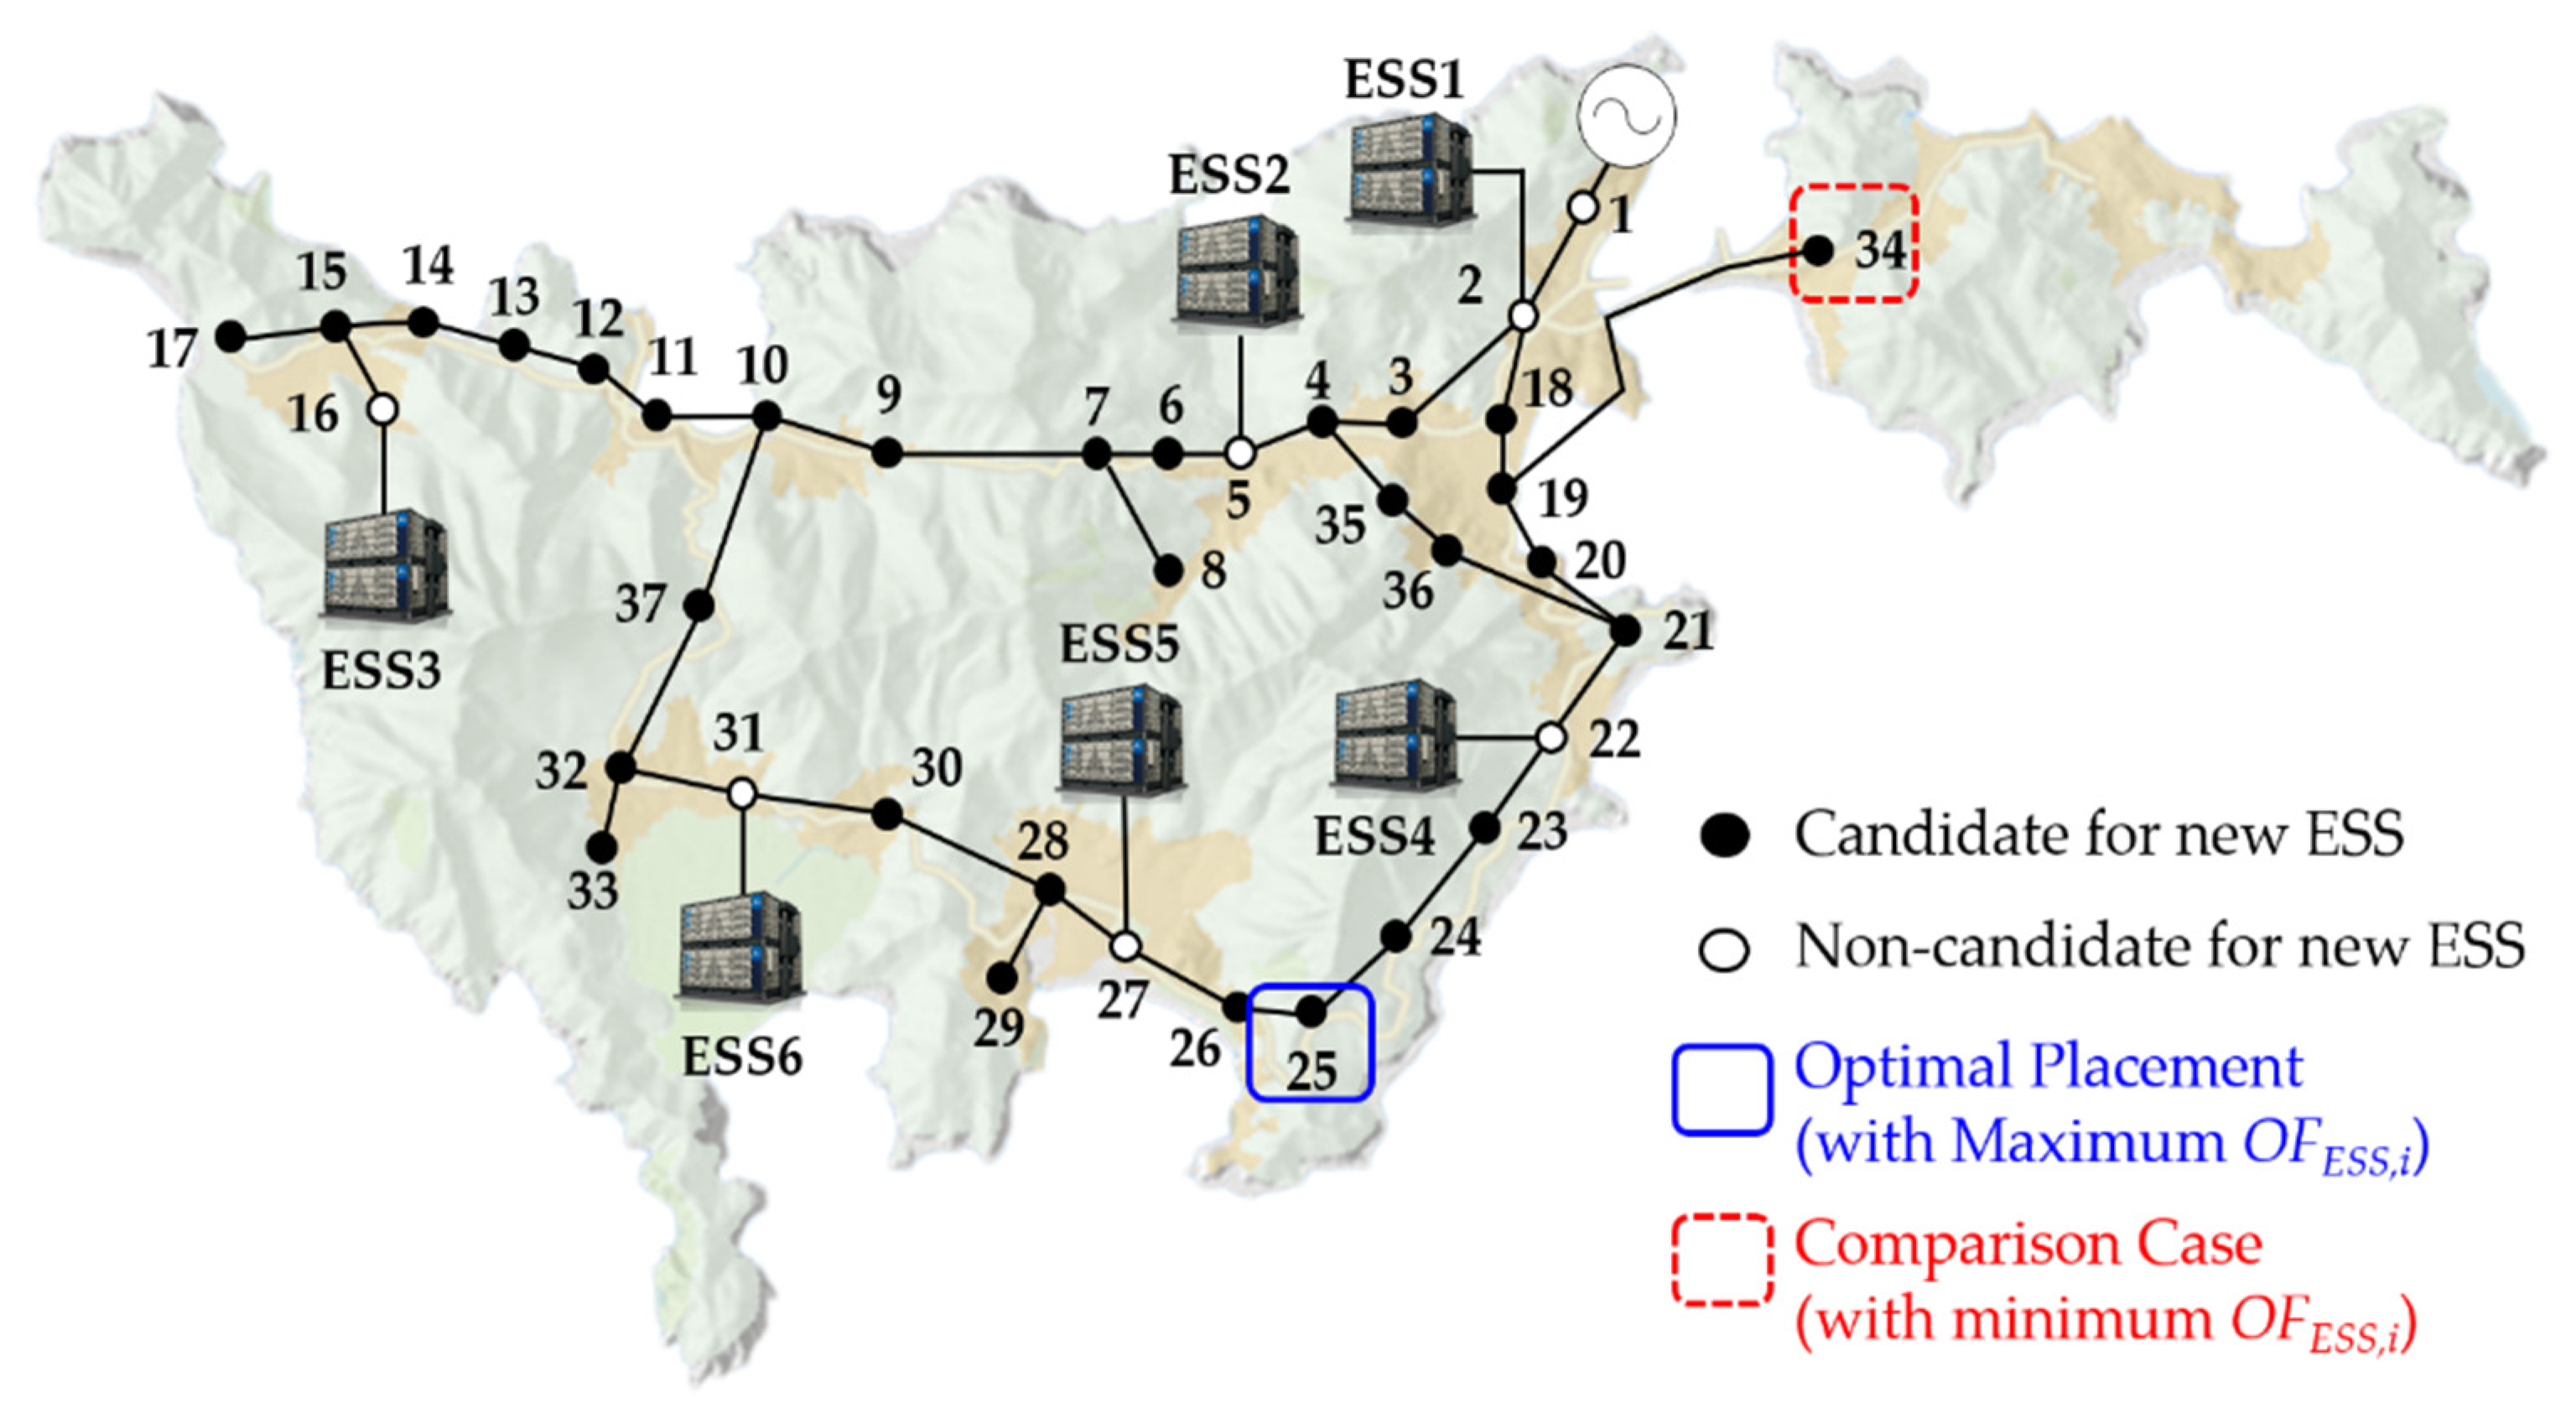
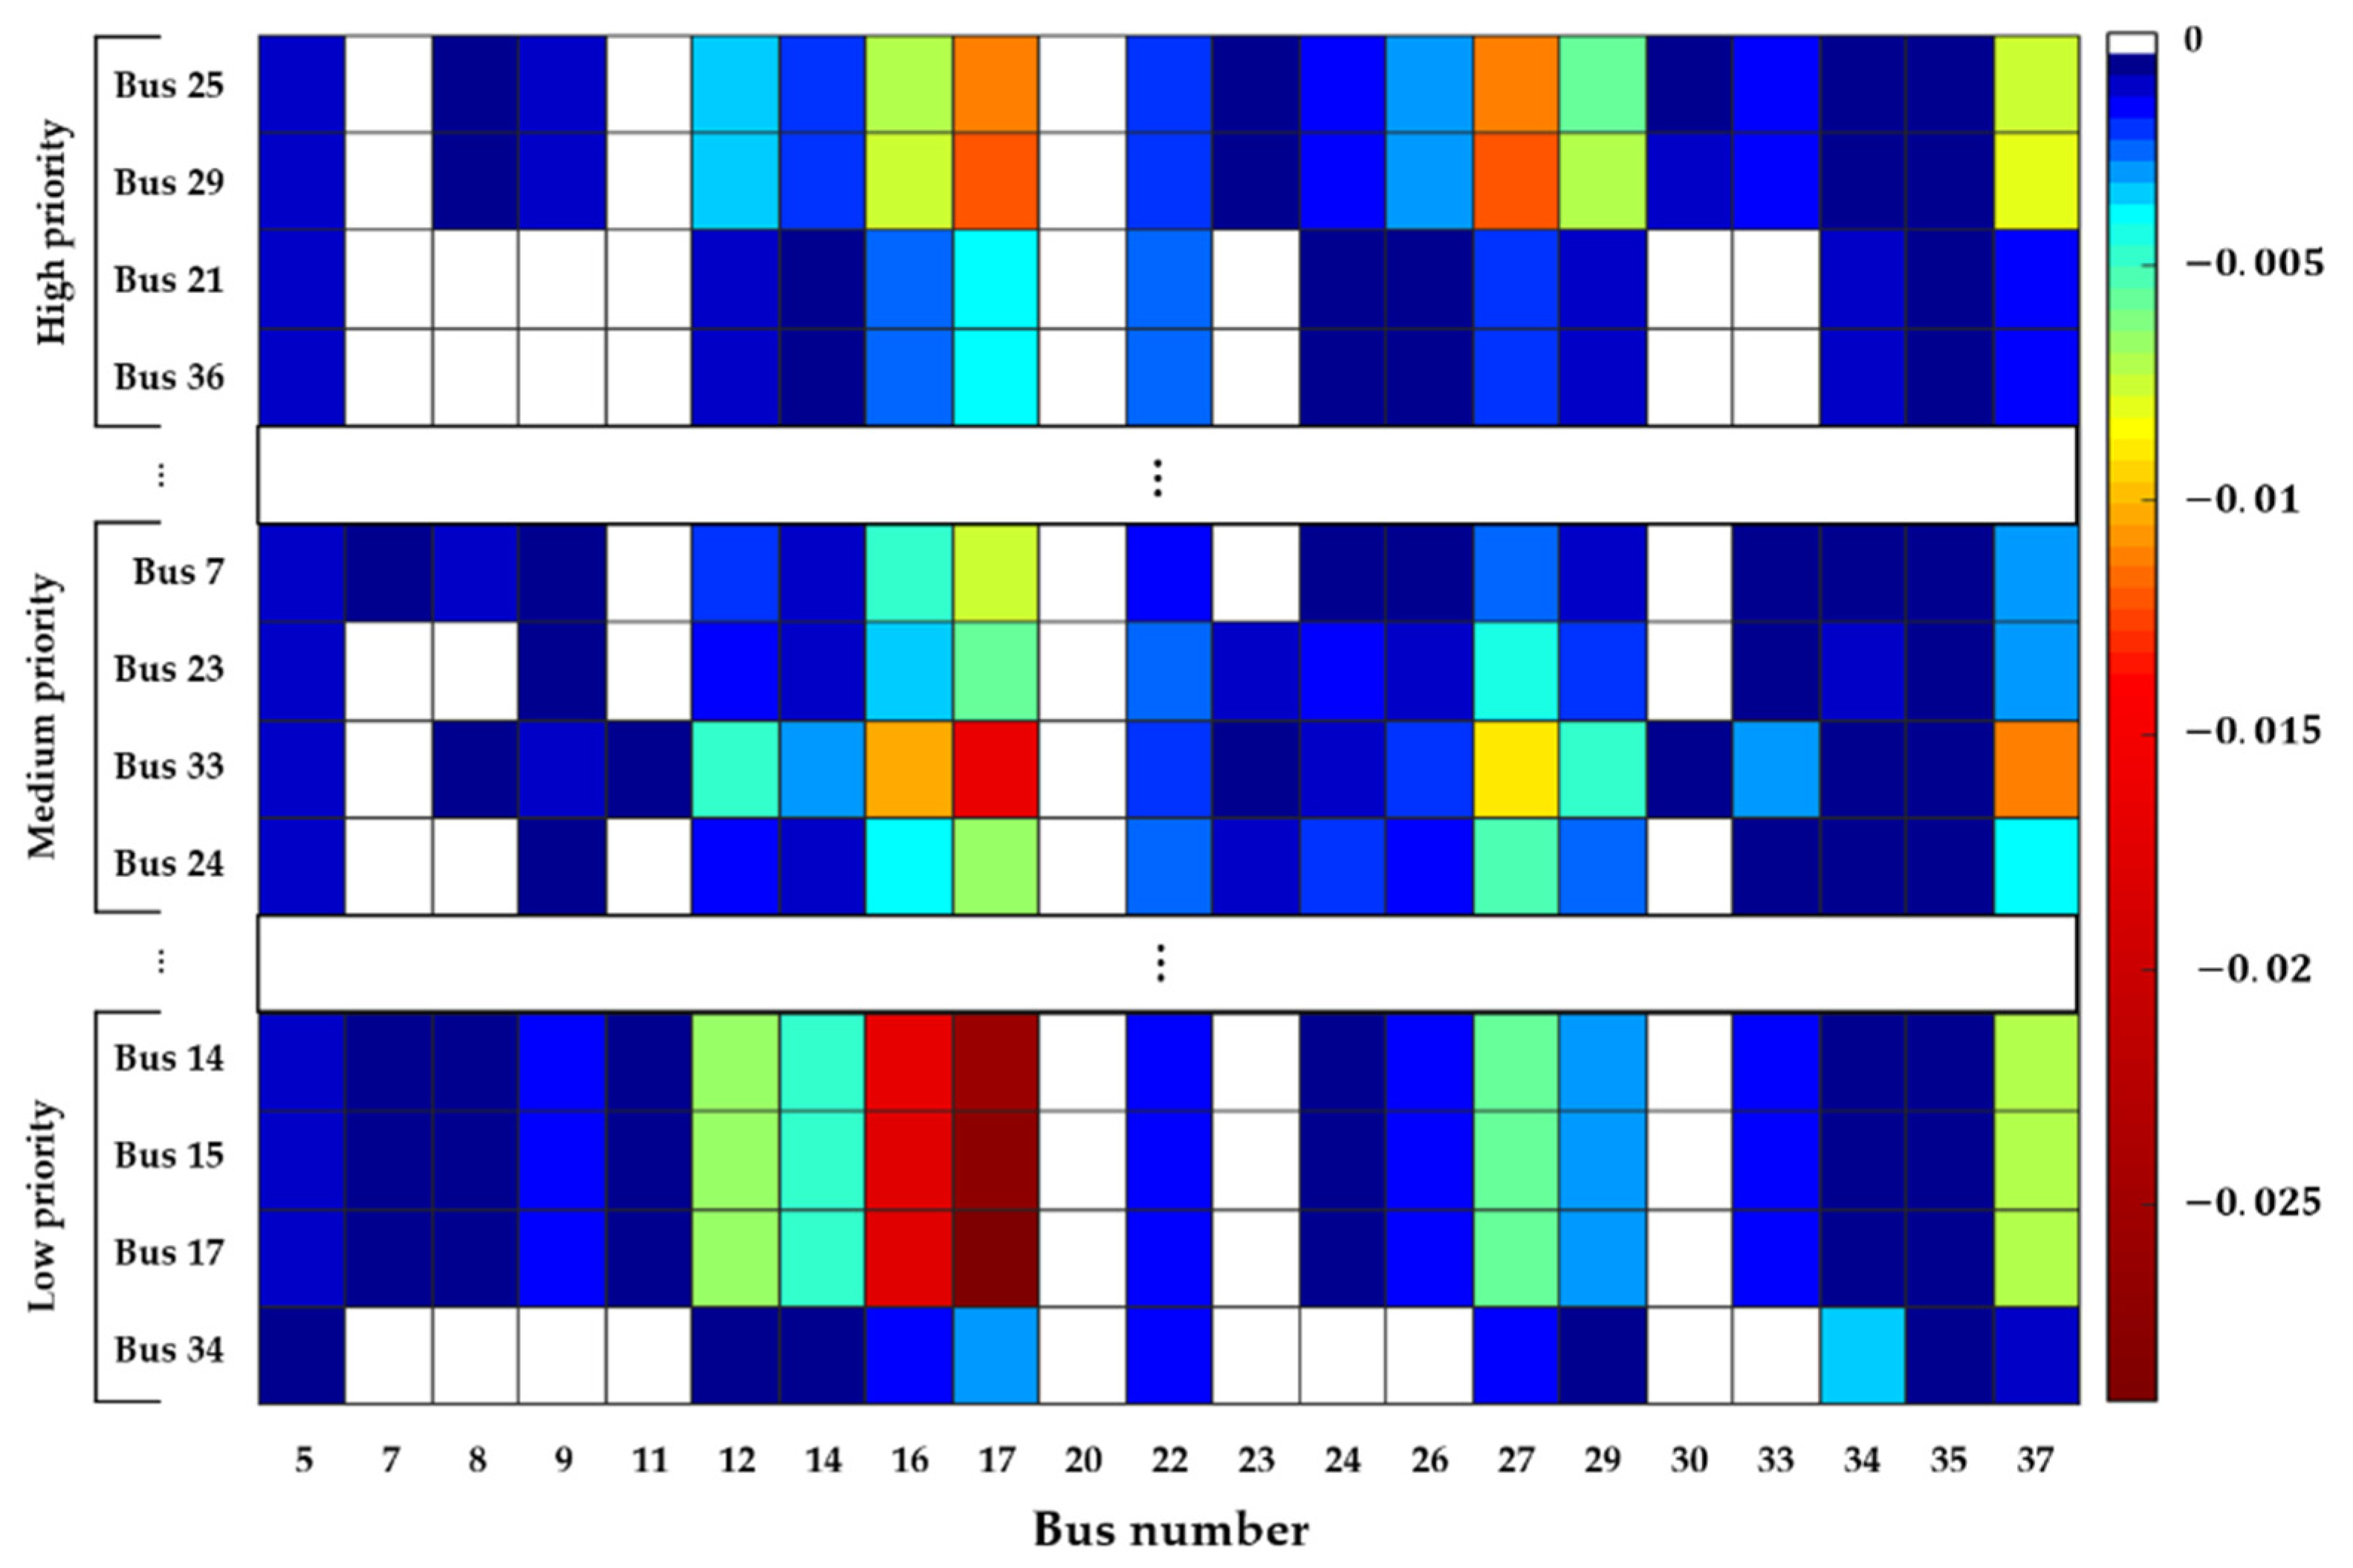
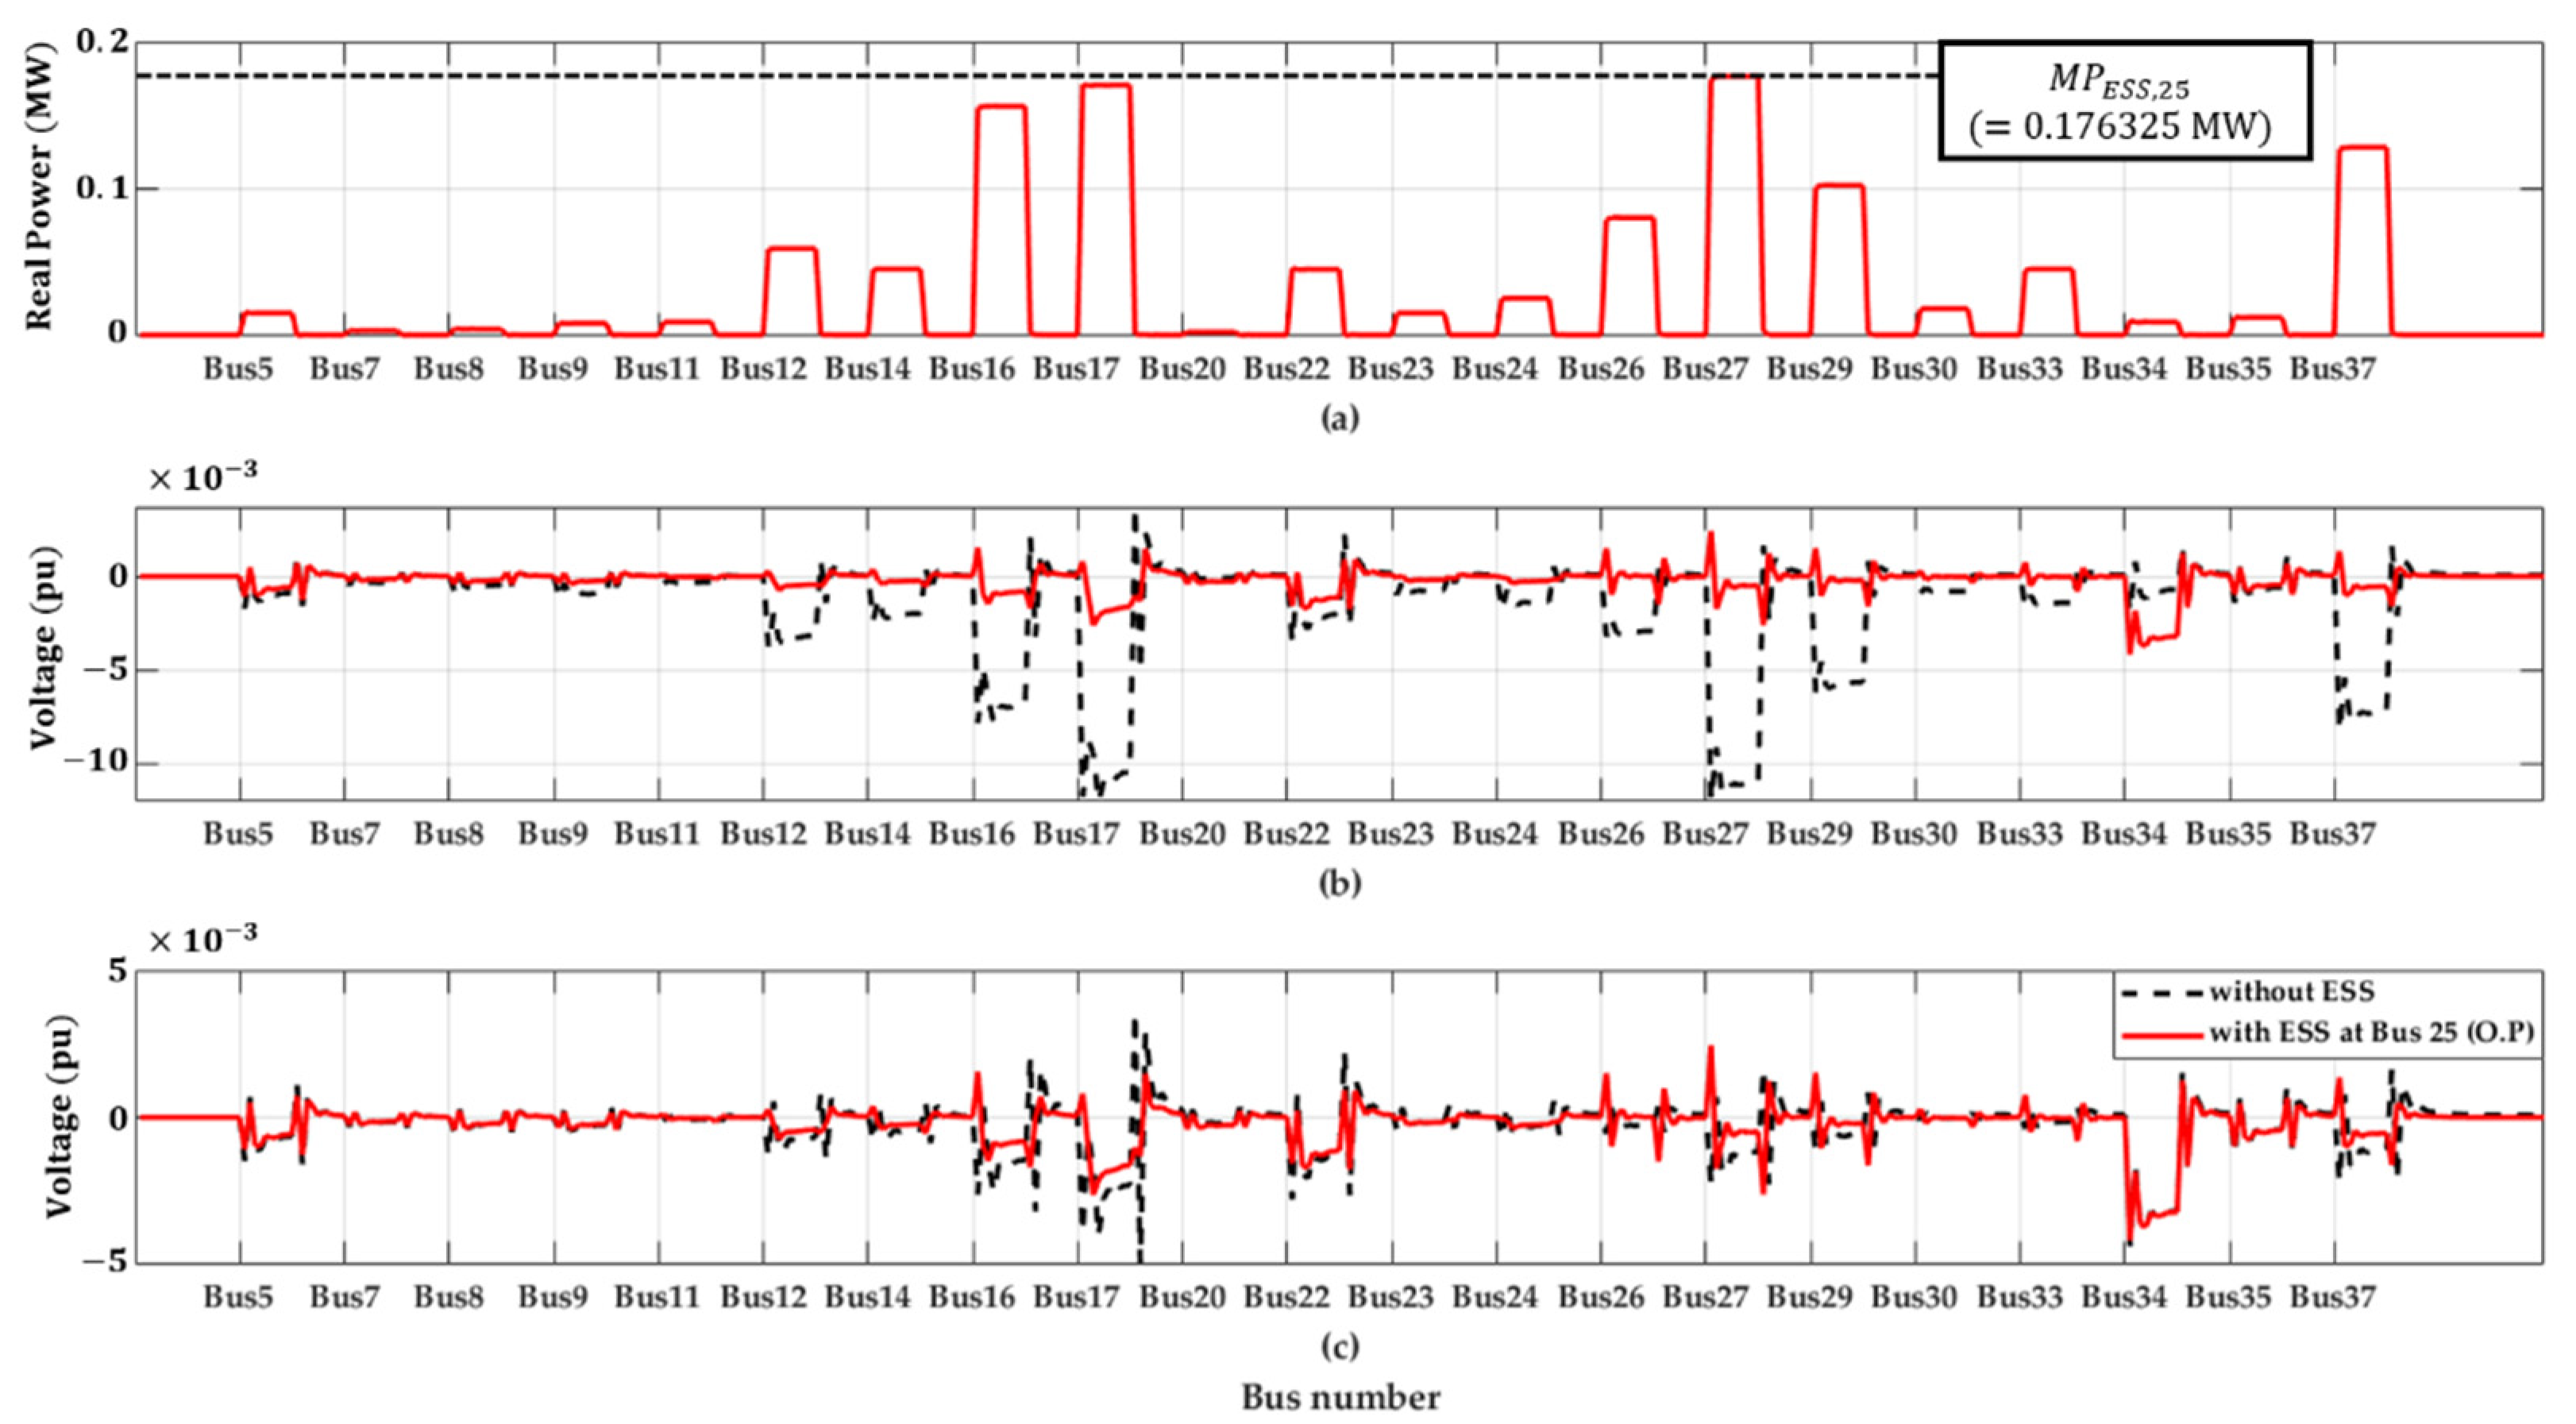
4. Simulation Results

The proposed algorithm for the optimal placement and sizing of newly installed ESSs was applied to the stand-alone microgrid in South Korea. This stand-alone microgrid reflects actual power system data; the one-line diagram of the microgrid is shown in Figure 2. It consists of 37 buses in total, and bus one is an actual slack bus with a diesel generator involved in the stability of the microgrid. The stand-alone microgrid has a total of 21 loads, and each load demand is shown in Table 2. Six ESSs were already connected to the stand-alone microgrid at the following placements: bus 2, bus 5, bus 16, bus 22, bus 27, and bus 31. The actual slack bus and six buses with existing ESSs were excluded as candidates for the newly installed ESSs. Thus, there were 30 candidate buses in the stand-alone microgrid. More detailed information on the stand-alone microgrid is given in Table A1 and Table A2 in Appendix A.
The optimal installation placement and sizing of the newly installed ESS were determined by the proposed algorithm. The voltage stability at the ESS installation placement was verified when all the loads connected to the microgrid were increased sequentially and then decreased. The voltage stability with the optimal sizing of the ESS was compared to the case in which the ESS was installed at the optimal placement and the case in which the ESS was installed at the lower priority placement according to the defined objective function.
In order to install a new ESS in the microgrid, the priorities for all candidate placements were summarized, as shown in Table 3, using Figure 1 and (11). A total of 30 candidate buses were prioritized by the defined objective function, with the exception of the actual slack bus and six existing ESS-connected buses. According to the defined objective function, bus 25 was the best placement to install a new ESS, and the optimal sizing of the new ESS was 0.176325 MW. On the other hand, bus 34 was the most inadequate installation placement for a new ESS. There was no significant difference in the S P E S S , i values between the two placements; the greatest difference between bus 25 and bus 34 was that the M P E S S , i value of bus 34 was markedly larger than that of bus 25. This means that there was no significant difference in the response to changes in all loads, but an excessively high-capacity ESS is required in order for bus 34 to function in the VMS operation for only one specific load change.
Figure 3 shows the voltage stability heatmap for the relationship between all candidate placements for a newly installed ESS and all load changes in Table 2. This heatmap clearly and graphically shows the voltage stability between all candidate placements for the new ESS and all loads according to the power sensitivity matrix in (7). The dark-red and white colors represent the highest sensitivity and zero sensitivity, respectively.
The loads on buses 16 and 17 are the largest in the microgrid, as shown in Table 2. As a result, as shown in Figure 3, the changes in the load on buses 16 and 17 have a significant effect on the voltage stability of all the buses. Buses 25 and 29 have a significant impact on the load changes of almost all the buses and have relatively small M P E S S , i values, as shown in Table 3. On the other hand, buses 14, 15, and 17 have very high power sensitivities to changes in loads connected to buses 16 and 17, resulting in high M P E S S , i values. Bus 34, which was given the lowest priority by the proposed algorithm, has the weakest power sensitivity compared to other buses, and it has the largest M P E S S , i value.
The new ESS was installed at the optimal placement (bus 25) with the optimal sizing, and the VMS operation was verified by sequential changes in all loads. Figure 4a shows the real power response of the newly installed ESS, and Figure 4b,c show the bus voltage deviations at the installation placement (bus 25) and at bus 34. The ESS connected to bus 25 can respond to all load changes within M P E S S , i obtained by (10), and as a result, the voltage stability of bus 25 is improved. Due to the influence of the ESS connected to bus 25, the voltage deviation of bus 34 is also slightly reduced compared to when the ESS is not connected.
Figure 5 shows the result of the VMS operation according to all load changes when the new ESS is connected to bus 34. The sizing of the ESS was limited to 0.176325 MW, which is the optimal sizing at bus 25, as shown in Figure 5a. In contrast to the data in Figure 4, when the load on buses 17 and 34 changes, the maintenance of normal voltage cannot be guaranteed. This is because the M P E S S , i on bus 34 is 0.451432 MW, as shown in Table 3, but the connected ESS only has a value of 0.176325 MW. As a result, as shown in Figure 5c, it is impossible to maintain the voltage due to the insufficient capacity of the ESS for a stable VMS operation response to load changes on buses 17 and 34. Furthermore, Figure 5b shows that connecting the ESS at bus 34 cannot contribute to improving the voltage stability of bus 25.
Figure 6a is a heatmap that shows an increasing voltage with an improved voltage stability during the VMS operation when the newly installed ESS had the optimal placement (Bus 25) and sizing. In other words, the heatmap shows how much the voltages of each bus, which decreased due to load changes, are improved when a new ESS is installed at the optimal placement (Bus 25) compared to the case without the ESS (Figure 3). This heatmap shows that the voltage increased with changes in all loads on the buses, including the bus connected to the newly installed ESS (Bus 25). The dark-red color indicates that the voltage of the case without the ESS increased, and the voltage stability was highly increased; the white color indicates that the voltage stability was similar to that of the case without the ESS. Thus, by adding a new ESS in the optimal placement (Bus 25), the voltage stability improved not only for the bus in which the new ESS is installed, but also for the other buses in the microgrid. As a comparison case, Figure 6b is a heatmap that shows an increasing voltage with a slightly improved voltage stability when the ESS was connected to bus 34. Compared with Figure 3 and Figure 6a, the voltage stability of all buses improved relative to the case without the ESS, but the degree of improvement was less than that in the case where the new ESS was installed in the optimal placement (Bus 25).
Finally, to evaluate the improvement of the voltage stability of the microgrid during the VMS operation according to the ESS installation and its placement, the root mean square error (RMSE) voltage was calculated as follows:
Δ V R M S E = l m ( Δ V B ( l ) , L ( m ) ) 2
where Δ V B ( i ) , L ( j ) is the voltage variation in the l-th bus at the m-th load. Table 4 shows that the RMSE value in the case without the ESS was the largest, and the RMSE value in the case with the ESS connected to bus 25 (optimal placement) was the minimum. This means that when the ESS is installed in the optimal placement, the variation in all buses in the microgrid is the smallest for all load changes.

5. Conclusions

With the increasing penetration of distributed generators (DGs) using renewable energy sources (RESs) to microgrids, the technology of energy storage systems (ESSs) is playing an important role in improving the stability and operational efficiency of the power system. Since the installation cost of the ESS is directly related to the installation sizing, the optimal placement for the stability of the power system and the optimal sizing are very important issues. This paper proposed a novel algorithm for the optimal placement and sizing of a newly installed ESS based on a power sensitivity analysis. The algorithm was validated on a practical stand-alone microgrid in South Korea.
The proposed algorithm uses a power sensitivity analysis to assess all candidate placements in the microgrid for the newly installed ESS and determines priorities for optimal installation placement according to the defined objective function. As a result, when the ESS is installed in a high-priority placement, it significantly contributes to the response to load changes in microgrids with low capacity. An analytic approach based on a power sensitivity analysis enables the quick selection of the optimal placement of the newly installed ESS and obtains the optimal sizing of the ESS according to the designated installation placement. Due to the simultaneous determination of the optimal placement and sizing of the ESS, the proposed algorithm could provide a solution with a small amount of computation compared to other algorithms and it did not require a pre-training process using big data. This paper compared the results of power system operations for all load changes when the newly installed ESS was at the optimal placement and at a lower priority placement based on the defined objective function. Installing the ESS in the optimal placement ensured the voltage stability of the bus connected to the ESS and also the rest of the buses. The voltage stability was confirmed by the response of the newly installed ESS to sequential changes in all loads, and as a result, the appropriateness of the optimal sizing of the ESS according to the optimal placement was verified. By new ESSs in the optimal placement, the root mean square error (RMSE) of voltage was reduced from 0.0753 without ESSs to 0.0505.

Author Contributions

This research was conducted with the collaboration of all authors. D.K. and K.Y. wrote the paper; S.H.L. and J.-W.P. supervised the paper. All authors have read and agreed to the published version of the manuscript.

Funding

This work was supported in part by the National Research Foundation of Korea (NRF) (Grant number: 2020R1A3B2079407), the Ministry of Science and ICT (MSIT), Korea, and in part by the Korea Institute of Energy Technology Evaluation and Planning (KETEP) grant funded by the Korean government (MOTIE) (Grant number: 20192010107050).

Conflicts of Interest

The authors declare no conflict of interest.

Appendix A

Table A1. Bus data of the stand-alone microgrid.
Bus
No.
Bus
Type
VoltageLoadGeneration
Mag.
[pu]
Angle
[rad]
P
[MW]
Q
[MVAR]
P
[MW]
Q
[MVAR]
1S10.000000.5760.057
2PQ0.996−0.957000.4000.040
3PQ0.9960.9680000
4PQ0.9931.0320000
5PQ0.9921.0490.09280.00930.0500.005
6PQ0.9921.0640000
7PQ0.9861.1660.02240.002200
8PQ0.9861.1780.03200.003200
9PQ0.9771.3580.03840.003800
10PQ0.9691.5260000
11PQ0.9681.5360.00960.001000
12PQ0.9671.5440.09600.009600
13PQ0.9671.5400000
14PQ0.9671.5360.06080.006100
15PQ0.9681.5250000
16PQ0.9751.3310.21440.02140.6000.060
17PQ0.9651.5780.32320.032300
18PQ0.9960.9610000
19PQ0.9941.0090000
20PQ0.9941.0100.02240.002200
21PQ0.9911.0870000
22PQ0.9901.1000.15200.01520.2000.020
23PQ0.9821.2620.02880.002900
24PQ0.9801.3180.04160.004200
25VS0.9631.669000changedChanged
26PQ0.9621.6940.04160.004200
27PQ0.9611.7210.16000.01600.0500.005
28PQ0.9611.7230000
29PQ0.9601.7430.08420.008400
30PQ0.9611.7200.01280.001300
31PQ0.9611.718000.0500.005
32PQ0.9601.7250000
33PQ0.9591.7460.02880.002900
34VS0.9921.0540.10180.0102changedchanged
35PQ0.9921.0460.06880.006900
36PQ0.9911.0820000
37PQ0.9601.7240.14400.014400
Table A2. Line data of the stand-alone microgrid.
From BusTo BusR [pu]X [pu]From BusTo BusR [pu]X [pu]
120.00922.788128290.94420.4787
430.4060.205830310.170.0862
13140.4910.248931324.72122.3934
14150.4910.248932332.83271.436
17150.6610.335119200.01890.0096
15161.88850.957420212.26621.1488
540.18880.095722210.15110.0766
650.18880.095722232.4551.2446
671.28420.65124230.94420.4787
972.83271.43624256.98733.5422
781.51080.765926250.50040.2537
1092.83271.43627260.65150.3303
10110.4910.24892180.02510.0284
12110.4910.248919341.88850.9574
12130.4910.24893540.18880.0957
230.02510.028436350.6610.3351
19180.75540.382921360.09440.0479
27280.15110.076637104.72122.3934
28300.35880.181932370.18880.0957

References

  1. Barik, A.; Das, D.; Latif, A.; Hussain, S.; Ustun, T. Optimal voltage–Frequency regulation in distributed sustainable energy-based hybrid microgrids with integrated resource planning. Energies 2021, 14, 2735. [Google Scholar] [CrossRef]
  2. Banerjee, B.; Islam, S.M. Reliability based optimum location of distributed generation. Int. J. Electr. Power Energy Syst. 2011, 33, 1470–1478. [Google Scholar] [CrossRef]
  3. Awad, A.S.A.; El-Fouly, T.H.M.; Salama, M.M.A. Optimal distributed generation allocation and load shedding for improving distribution system reliability. Electr. Power Comp. Syst. 2014, 42, 576–584. [Google Scholar] [CrossRef]
  4. Ammar, M.; Joós, G. A Short-term energy storage system for voltage quality improvement in distributed wind power. IEEE Trans. Energy Convers. 2014, 29, 997–10070. [Google Scholar] [CrossRef]
  5. Xie, H.; Teng, X.; Xu, Y.; Wang, Y. Optimal energy storage sizing for networked microgrids considering reliability and resilience. IEEE Access 2019, 7, 86336–86348. [Google Scholar] [CrossRef]
  6. Awad, A.S.A.; El-Fouly, T.H.M.; Salama, M.M.A. Optimal ESS allocation for benefit maximization in distribution networks. IEEE Trans. Smart Grid 2017, 8, 1668–1678. [Google Scholar] [CrossRef]
  7. Yang, H.; Choi, S.G. Deterministic system analysis to guarantee worst case performance for optimal ESS and PV sizing. IEEE Access 2019, 7, 98875–98892. [Google Scholar] [CrossRef]
  8. Wong, L.A.; Ramachandaramurthy, V.K.; Walker, S.L.; Ekanayake, J.B. Optimal placement and sizing of battery energy storage system considering the duck curve phenomenon. IEEE Access 2020, 8, 197236–197248. [Google Scholar] [CrossRef]
  9. Yang, Y.; Li, H.; Aichhorn, A.; Zheng, J.; Greenleaf, M. Sizing strategy of distributed battery storage system with high penetration of photovoltaic for voltage regulation and peak load shaving. IEEE Trans. Smart Grid 2014, 5, 982–991. [Google Scholar] [CrossRef]
  10. Ru, Y.; Kleissl, J.; Martinez, S. Storage size determination for grid-connected photovoltaic systems. IEEE Trans. Sustain. Energy 2013, 4, 68–81. [Google Scholar] [CrossRef] [Green Version]
  11. Atwa, Y.M.; El-Saadany, E.F. Optimal allocation of ESS in distribution systems with a high penetration of wind energy. IEEE Trans. Power Syst. 2010, 25, 1815–1822. [Google Scholar] [CrossRef]
  12. Giannitrapani, A.; Paoletti, S.; Vicino, A.; Zarrilli, D. Optimal Allocation of Energy Storage Systems for Voltage Control in LV Distribution Networks. IEEE Trans. Smart Grid 2017, 8, 2859–2870. [Google Scholar] [CrossRef]
  13. Bahramirad, S.; Reder, W.; Khodaei, A. Reliability-constrained optimal sizing of energy storage system in a microgrid. IEEE Trans. Smart Grid 2012, 3, 2056–2062. [Google Scholar] [CrossRef]
  14. Chen, S.X.; Gooi, H.B.; Wang, M.Q. Sizing of energy storage for microgrids. IEEE Trans. Smart Grid 2012, 3, 142–151. [Google Scholar] [CrossRef]
  15. Miranda, I.; Silva, N.; Leite, H. A holistic approach to the integration of battery energy storage systems in island electric grids with high wind penetration. IEEE Trans. Sustain. Energy 2015, 7, 775–785. [Google Scholar] [CrossRef]
  16. Pandzic, H.; Wang, Y.; Qiu, T.; Dvorkin, Y.; Kirschen, D.S. Near-optimal method for siting and sizing of distributed storage in a transmission network. IEEE Trans. Power Syst. 2015, 30, 2288–2300. [Google Scholar] [CrossRef]
  17. Fernández-Blanco, R.; Dvorkin, Y.; Xu, B.; Wang, Y.; Kirschen, D.S. Optimal energy storage siting and sizing: A WECC case study. IEEE Trans. Sustain. Energy 2017, 8, 733–743. [Google Scholar] [CrossRef]
  18. Ghofrani, M.; Arabali, A.; Etezadi-Amoli, M.; Fadali, M.S. A Framework for optimal placement of energy storage units within a power system with high wind penetration. IEEE Trans. Sustain. Energy 2013, 4, 434–442. [Google Scholar] [CrossRef]
  19. Carpinelli, G.; Celli, G.; Mocci, S.; Mottola, F.; Pilo, F.; Proto, D. Optimal integration of distributed energy storage devices in smart grids. IEEE Trans. Smart Grid 2013, 4, 985–995. [Google Scholar] [CrossRef]
  20. Salee, S.; Wirasanti, P. Optimal siting and sizing of battery energy storage systems for grid-supporting in electrical distribution network. In Proceedings of the 2018 International ECTI Northern Section Conference on Electrical, Electronics, Computer and Telecommunications Engineering, Chiang Rai, Thailand, 25–28 February 2018; pp. 100–105. [Google Scholar]
  21. Boonluk, P.; Siritaratiwat, A.; Fuangfoo, P.; Khunkitti, S. Optimal siting and sizing of battery energy storage systems for distribution network of distribution system operators. Batteries 2020, 6, 56. [Google Scholar] [CrossRef]
  22. Calderaro, V.; Galdi, V.; Graber, G.; Piccolo, A. Optimal siting and sizing of stationary supercapacitors in a metro network using PSO. In Proceedings of the 2015 IEEE International Conference on Industrial Technology, Seville, Spain, 17–19 March 2015; pp. 2680–2685. [Google Scholar]
  23. Saboori, H.; Hemmati, R. Maximizing DISCO profit in active distribution networks by optimal planning of energy storage systems and distributed generators. Renew. Sustain. Energy Rev. 2017, 71, 365–372. [Google Scholar] [CrossRef]
  24. Brekken, T.K.A.; Yokochi, A.; Jouanne, A.V.; Yen, Z.Z.; Hapke, H.M.; Halamay, D.A. Optimal energy storage sizing and control for wind power applications. IEEE Trans. Sustain. Energy 2010, 2, 69–77. [Google Scholar] [CrossRef]
  25. Zhao, S.; Blaabjerg, F.; Wang, H. An overview of artificial intelligence applications for power electronics. IEEE Trans. Power Electron. 2021, 36, 4633–4658. [Google Scholar] [CrossRef]
  26. Seyedmahmoudian, M.; Horan, B.; Soon, T.K.; Rahmani, R.; Oo, A.M.T.; Mekhilef, S.; Stojcevski, A. State of the art artificial intelligence-based MPPT techniques for mitigating partial shading effects on PV systems—A review. Renew. Sustain. Energy Rev. 2016, 64, 435–455. [Google Scholar] [CrossRef]
  27. Karimi, Y.; Oraee, H.; Guerrero, J.M. Decentralized method for load sharing and power management in a hybrid single/three phase-islanded microgrid consisting of hybrid source PV/battery units. IEEE Trans. Power Electron. 2017, 32, 6135–6144. [Google Scholar] [CrossRef] [Green Version]
  28. Saadat, H. Power System Analysis; McGraw-Hill: New York, NY, USA, 2004; pp. 232–240. [Google Scholar]
Figure 1. Flowchart for the optimal placement and sizing of a newly installed ESS based on the power sensitivity analysis.
Electronics 10 01598 g001
Figure 2. One-line diagram of the stand-alone microgrid in South Korea.
Electronics 10 01598 g002
Figure 3. Voltage stability heatmap for the relationship between all candidate placements for ESS and all load changes.
Electronics 10 01598 g003
Figure 4. With ESS at optimal placements and sizing: (a) real power response of ESS, (b) voltage deviation change at bus 25, and (c) voltage deviation changes at bus 34 during the VMS operation. O.P, optimal placement.
Electronics 10 01598 g004
Figure 5. With ESS at bus 34, (a) real power response of ESS, (b) voltage deviation change at bus 25, and (c) voltage deviation change at bus 34 during the VMS operation. C.C, comparison case.
Electronics 10 01598 g005
Figure 6. Voltage stability improvement heatmap for (a) the new ESS installation at bus 25 (optimal placement: high priority, recommended) and (b) the new ESS installation at bus 34 (comparison case: low priority, not recommended) according to the load changes.
Electronics 10 01598 g006
Table 1. Comparison to other ESS installation techniques.
Type of
Approach
ReferenceOptimized VariableMethodObjective FunctionAmount of Computation
AnalyticalProposed algorithmPlacement, SizingSelf-defined
algorithm
High contribution to voltage stability with lower sizing of ESS q C p
[9]SizingBattery cost-benefit analysisMinimize annual cost q C p · q p
[10]SizingSelf-defined
algorithm
Minimize net power purchase cost and battery loss q C p · L p , L = [ ( C r e f u b C r e f l b ) / τ c s p ]
[11]Placement, SizingCost-benefit analysisMinimize spilled wind power and annual electricity cost q C p · q · 8760
[12]Placement, SizingSelf-defined two-step algorithmMinimizing total cost of ESS and network losses q C p · T
Mathematical
optimization
[13]SizingMixed-integer
Programming (MIP)
Minimize installation cost of ESS and operating cost of MG q C p · N S · N T · N H · N G
[14]SizingMixed-integer linear programming (MILP)Minimize the total cost; maximize the total benefit q C p · t · max { C G , W G , P G }
[15]Placement, SizingMILPMinimize operational cost q C p · T · K · N S
[16]Placement, SizingMILPMinimize the sum of the generation cost q C p · T · I
[17]Placement, SizingStochastic MILPMinimize operating cost and installation cost of ESS q C p · max { ( ε · T · Ω g · ο T ) , ( ε · T · Ω r g ) , B }
Artificial intelligence[18]PlacementGenetic algorithm (GA)Minimize hourly social costDepending on parameters of GA
[19]Placement, SizingGA and sequential quadratic programmingMinimize whole costDepending on parameters of GA
[20]Placement, SizingGAMinimize voltage deviation and power lossDepending on parameters of GA
[21]Placement, SizingGA and particle swarm optimization (PSO)Minimize cost related to power system stabilityDepending on parameters of GA and termination criteria/
Depending on parameters of PSO and maximum iteration
[22]Placement, SizingPSOMinimize whole costDepending on parameters of PSO and maximum iteration
[23]Placement, SizingPSOMaximize profit of distribution companyDepending on parameters of PSO and maximum iteration
[24]SizingArtificial neural network (ANN)Minimize cost related to ESSDepending on parameters of ANN including training big data
Table 2. Load demands of the stand-alone microgrid.
Bus No.LoadBus No.LoadBus No.Load
p (kW)Q (kvar)p (kW)Q (kvar)p (kW)Q (kvar)
592.89.2816214.421.442716016
722.42.2417323.232.322984.168.416
8323.22022.42.243012.81.28
938.43.842215215.23328.82.88
119.60.962328.82.8834101.7610.176
12969.62441.64.163568.86.88
1460.86.082641.64.163714414.4
Table 3. Priority analysis according to the installation placement of a newly installed ESS.
Bus No. S P E S S , i   ( MW ) M P E S S , i   ( MW ) O F E S S , i PriorityRecommendation
251.1251090.1763256.3808661High
291.0400740.1630666.3782252High
212.0318020.3191826.3656473High
362.0381830.3212726.3441024High
71.8424480.3246215.67568415Medium
231.5379290.2970815.17680516Medium
330.8721710.1685445.17473517Medium
241.4244320.2756215.16808518Medium
141.304290.3246994.01692227Low
151.2771160.3249093.93069228Low
171.2227180.32323.78316329Low
341.5709970.4514323.4800330Low
Table 4. Comparison of RMSE voltage according to ESS installation and installation placement.
Without ESSWith ESS at Bus 25 (Optimal Placement)With ESS at Bus 34 (Comparison Case)
ΔVRMSE0.07530.05050.0731
Publisher’s Note: MDPI stays neutral with regard to jurisdictional claims in published maps and institutional affiliations.

