


Chlorogenic Acid, a Component of Oenanthe javanica (Blume) DC., Attenuates Oxidative Damage and Prostaglandin E2 Production Due to Particulate Matter 10 in HaCaT Keratinocytes


Abstract
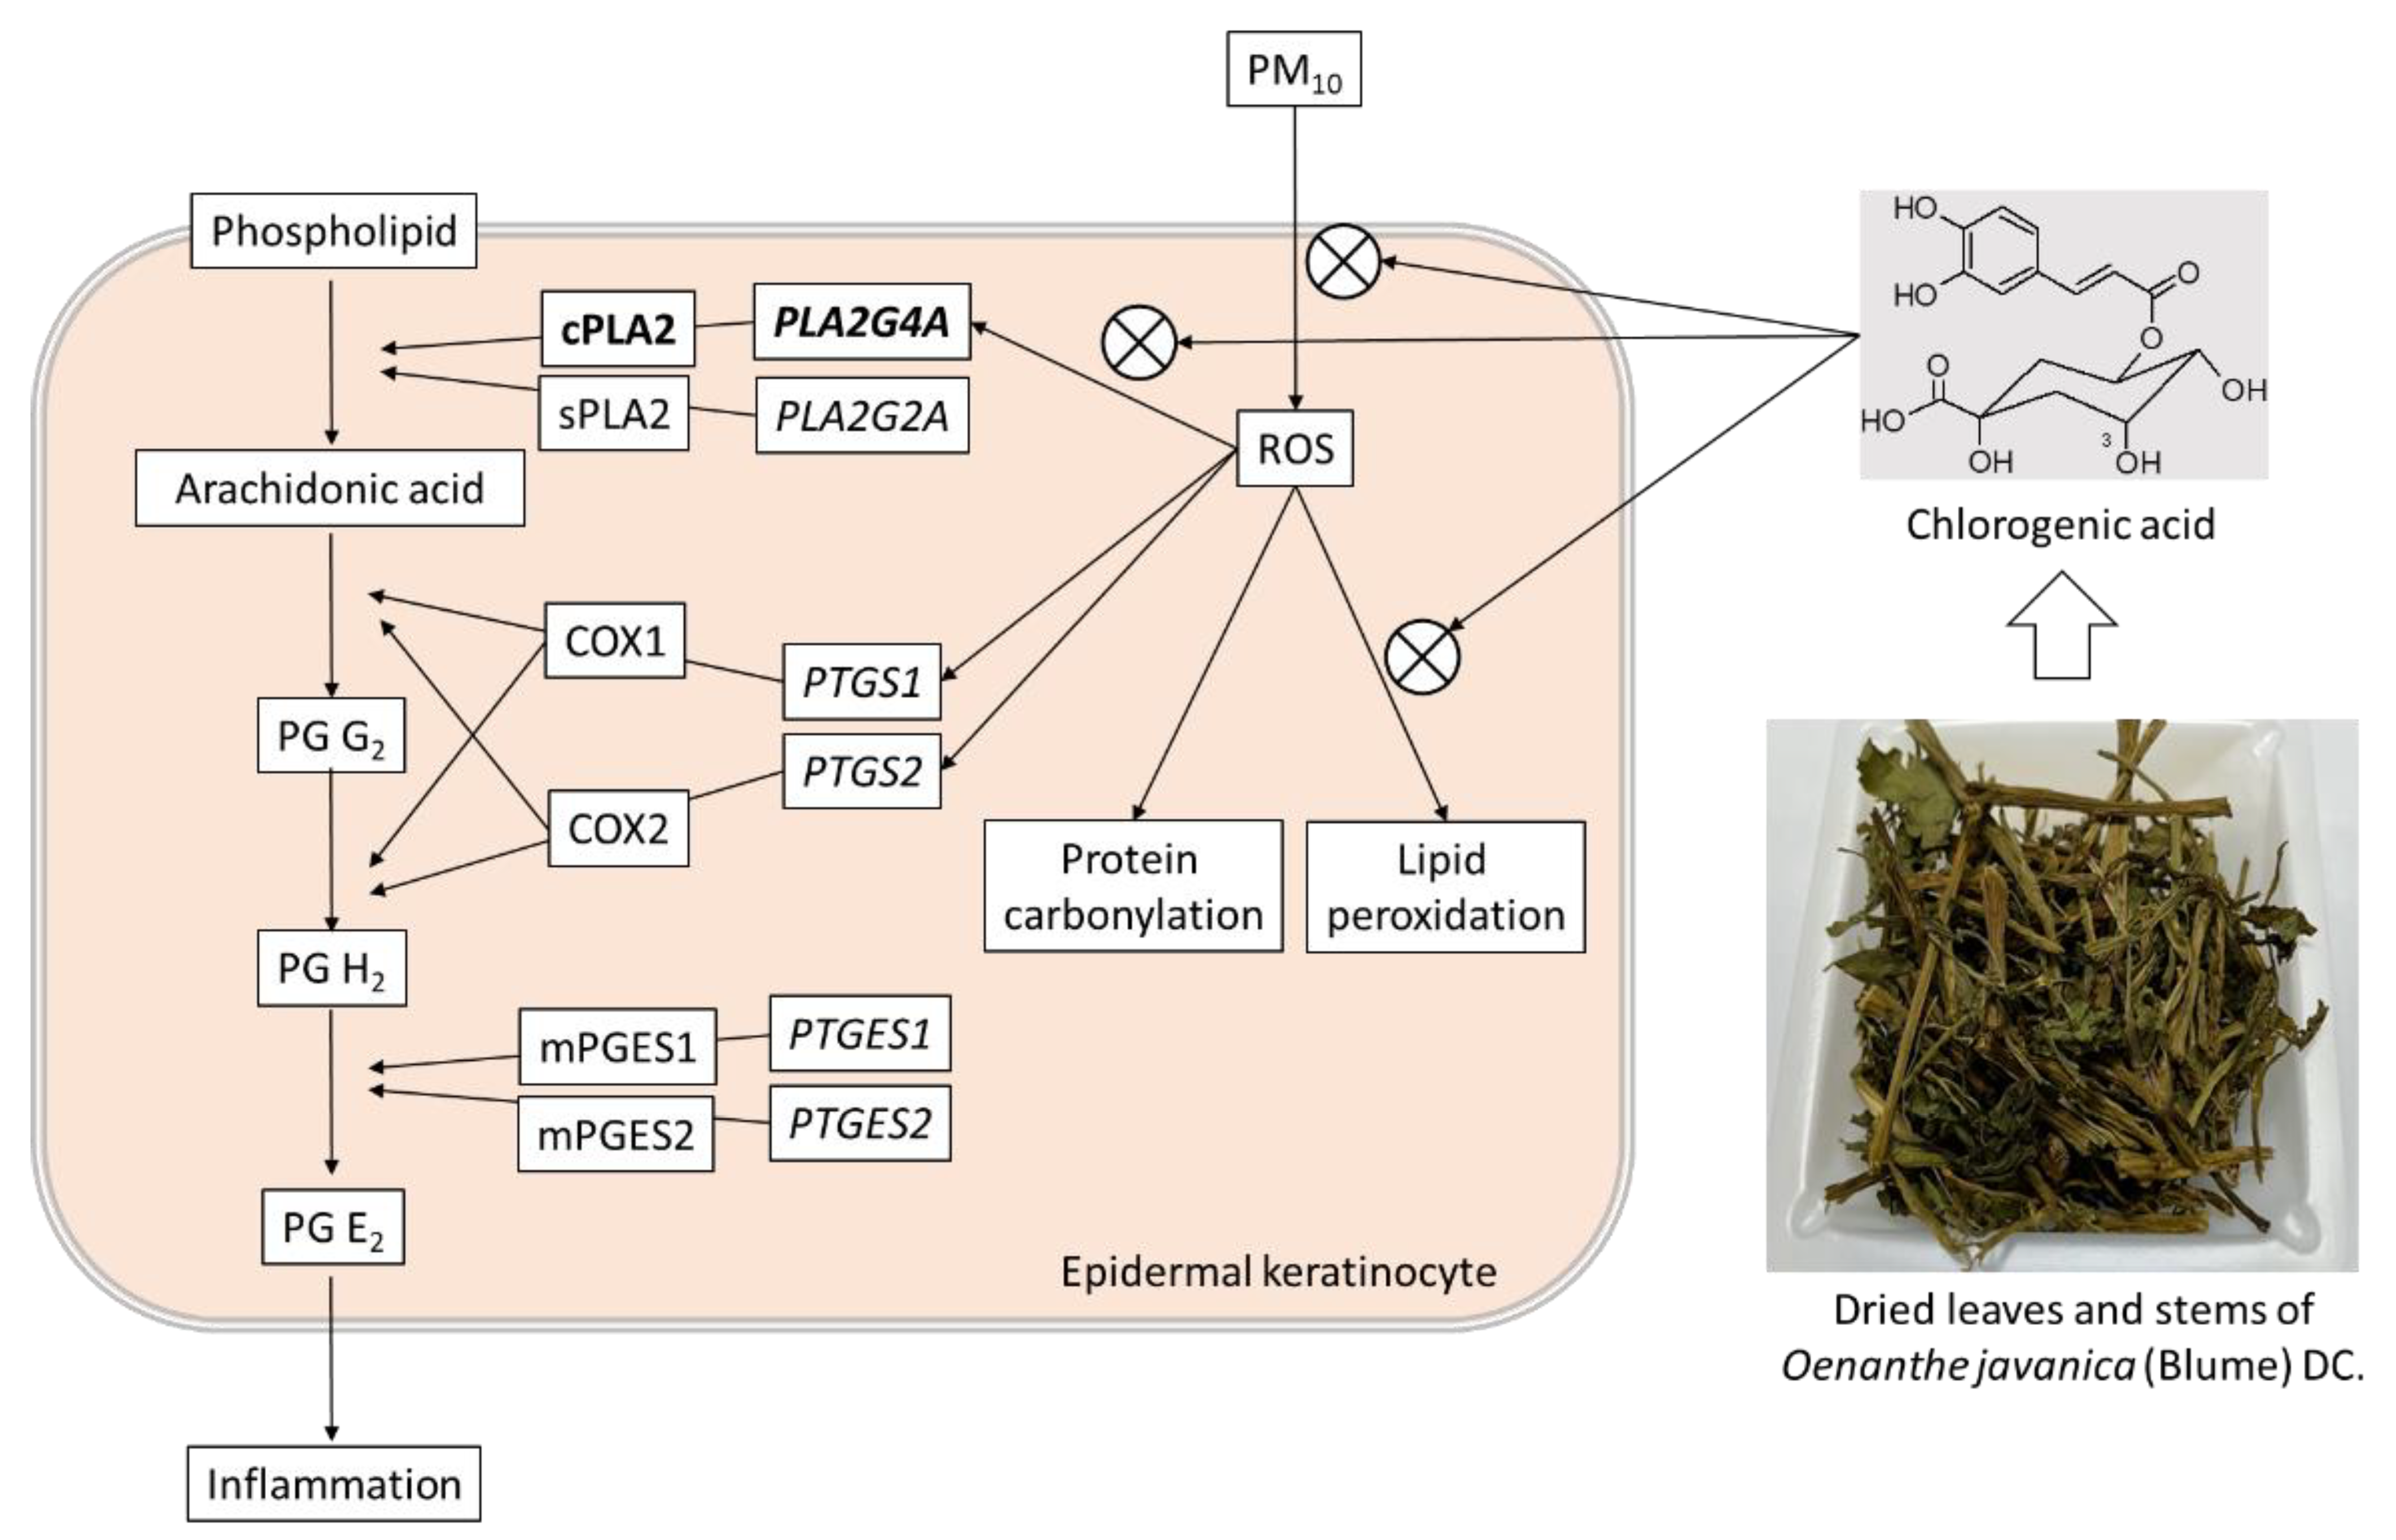
:1. Introduction
2. Materials and Methods
2.1. Reagents
2.2. Preparation of the Hot Water Extract and Fractions of OJ
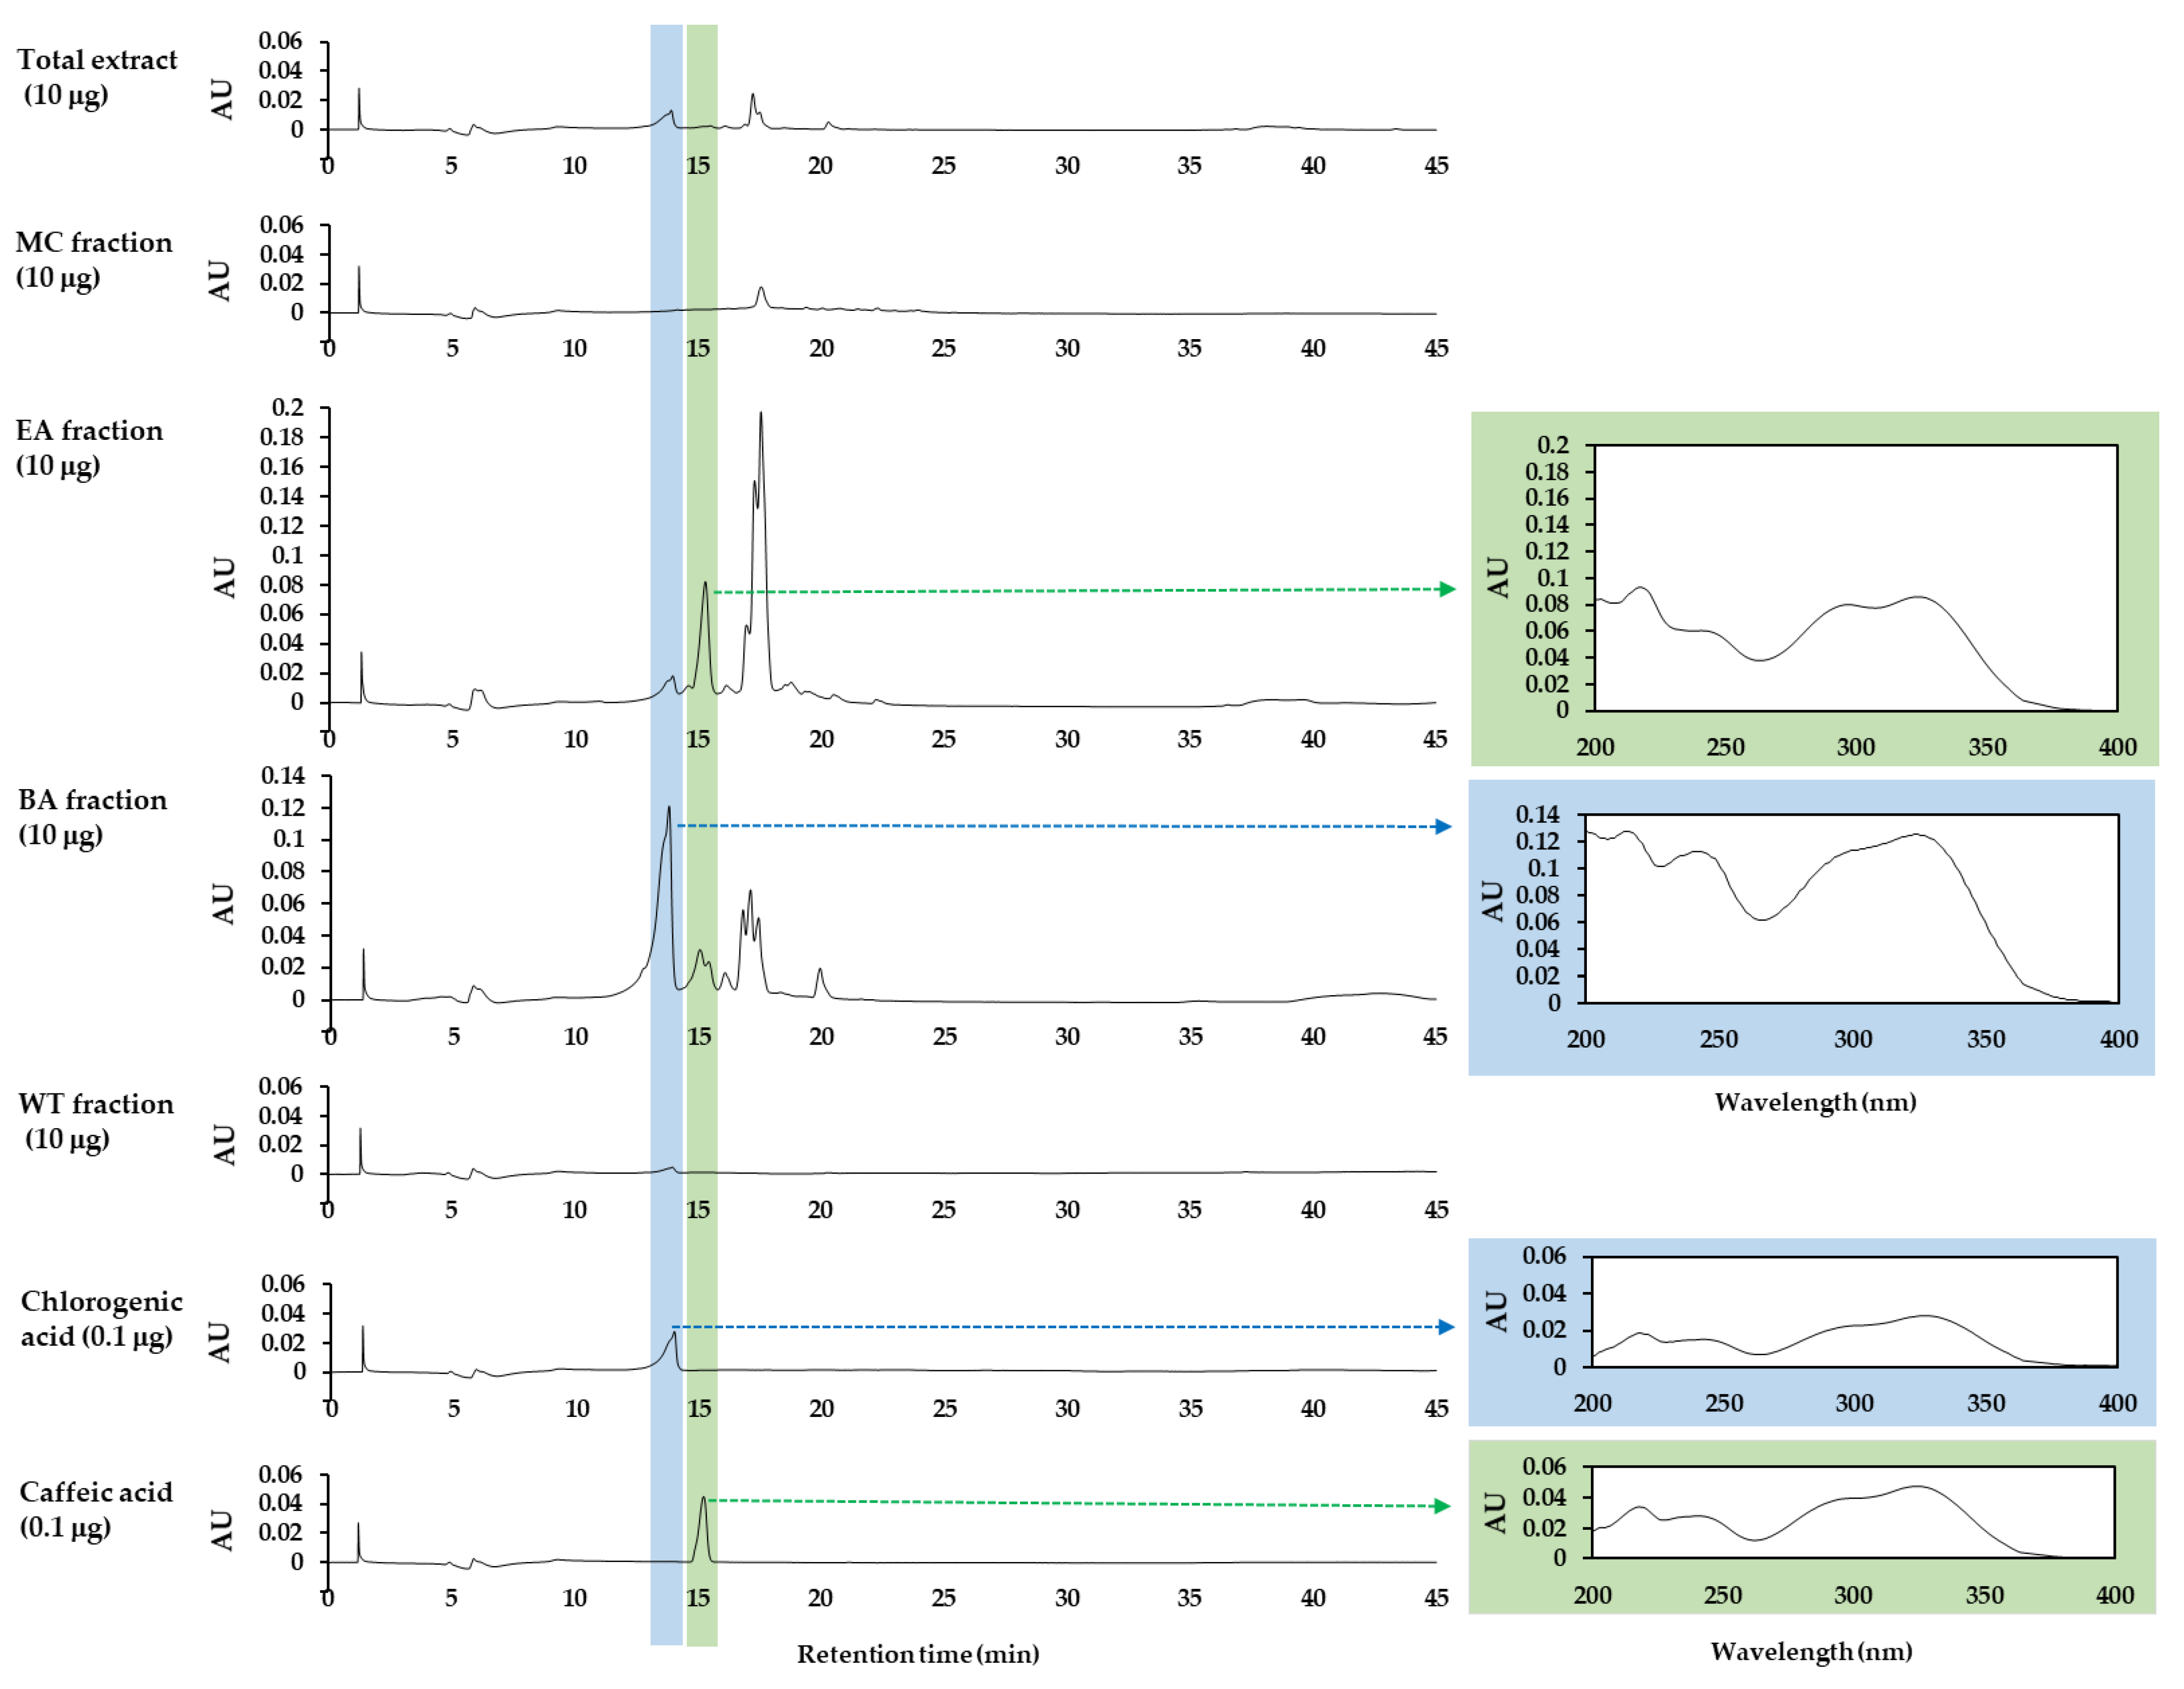
2.3. High-Performance Liquid Chromatography with Photodiode Array Detection (HPLC-DAD)
2.4. Cell Culture and Treatments
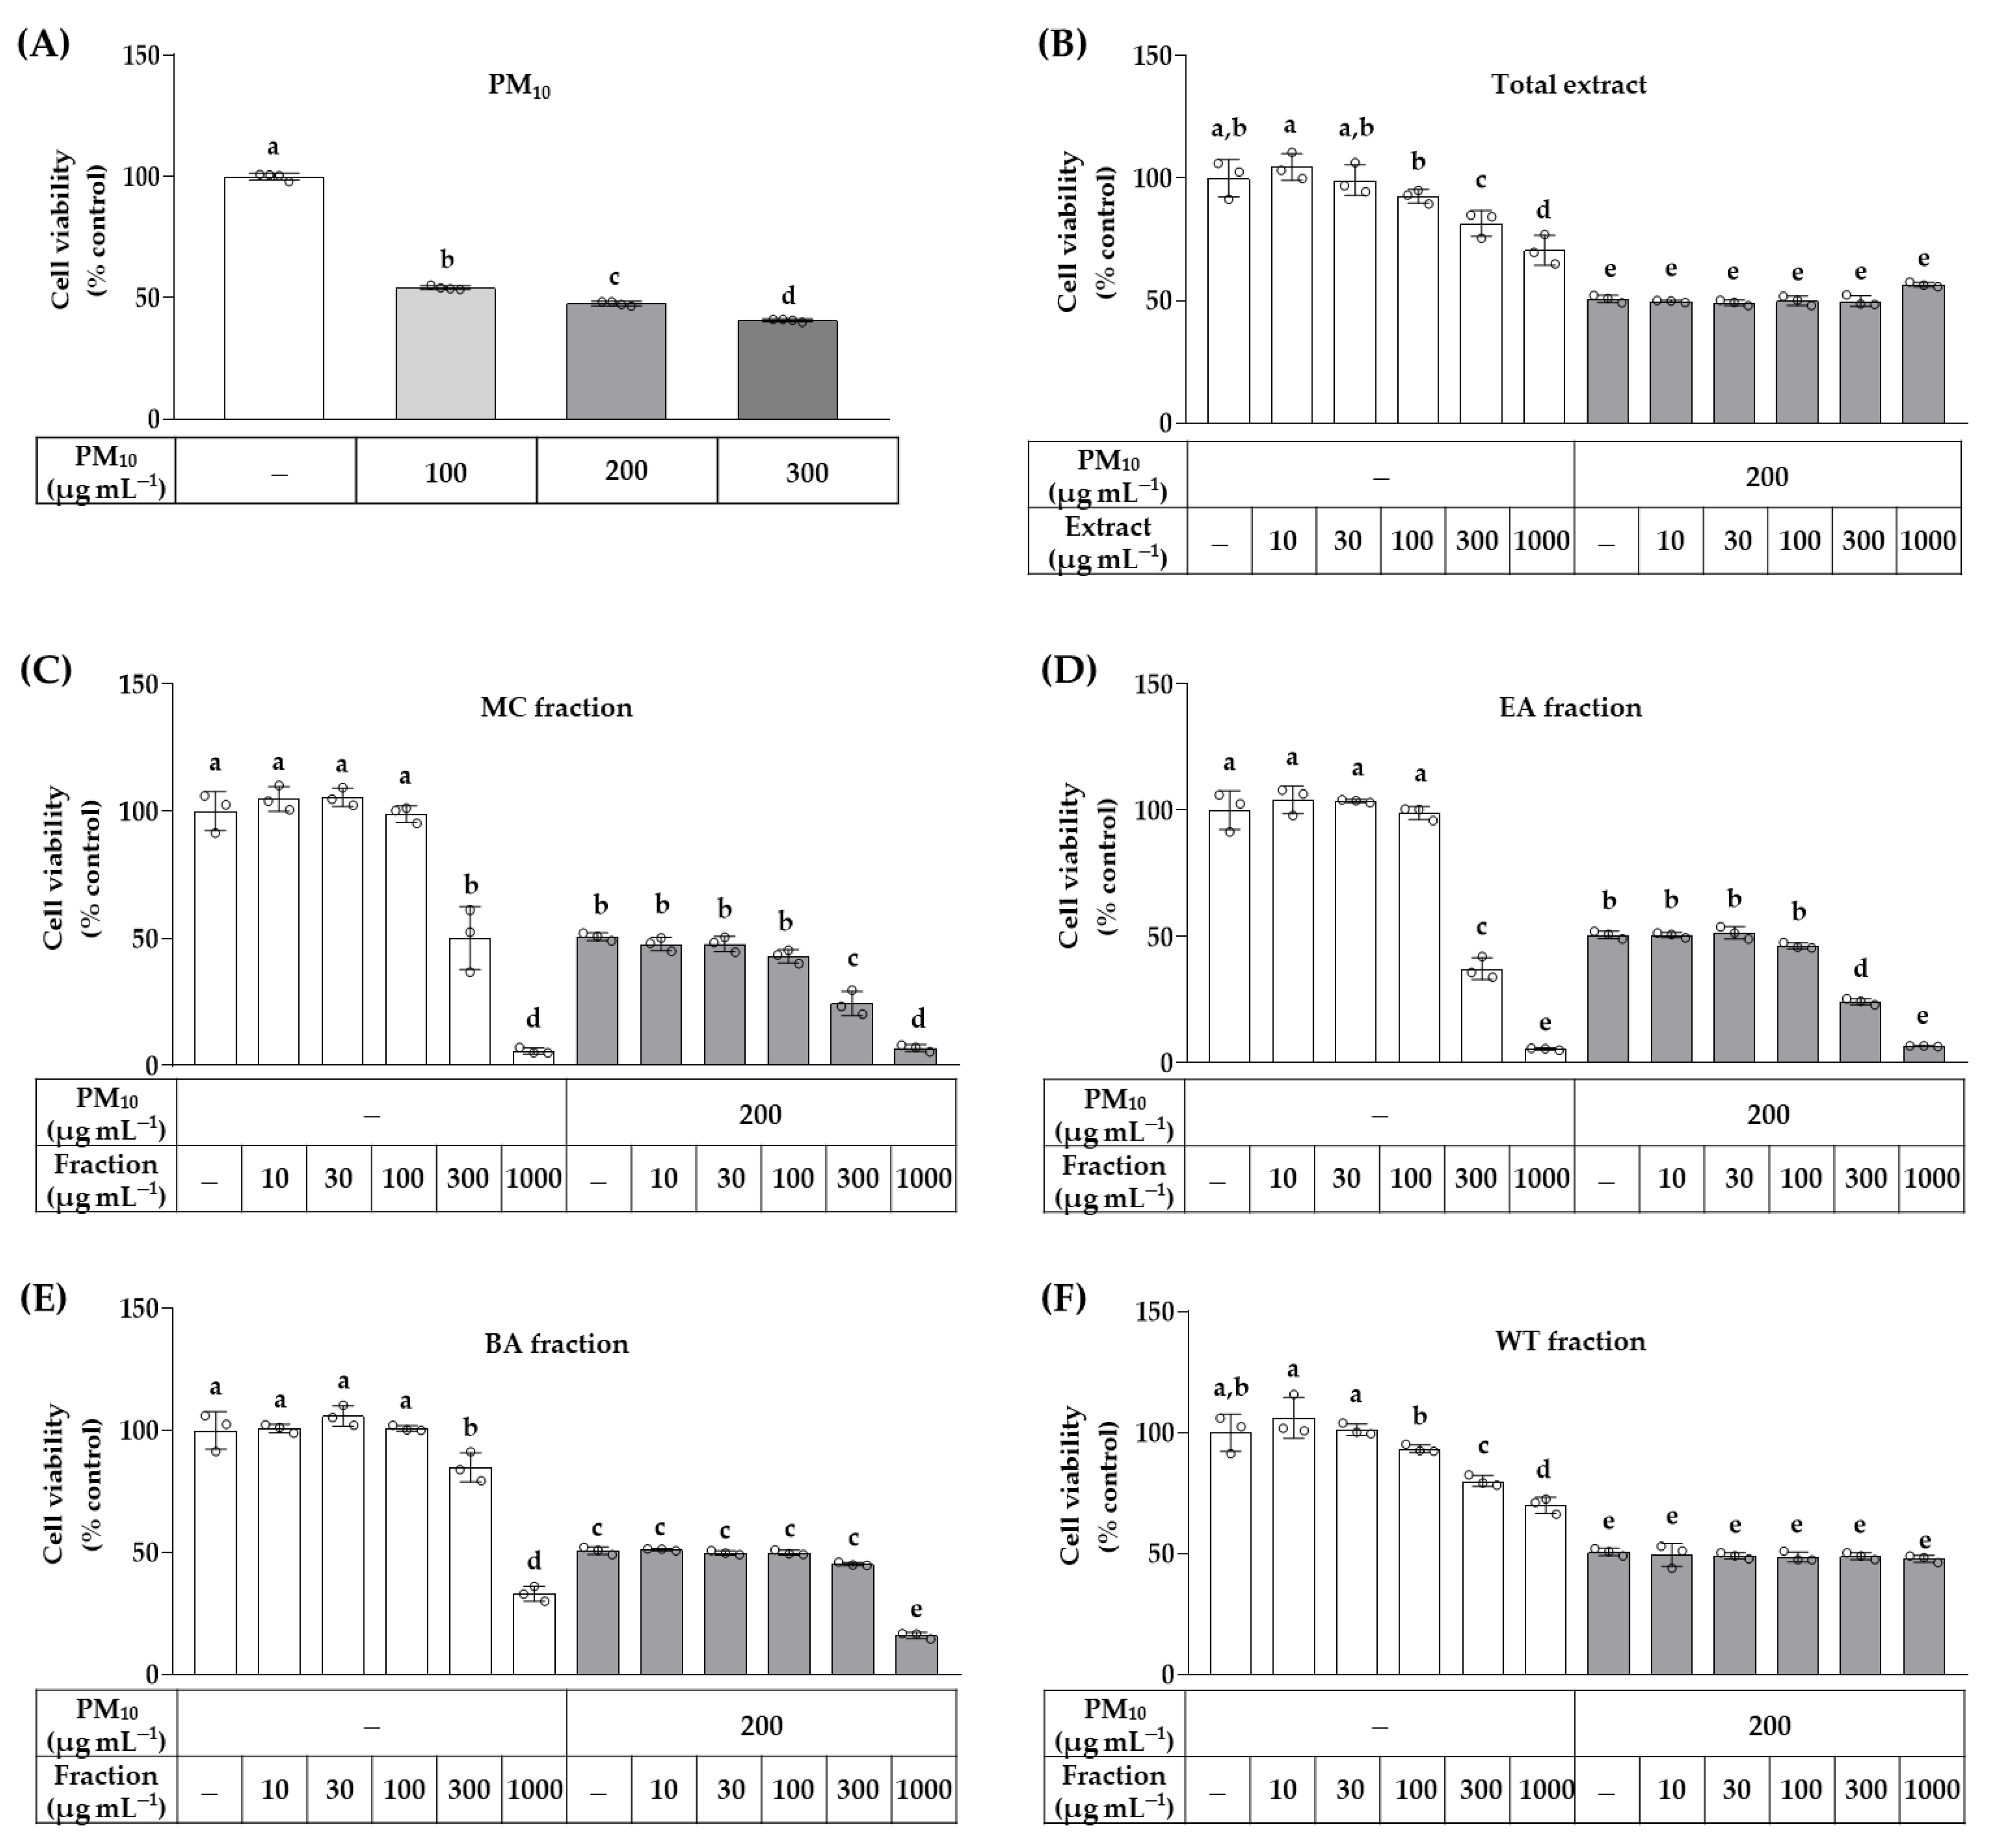
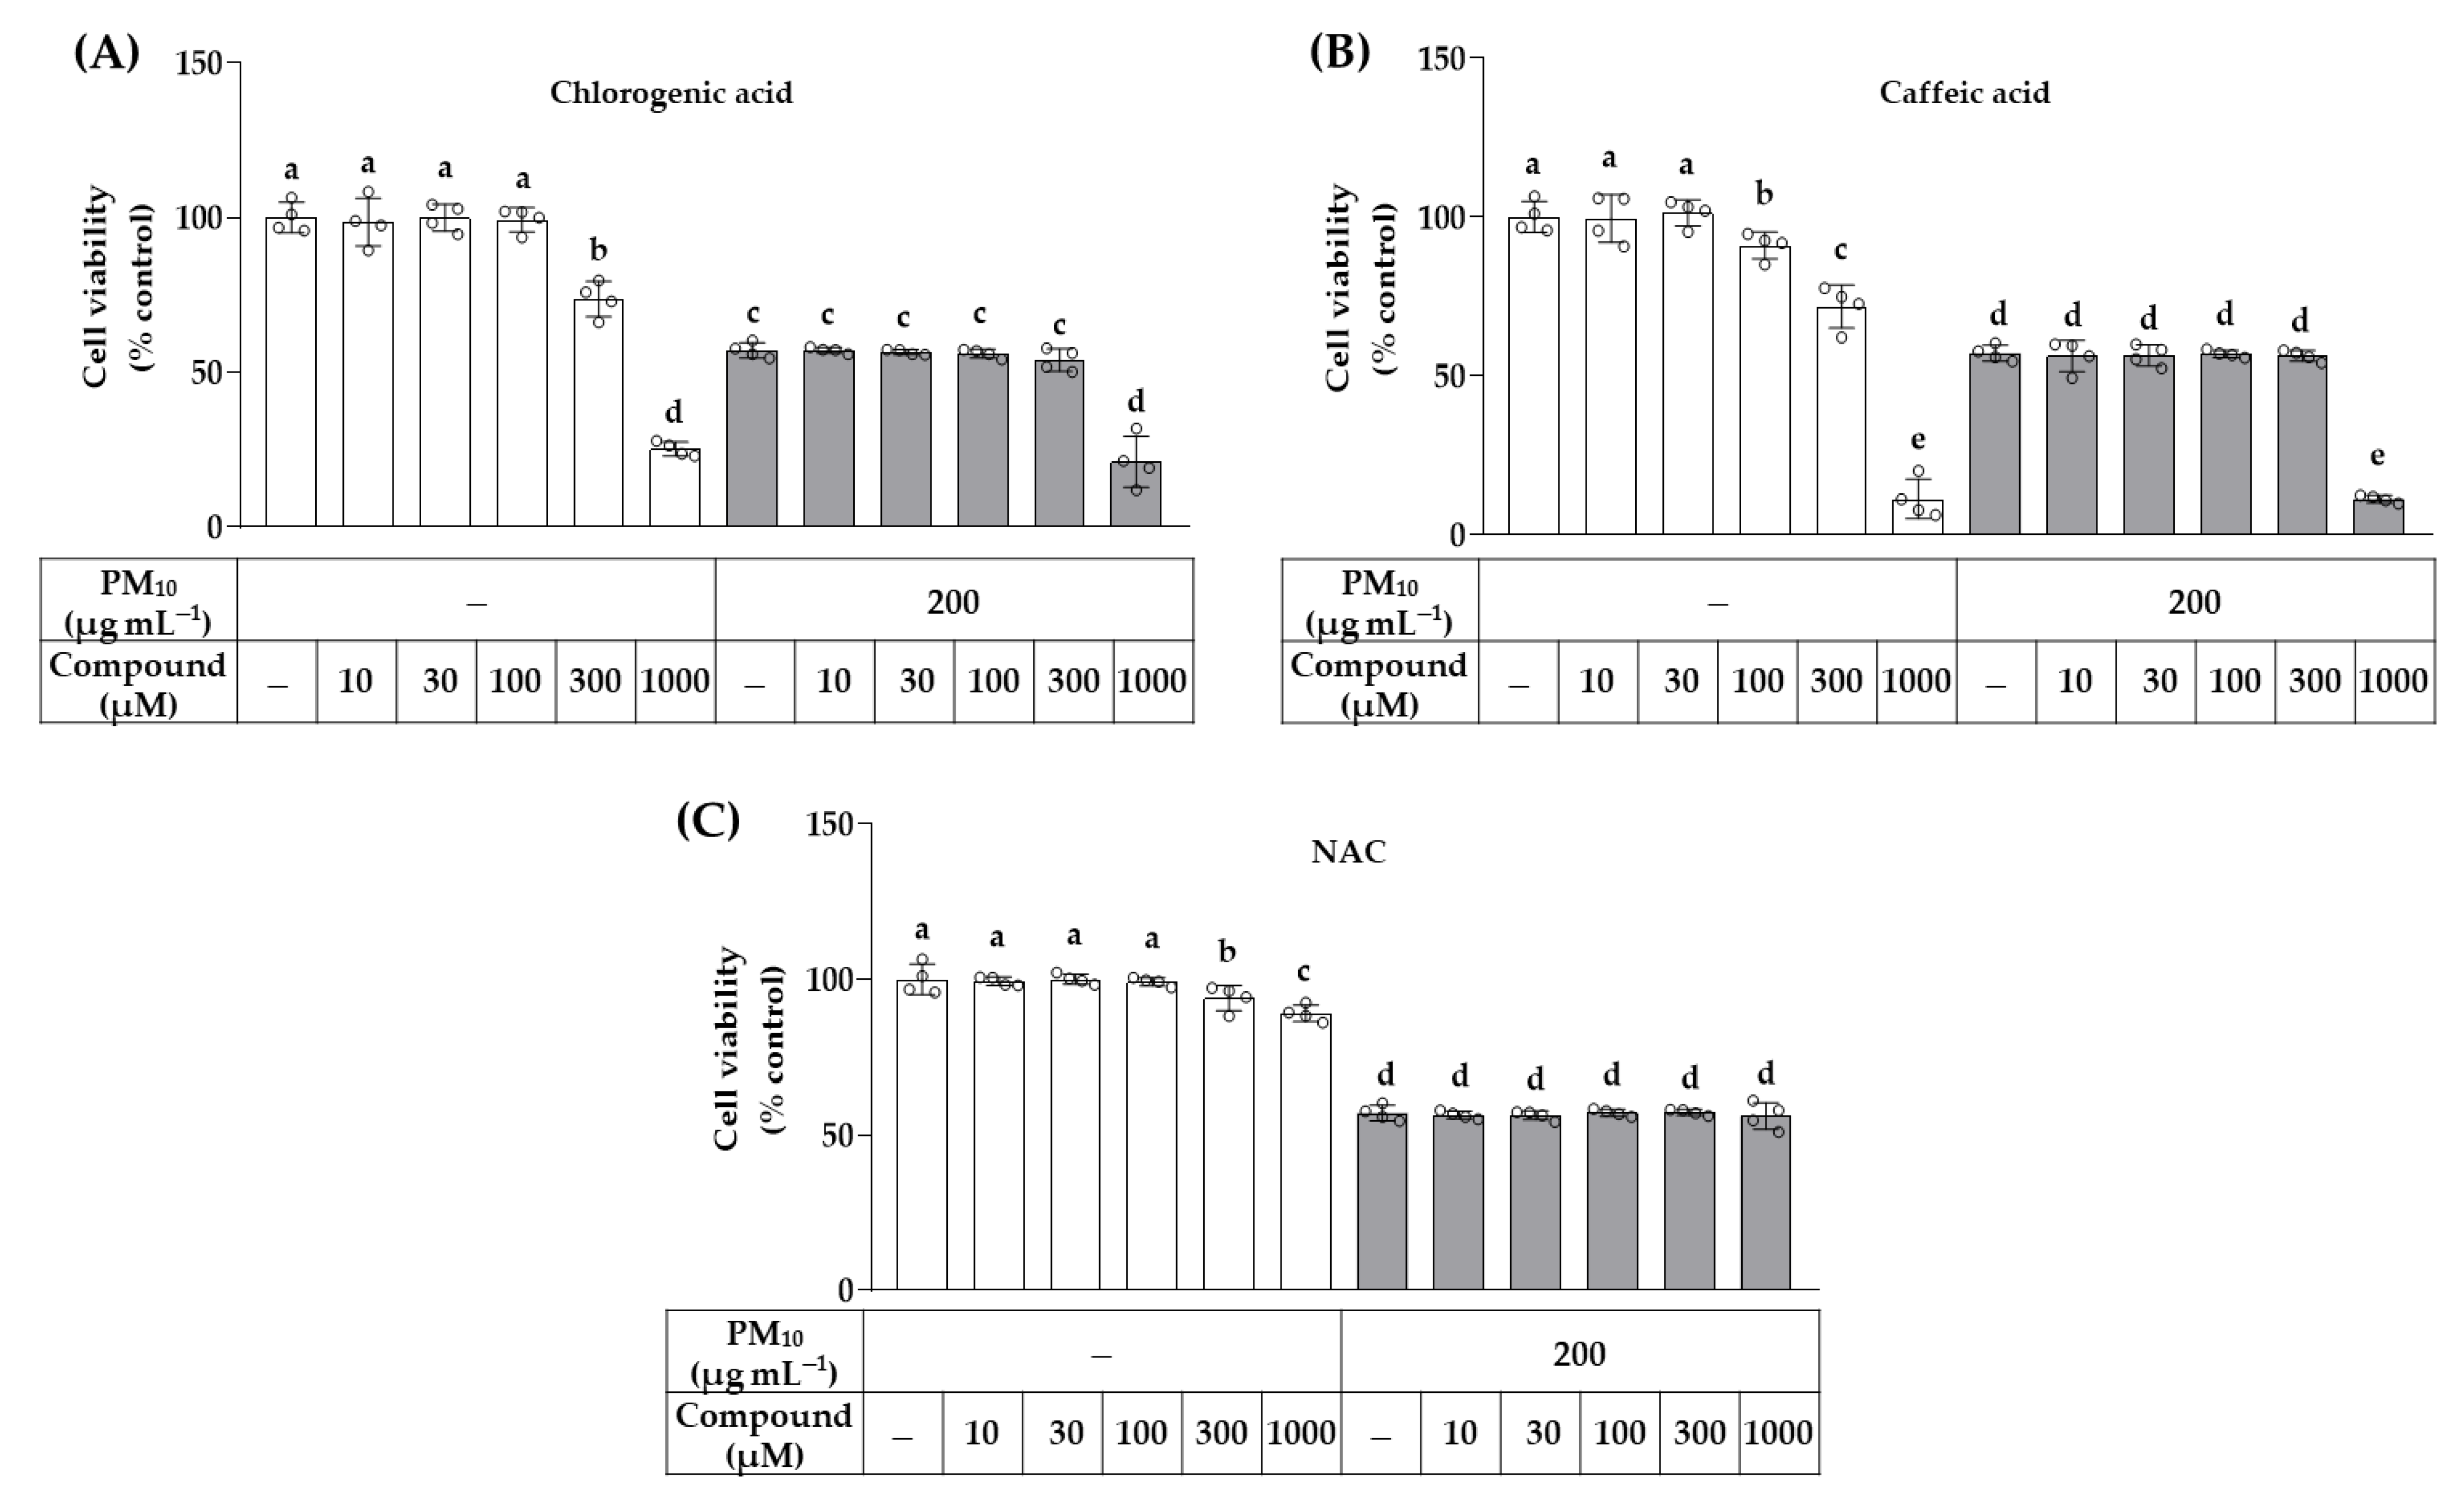
2.5. Cell Viability Assay
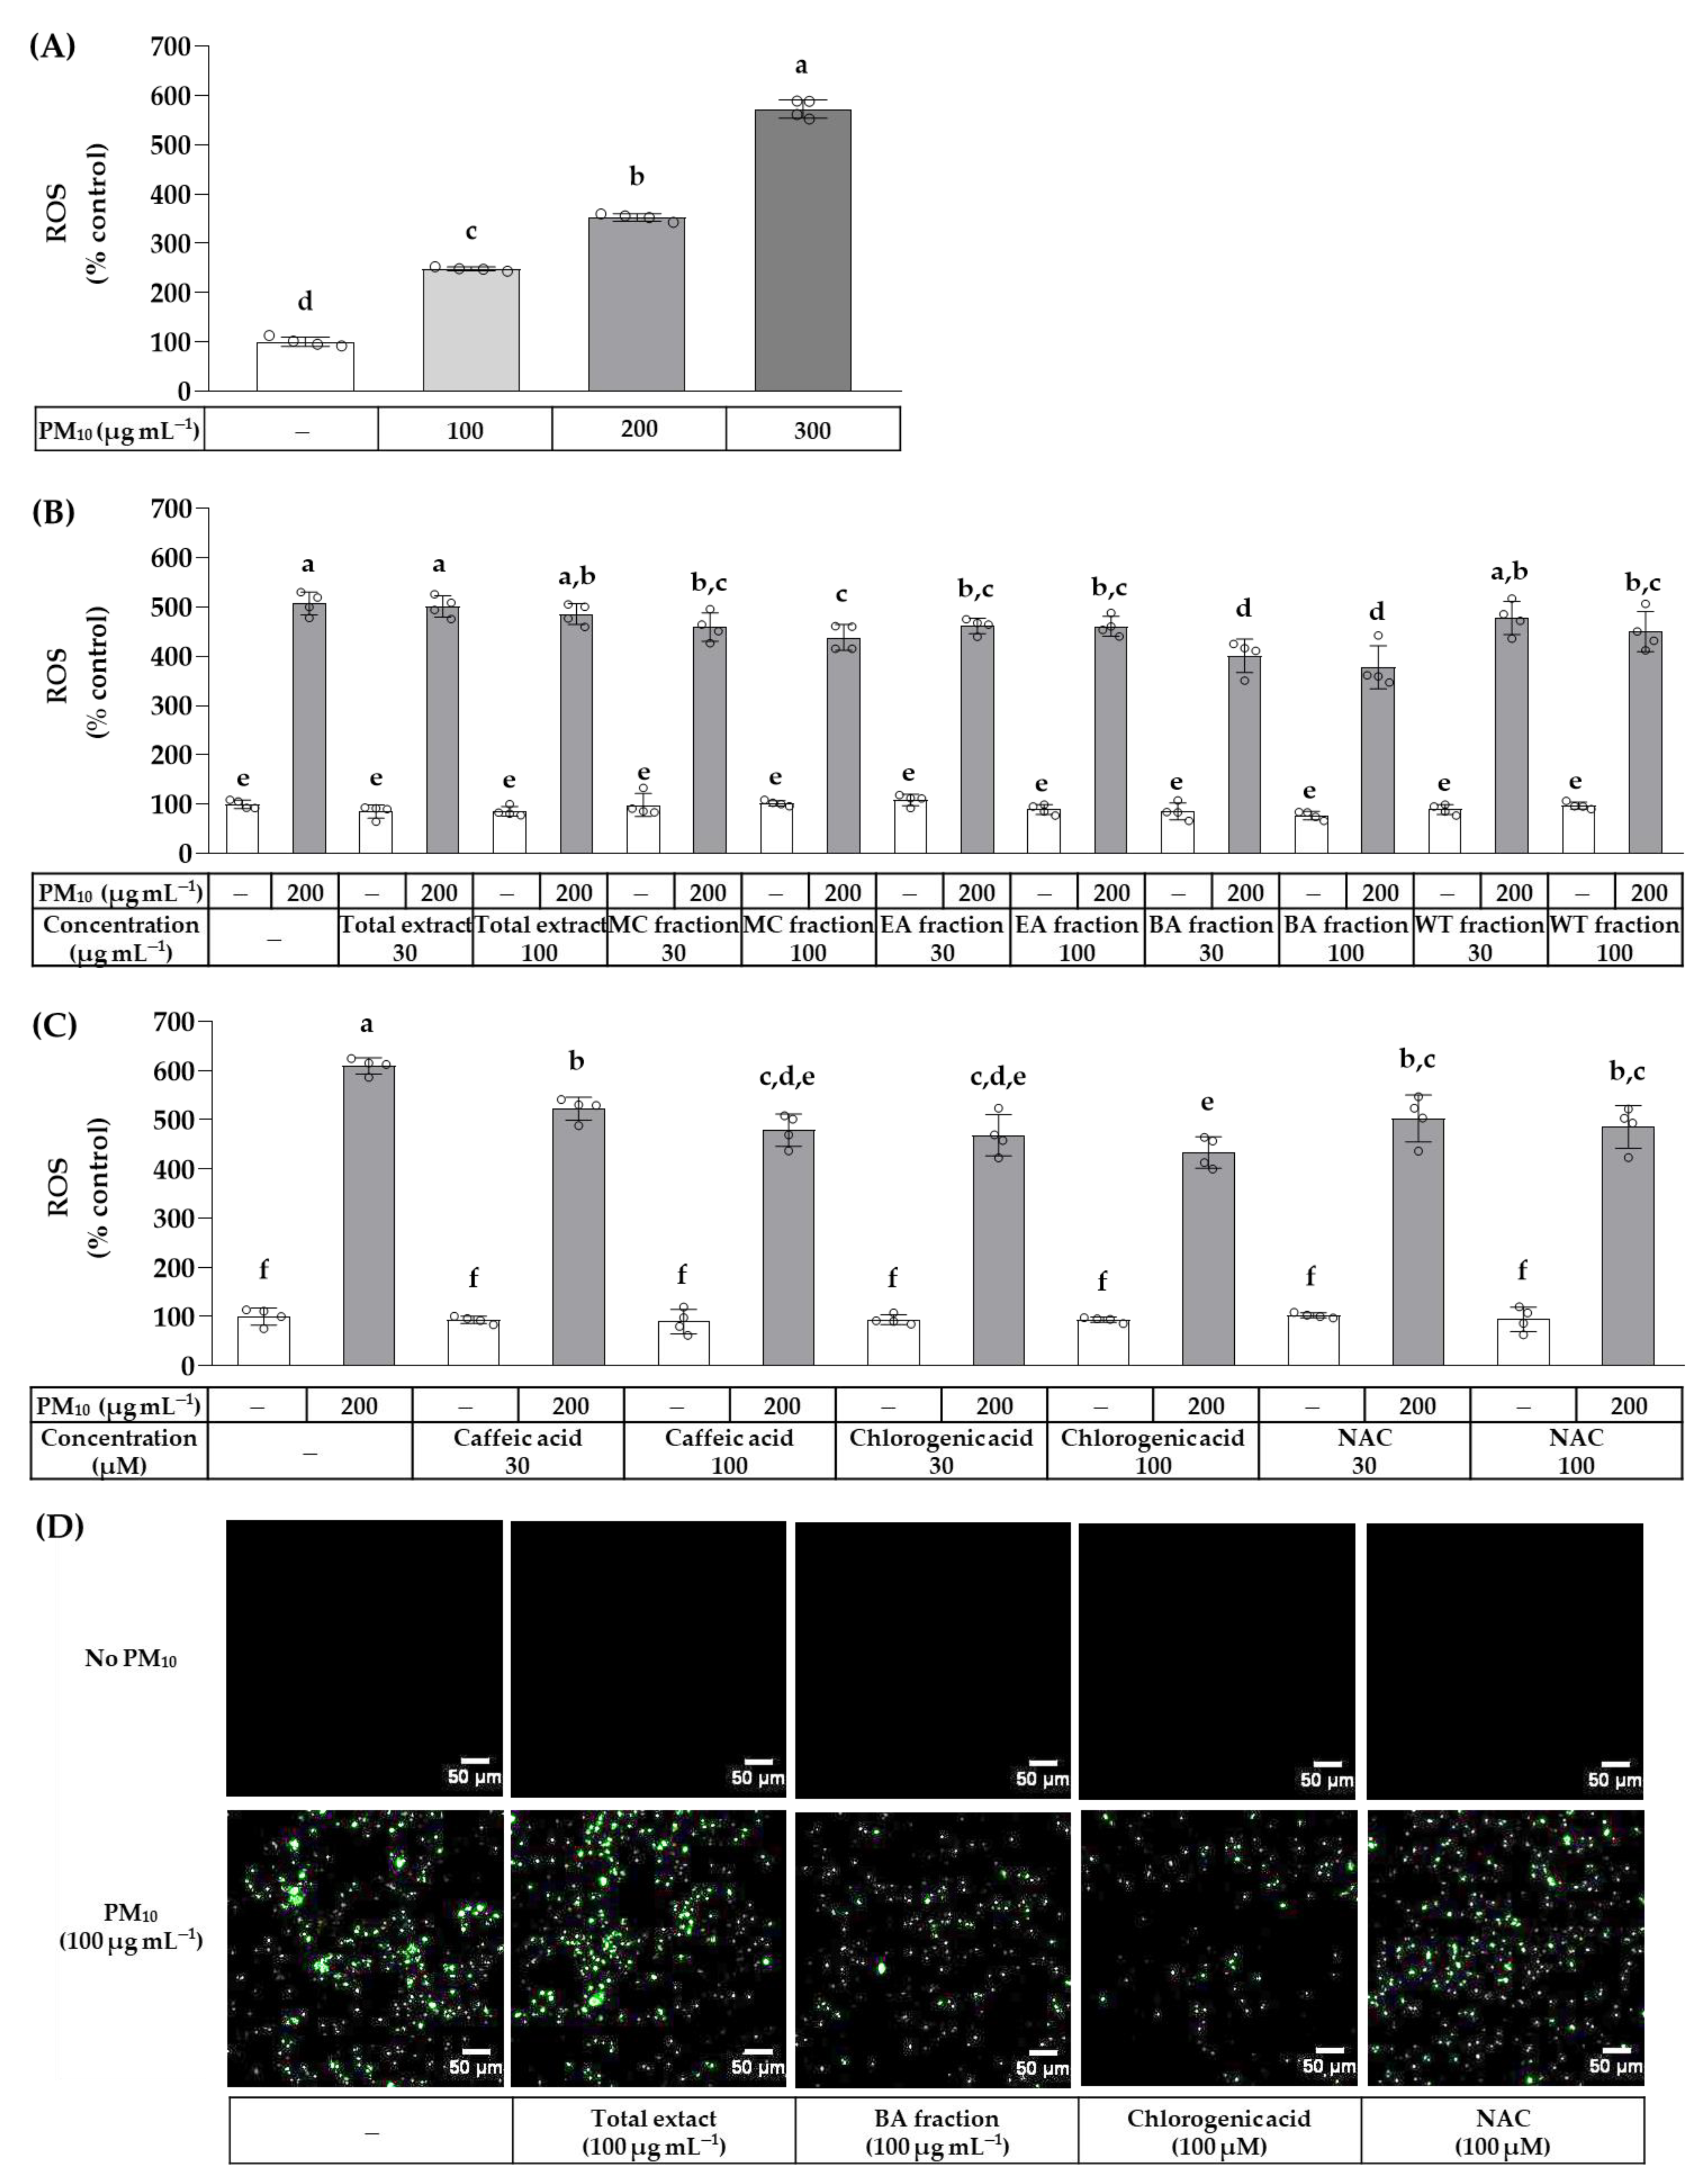
2.6. Cellular Reactive Oxygen Species (ROS) Production Assay
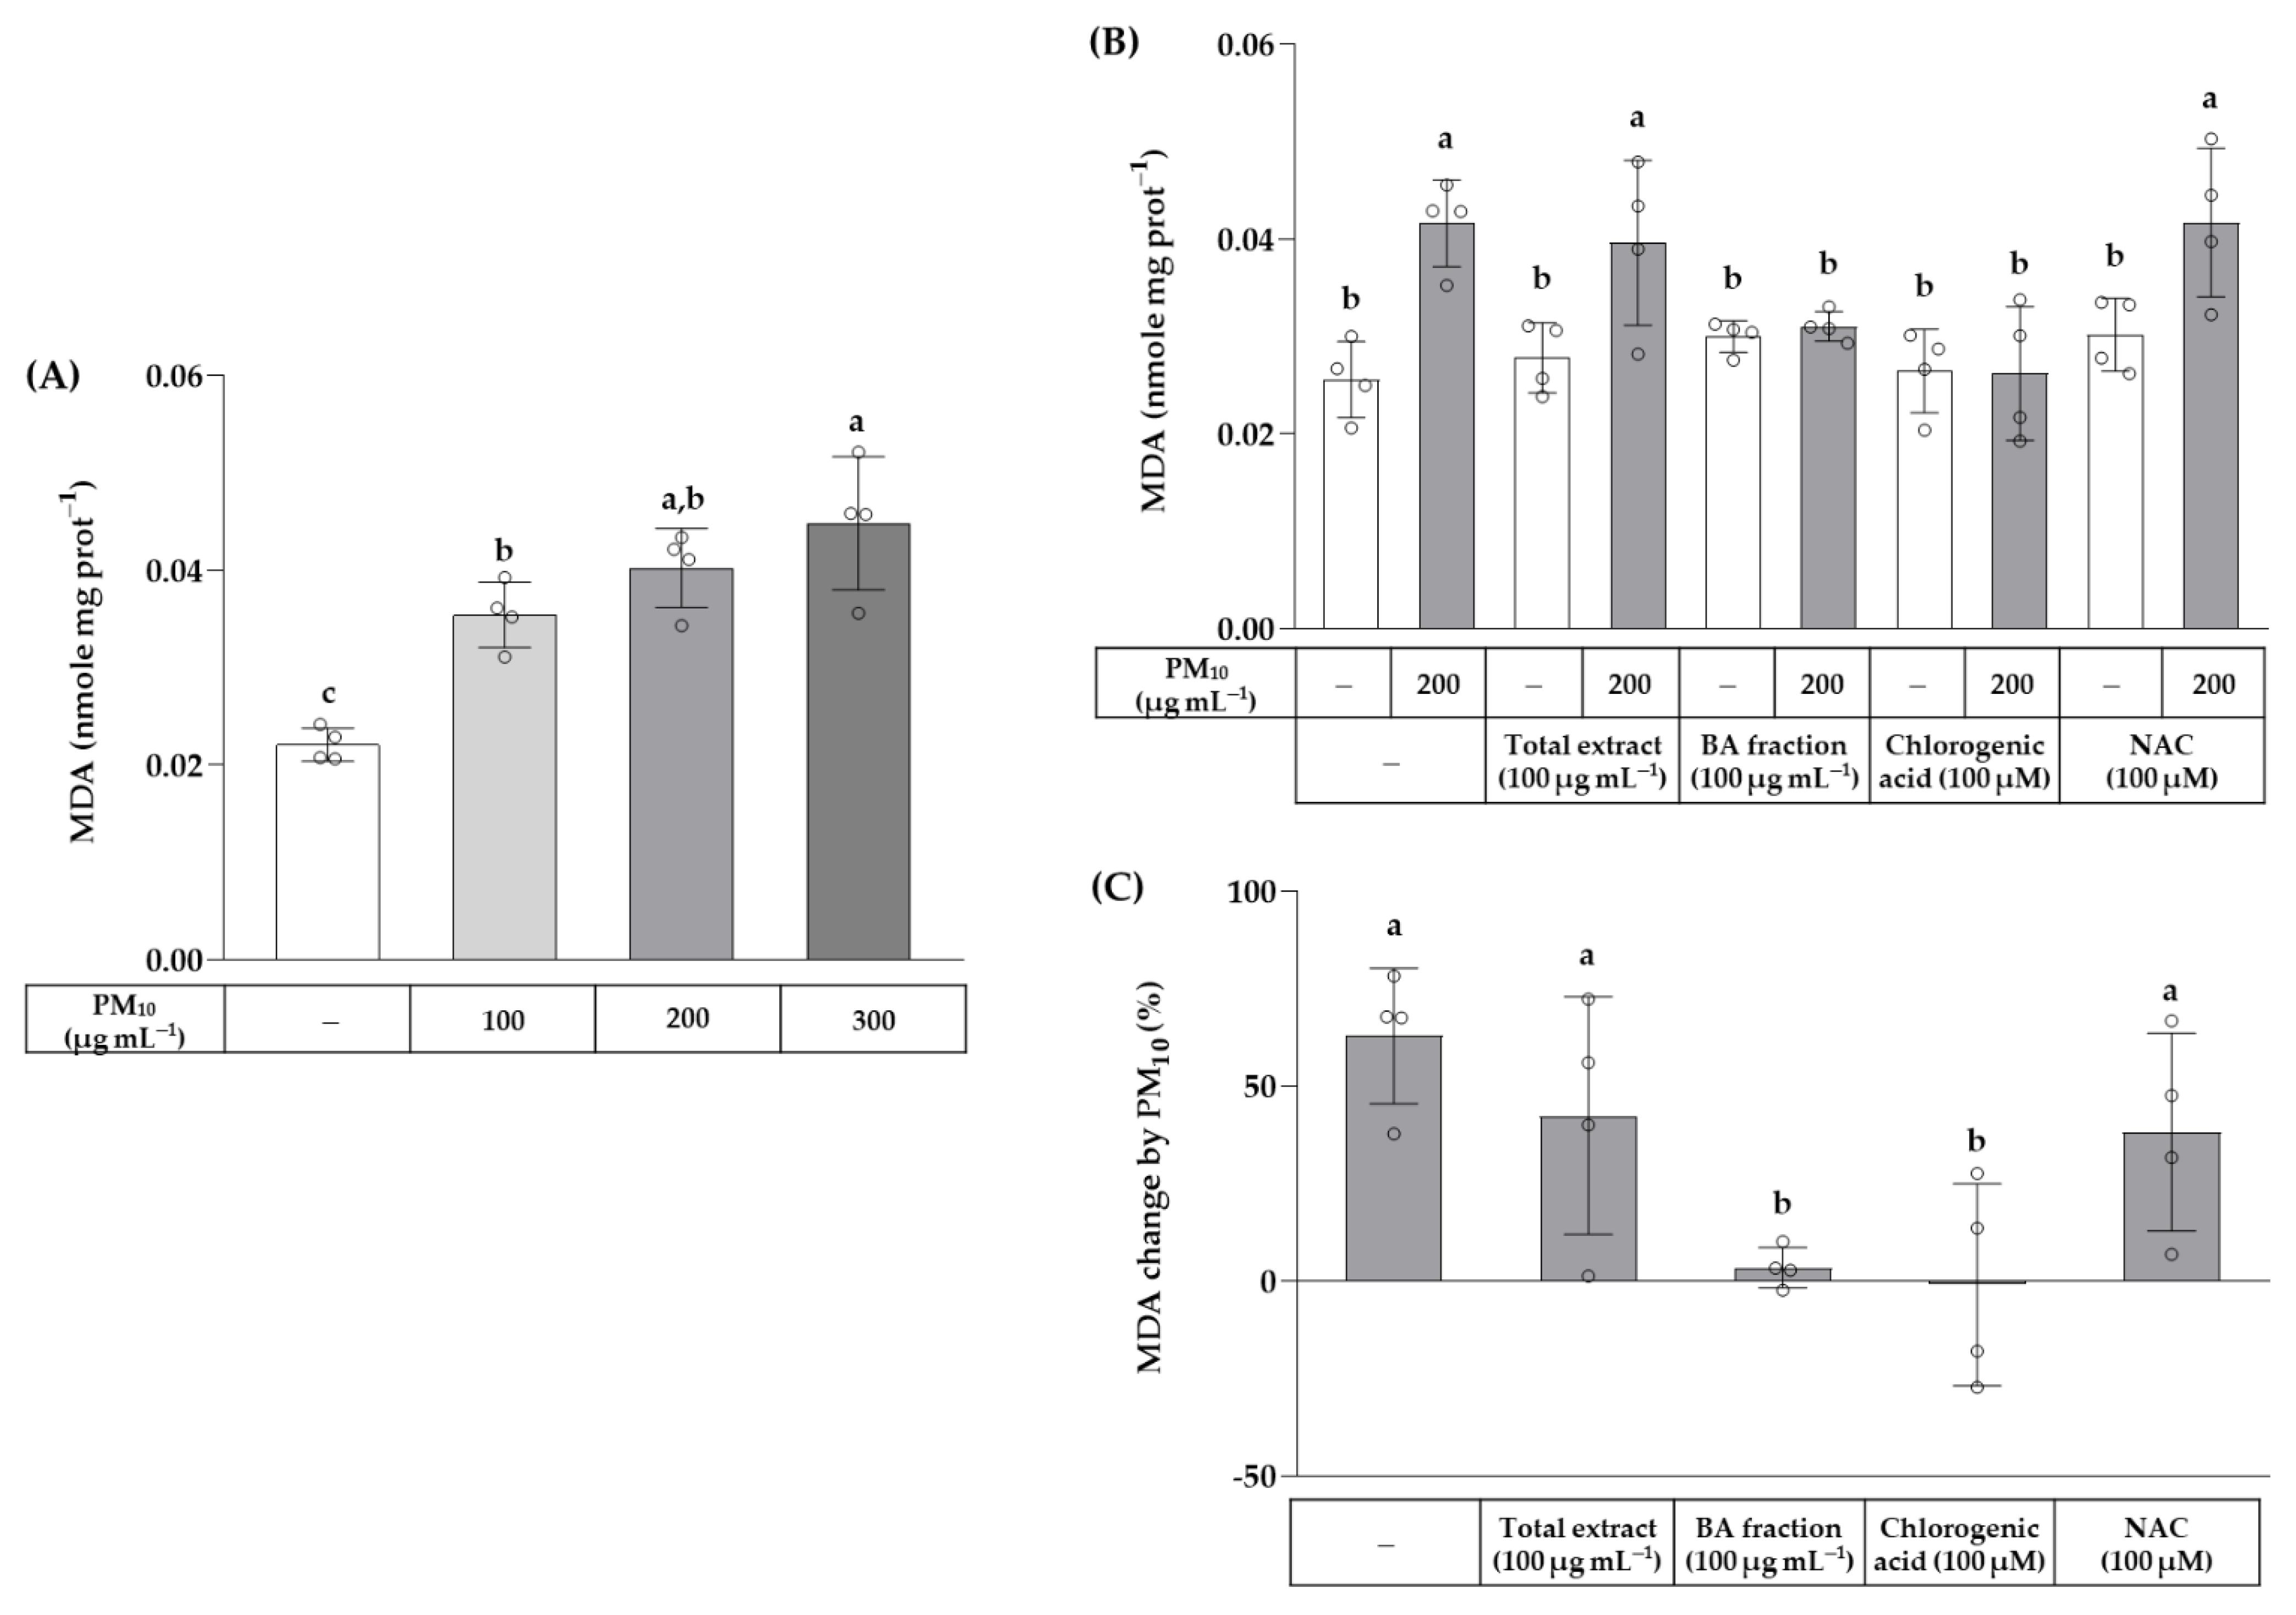
2.7. Cellular Lipid Peroxidation Assay
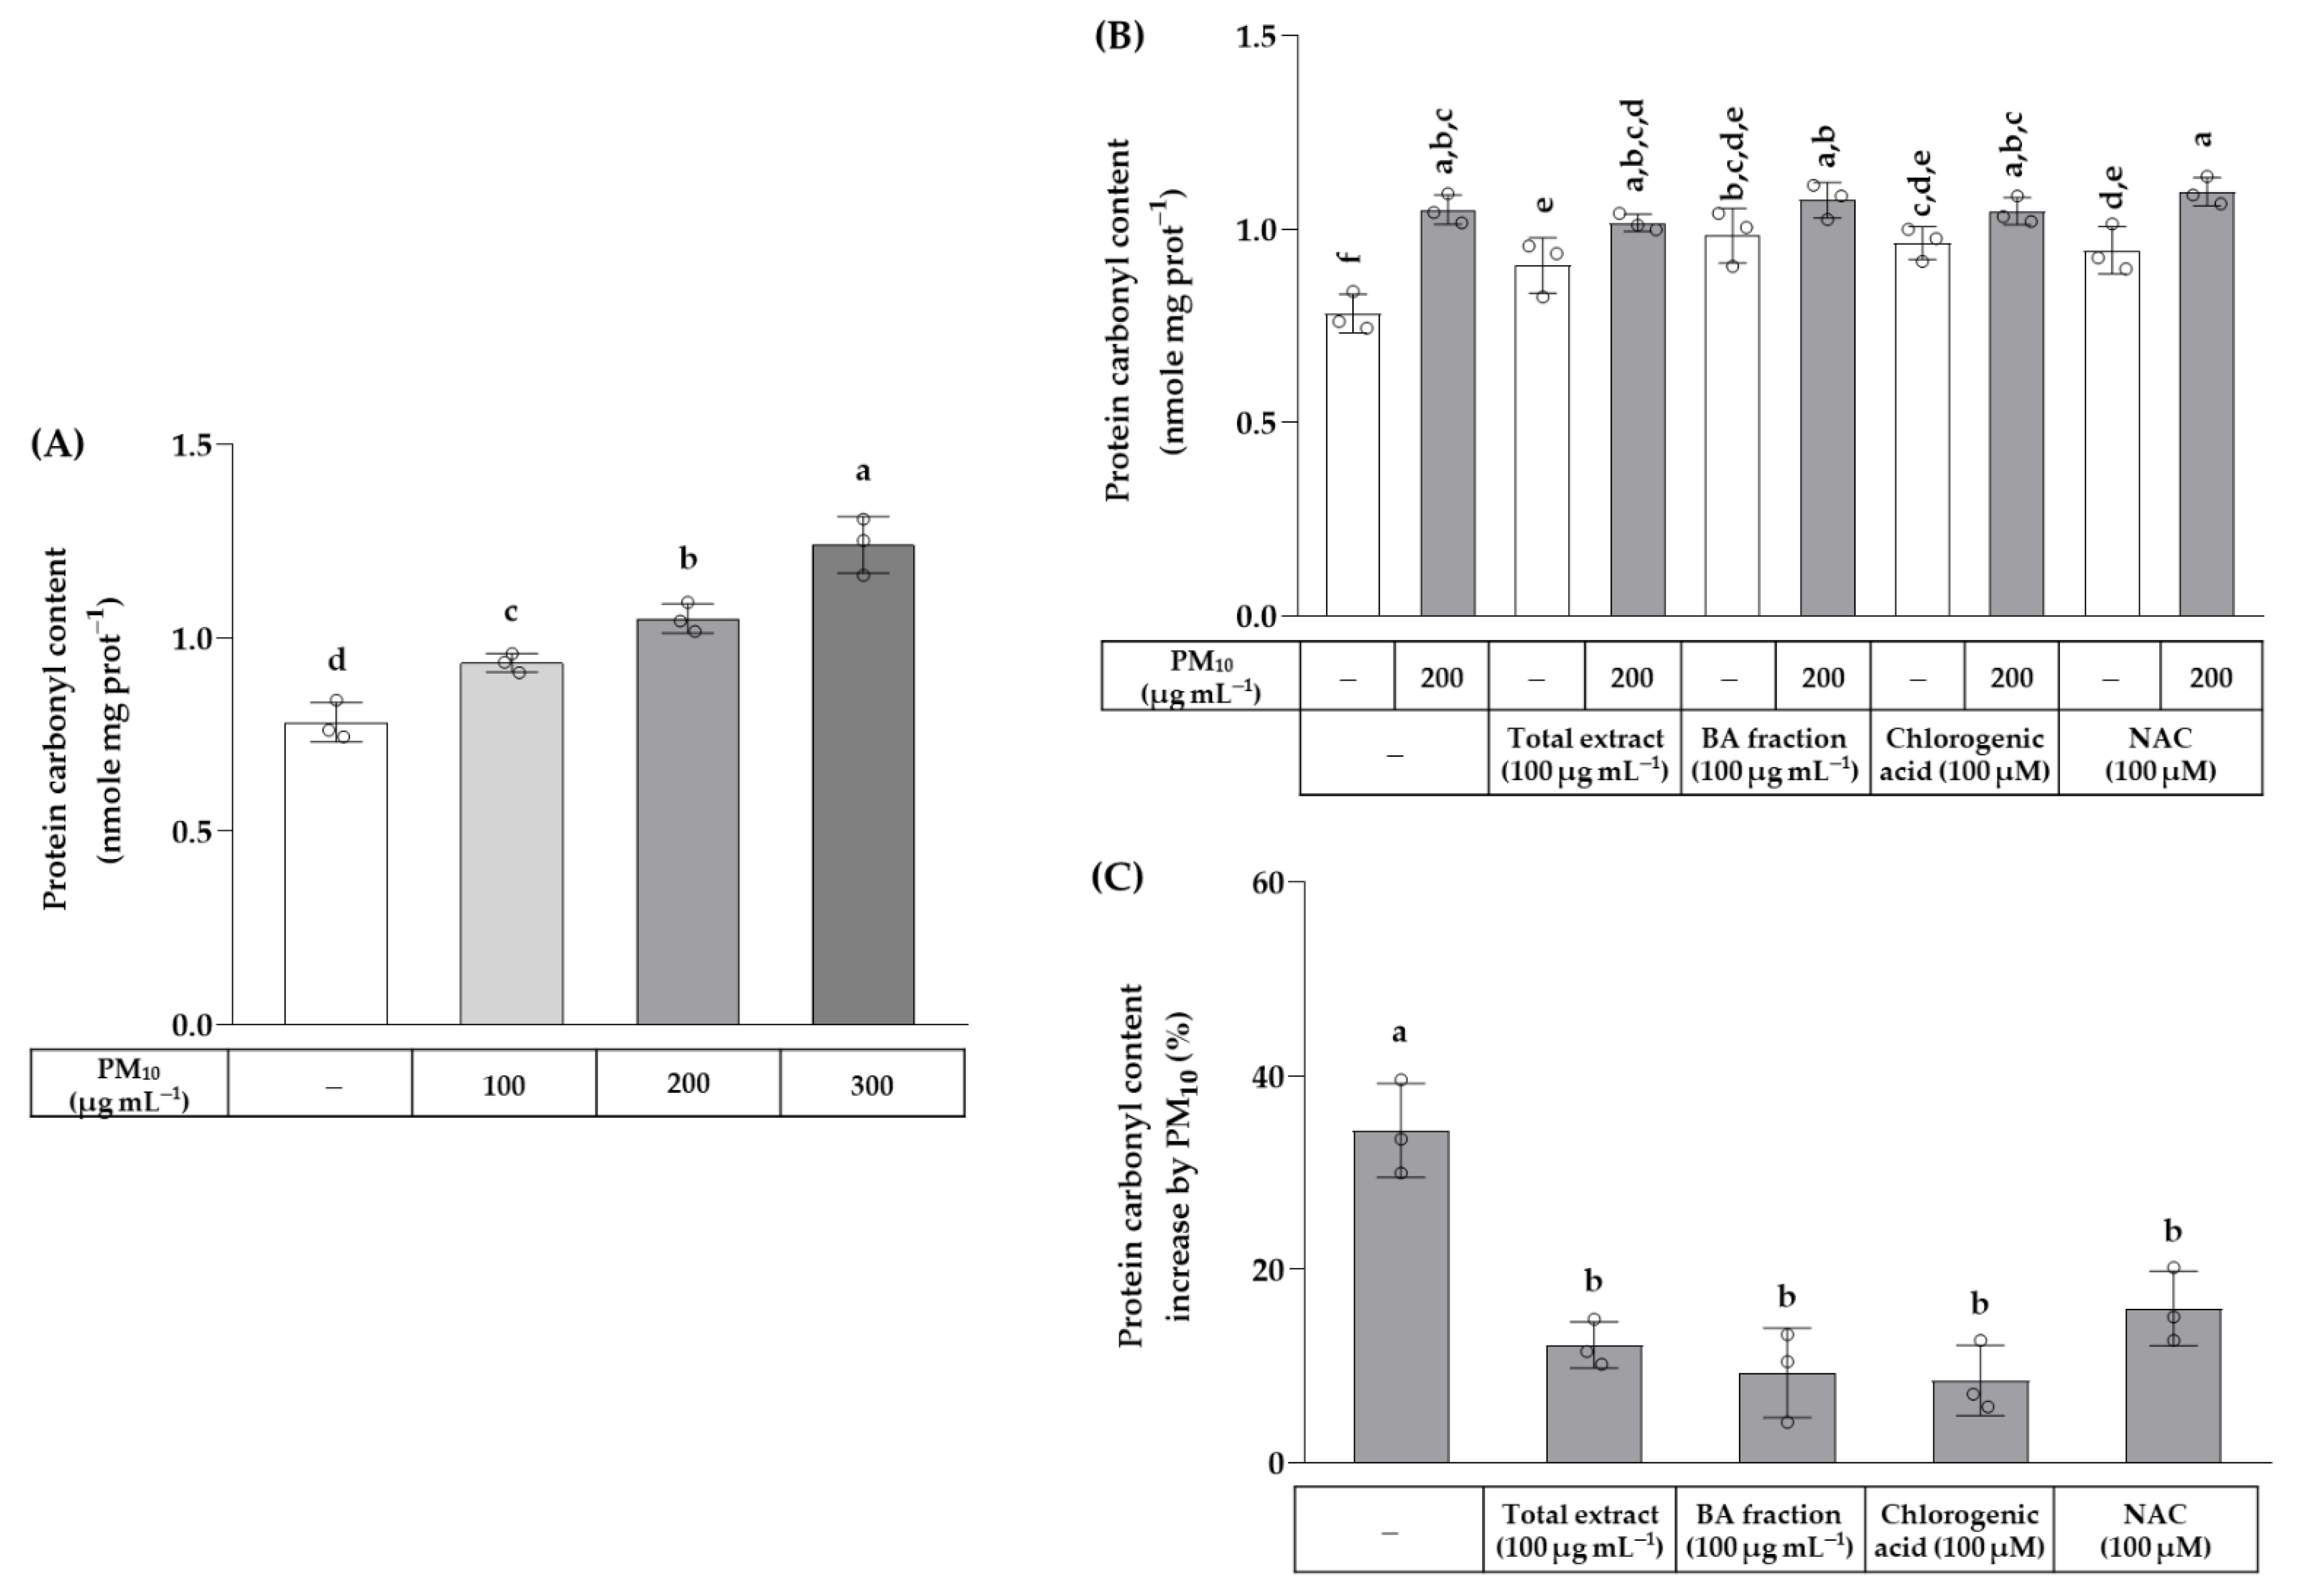
2.8. Protein Carbonylation Assay
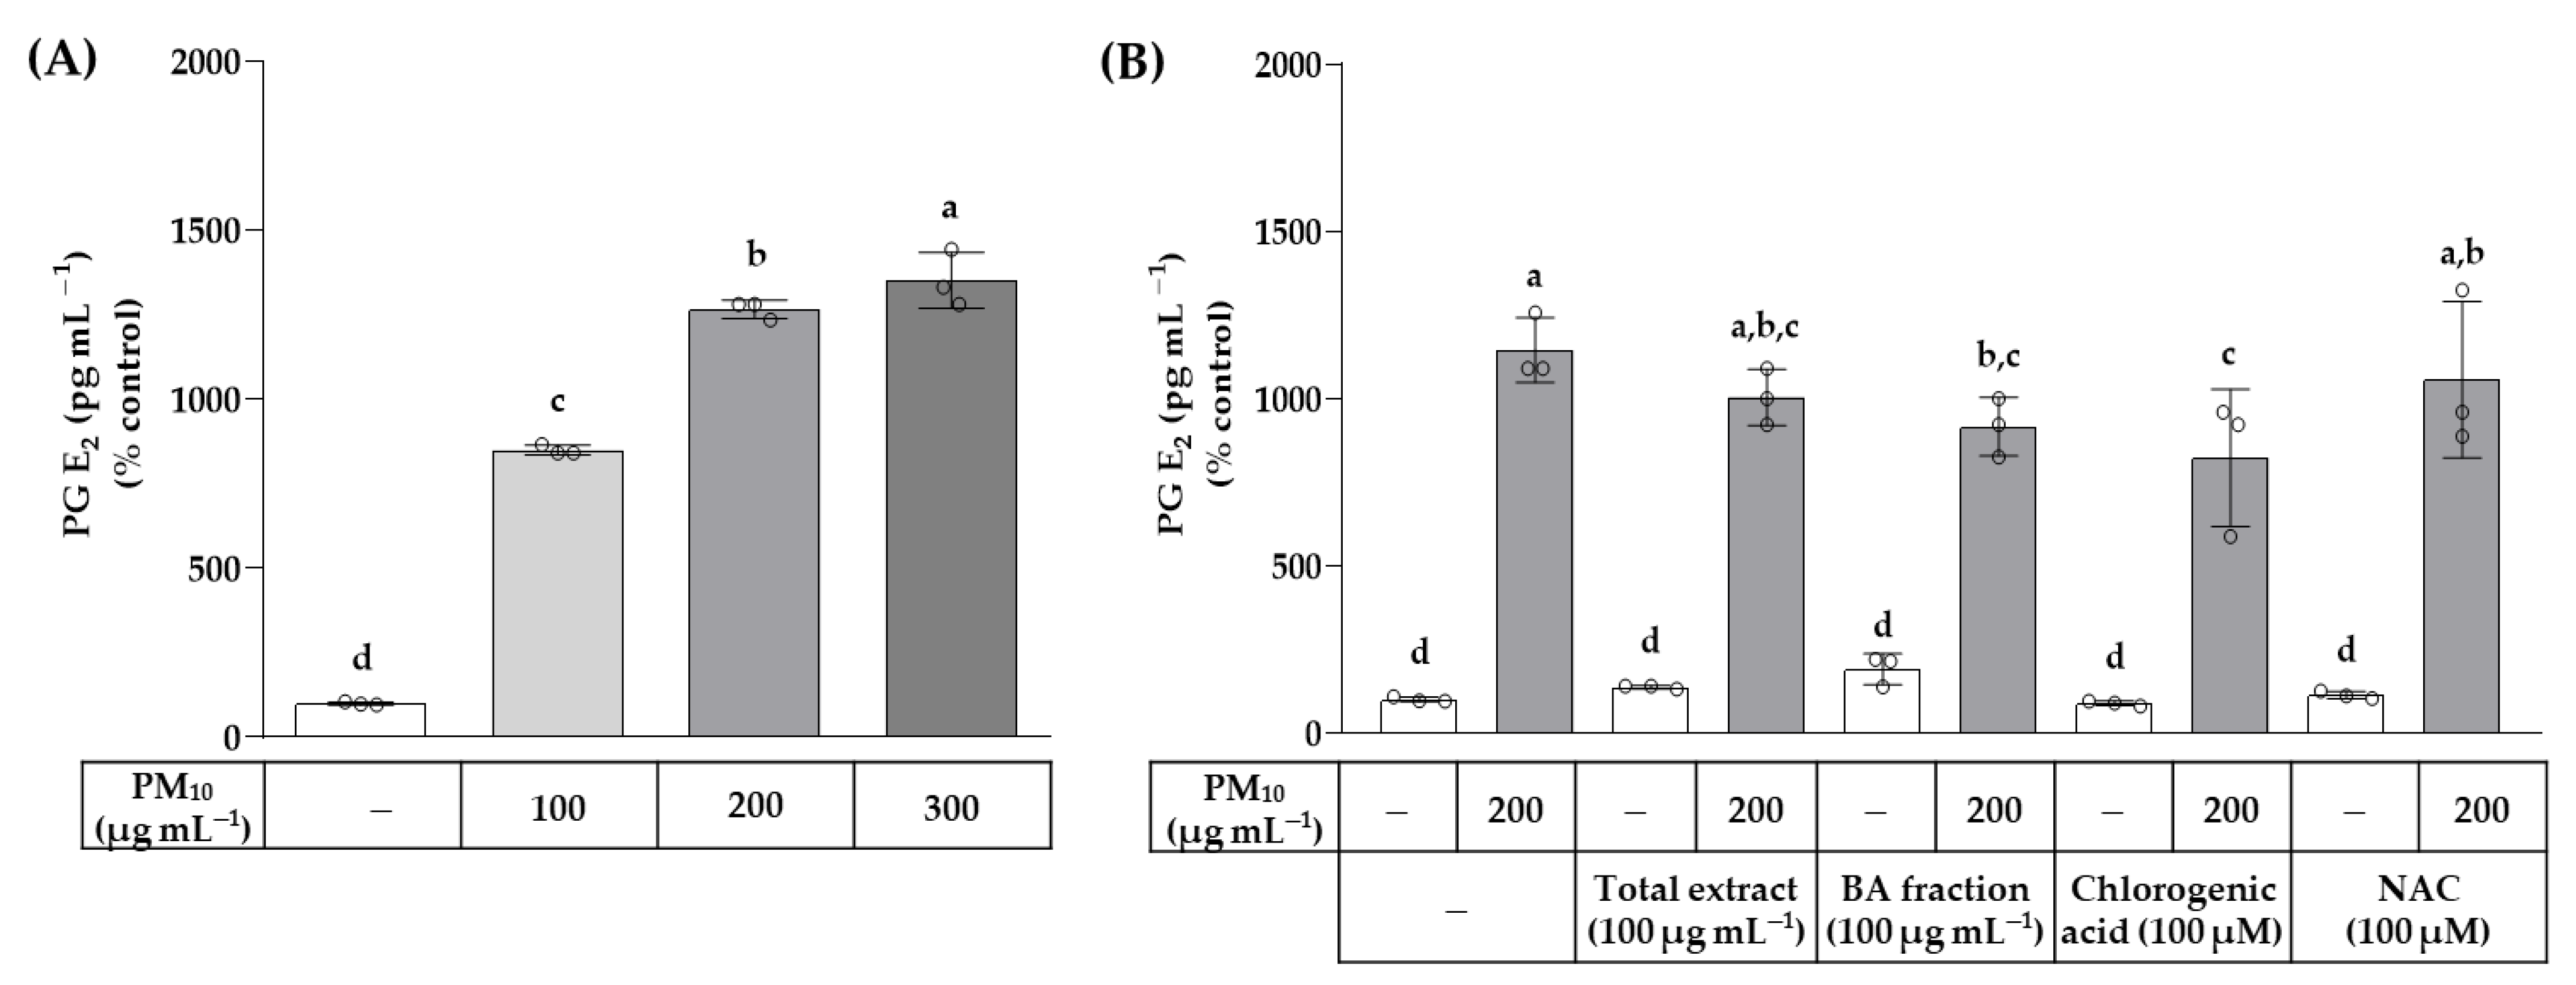
2.9. Enzyme-Linked Immunosorbent Assay (ELISA) for PG E2
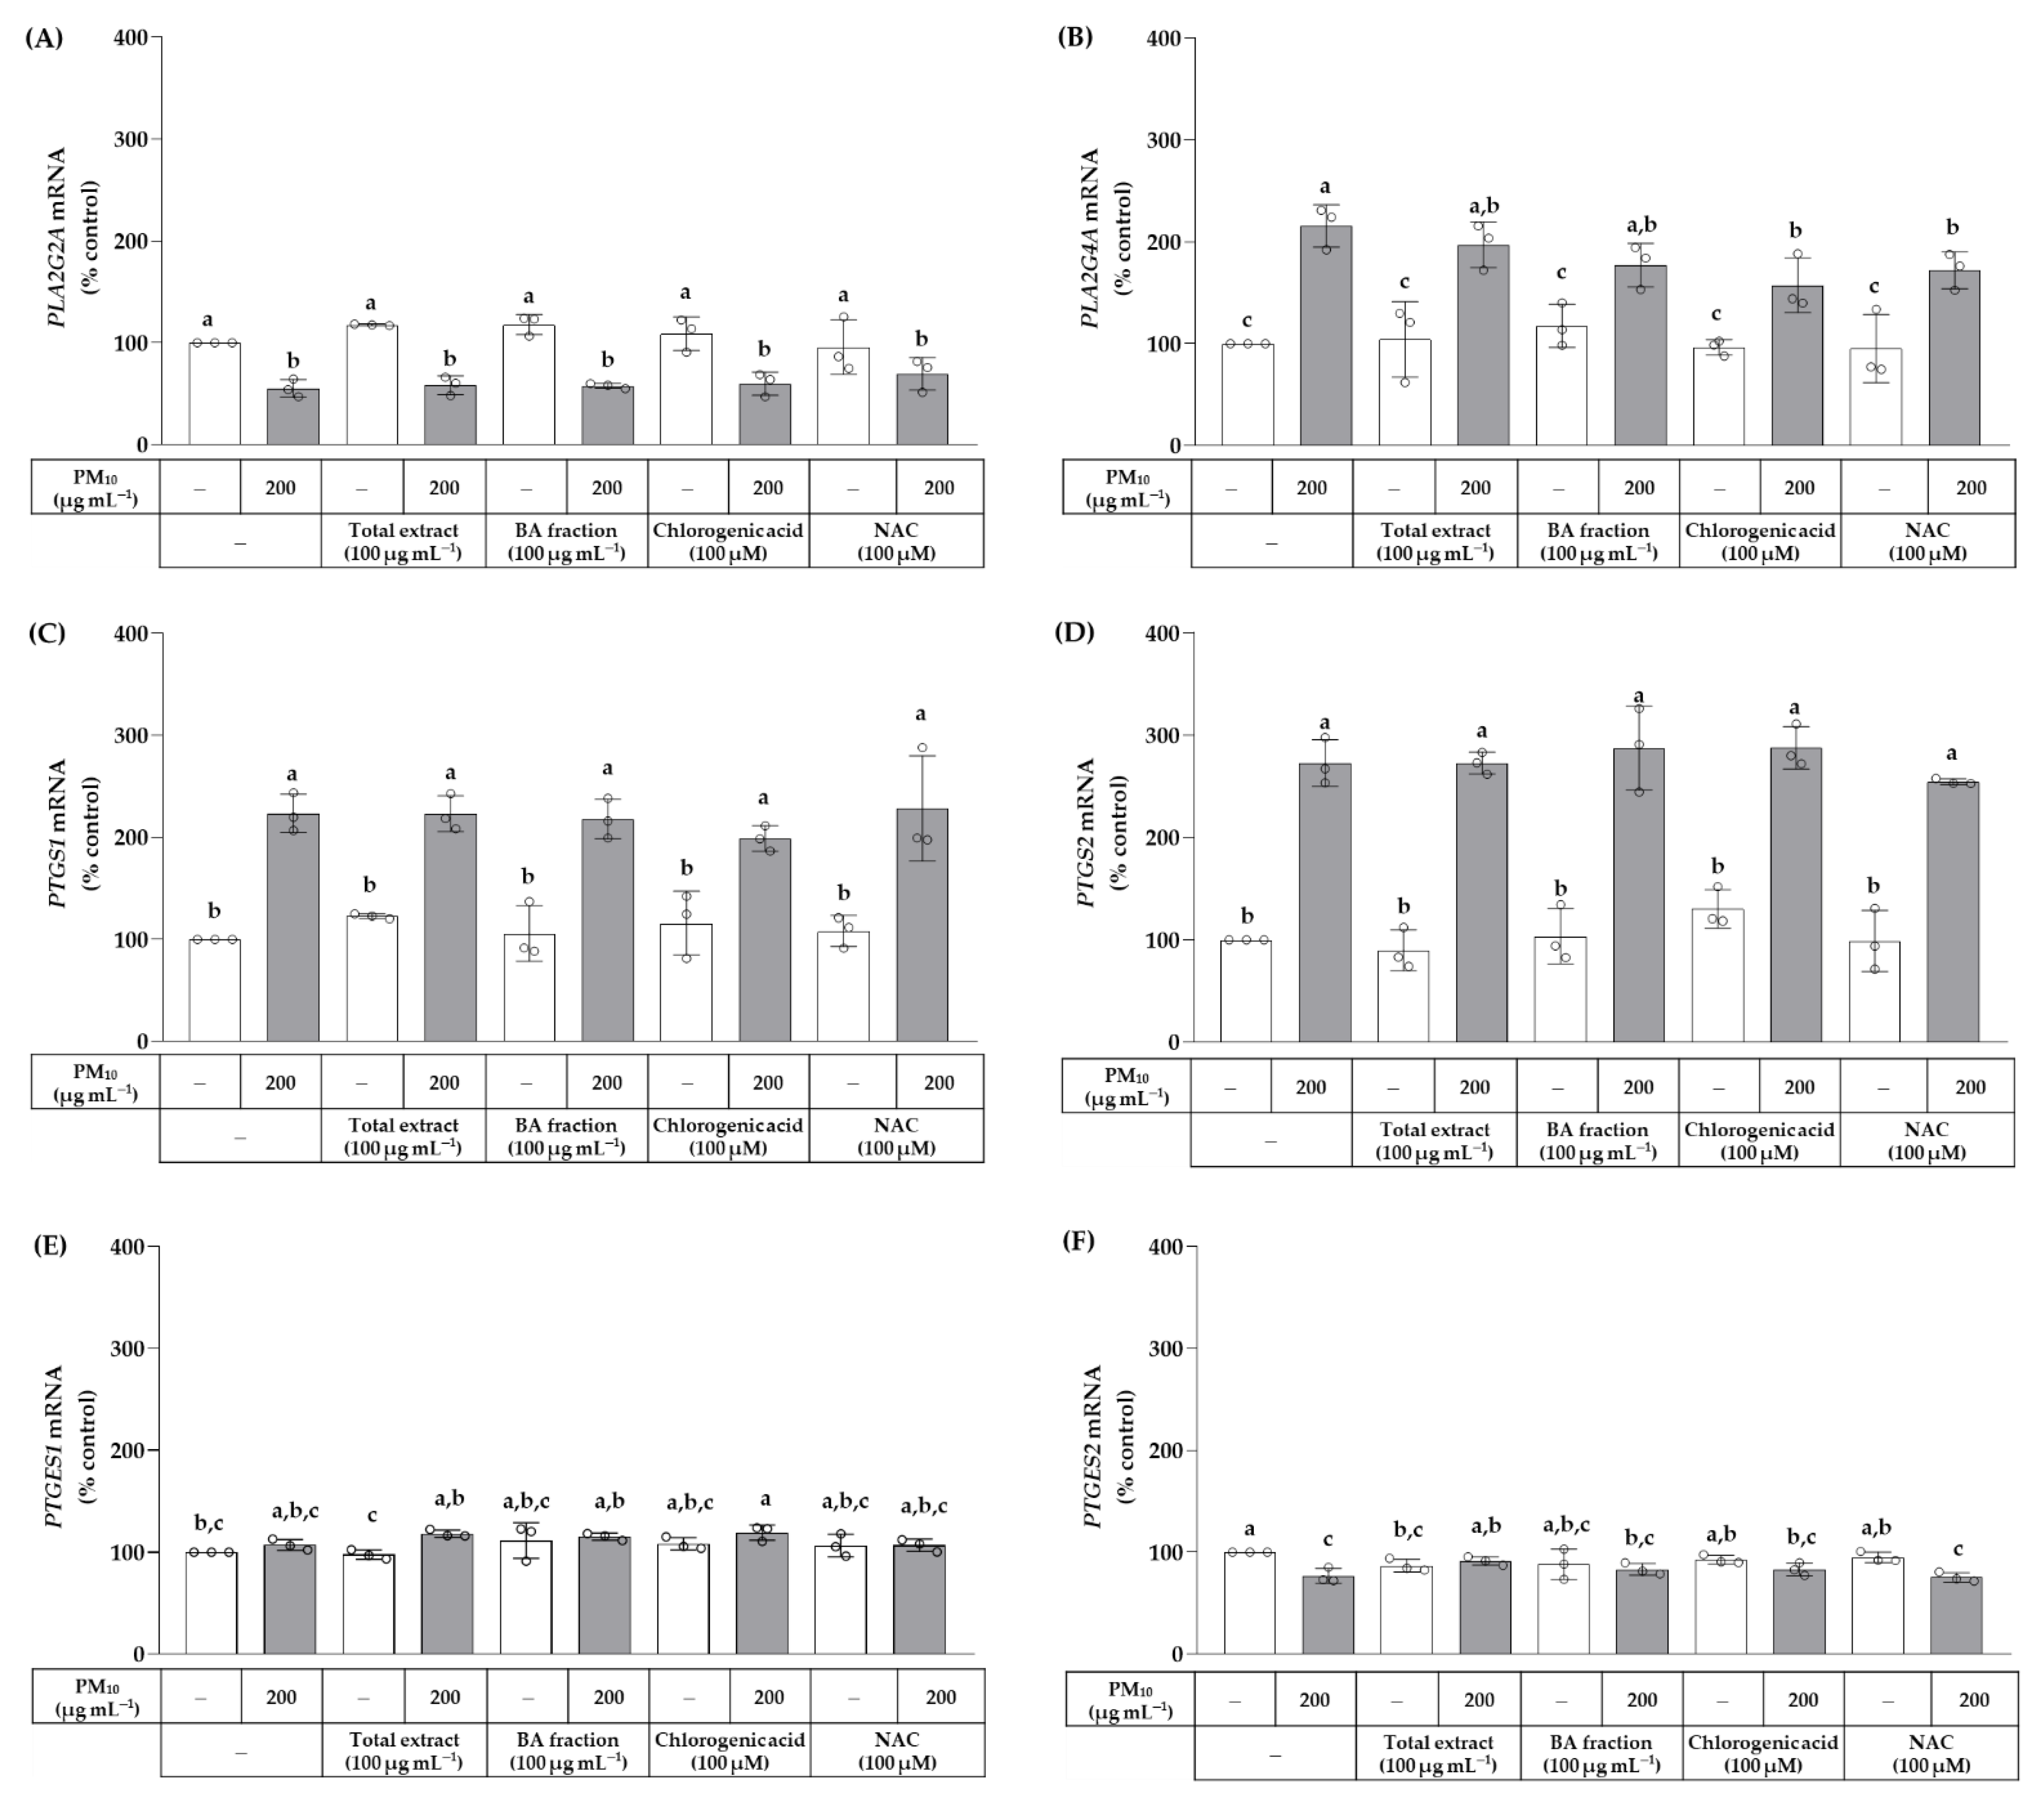
2.10. Quantitative Reverse Transcriptase-Polymerase Chain Reaction (qRT-PCR) Analysis
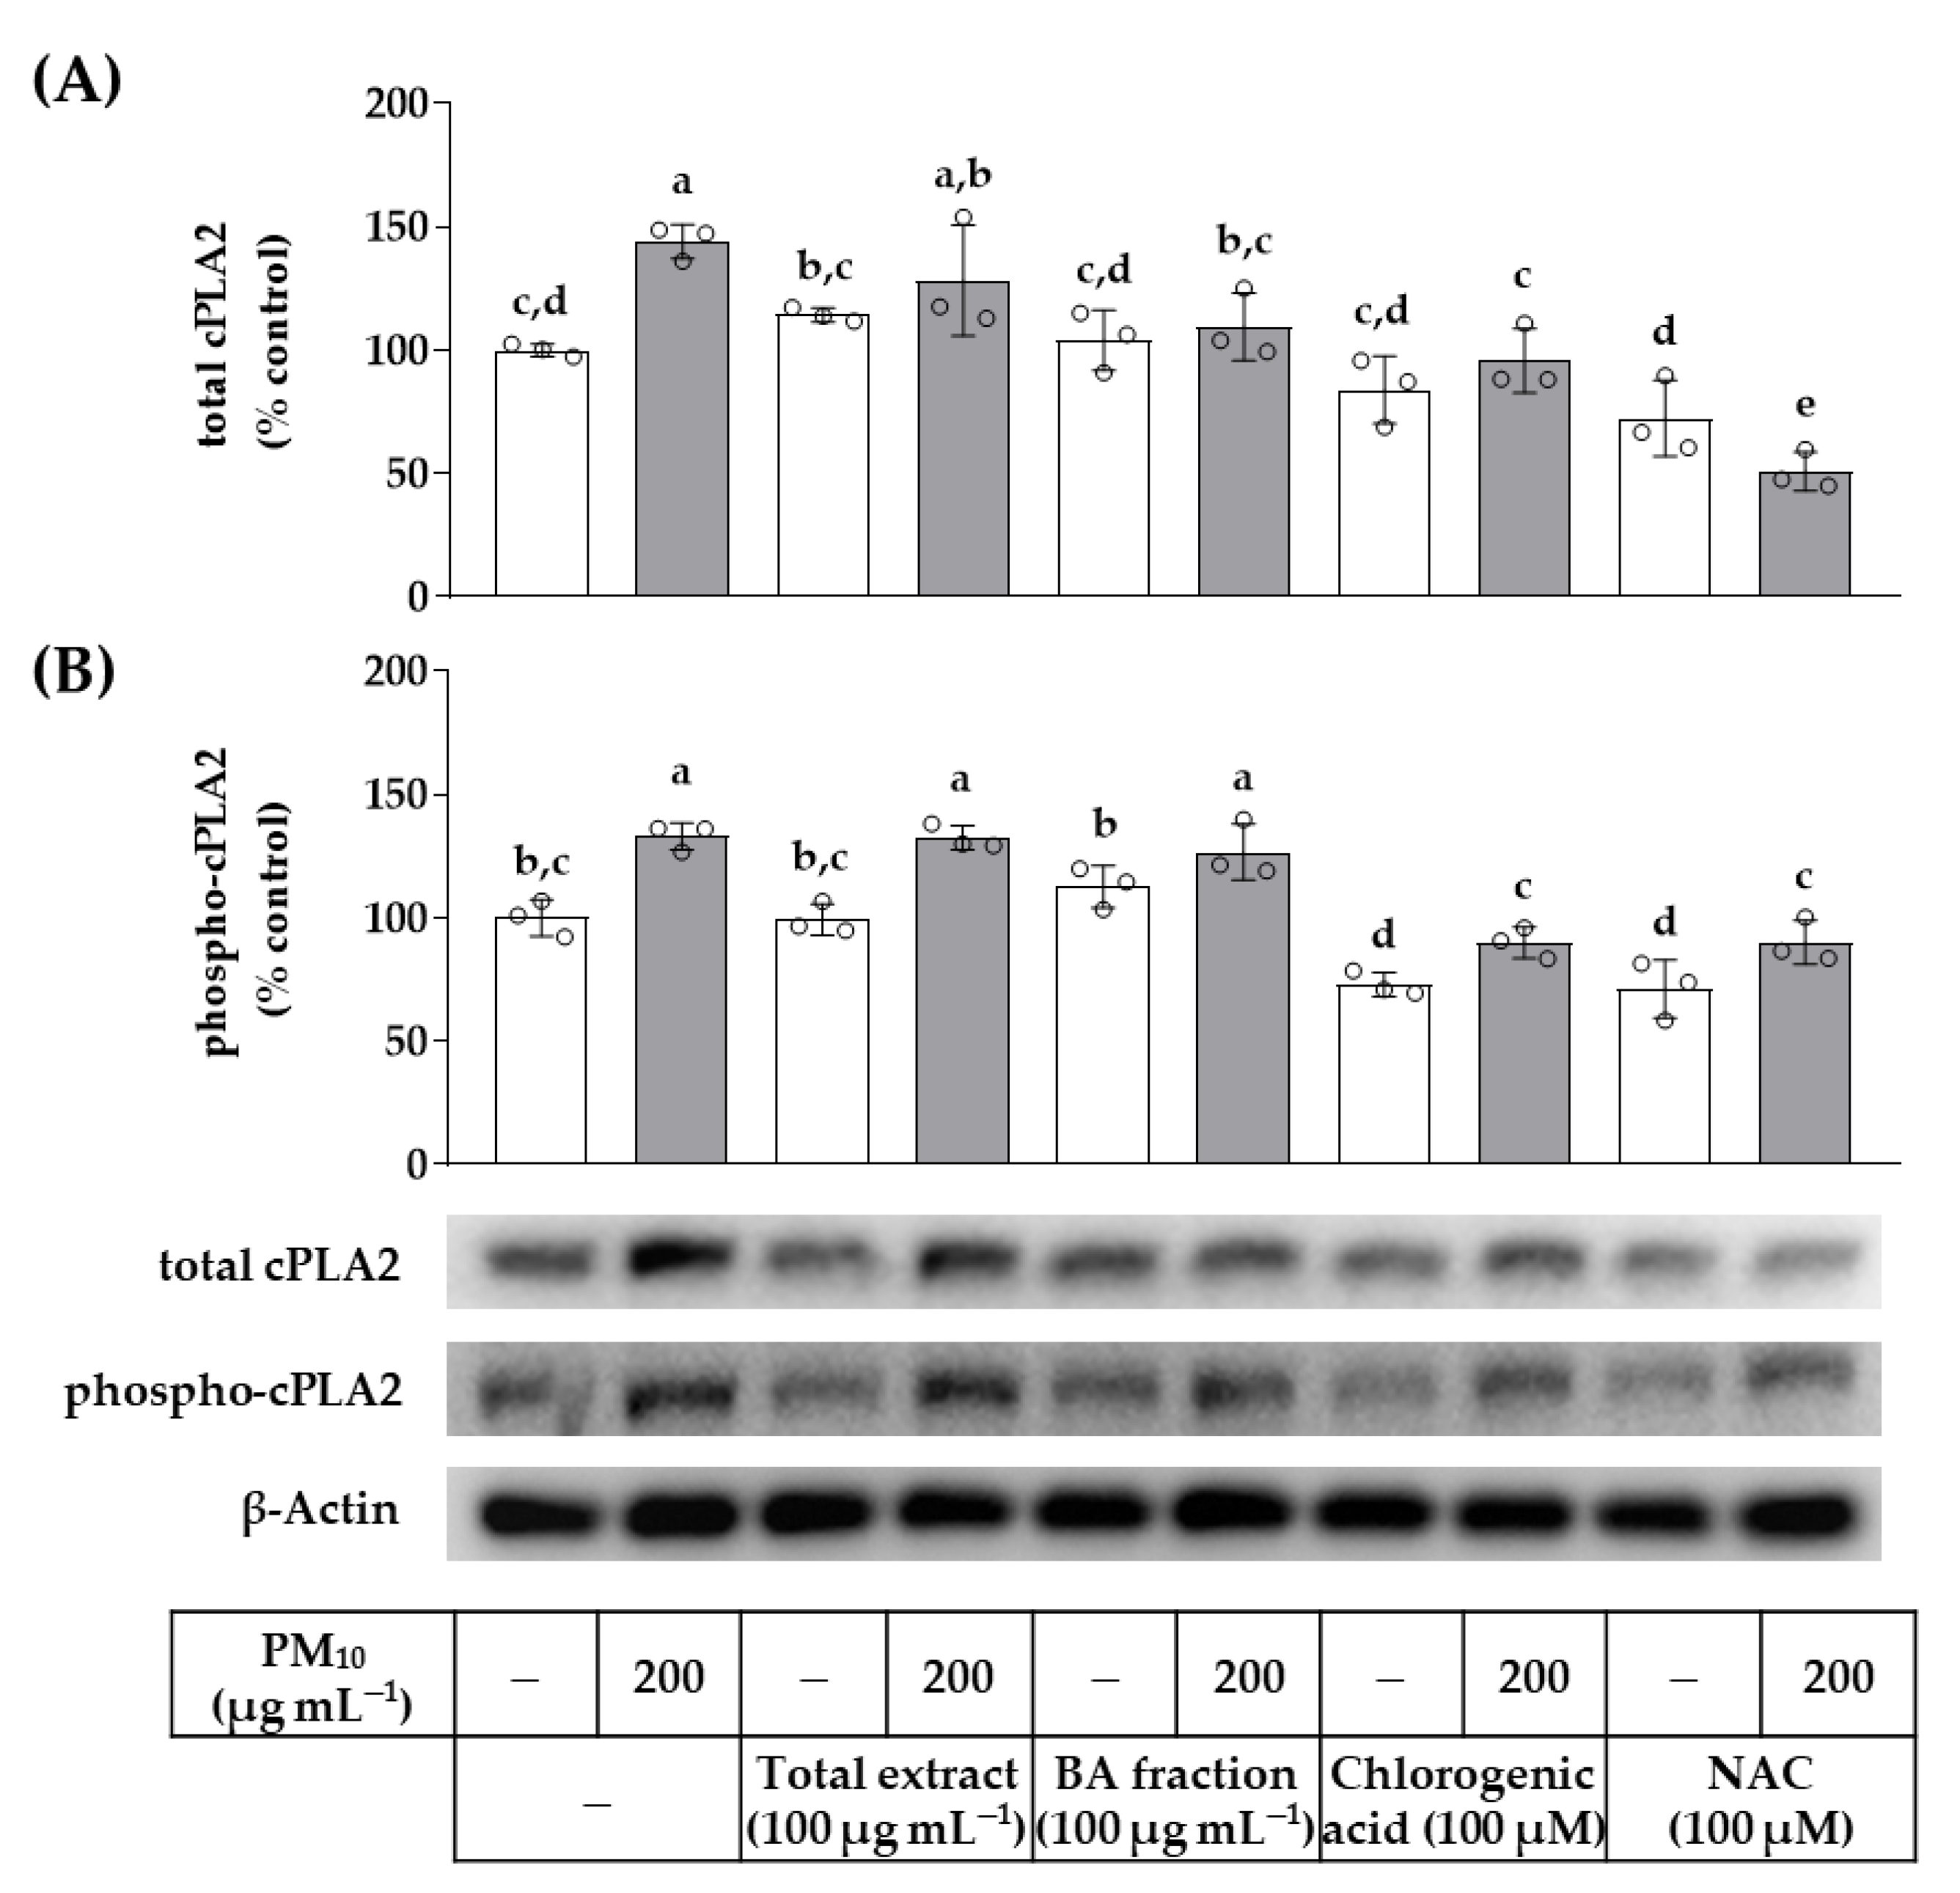
2.11. Western Blotting
2.12. Statistical Analysis
3. Results
4. Discussion
5. Conclusions
Author Contributions
Funding
Institutional Review Board Statement
Informed Consent Statement
Data Availability Statement
Conflicts of Interest
Abbreviations
| BA | n-butanol |
| COX | cyclooxygenase |
| cPLA2 | cytosolic phospholipase A2 |
| DCFH-DA | 2′,7′-dichlorodihydrofluorescein diacetate |
| EA | ethyl acetate |
| ELISA | enzyme-linked immunosorbent assay |
| FTC | fluorescein-5-thiosemicarbazide |
| GAPDH | glyceraldehyde 3-phosphate dehydrogenase |
| HPLC-DAD | high-performance liquid chromatography with photodiode array detection |
| IL | interleukin |
| iNOS | inducible nitric oxide synthase |
| MC | methylene chloride |
| MDA | malondialdehyde |
| MMP | matrix metalloproteinase |
| MTT | 3-[4,5-dimethylthiazol-2-yl]-2,5-diphenyl tetrazolium bromide |
| NAC | N-acetyl cysteine |
| NF-κB | nuclear factor-κB |
| NO | nitric oxide |
| OJ | Oenanthe javanica (Blume) DC. |
| PBS | phosphate-buffered saline |
| PG | prostaglandin |
| PEGS | prostaglandin E synthetase |
| PLA2 | phospholipases A2 |
| PM | particulate matter |
| qRT-PCR | quantitative reverse transcriptase-polymerase chain reaction |
| ROS | reactive oxygen species |
| sPLA2 | secretory phospholipase A2 |
| SOD | superoxide dismutase |
| TNF-α | tumor necrosis factor-α |
| TMP | 1,1,3,3-tetramethoxypropane |
| UV | ultraviolet |
| WT | water |
References
- Zhu, X.; Qiu, H.; Wang, L.; Duan, Z.; Yu, H.; Deng, R.; Zhang, Y.; Zhou, L. Risks of hospital admissions from a spectrum of causes associated with particulate matter pollution. Sci. Total Environ. 2019, 656, 90–100. [Google Scholar] [CrossRef] [PubMed]
- Fuzzi, S.; Baltensperger, U.; Carslaw, K.; Decesari, S.; van Der Gon, H.D.; Facchini, M.C.; Fowler, D.; Koren, I.; Langford, B.; Lohmann, U.; et al. Particulate matter, air quality and climate: Lessons learned and future needs. Atmos. Chem. Phys. 2015, 15, 8217–8299. [Google Scholar] [CrossRef] [Green Version]
- Song, S.; Lee, K.; Lee, Y.M.; Lee, J.H.; Lee, S.I.; Yu, S.D.; Paek, D. Acute health effects of urban fine and ultrafine particles on children with atopic dermatitis. Environ. Res. 2011, 111, 394–399. [Google Scholar] [CrossRef]
- Jin, S.P.; Li, Z.; Choi, E.K.; Lee, S.; Kim, Y.K.; Seo, E.Y.; Chung, J.H.; Cho, S. Urban particulate matter in air pollution penetrates into the barrier-disrupted skin and produces ROS-dependent cutaneous inflammatory response in vivo. J. Dermatol. Sci. 2018, 91, 175–183. [Google Scholar] [CrossRef] [PubMed] [Green Version]
- Ngoc, L.T.N.; Park, D.; Lee, Y.; Lee, Y.C. Systematic Review and Meta-Analysis of Human Skin Diseases Due to Particulate Matter. Int. J. Environ. Res. Public Health 2017, 14, 1458. [Google Scholar] [CrossRef] [Green Version]
- Kim, K.E.; Cho, D.; Park, H.J. Air pollution and skin diseases: Adverse effects of airborne particulate matter on various skin diseases. Life Sci. 2016, 152, 126–134. [Google Scholar] [CrossRef]
- Vierkotter, A.; Schikowski, T.; Ranft, U.; Sugiri, D.; Matsui, M.; Kramer, U.; Krutmann, J. Airborne particle exposure and extrinsic skin aging. J. Investig. Dermatol. 2010, 130, 2719–2726. [Google Scholar] [CrossRef] [Green Version]
- Roberts, W.E. Pollution as a risk factor for the development of melasma and other skin disorders of facial hyperpigmentation is there a case to be made? J. Drugs Dermatol. 2015, 14, 337–341. [Google Scholar]
- Soeur, J.; Belaidi, J.P.; Chollet, C.; Denat, L.; Dimitrov, A.; Jones, C.; Perez, P.; Zanini, M.; Zobiri, O.; Mezzache, S.; et al. Photo-pollution stress in skin: Traces of pollutants (PAH and particulate matter) impair redox homeostasis in keratinocytes exposed to UVA1. J. Dermatol. Sci. 2017, 86, 162–169. [Google Scholar] [CrossRef]
- Datzmann, T.; Markevych, I.; Trautmann, F.; Heinrich, J.; Schmitt, J.; Tesch, F. Outdoor air pollution, green space, and cancer incidence in Saxony: A semi-individual cohort study. BMC Public Health 2018, 18, 715. [Google Scholar] [CrossRef]
- Lee, D.U.; Ji, M.J.; Kang, J.Y.; Kyung, S.Y.; Hong, J.H. Dust particles-induced intracellular Ca2+ signaling and reactive Oxygen species in lung fibroblast cell line MRC5. Korean J. Physiol. Pharmacol. 2017, 21, 327–334. [Google Scholar] [CrossRef] [Green Version]
- Seok, J.K.; Cho, M.A.; Ha, J.W.; Boo, Y.C. Role of Dual Oxidase 2 in Reactive Oxygen Species Production Induced by Airborne Particulate Matter PM10 in Human Epidermal Keratinocytes. J. Soc. Cosmet. Sci. Korea 2018, 45, 57–67. [Google Scholar]
- Tsuji, G.; Takahara, M.; Uchi, H.; Takeuchi, S.; Mitoma, C.; Moroi, Y.; Furue, M. An environmental contaminant, benzo(a)pyrene, induces oxidative stress-mediated interleukin-8 production in human keratinocytes via the aryl hydrocarbon receptor signaling pathway. J. Dermatol. Sci. 2011, 62, 42–49. [Google Scholar] [CrossRef]
- Verma, V.; Shafer, M.M.; Schauer, J.J.; Sioutas, C. Contribution of transition metals in the reactive oxygen species activity of PM emissions from retrofitted heavy-duty vehicles. Atmos. Environ. 2010, 44, 5165–5173. [Google Scholar] [CrossRef]
- Ryu, Y.S.; Kang, K.A.; Piao, M.J.; Ahn, M.J.; Yi, J.M.; Hyun, Y.M.; Kim, S.H.; Ko, M.K.; Park, C.O.; Hyun, J.W. Particulate matter induces inflammatory cytokine production via activation of NFkappaB by TLR5-NOX4-ROS signaling in human skin keratinocyte and mouse skin. Redox Biol. 2019, 21, 101080. [Google Scholar] [CrossRef]
- Xiao, X.; Wang, R.; Cao, L.; Shen, Z.X.; Cao, Y.X. The Role of MAPK Pathways in Airborne Fine Particulate Matter-Induced Upregulation of Endothelin Receptors in Rat Basilar Arteries. Toxicol. Sci. 2016, 149, 213–226. [Google Scholar] [CrossRef] [Green Version]
- Lee, C.W.; Lin, Z.C.; Hsu, L.F.; Fang, J.Y.; Chiang, Y.C.; Tsai, M.H.; Lee, M.H.; Li, S.Y.; Hu, S.C.; Lee, I.T.; et al. Eupafolin ameliorates COX-2 expression and PGE2 production in particulate pollutants-exposed human keratinocytes through ROS/MAPKs pathways. J. Ethnopharmacol. 2016, 189, 300–309. [Google Scholar] [CrossRef]
- Ha, J.W.; Song, H.; Hong, S.S.; Boo, Y.C. Marine Alga Ecklonia cava Extract and Dieckol Attenuate Prostaglandin E2 Production in HaCaT Keratinocytes Exposed to Airborne Particulate Matter. Antioxidants 2019, 8, 190. [Google Scholar] [CrossRef] [Green Version]
- Seok, J.K.; Lee, J.W.; Kim, Y.M.; Boo, Y.C. Punicalagin and (−)-Epigallocatechin-3-Gallate Rescue Cell Viability and Attenuate Inflammatory Responses of Human Epidermal Keratinocytes Exposed to Airborne Particulate Matter PM10. Skin Pharmacol. Physiol. 2018, 31, 134–143. [Google Scholar] [CrossRef]
- Kim, M.; Kim, J.H.; Jeong, G.J.; Park, K.Y.; Lee, M.K.; Seo, S.J. Particulate matter induces pro-inflammatory cytokines via phosphorylation of p38 MAPK possibly leading to dermal inflammaging. Exp. Dermatol. 2019, 28, 809–815. [Google Scholar] [CrossRef]
- Lee, C.W.; Lin, Z.C.; Hu, S.C.; Chiang, Y.C.; Hsu, L.F.; Lin, Y.C.; Lee, I.T.; Tsai, M.H.; Fang, J.Y. Urban particulate matter down-regulates filaggrin via COX2 expression/PGE2 production leading to skin barrier dysfunction. Sci. Rep. 2016, 6, 27995. [Google Scholar] [CrossRef] [PubMed] [Green Version]
- Alfaro-Moreno, E.; Martinez, L.; Garcia-Cuellar, C.; Bonner, J.C.; Murray, J.C.; Rosas, I.; Rosales, S.P.; Osornio-Vargas, A.R. Biologic effects induced in vitro by PM10 from three different zones of Mexico City. Environ. Health Perspect. 2002, 110, 715–720. [Google Scholar] [CrossRef] [PubMed]
- Boo, Y.C. Can Plant Phenolic Compounds Protect the Skin from Airborne Particulate Matter? Antioxidants 2019, 8, 379. [Google Scholar] [CrossRef] [Green Version]
- Boo, Y.C. Natural Nrf2 Modulators for Skin Protection. Antioxidants 2020, 9, 812. [Google Scholar] [CrossRef] [PubMed]
- Ha, J.W.; Boo, Y.C. Siegesbeckiae Herba Extract and Chlorogenic Acid Ameliorate the Death of HaCaT Keratinocytes Exposed to Airborne Particulate Matter by Mitigating Oxidative Stress. Antioxidants 2021, 10, 1762. [Google Scholar] [CrossRef]
- Bae, I.A.; Ha, J.W.; Choi, J.Y.; Boo, Y.C. Antioxidant Effects of Korean Propolis in HaCaT Keratinocytes Exposed to Particulate Matter 10. Antioxidants 2022, 11, 781. [Google Scholar] [CrossRef]
- Lu, C.L.; Li, X.F. A Review of Oenanthe javanica (Blume) DC. as Traditional Medicinal Plant and Its Therapeutic Potential. Evid.-Based Complement. Altern. Med. 2019, 2019, 6495819. [Google Scholar] [CrossRef] [Green Version]
- Liu, J.X.; Jiang, Q.; Tao, J.P.; Feng, K.; Li, T.; Duan, A.Q.; Wang, H.; Xu, Z.S.; Liu, H.; Xiong, A.S. Integrative genome, transcriptome, microRNA, and degradome analysis of water dropwort (Oenanthe javanica) in response to water stress. Hortic. Res. 2021, 8, 262. [Google Scholar] [CrossRef]
- Hwang, C.-R.; Hwang, I.-G.; Kim, H.-Y.; Kang, T.-S.; Kim, Y.-B.; Joo, S.-S.; Lee, J.-S.; Jeong, H.-S. Antioxidant Component and Activity of Dropwort (Oenanthe javanica) Ethanol Extracts. J. Korean Soc. Food Sci. Nutr. 2011, 40, 316–320. [Google Scholar] [CrossRef]
- Hwang, S.-J.; Park, S.-J.; Kim, J.-D. Component Analysis and Antioxidant Activity of Oenanthe javanica Extracts. Korean J. Food Sci. Technol. 2013, 45, 227–234. [Google Scholar] [CrossRef] [Green Version]
- Bae, U.-J.; Jang, H.-N.; Lee, S.-H.; Kim, J.-Y.; Kim, G.-C. Oenanthe javanica Ethanolic Extract Alleviates Inflammation and Modifies Gut Microbiota in Mice with DSS-Induced Colitis. Antioxidants 2022, 11, 2429. [Google Scholar] [CrossRef]
- Lee, D.H.; Lee, J.S.; Lee, I.H.; Hong, J.T. Therapeutic potency of fermented field water-dropwort (Oenanthe javanica (Blume) DC.) in ethanol-induced liver injury. RSC Adv. 2020, 10, 1544–1551. [Google Scholar] [CrossRef]
- Lee, C.-H.; Park, J.-H.; Cho, J.-H.; Kim, I.-H.; Ahn, J.-H.; Lee, J.-C.; Chen, B.H.; Shin, B.-N.; Tae, H.-J.; Bae, E.J.; et al. Effect of Oenanthe Javanica Extract on Antioxidant Enzyme in the Rat Liver. Chin. Med. J. 2015, 128, 1649–1654. [Google Scholar] [CrossRef]
- Kim, J.Y.; Kim, K.H.; Lee, Y.J.; Lee, S.H.; Park, J.C.; Nam, D.H. Oenanthe javanica extract accelerates ethanol metabolism in ethanol-treated animals. BMB Rep. 2009, 42, 482–485. [Google Scholar] [CrossRef] [Green Version]
- Lee, J.-M.; Kim, N.-J.; Cho, D.-H.; Chung, M.-Y.; Hwang, K.-T.; Kim, H.-J.; Jun, W.-J.; Park, C.-S. Ethanol Extract of Oenanthe javanica Modulates Inflammatory Response by Inhibiting NF-kappaB Mediated Cyclooxygenase-2 Expression in RAW 264.7 Macrophage. Food Sci. Biotechnol. 2006, 15, 303–307. [Google Scholar]
- Lee, J.; Kim, H.J.; Choi, H.; You, Y.; Hwang, K.T.; Lee, M.Y.; Park, C.S.; Jun, W. Effects of Oenanthe javanica on transcriptional regulation of COX-2 by inhibiting translocation of p65 subunit in LPS-stimulated murine peritoneal macrophages. Food Sci. Biotechnol. 2006, 15, 975–979. [Google Scholar]
- Her, Y.; Shin, B.N.; Lee, Y.L.; Park, J.H.; Kim, D.W.; Kim, K.S.; Kim, H.; Song, M.; Kim, J.D.; Won, M.H.; et al. Oenanthe Javanica Extract Protects Mouse Skin from UVB Radiation via Attenuating Collagen Disruption and Inflammation. Int. J. Mol. Sci. 2019, 20, 1435. [Google Scholar] [CrossRef] [Green Version]
- Hsouna, A.B.; Boye, A.; Ackacha, B.B.; Dhifi, W.; Saad, R.B.; Brini, F.; Mnif, W.; Kačániová, M. Thiamine Demonstrates Bio-Preservative and Anti-Microbial Effects in Minced Beef Meat Storage and Lipopolysaccharide (LPS)-Stimulated RAW 264.7 Macrophages. Animals 2022, 12, 1646. [Google Scholar] [CrossRef]
- Ben Hsouna, A.; Michalak, M.; Ben Akacha, B.; Dhifi, W.; Ben Saad, R.; Brini, F.; Mnif, W. Assessment of the phytochemical composition, antimicrobial activity and anti-inflammatory effects of Lobularia maritima extracts on lipopolysaccharide-stimulated RAW 264.7 cells and their capacity to extend the shelf life of raw minced beef. J. Funct. Foods 2022, 99, 105327. [Google Scholar] [CrossRef]
- Eruslanov, E.; Kusmartsev, S. Identification of ROS using oxidized DCFDA and flow-cytometry. Methods Mol. Biol. 2010, 594, 57–72. [Google Scholar]
- Lee, J.W.; Seok, J.K.; Boo, Y.C. Ecklonia cava Extract and Dieckol Attenuate Cellular Lipid Peroxidation in Keratinocytes Exposed to PM10. Evid.-Based Complement. Altern. Med. 2018, 2018, 8248323. [Google Scholar] [CrossRef] [PubMed] [Green Version]
- Livak, K.J.; Schmittgen, T.D. Analysis of relative gene expression data using real-time quantitative PCR and the 2(T)(-Delta Delta C) method. Methods 2001, 25, 402–408. [Google Scholar] [CrossRef] [PubMed]
- Zhang, M.Q.; Xiang, R.; Glorieux, C.; Huang, P. PLA2G2A Phospholipase Promotes Fatty Acid Synthesis and Energy Metabolism in Pancreatic Cancer Cells with K-ras Mutation. Int. J. Mol. Sci. 2022, 23, 11721. [Google Scholar] [CrossRef] [PubMed]
- Baihau, D.; Khaniani, M.S. Supplementation with omega fatty acids increases the mRNA expression level of PLA2G4A in patients with gastric cancer. J. Gastrointest. Oncol. 2018, 9, 1176–1183. [Google Scholar]
- Lin, W.; Li, Z. Blueberries inhibit cyclooxygenase-1 and cyclooxygenase-2 activity in human epithelial ovarian cancer. Oncol. Lett. 2017, 13, 4897–4904. [Google Scholar] [CrossRef] [Green Version]
- Xu, J.; Wu, W.; Zhang, H.; Yang, L. Berberine alleviates amyloid beta25-35-induced inflammatory response in human neuroblastoma cells by inhibiting proinflammatory factors. Exp. Ther. Med. 2018, 16, 4865–4872. [Google Scholar]
- Molloy, E.S.; Morgan, M.P.; Doherty, G.A.; McDonnell, B.; O’Byrne, J.; Fitzgerald, D.J.; McCarthy, G.M. Microsomal prostaglandin E2 synthase 1 expression in basic calcium phosphate crystal-stimulated fibroblasts: Role of prostaglandin E2 and the EP4 receptor. Osteoarthr. Cartil. 2009, 17, 686–692. [Google Scholar] [CrossRef] [Green Version]
- Ferrer, M.D.; Busquests-Cortes, C.; Capo, X.; Tejada, S.; Tur, J.A.; Pons, A.; Sureda, A. Cyclooxygenase-2 inhibitors as a therapeutic target in inflammatory diseases. Curr. Med. Chem. 2018, 26, 3225–3241. [Google Scholar] [CrossRef]
- Hara, S. Prostaglandin terminal synthases as novel therapeutic targets. Proc. Jpn. Acad. Ser. B Phys. Biol. Sci. 2017, 93, 703–723. [Google Scholar] [CrossRef] [Green Version]
- Yang, L.; Liu, S.Z.; Liu, R.H.; He, J.W. Bioassay-guided isolation of cyclooxygenase-2 inhibitory and antioxidant phenylpropanoid derivatives from the roots of Dendropanax dentiger. Bioorganic Chem. 2020, 104, 104211. [Google Scholar] [CrossRef]
- Malireddy, S.; Lawson, C.; Steinhour, E.; Hart, J.; Kotha, S.R.; Patel, R.B.; Zhao, L.; Wilkins, J.R.; Marsh, C.B.; Magalang, U.J.; et al. Airborne agricultural particulate matter induces inflammatory cytokine secretion by respiratory epithelial cells: Mechanisms of regulation by eicosanoid lipid signal mediators. Indian J. Biochem. Biophys. 2013, 50, 387–401. [Google Scholar]
- Pavicevic, Z.; Leslie, C.C.; Malik, K.U. cPLA2 phosphorylation at serine-515 and serine-505 is required for arachidonic acid release in vascular smooth muscle cells. J. Lipid Res. 2008, 49, 724–737. [Google Scholar] [CrossRef] [Green Version]
- Liang, N.; Kitts, D.D. Role of Chlorogenic Acids in Controlling Oxidative and Inflammatory Stress Conditions. Nutrients 2016, 8, 16. [Google Scholar] [CrossRef] [Green Version]
- Wang, L.; Pan, X.; Jiang, L.; Chu, Y.; Gao, S.; Jiang, X.; Zhang, Y.; Chen, Y.; Luo, S.; Peng, C. The Biological Activity Mechanism of Chlorogenic Acid and Its Applications in Food Industry: A Review. Front. Nutr. 2022, 9, 943911. [Google Scholar] [CrossRef]
- Shan, J.; Fu, J.; Zhao, Z.; Kong, X.; Huang, H.; Luo, L.; Yin, Z. Chlorogenic acid inhibits lipopolysaccharide-induced cyclooxygenase-2 expression in RAW264.7 cells through suppressing NF-kappaB and JNK/AP-1 activation. Int. Immunopharmacol. 2009, 9, 1042–1048. [Google Scholar] [CrossRef]
- Chen, W.-P.; Wu, L.-D. Chlorogenic acid suppresses interleukin-1β-induced inflammatory mediators in human chondrocytes. Int. J. Clin. Exp. Pathol. 2014, 7, 8797–8801. [Google Scholar]
- Ma, Q.G.; Wei, R.R.; Sang, Z.P. Biphenyl Derivatives from the Aerial Parts of Oenanthe javanica and Their COX-2 Inhibitory Activities. Chem. Biodivers. 2019, 16, e1800480. [Google Scholar] [CrossRef] [Green Version]
- Ma, Q.G.; Guan, Y.; Sang, Z.P.; Wei, R.R. Anti-inflammatory phenylpropanoid derivatives from the aerial parts of Oenanthe javanica. Chem. Nat. Compd. 2021, 57, 752–756. [Google Scholar] [CrossRef]


| Gene Name | GenBank Accession Number | Primer Sequences | Ref. |
|---|---|---|---|
| Phospholipase A2 group IIA (PLA2G2A) | NM_000300.4 | F: 5′-GAAAGGAAGCCGCACTCAGTT-3′ R: 5’- CAGACGTTTGTAGCAACAGTCA-3’ | [43] |
| Phospholipase A2 group IVA (PLA2G4A) | NM_024420.3 | F: 5’-GACGTGCTGGGAAGGTACAC-3’ R: 5’-AGCCCACTGTCCACTACA-3’ | [44] |
| Prostaglandin-endoperoxide synthase 1 (PTGS1) | NM_000962.4 | F: 5′-CAGAGCCAGATGGCTGTGGG-3′ R: 5′-AAGCTGCTCATCGCCCCAGG-3′ | [45] |
| Prostaglandin-endoperoxide synthase 2 (PTGS2) | NM_000963.3 | F: 5′-CTGCGCCTTTTCAAGGATGG-3′ R: 5′-CCCCACAGCAAACCGTAGAT-3′ | [46] |
| Prostaglandin E synthase 1 (PTGES1) | NM_004878.5 | F: 5’-AACCCTTTTGTCGCCTG-3’ R: 5’-GTAGGCCACGGTGTGT-3’ | [47] |
| Prostaglandin E synthase 2 (PTGES2) | NM_025072.7 | F: 5’-GAAAGCTCGCAACAACTAAAT-3’ R: 5’-CTTCATGGCTGGGTAGTAG-3’ | [47] |
| Glyceraldehyde 3-phosphate dehydrogenase (GAPDH) | NM_002046.3 | F: 5′-ATGGGGAAGGTGAAGGTCG-3′ R: 5′-GGGGTCATTGATGGCAACAA-3′ | [41] |
Disclaimer/Publisher’s Note: The statements, opinions and data contained in all publications are solely those of the individual author(s) and contributor(s) and not of MDPI and/or the editor(s). MDPI and/or the editor(s) disclaim responsibility for any injury to people or property resulting from any ideas, methods, instructions or products referred to in the content. |
© 2023 by the authors. Licensee MDPI, Basel, Switzerland. This article is an open access article distributed under the terms and conditions of the Creative Commons Attribution (CC BY) license (https://creativecommons.org/licenses/by/4.0/).
Share and Cite
Bae, I.A.; Ha, J.W.; Boo, Y.C. Chlorogenic Acid, a Component of Oenanthe javanica (Blume) DC., Attenuates Oxidative Damage and Prostaglandin E2 Production Due to Particulate Matter 10 in HaCaT Keratinocytes. Cosmetics 2023, 10, 60. https://doi.org/10.3390/cosmetics10020060
Bae IA, Ha JW, Boo YC. Chlorogenic Acid, a Component of Oenanthe javanica (Blume) DC., Attenuates Oxidative Damage and Prostaglandin E2 Production Due to Particulate Matter 10 in HaCaT Keratinocytes. Cosmetics. 2023; 10(2):60. https://doi.org/10.3390/cosmetics10020060
Chicago/Turabian StyleBae, In Ah, Jae Won Ha, and Yong Chool Boo. 2023. "Chlorogenic Acid, a Component of Oenanthe javanica (Blume) DC., Attenuates Oxidative Damage and Prostaglandin E2 Production Due to Particulate Matter 10 in HaCaT Keratinocytes" Cosmetics 10, no. 2: 60. https://doi.org/10.3390/cosmetics10020060