Article

Radiometric Signatures of Gold Mineralization Zone in Pongkor, West Java, Indonesia: A Baseline for Radiometric Mapping Application on Low-Sulfidation Epithermal Deposit

1
Research Center for Nuclear Fuel Cycle and Radioactive Waste Technology, Research Organization for Nuclear Energy, National Research and Innovation Agency (BRIN), South Tangerang 15314, Indonesia
2
Faculty of Geological Engineering, Padjadjaran University, Bandung 45363, Indonesia
3
Research Center for Safety, Metrology, and Nuclear Technology, National Research and Innovation Agency (BRIN), South Tangerang 15314, Indonesia
4
Geological Engineering Department, Trisakti University, Jakarta 11440, Indonesia
5
Geomin Unit of PT. Antam Tbk., Jakarta 12530, Indonesia
*
Author to whom correspondence should be addressed.
Resources 2024, 13(1), 2; https://doi.org/10.3390/resources13010002
Submission received: 13 November 2023 / Revised: 13 December 2023 / Accepted: 18 December 2023 / Published: 21 December 2023
(This article belongs to the Special Issue Mineral Resource Management 2023: Assessment, Mining and Processing)

Abstract

:
Radiometric mapping could play a prominent role in locating the host rock or alteration that leads to gold mineralization. Nevertheless, in low-sulfidation epithermal gold deposits, the radiometric signatures have to be priorly characterized due to their geometry. It is comprised of a small ore vein system within the large alteration zones. The Pongkor gold mine is a low-sulfidation epithermal deposit and was selected for this purpose. The method started with the surface identification of radiometric signatures on altered and unaltered rocks near Pongkor using portable spectrometers. They are followed by the characterization of the underground mining front, which is comprised of different types of veins and host rocks. The results show that the altered rocks were characterized by a high K% and a low eTh/K ratio. Vice versa, the mineralized veins show low radioelement concentrations. Following the characterization of the geometry of alteration zones and mineralized veins, a study of the relationship between radioelements detected by radiometric mapping and gold pathfinder elements was conducted. Gold pathfinders of Mn, Fe, Zn, As, and Pb were selected for correlation studies with the radioelement. The pathfinders and radioelements were more significantly correlated in veins compared to the host rock. Based on this study, radiometric mapping has the potential and benefit of being applied in the exploration of low-sulfidation epithermal gold deposits. An alteration zone could be delineated by K or eTh/K as an anomaly indicator, and the vein bodies could also be delineated using low K or eTh as an anomaly indicator.

1. Introduction

The radiometric mapping measures the abundance of K, U, and Th, naturally occurring radioactive materials (NORM), on Earth’s surface. The method is best executed with a multispectral sensor, referred to as gamma spectrometry, so the signature of the radioelement can be separately recorded and allow further analysis. The measurements can map and characterize different rock units based on the varying concentrations of these radioelements [1,2]. The method is prevalent, practical, and effective for detecting thorium and uranium anomalies in exploration. Radiometric mapping that has been carried out in Mamuju, West Sulawesi, produces information on the concentration of radioelements in rocks and soil and illustrates the distribution of rock types and the presence of radioactive uranium and thorium minerals [3,4].
The radiometric method is not limited to the exploration of radioactive minerals. It can also be applied to exploring other mineral deposits, such as gold, by combining several other analytical methods. This method mainly plays a role in locating the host rock or alteration that leads to gold mineralization. On orogenic gold deposits, the airborne radiometric method has successfully affirmed the gold mine location, characterized by deficient levels of all radioelement maps [5]. The success story has also been described based on gamma-ray detection of potassic alteration in porphyry deposits and volcanic-hosted massive sulfide [6].
Besides interpreting the single radioelement map one by one, the three radioelement maps produced by the radiometric method are commonly processed to retrieve a single ternary composite image. The ternary composite image helps distinguish several geological domains [7] and alteration zones [5] on the orogenic gold deposit. One of the analytical methods used to enhance a radioelement’s signature is radioelement ratios. On the porphyry deposits, the high radiometric anomaly on the K and eTh (equivalent thorium) ratio is powerful in detecting potassium-enriched areas of potassic alteration related to gold mineralization [8,9,10]. It is noted that the eTh/K ratio is good enough to distinguish the phyllic alteration zone [10].
In the case of high-sulfidation (HS) epithermal deposits [11] and low-sulfidation (LS) epithermal deposits [12,13,14], the potassium enrichment in alteration zones of the epithermal deposit makes the K/eTh ratio very useful as an indicator of gold mineralization. Although the radiometric method is excellent in aiding lithological mapping and mineral exploration, it has been pointed out that surface processes such as weathering and erosion may mask the radiometric signatures of the magmatic and hydrothermal products [15].
All the studies mentioned above addressed the radiometric signature of a broad geologic setting to detect anomalies leading to geological domains associated with gold mineralization confirmed by the area’s known gold deposits. In this study, we measured the radiometric characteristics of the actual mining fronts of an LS epithermal gold deposit in combination with geochemical methods. This study aims to obtain a model of radiometric patterns associated with lithologies and the mineralization of an LS epithermal gold deposit. The model is expected to be a guideline in surface radiometric mapping for gold exploration to increase the success potential. The typical LS epithermal gold deposit of the Pongkor deposit in West Java was chosen because of its well-known geological condition due to the extensive studies that have been conducted for years in terms of supergene-enriched epithermal, study of carbonate minerals, geochronology, and ore-forming fluid (Figure 1) [16,17,18,19,20].

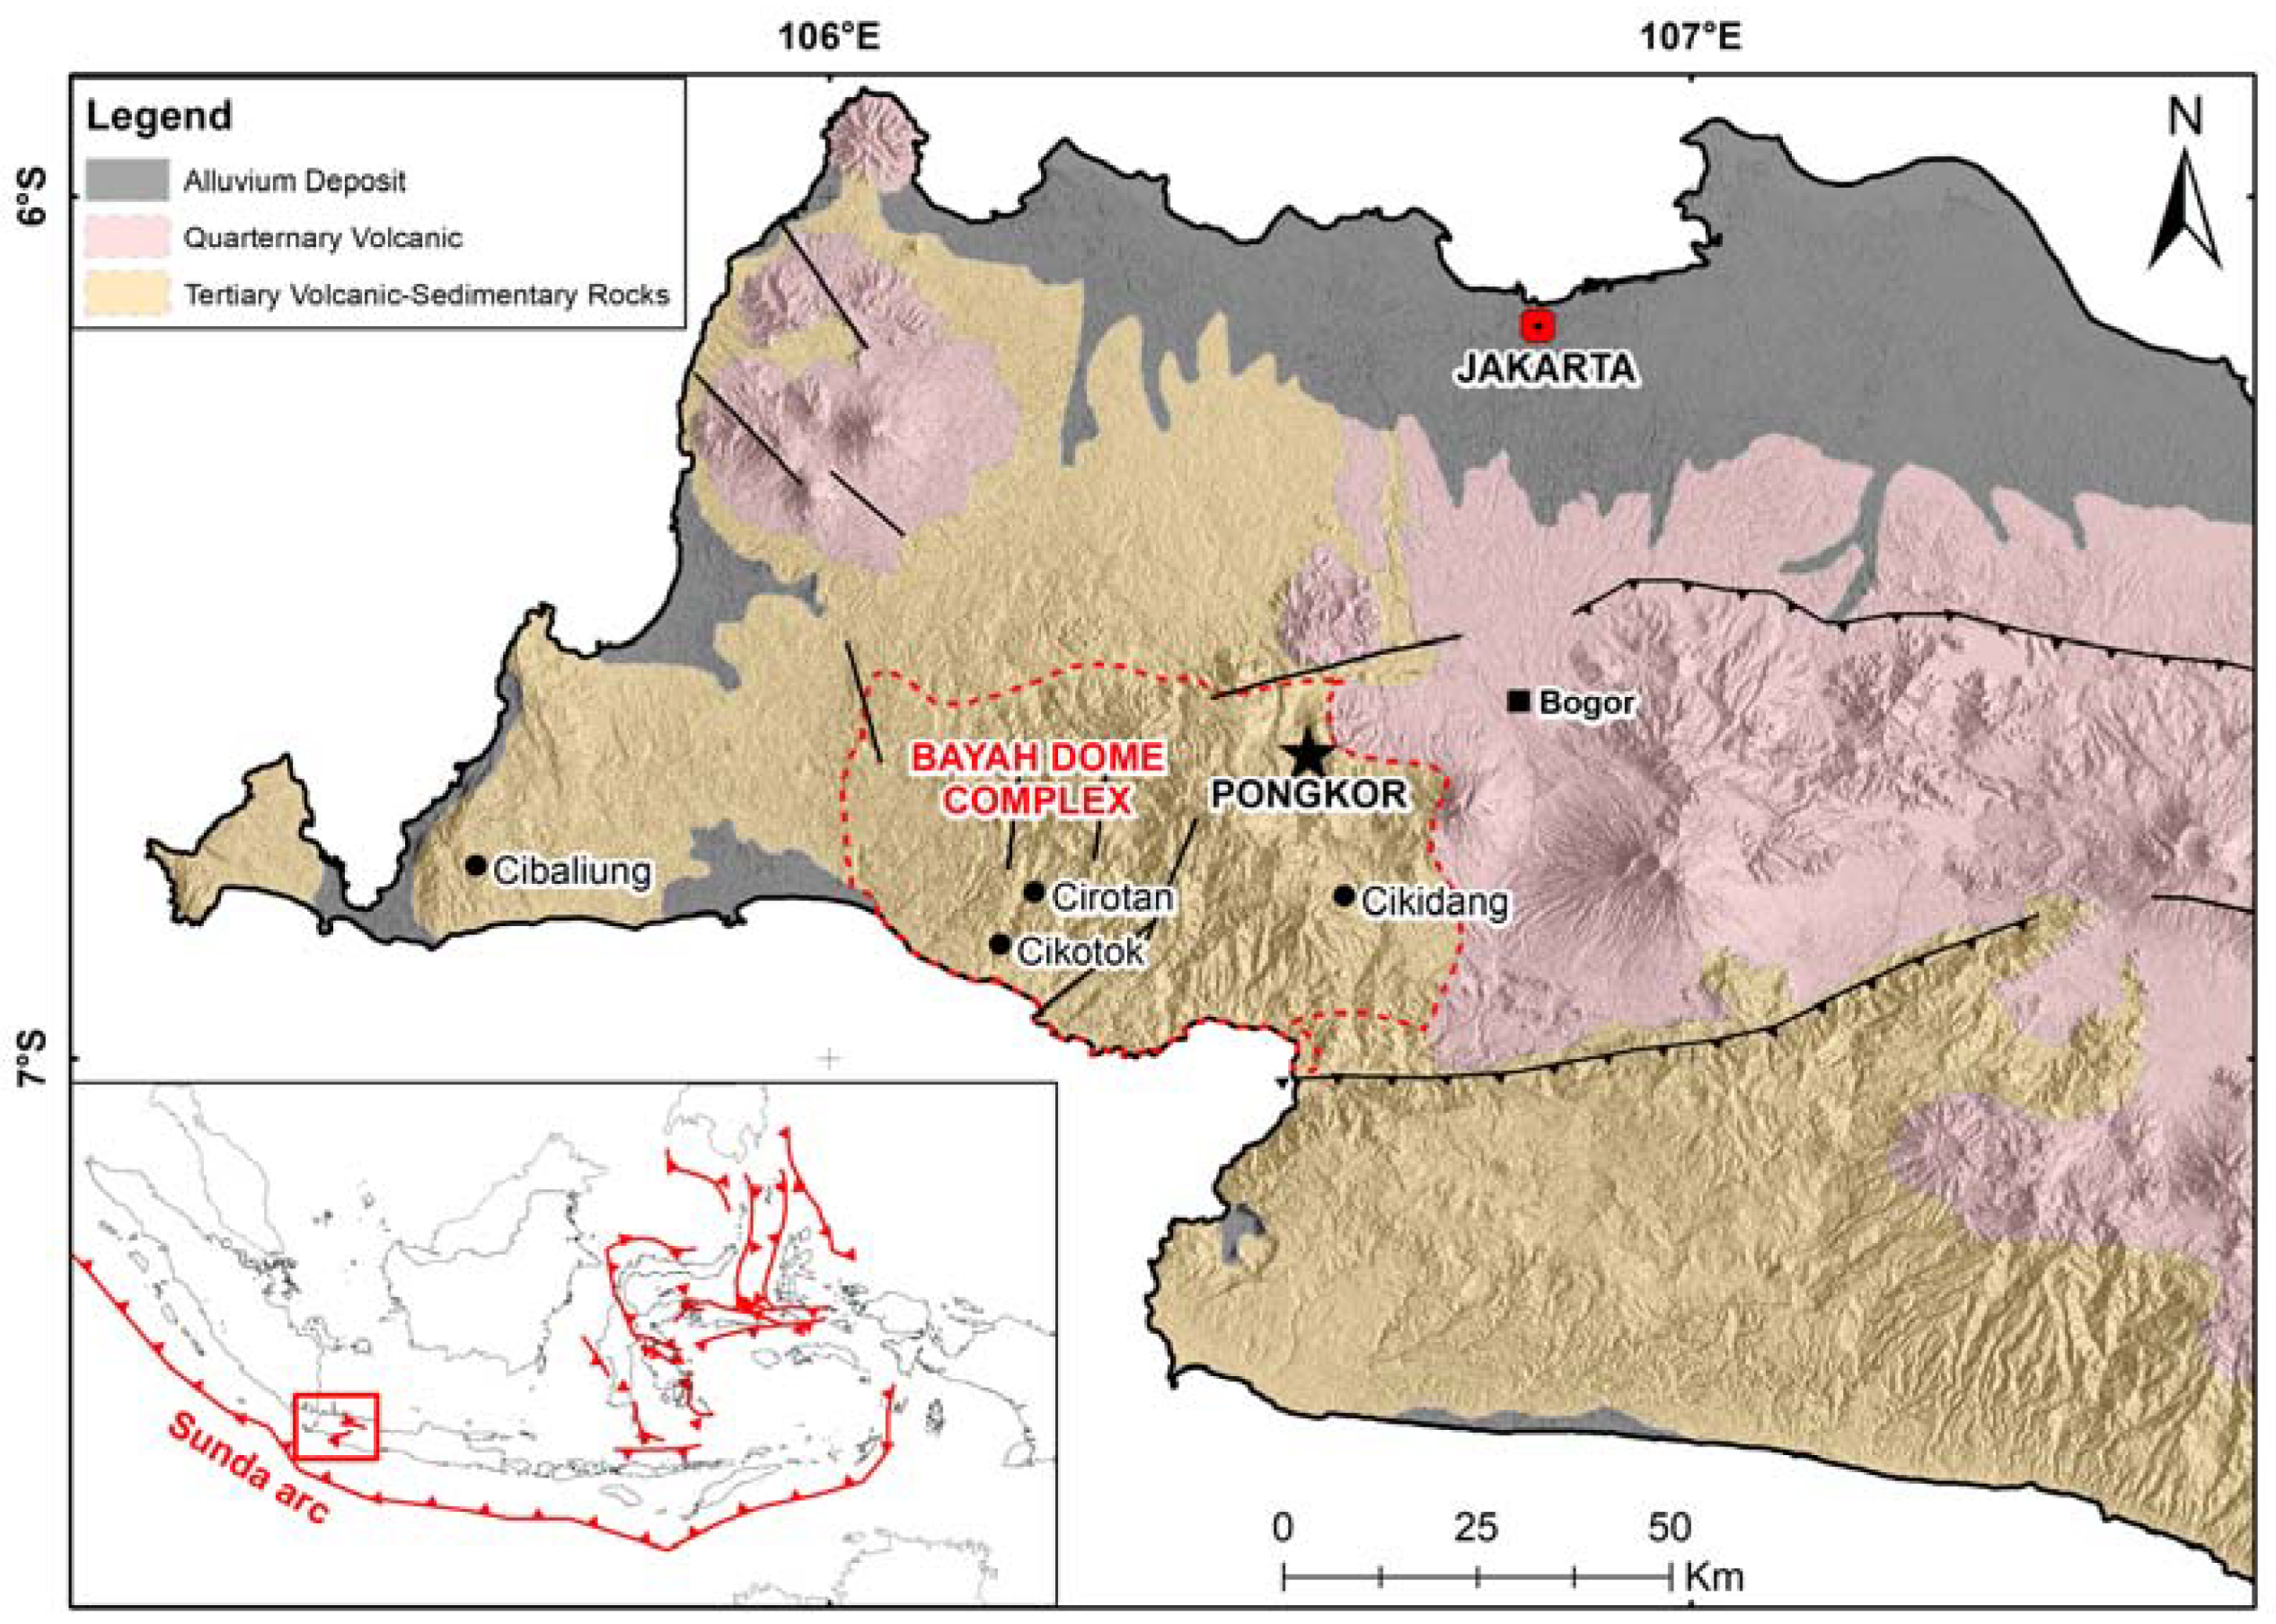
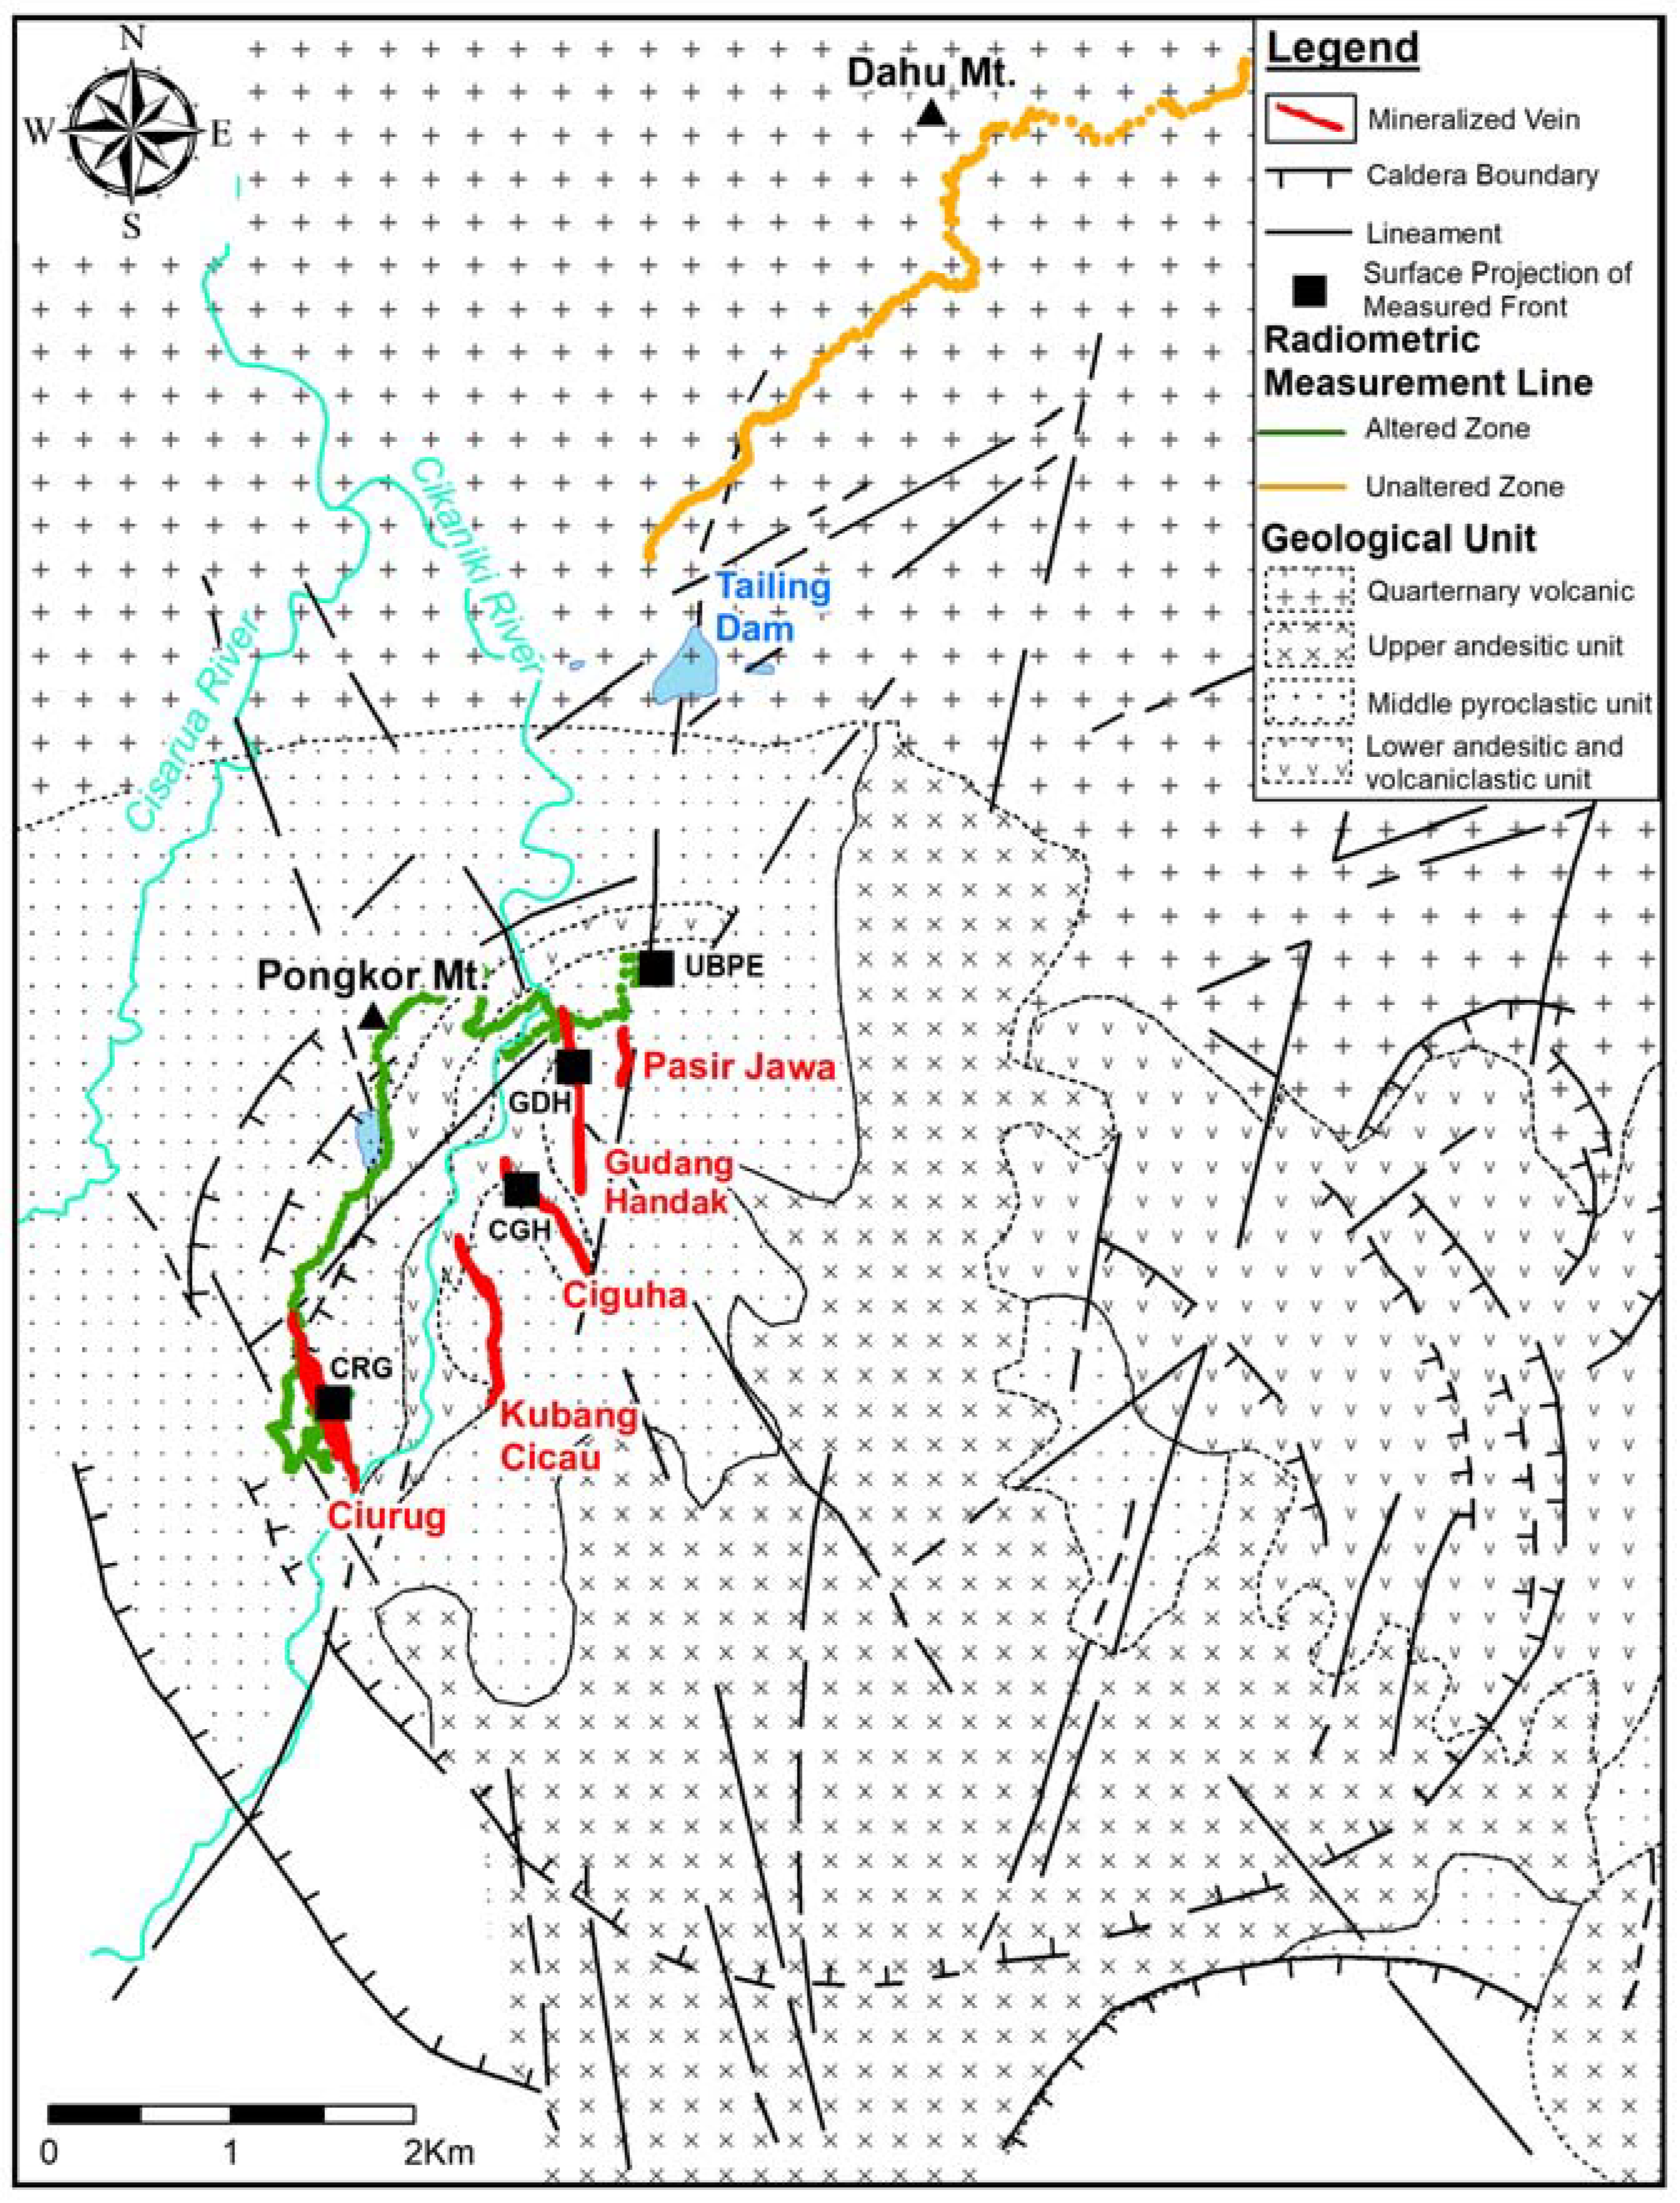
2. Geological Setting

The Sunda arc, formed since the Late Cretaceous due to the subducting Indo-Australian plate beneath the Eurasian plate, has created the Sumatra-Jawa-Banda Metallogenic Belt with significant gold-silver-base metal deposits [20,21,22,23,24,25]. The deposit type that significantly contributed to gold production in Java is the LS epithermal type of mineralization [20]. In western Java, several LS epithermal gold deposit prospects were represented by Cibaliung, Kerta, Pongkor, Cisoka, Cikotok, Cirotan, Cikidang, and Gunung Peti [16,20,26,27,28,29,30,31]. The Pongkor gold deposit is located on the northeastern flank of the Bayah Dome (Figure 1) [30]. The Bayah Dome is a volcanic landform formed from the early Tertiary (Paleocene–Eocene) to the Pliocene [22]. The dome consisted of calc-alkaline rhyolitic to andesitic rocks with a few intercalations of limestone and sandstone [16,29].
The Pongkor deposit lies within a volcano-tectonic depression or caldera associated with ignimbrite volcanism. As shown in Figure 2, the volcanic rocks that act as hosts in the Pongkor deposit are divided into three units: the lower, middle, and upper volcanic units [16]. The lower units comprise brecciated andesitic lava flows and monogenic breccias, with epiclastic sandstone and siltstone intercalation. The middle unit comprises subaerial dacitic rocks divided into three subunits: a basal subunit, a main ignimbrite subunit, and a topmost subunit. The basal subunit consists of intercalated accretionary lapilli tuff, fine-grained tuff, crystal tuff, and pyroclastic flow deposits. The main ignimbrite subunit is mainly composed of lapilli-block tuff (LBT). The topmost subunit consists of epiclastic siltstone with fine-grained pyroclastic fall tuff at the very top. The mineralization veins were mainly found within LBT. The upper unit was formed mainly of andesitic flows and shows no indication of hydrothermal alteration.
The hydrothermal alteration in the Pongkor deposit is widespread near the veins [16,30]. Silicification characterized by quartz exceeding 40% is extended up to 10 m from the veins. Potassic alteration is characterized by rare fine illite within ignimbrites superposed by propylitic alteration that consists of chlorite, epidote, carbonate, and quartz. Argillic alteration (illite, smectite) extends around the veins for hundreds of meters. The mineralization systems in the Pongkor gold deposit comprise several central production veins, known as Pasir Jawa, Ciguha, Kubang Cicau, Ciurug, Gudang Handak, and the Pamoyanan vein [16,19,30,32,33]. The veins show general trends within the NNE—SSW direction. The veins originated from a four-stage mineralization event known as carbonate–quartz facies (CQ), manganese oxide–quartz facies (MOQ), banded opaline quartz facies (BOQ), and grey sulfide quartz facies (GSQ) [16].
The CQ facies is the first stage of mineralization that consists of quartz-carbonate or carbonate veinlets and carbonate-quartz breccia, with rare and disseminated sulfides within quartz (<1%). The gold grade in the CQ facies is generally lower than 1 g/t. Following the CQ, the MOQ alternates quartz and rhodonite bands. The rhodonite was altered to Mn and Fe oxides, forming pockets between quartz bands. These pockets are rich in gold, ranging from 30 to 55 g/t Au. The BOQ is constructed by massive white milky quartz with a clear band texture, bands of adularia, and fine disseminate sulfides (<1%). The BOQ has a reasonably high gold content, ranging from 5 to 15 g/t. The GSQ has the highest concentration of gold, more than 30 g/t Au. It is represented by gray sulfide-rich quartz breccia [16]. The main ore assemblages found in the Pongkor gold deposit comprised [17]:
  • Pyrite–chalcopyrite–sphalerite–galena. This ore assemblage is the most common sulfide mineral in the vein system. It formed from the early stage (CQ) to the late stage of mineralization (GSQ).
  • Au–Ag alloy–acanthite–polybasite–pearceite. Various types of sulfide-sulfosal minerals characterize this assemblage. These minerals are dominantly found in the GSQ in isolated patches, as vug fillings, interstitial aggregates, or as inclusions in pyrite.
  • Chalcocite–acanthite–aguilarite. These ore assemblages originated from the supergene process and formed later in the mineralization system.
Ore minerals are rare in Pongkor. They are less than 0.5 wt.% and disseminated as tiny grains in all four vein facies: CQ, MOQ, BOQ, and GSQ, with the highest concentration in the BMQ and GSQ facies. The primary gold carrier in Pongkor is sulfide mineral assemblages, with the dominant components being pyrite, chalcopyrite, sphalerite, and galena, with minor phases such as silver sulfides-sulfosalts [16,32,33]. Gold occurs as Au–Ag alloy/electrum, uytenbogaardtite (Ag3AuS2), and native gold.
The Au–Ag alloy, or electrum, is the most essential gold-bearing mineral in Pongkor. Electrum is present in each mineralization stage and is most abundant in GSQ facies. It commonly forms amoeboid patches or small aggregates and presents as inclusions or vug filling in pyrite, sphalerite, and sometimes in silver minerals [16,32,33]. Electron-microprobe analysis reported that uytenbogaardtite (Ag3AuS2) is found as small patches enclosed by galena associated with sphalerite, chalcopyrite, acanthite, polybasite, and covellite (±argentian tetrahedrite) or appears on the rim of Au–Ag alloy aggregates [32]. Native or pure gold of supergene origin is found as microspherules and dendrites displaced in the vein structure and concentrated in pockets [16] or as a cementing phase associated with covellite, pyrite, and polybasite [32].

3. Materials and Methods

This research method was divided into two parts. The first part was identifying radiometric signatures between the altered rocks and the unaltered rocks in the surface rock. The second part was recognizing the radiometric and geochemical signatures of veins and host rocks in the mining front. The mining front is a new blast area in the underground tunnel where the ore is being or has been mined. The radiometric measurement was carried out using an RS-125 gamma-ray spectrometer.
The radiometric data in the first part were collected in dynamic mode, where the instrument measured radioelements every 10 s while roaming the zone of the altered rock on the middle pyroclastic unit and the unaltered rock on the quaternary volcanic unit. For the second part, we collect the radioelement data on five mining fronts and an outcrop with a sampling spacing of 0.5 m perpendicular to the vein.
Following the characterization of the geometry of alteration zones and mineralized veins, a study of the relationship between radioelements detected by radiometric mapping and gold pathfinder elements was conducted. Identifying the pathfinder element in gold exploration is very important. Several studies on the use of pathfinder elements for gold exploration have been well described [34,35]. In our case, the pathfinder would be correlated with the radioelement to obtain a multiple vision of interpreting the result of the radiometric mapping.
The identification of the pathfinder in the vein and host rock was conducted by a portable XRF (pXRF) Olympus Vanta C-series. The measurement was conducted for 30 s on each of the three beams. It has to be anticipated that the radiometric and pXRF measurements on the sample do not have the same volume and size of coverage. Thus, first, we compared the K concentration obtained from the pXRF and the radioelement content from the radiometric method to ensure they were comparable. Once they have a significant correlation, we compare the pathfinder from pXRF to the radio element from radiometric measurements.

4. Results

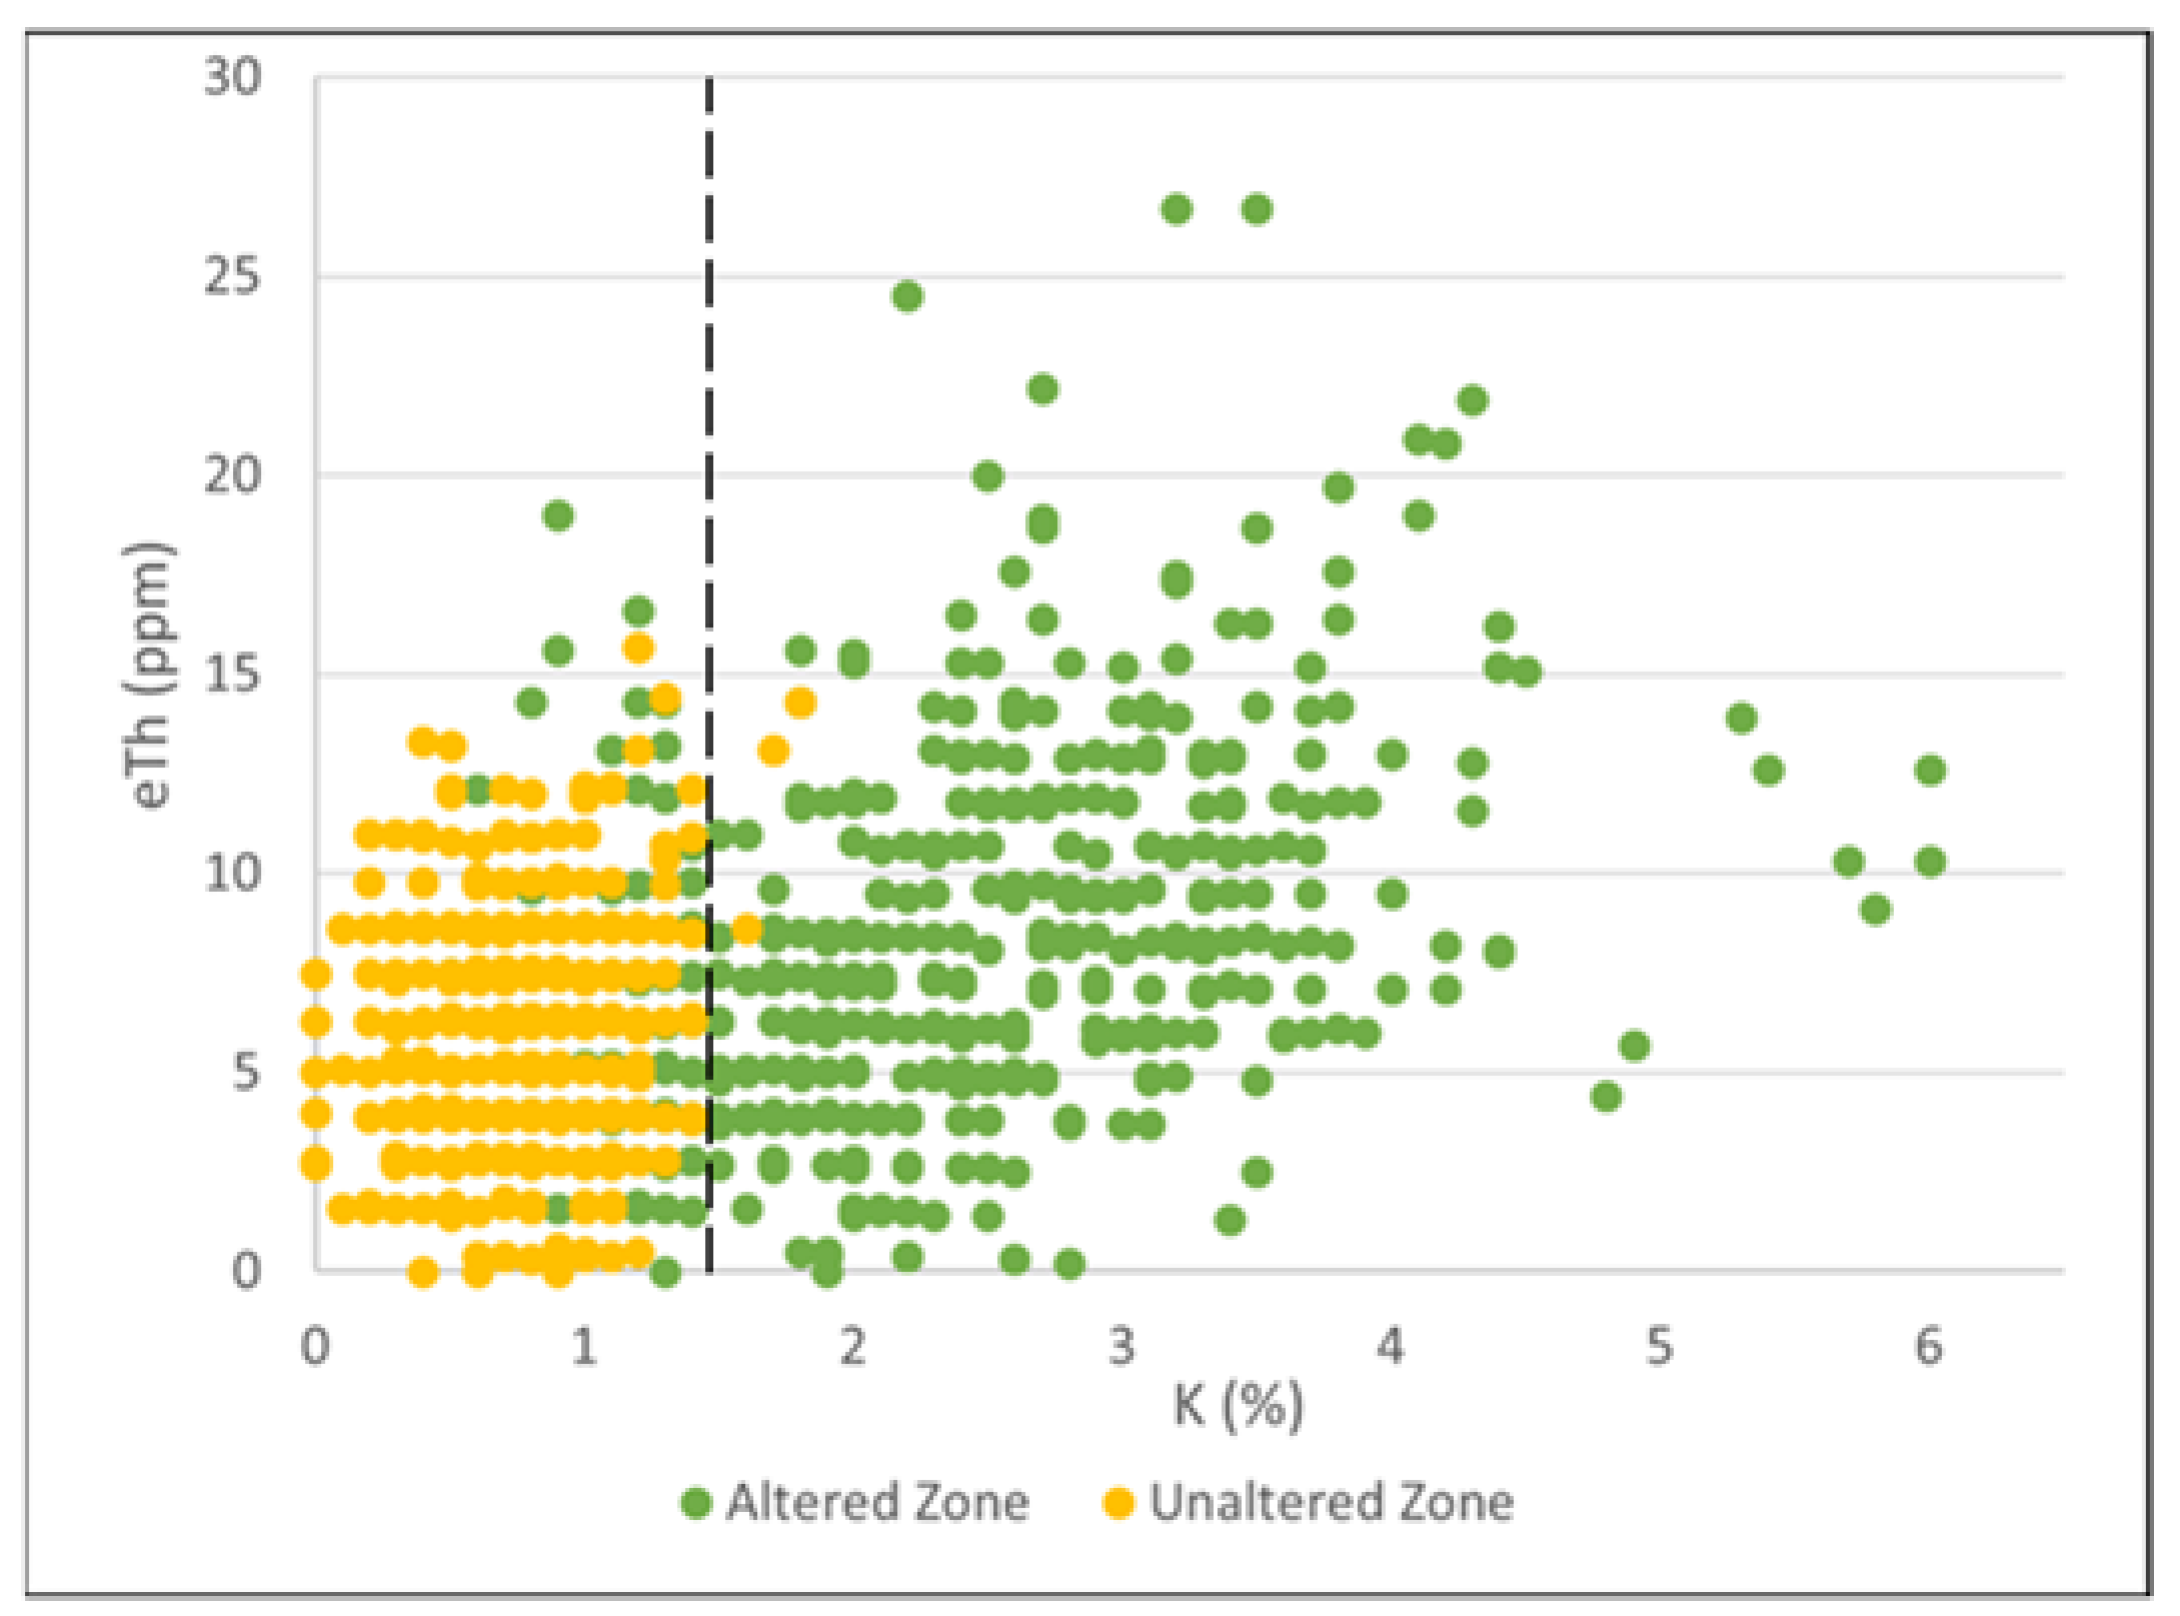
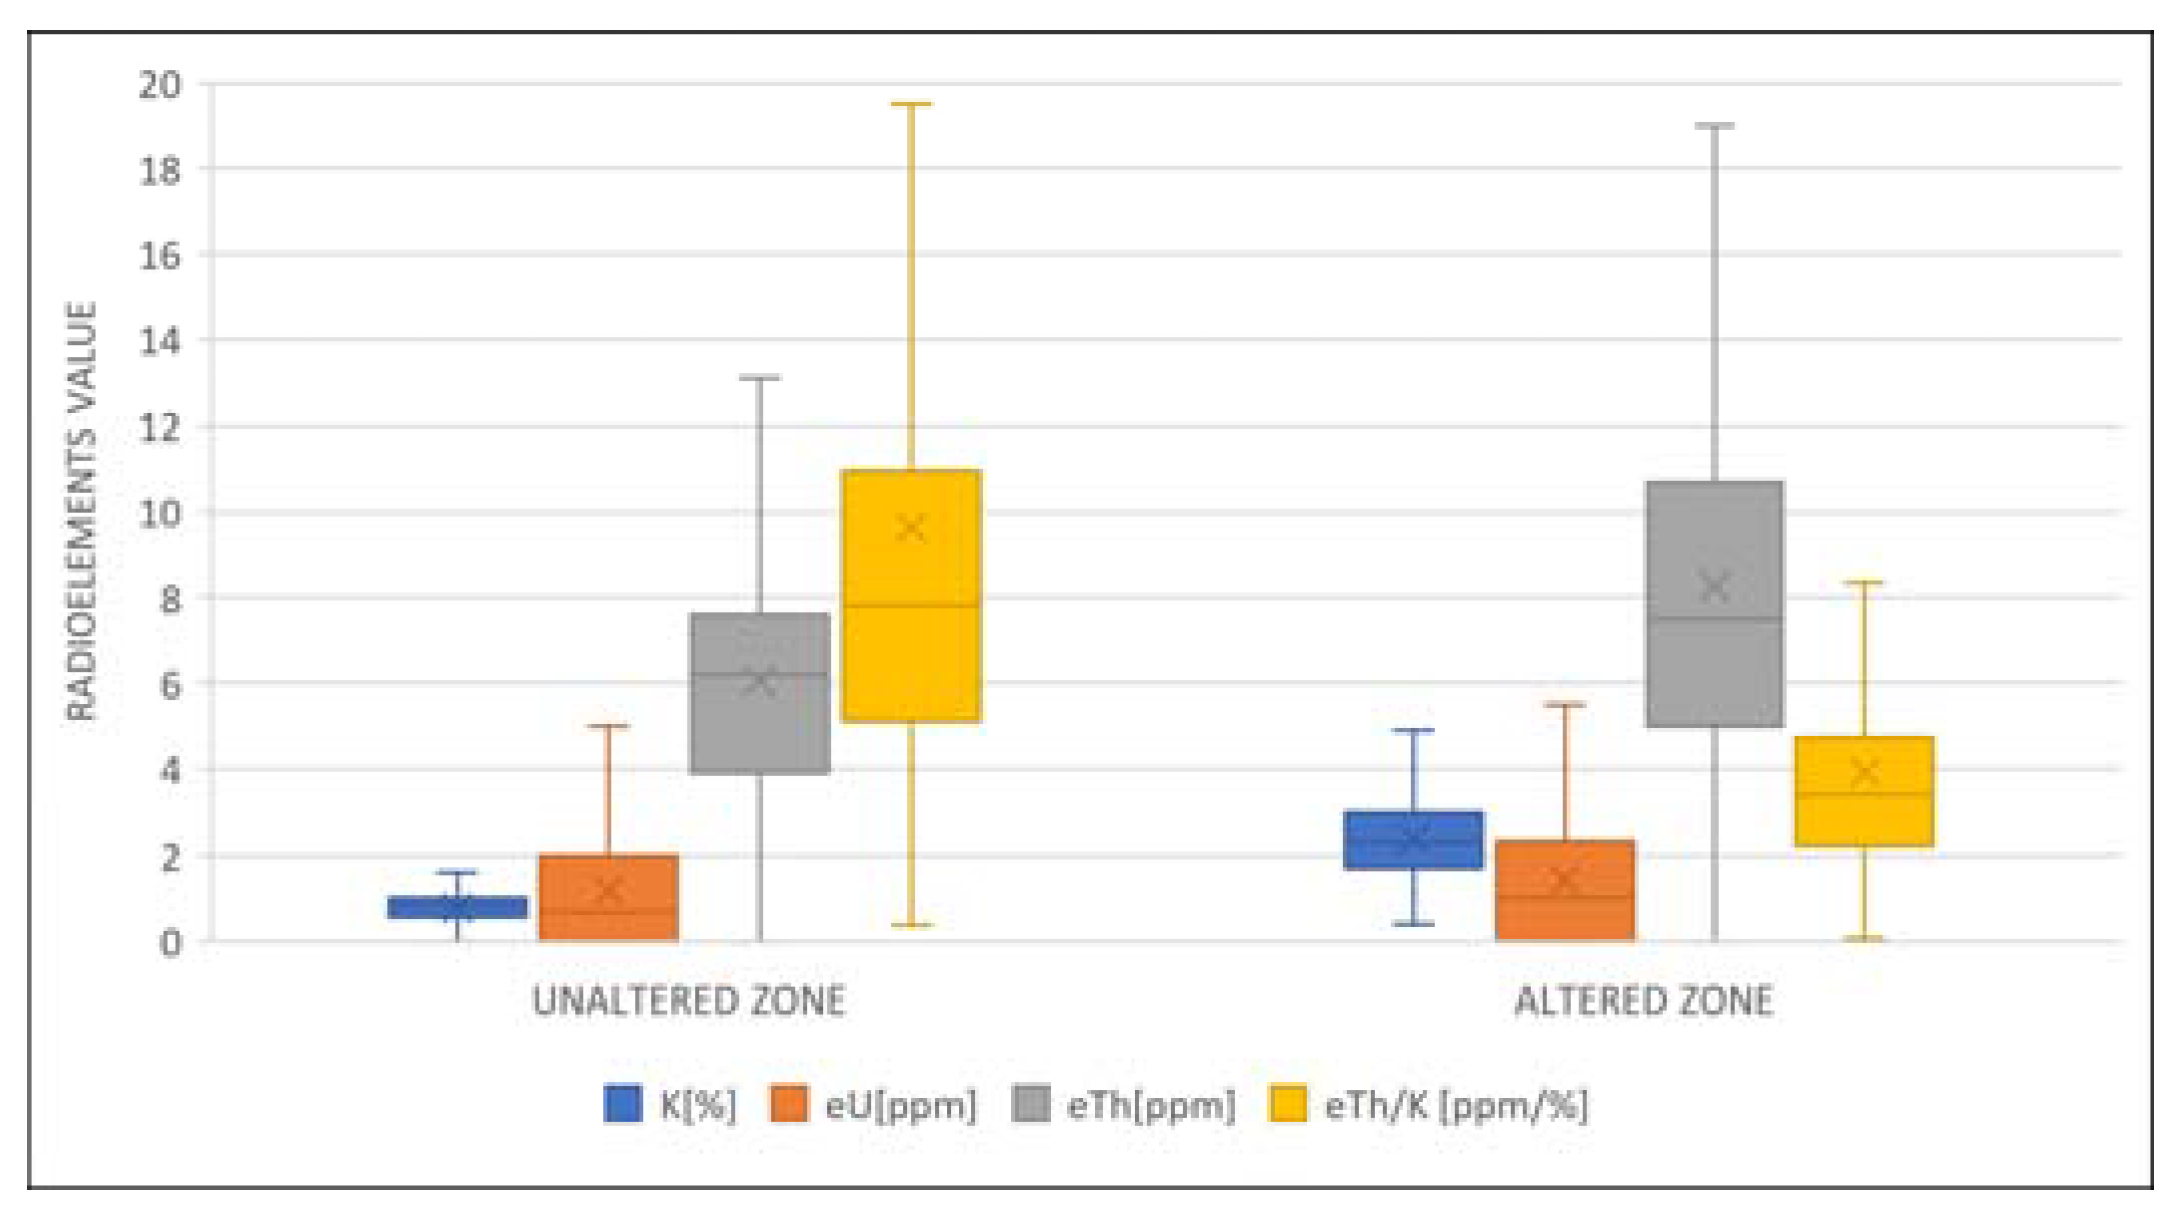
4.1. Radiometric Signatures of the Unaltered and Altered Zones

There are 458 measurements in the unaltered zone and 486 in the altered zone (see Figure 2). There was a slight increase in the eU (equivalent uranium) value from the unaltered to the altered zones, but it was insignificant. Conversely, the eTh distribution showed some rise in the altered zone with a broader range compared to the unaltered zone. The K distribution is significantly different in the altered zone. In the case of Pongkor, the line of 1.4% K differs in the altered and unaltered zones (Figure 3).

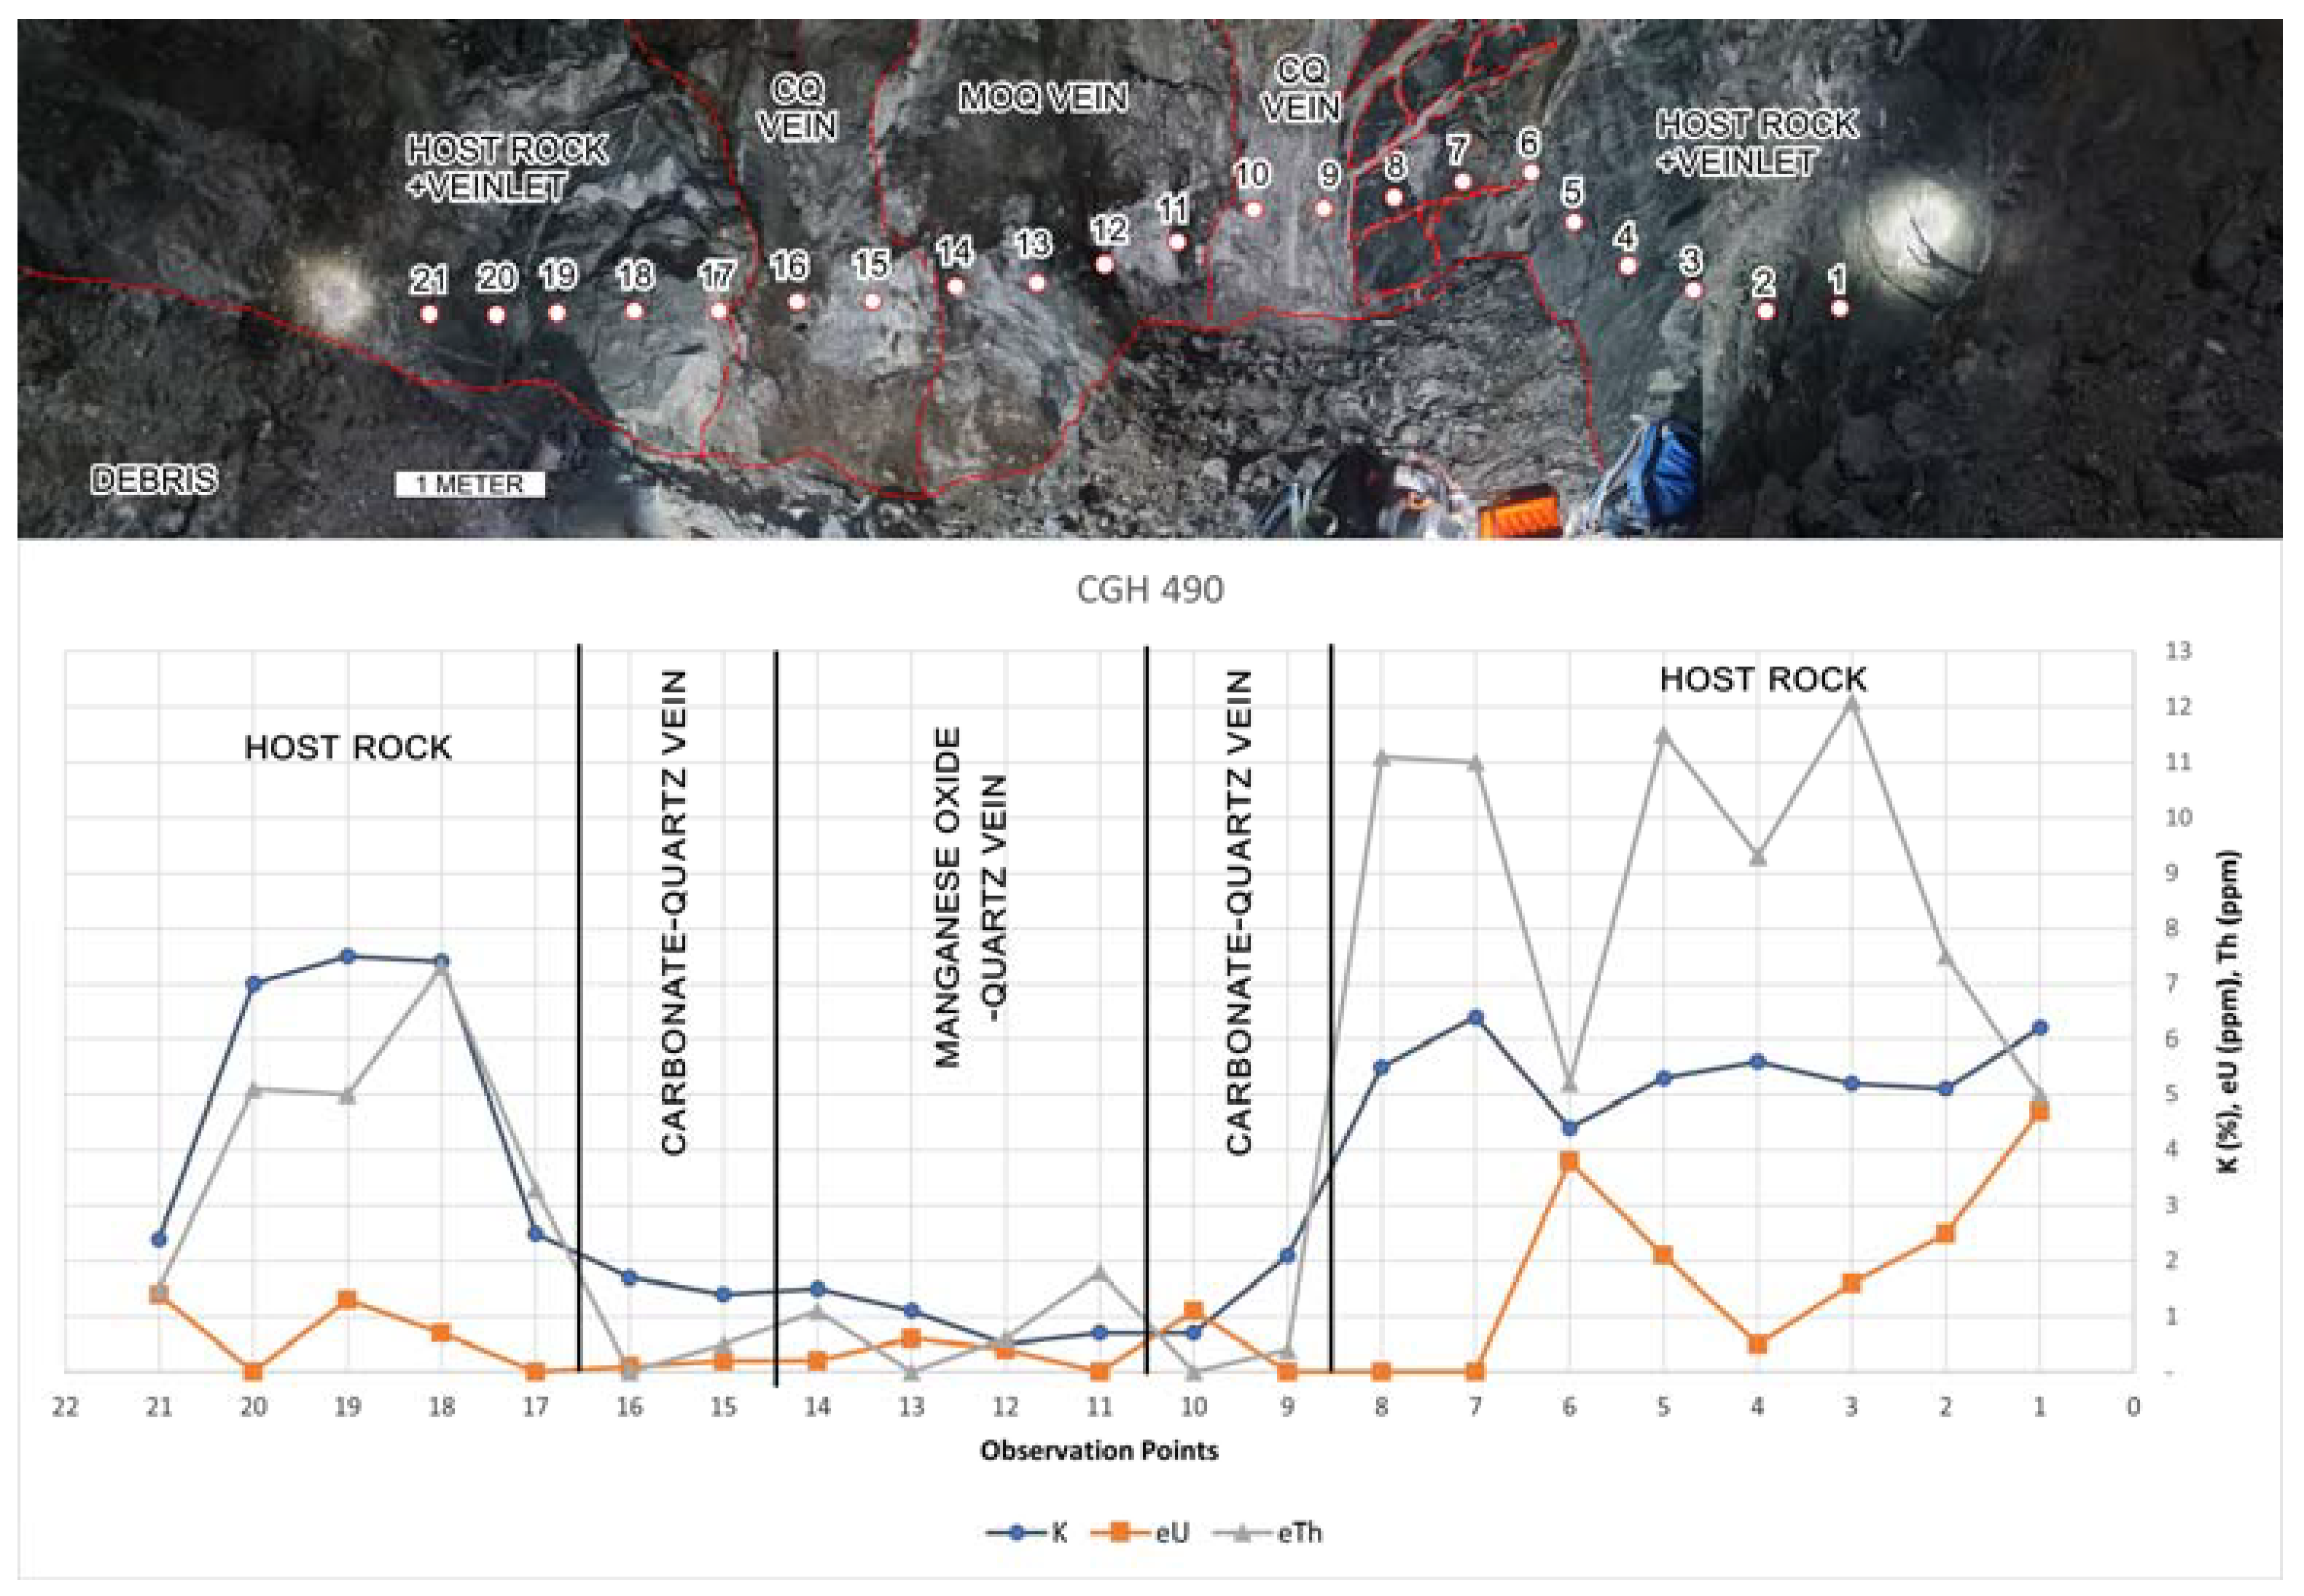
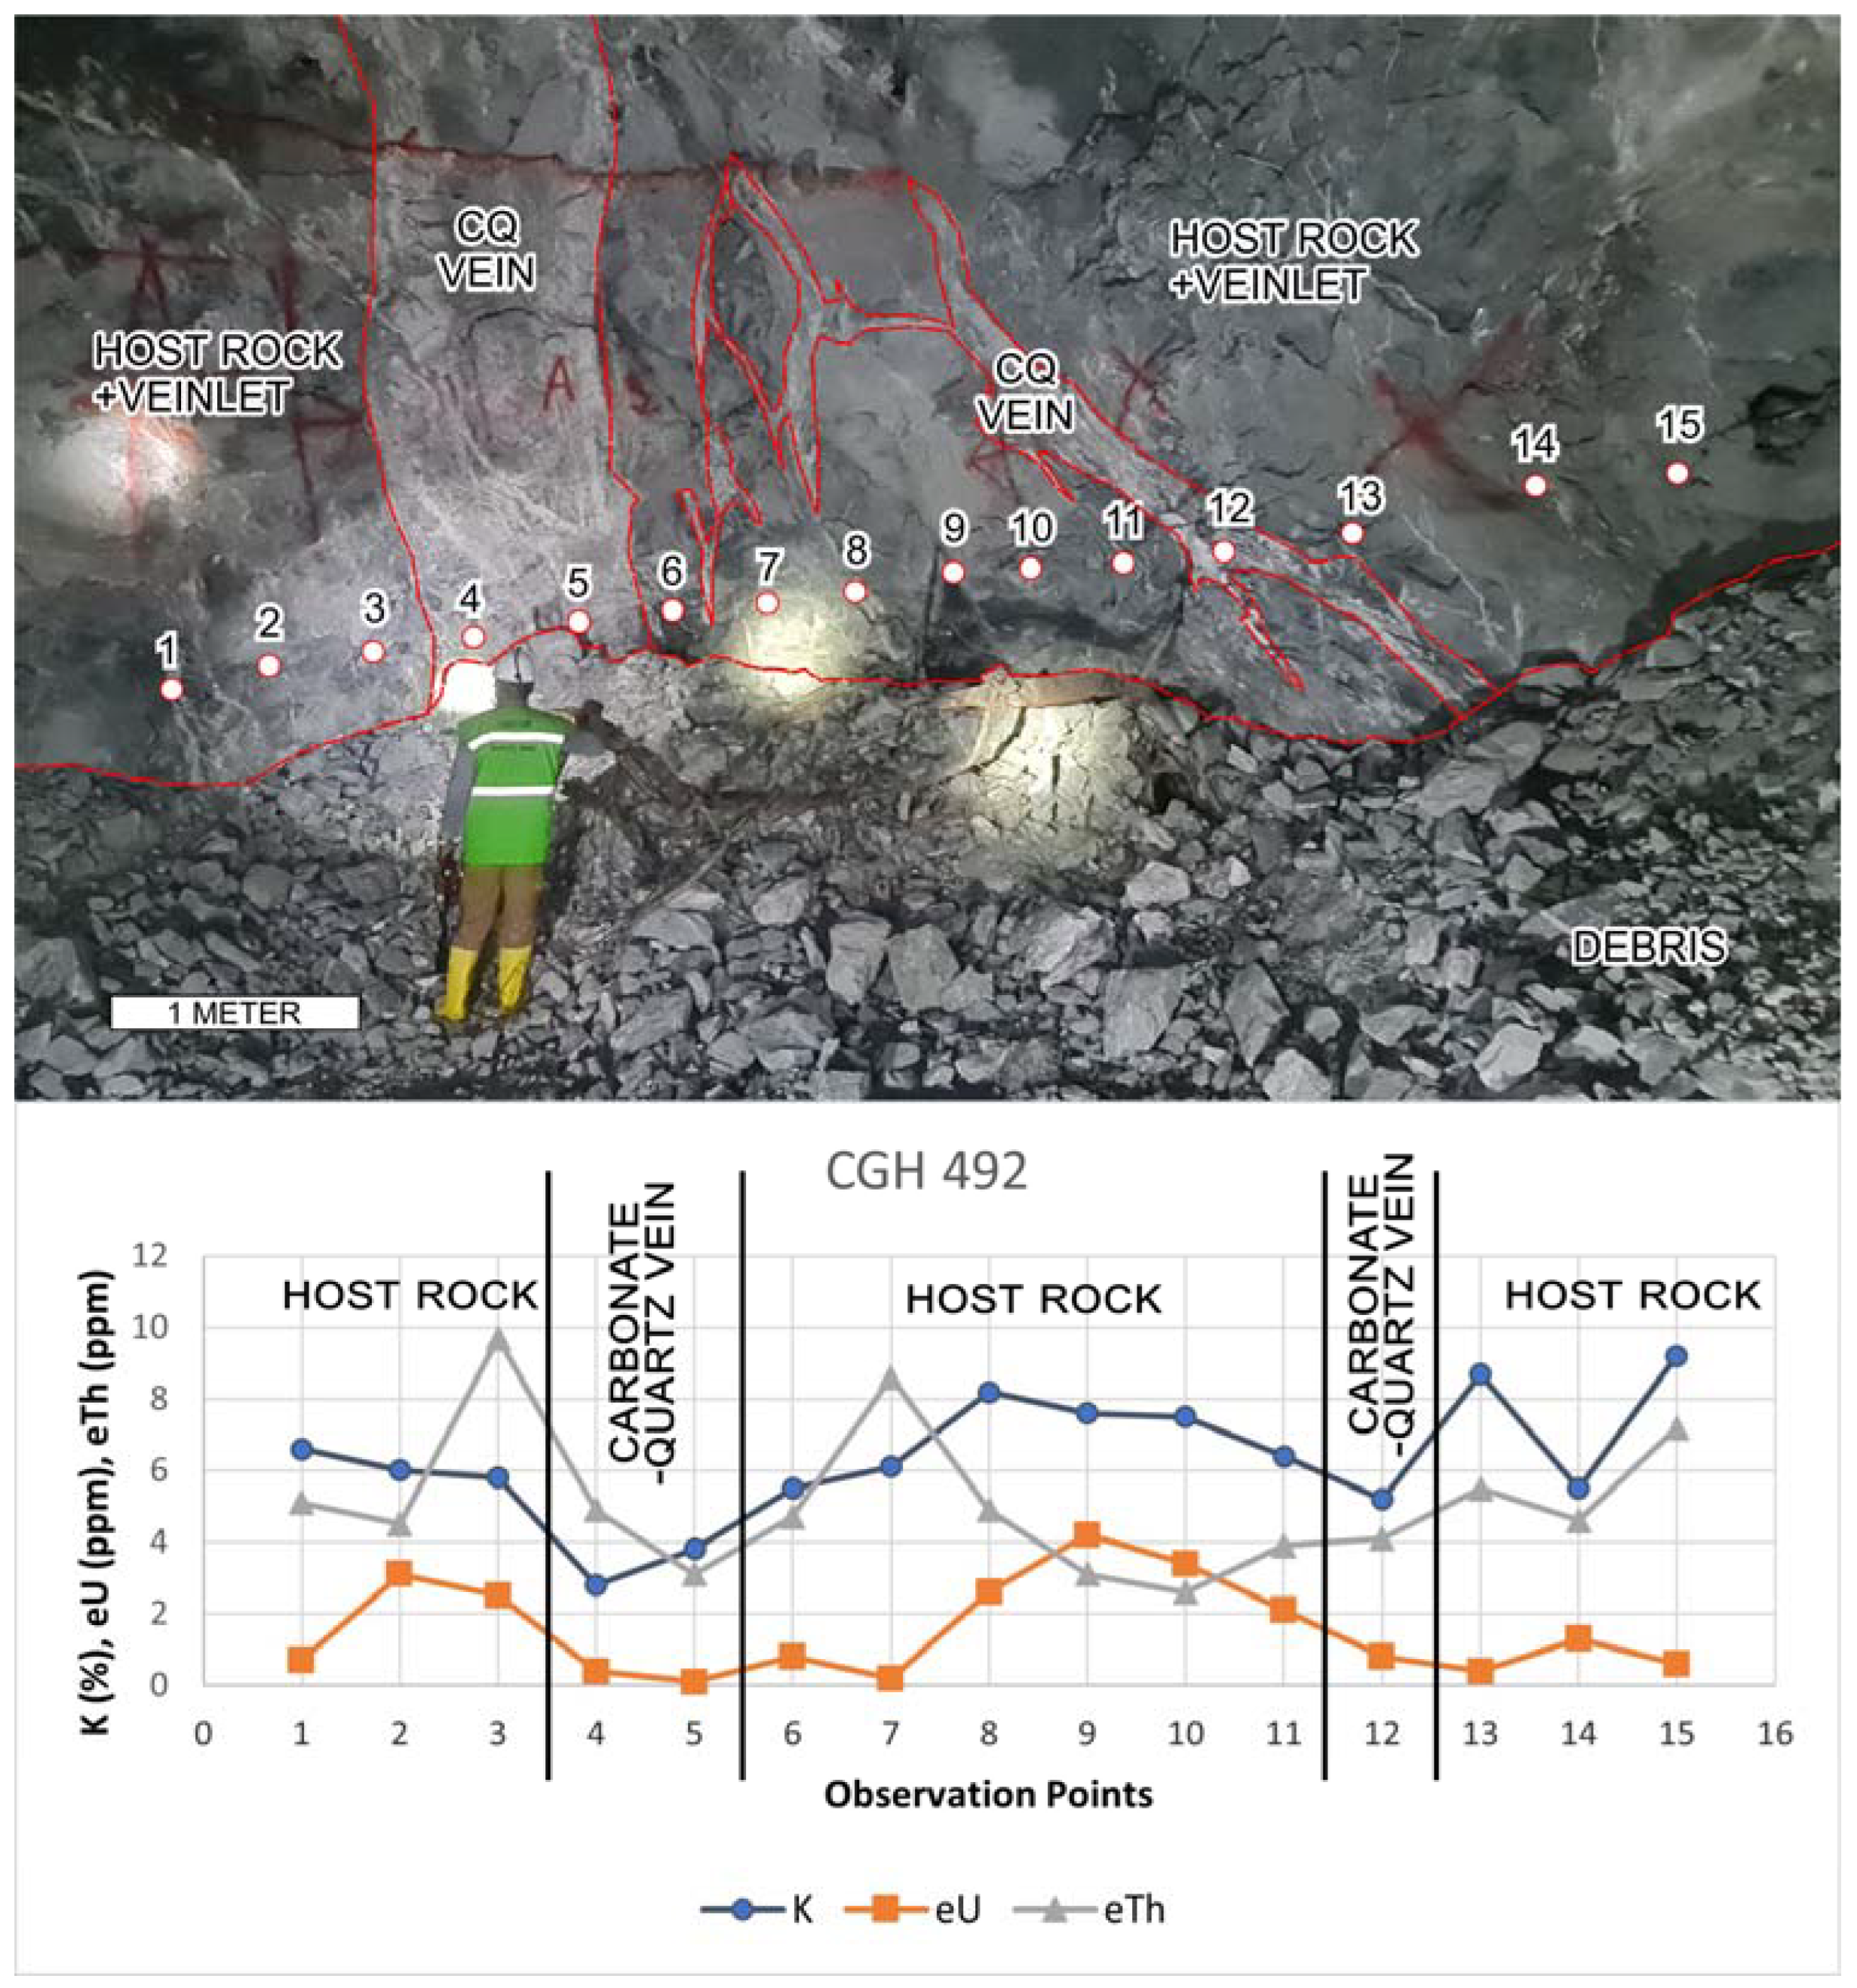
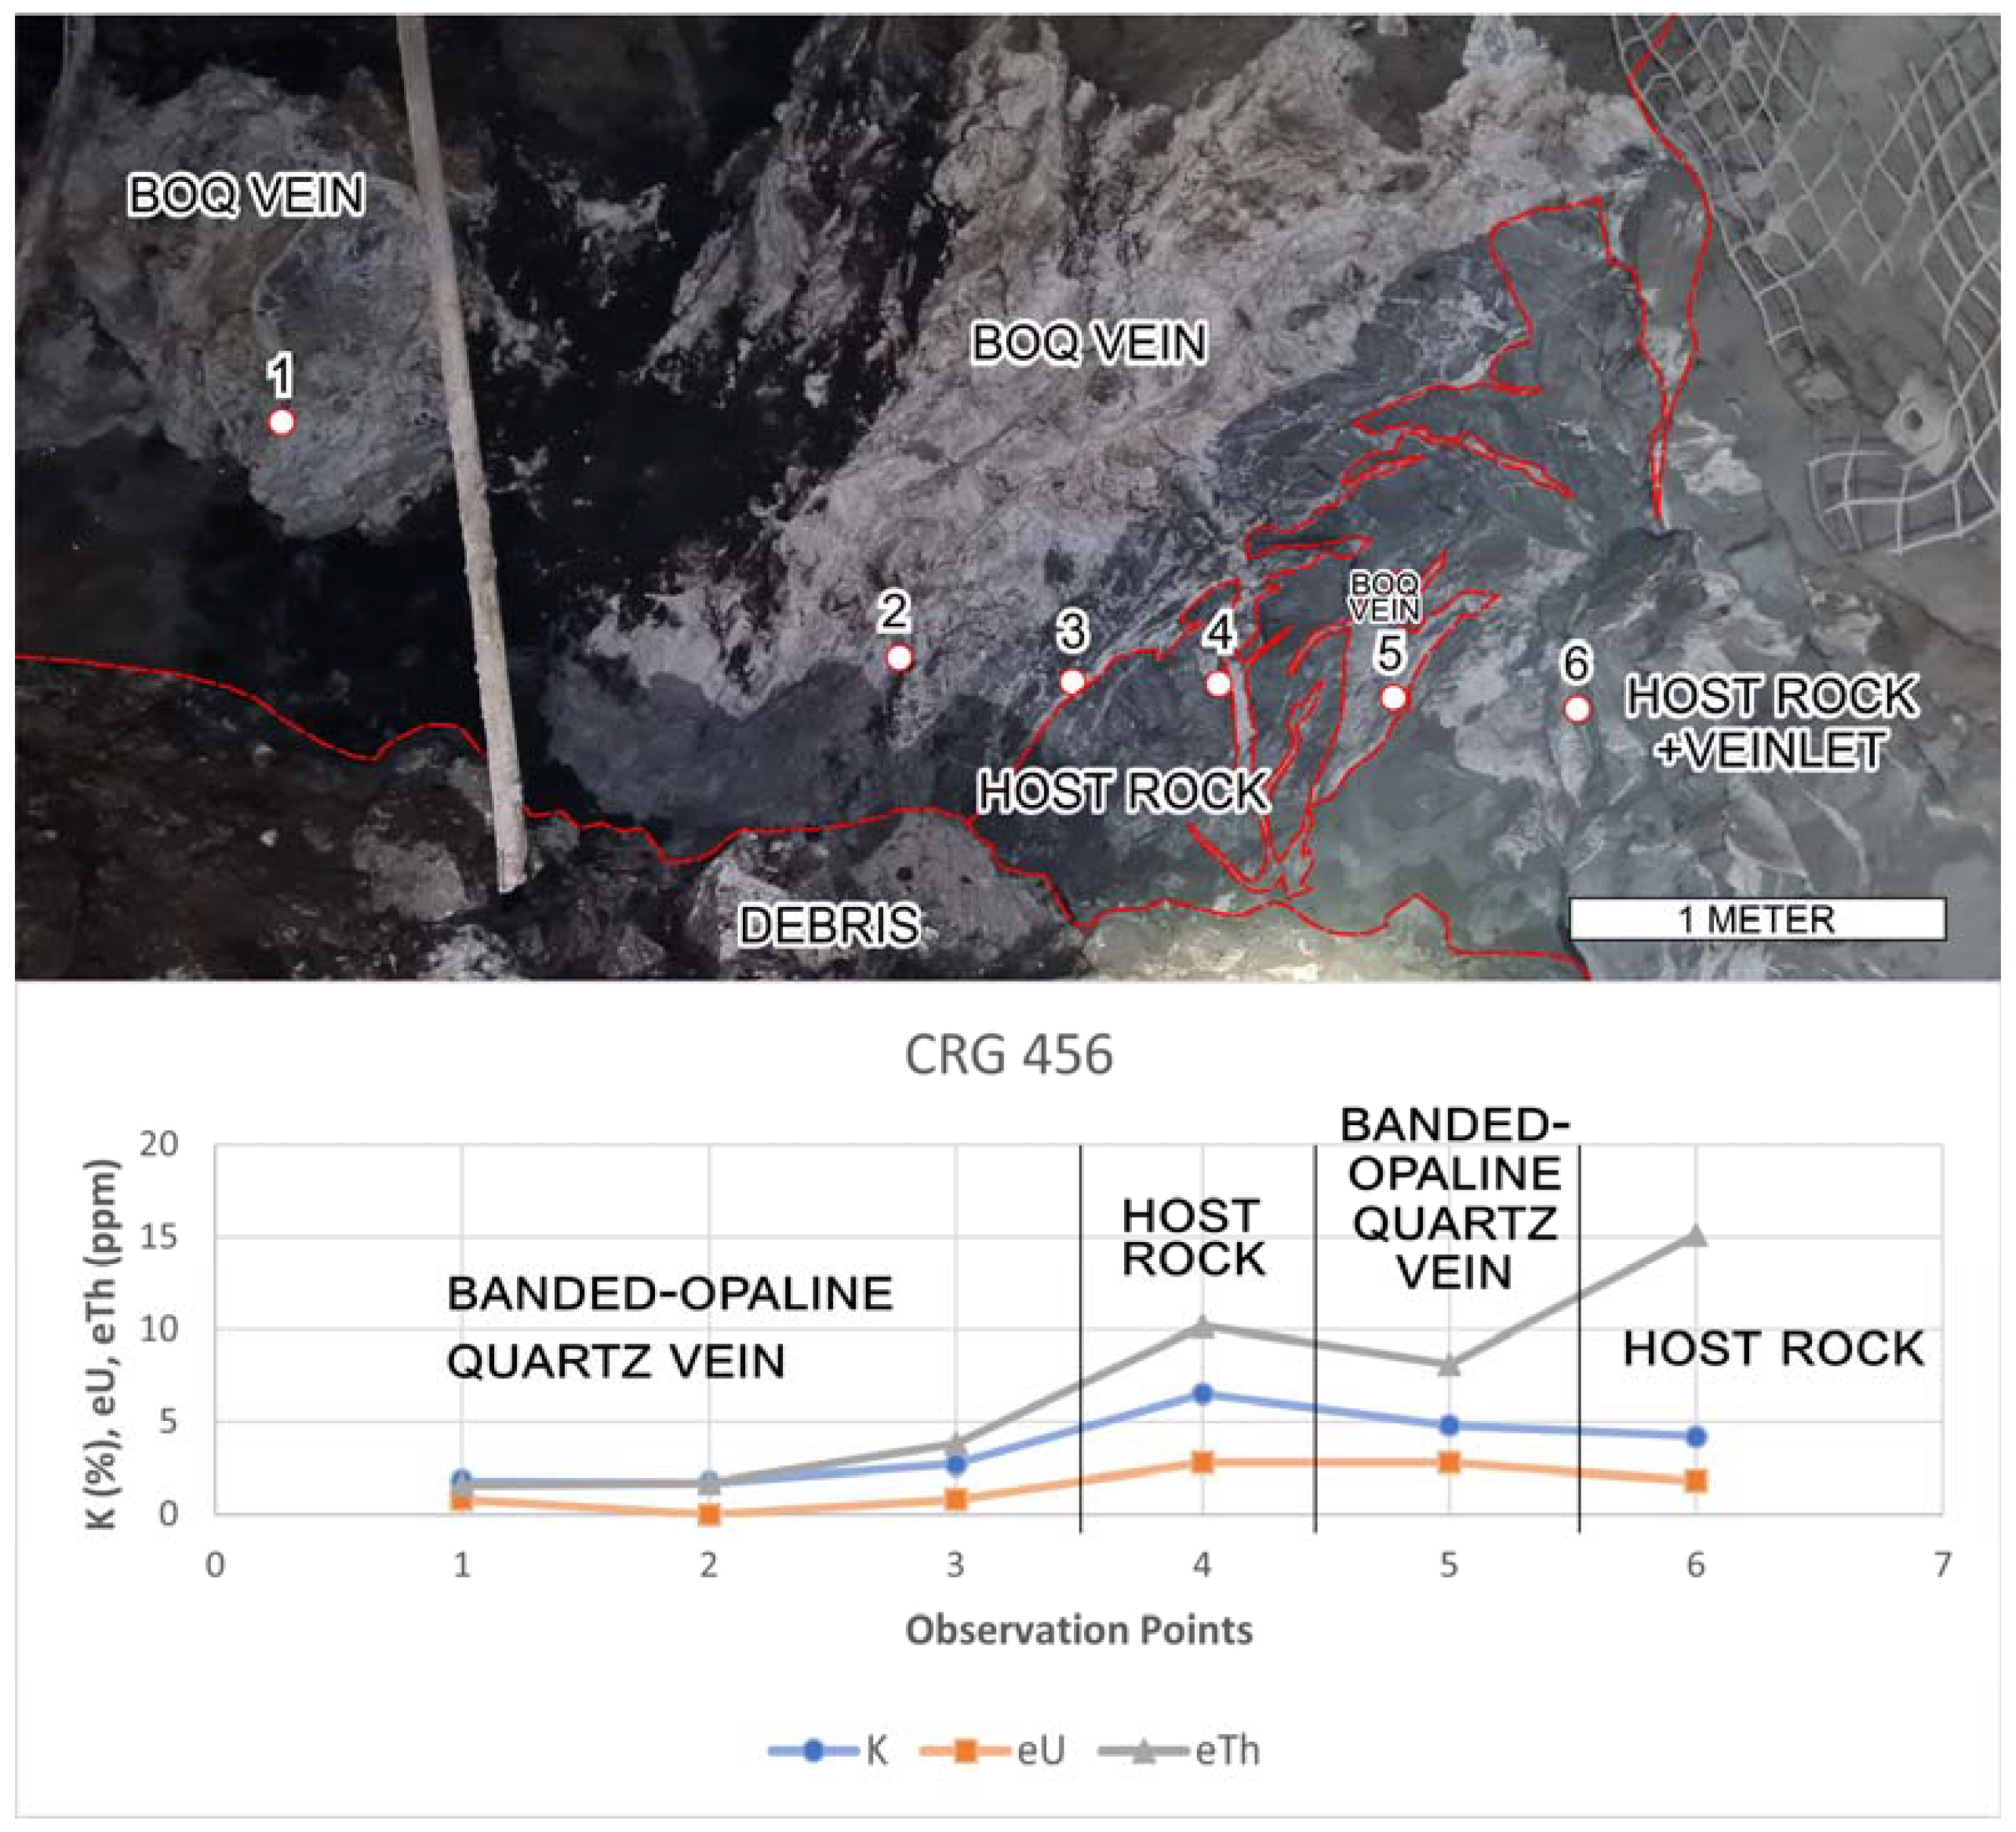
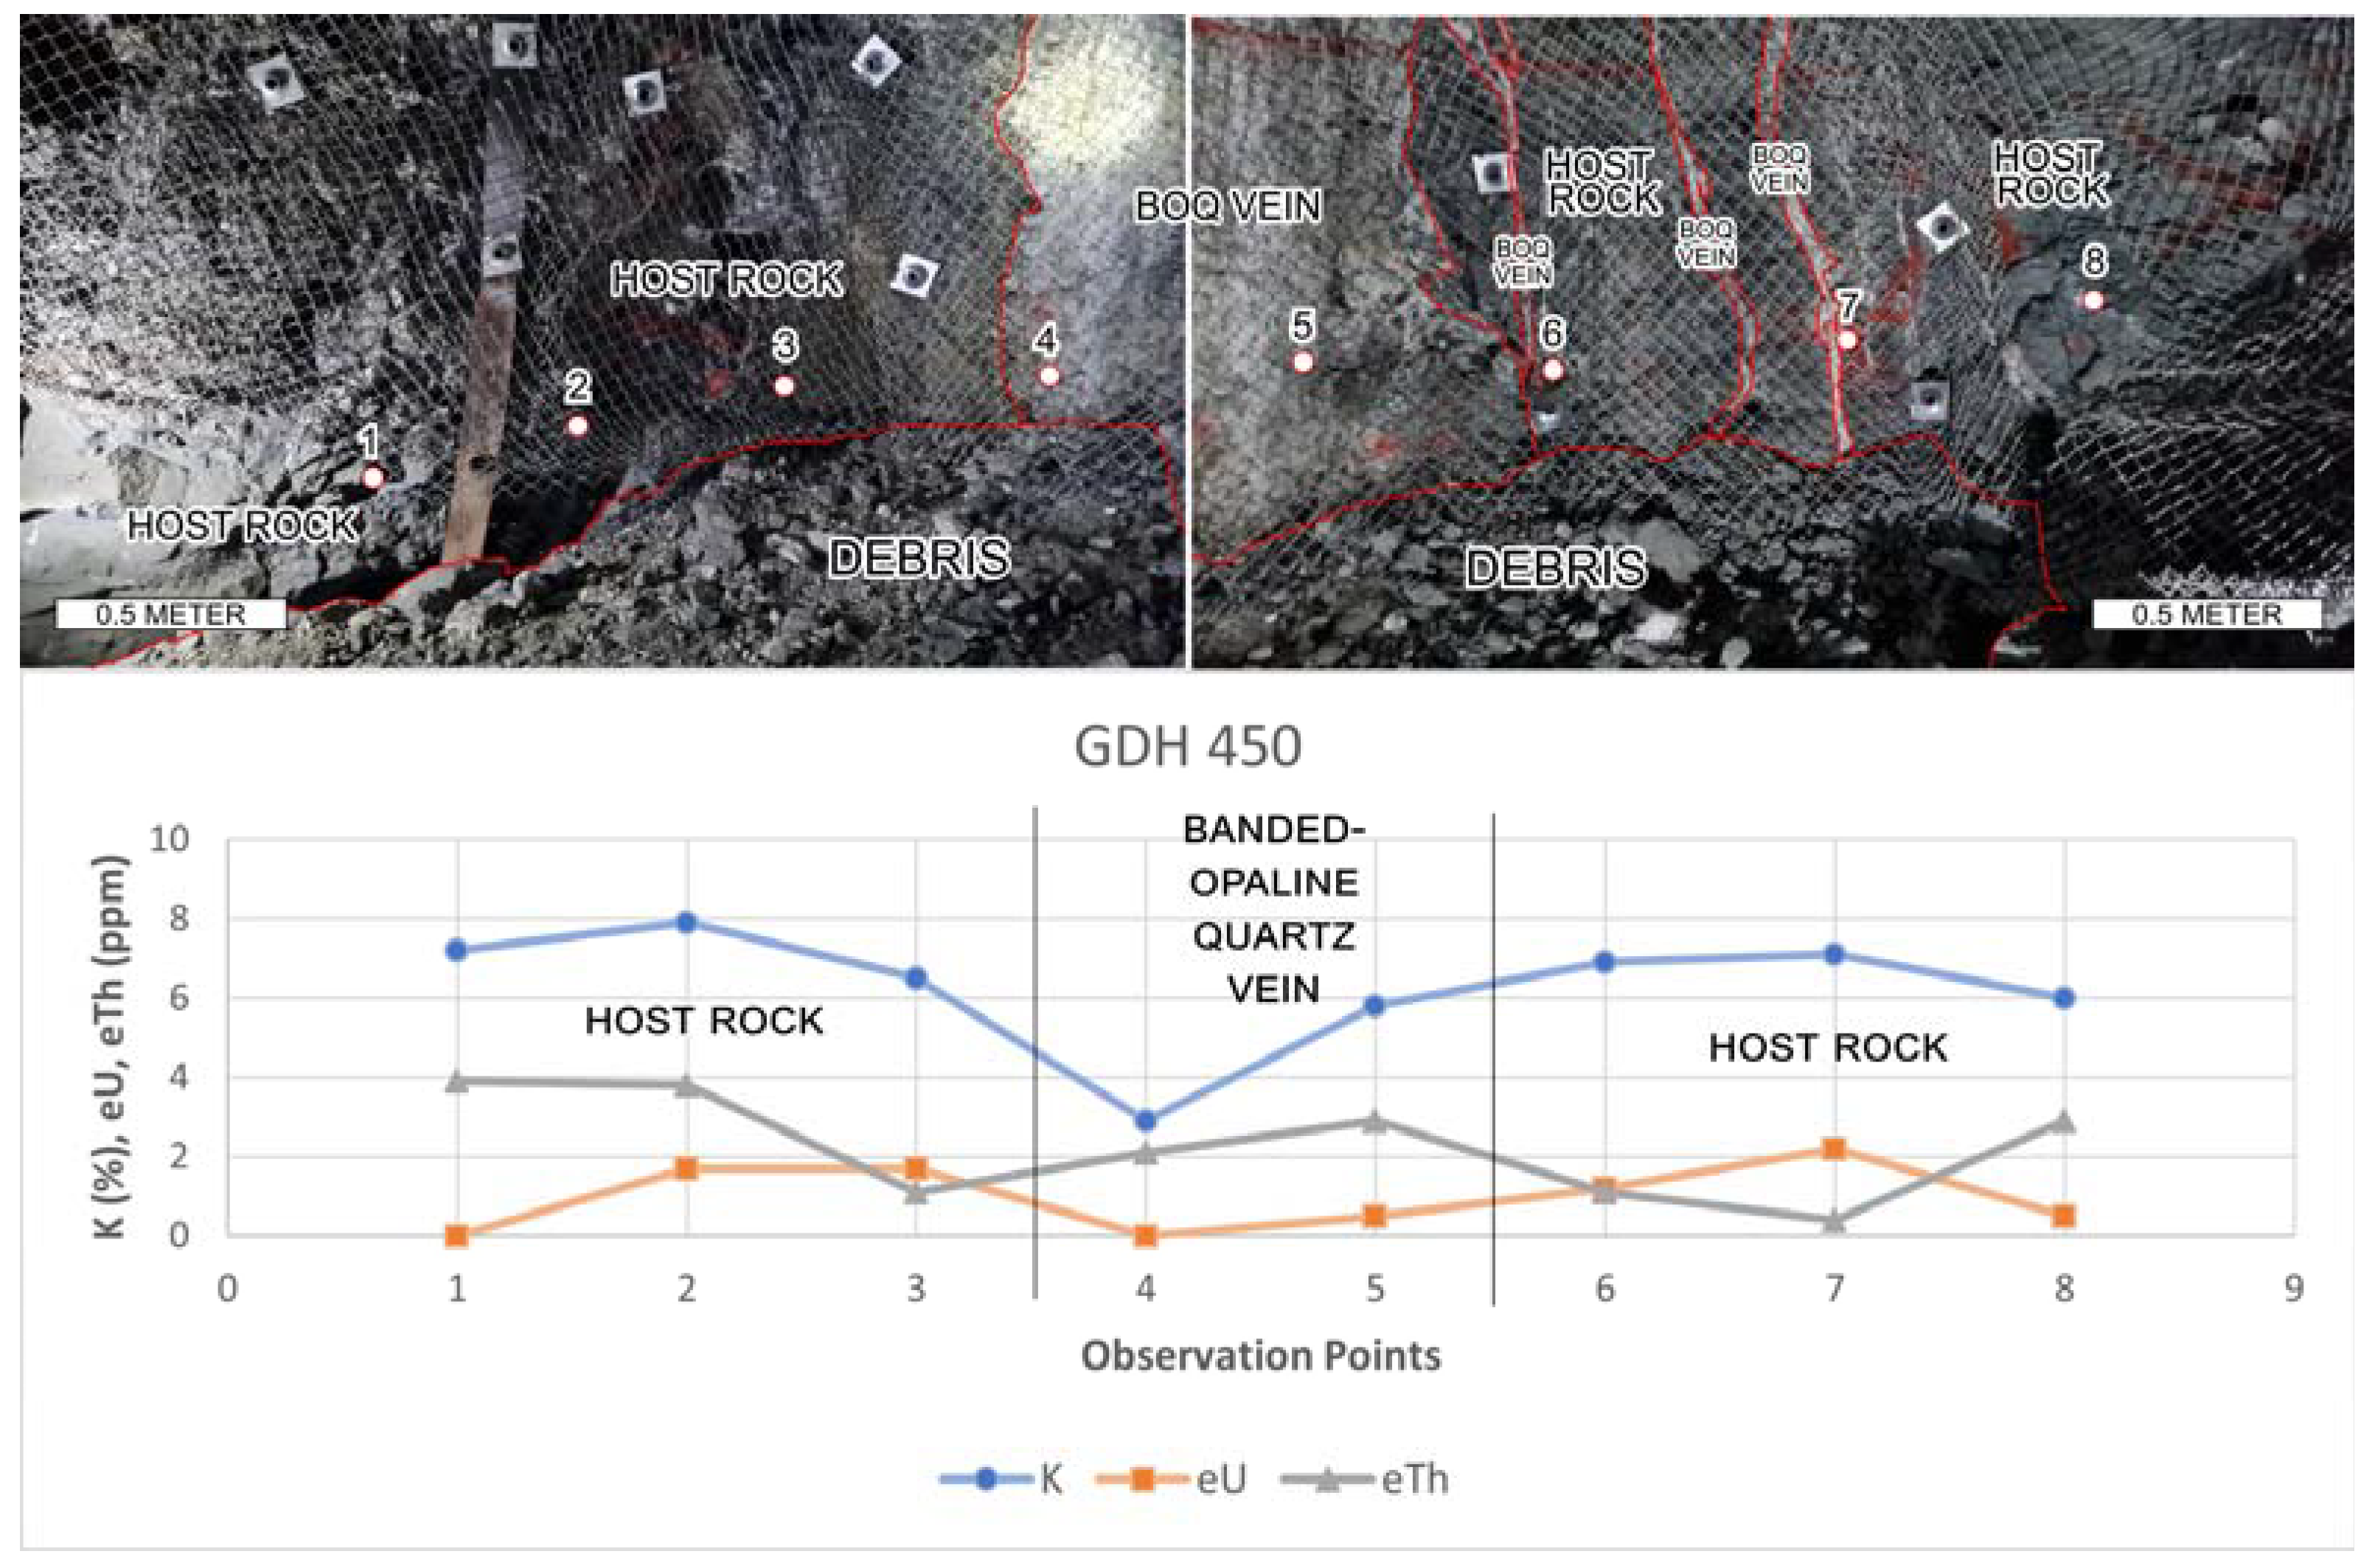
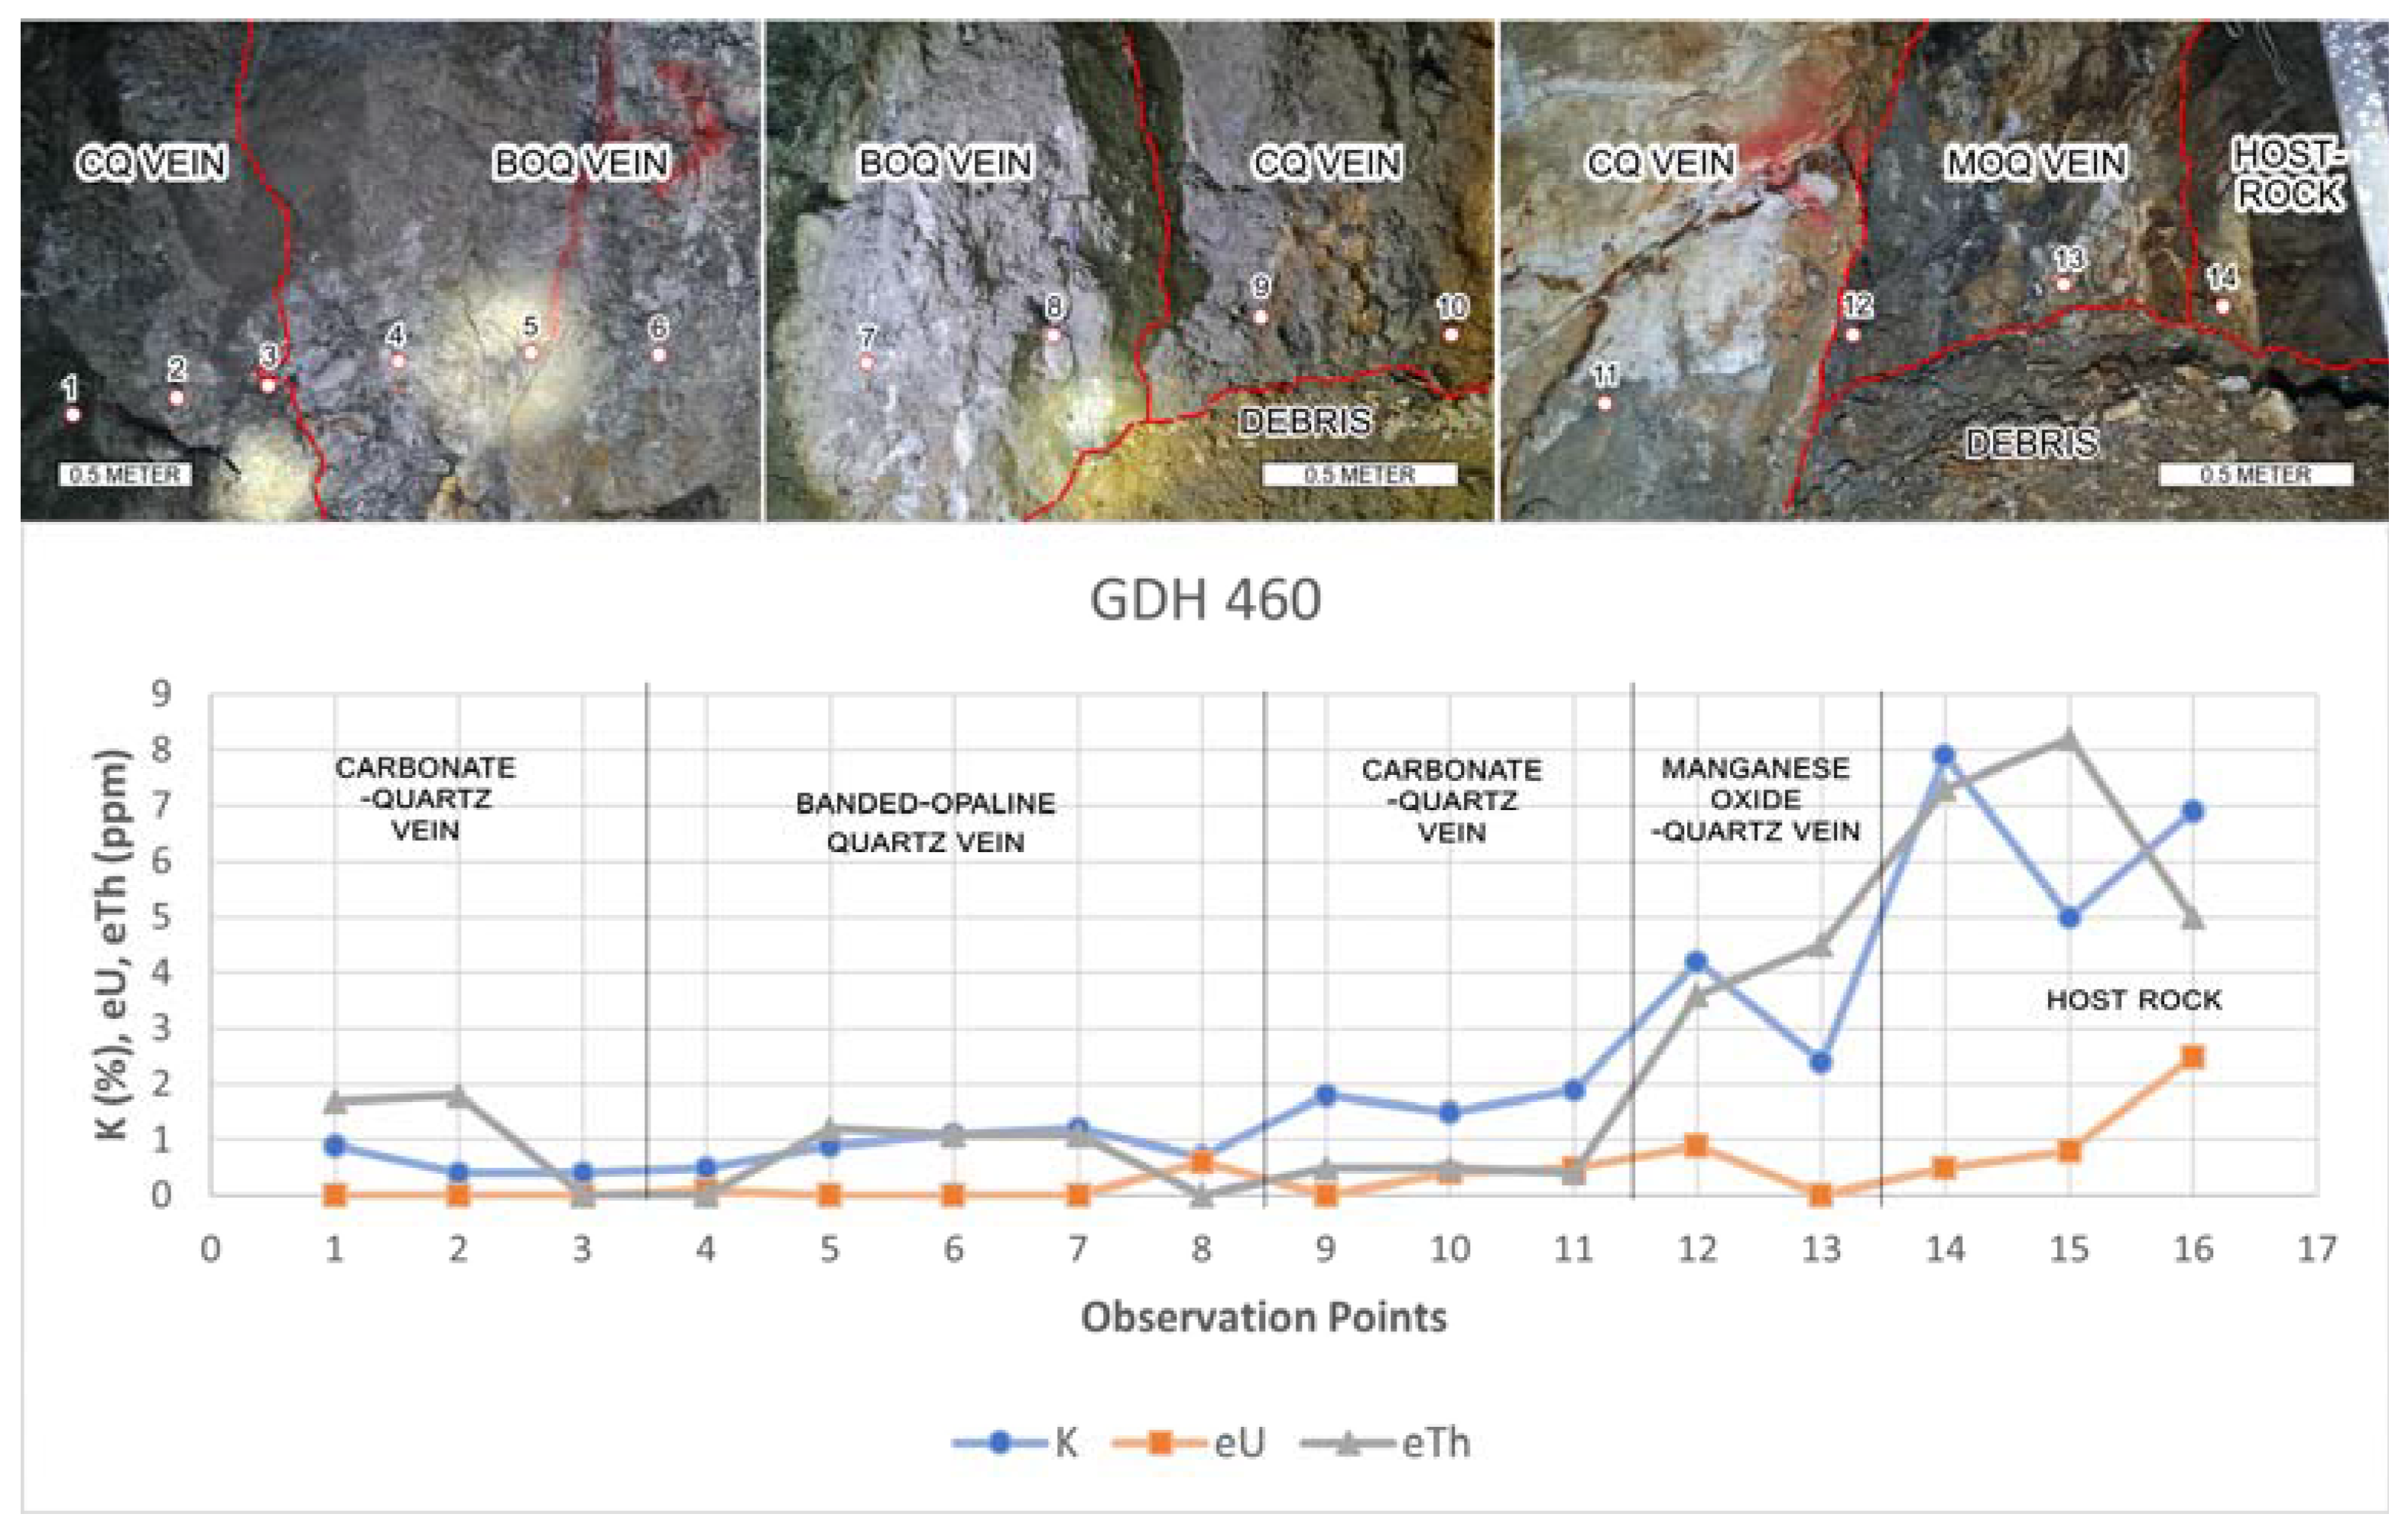
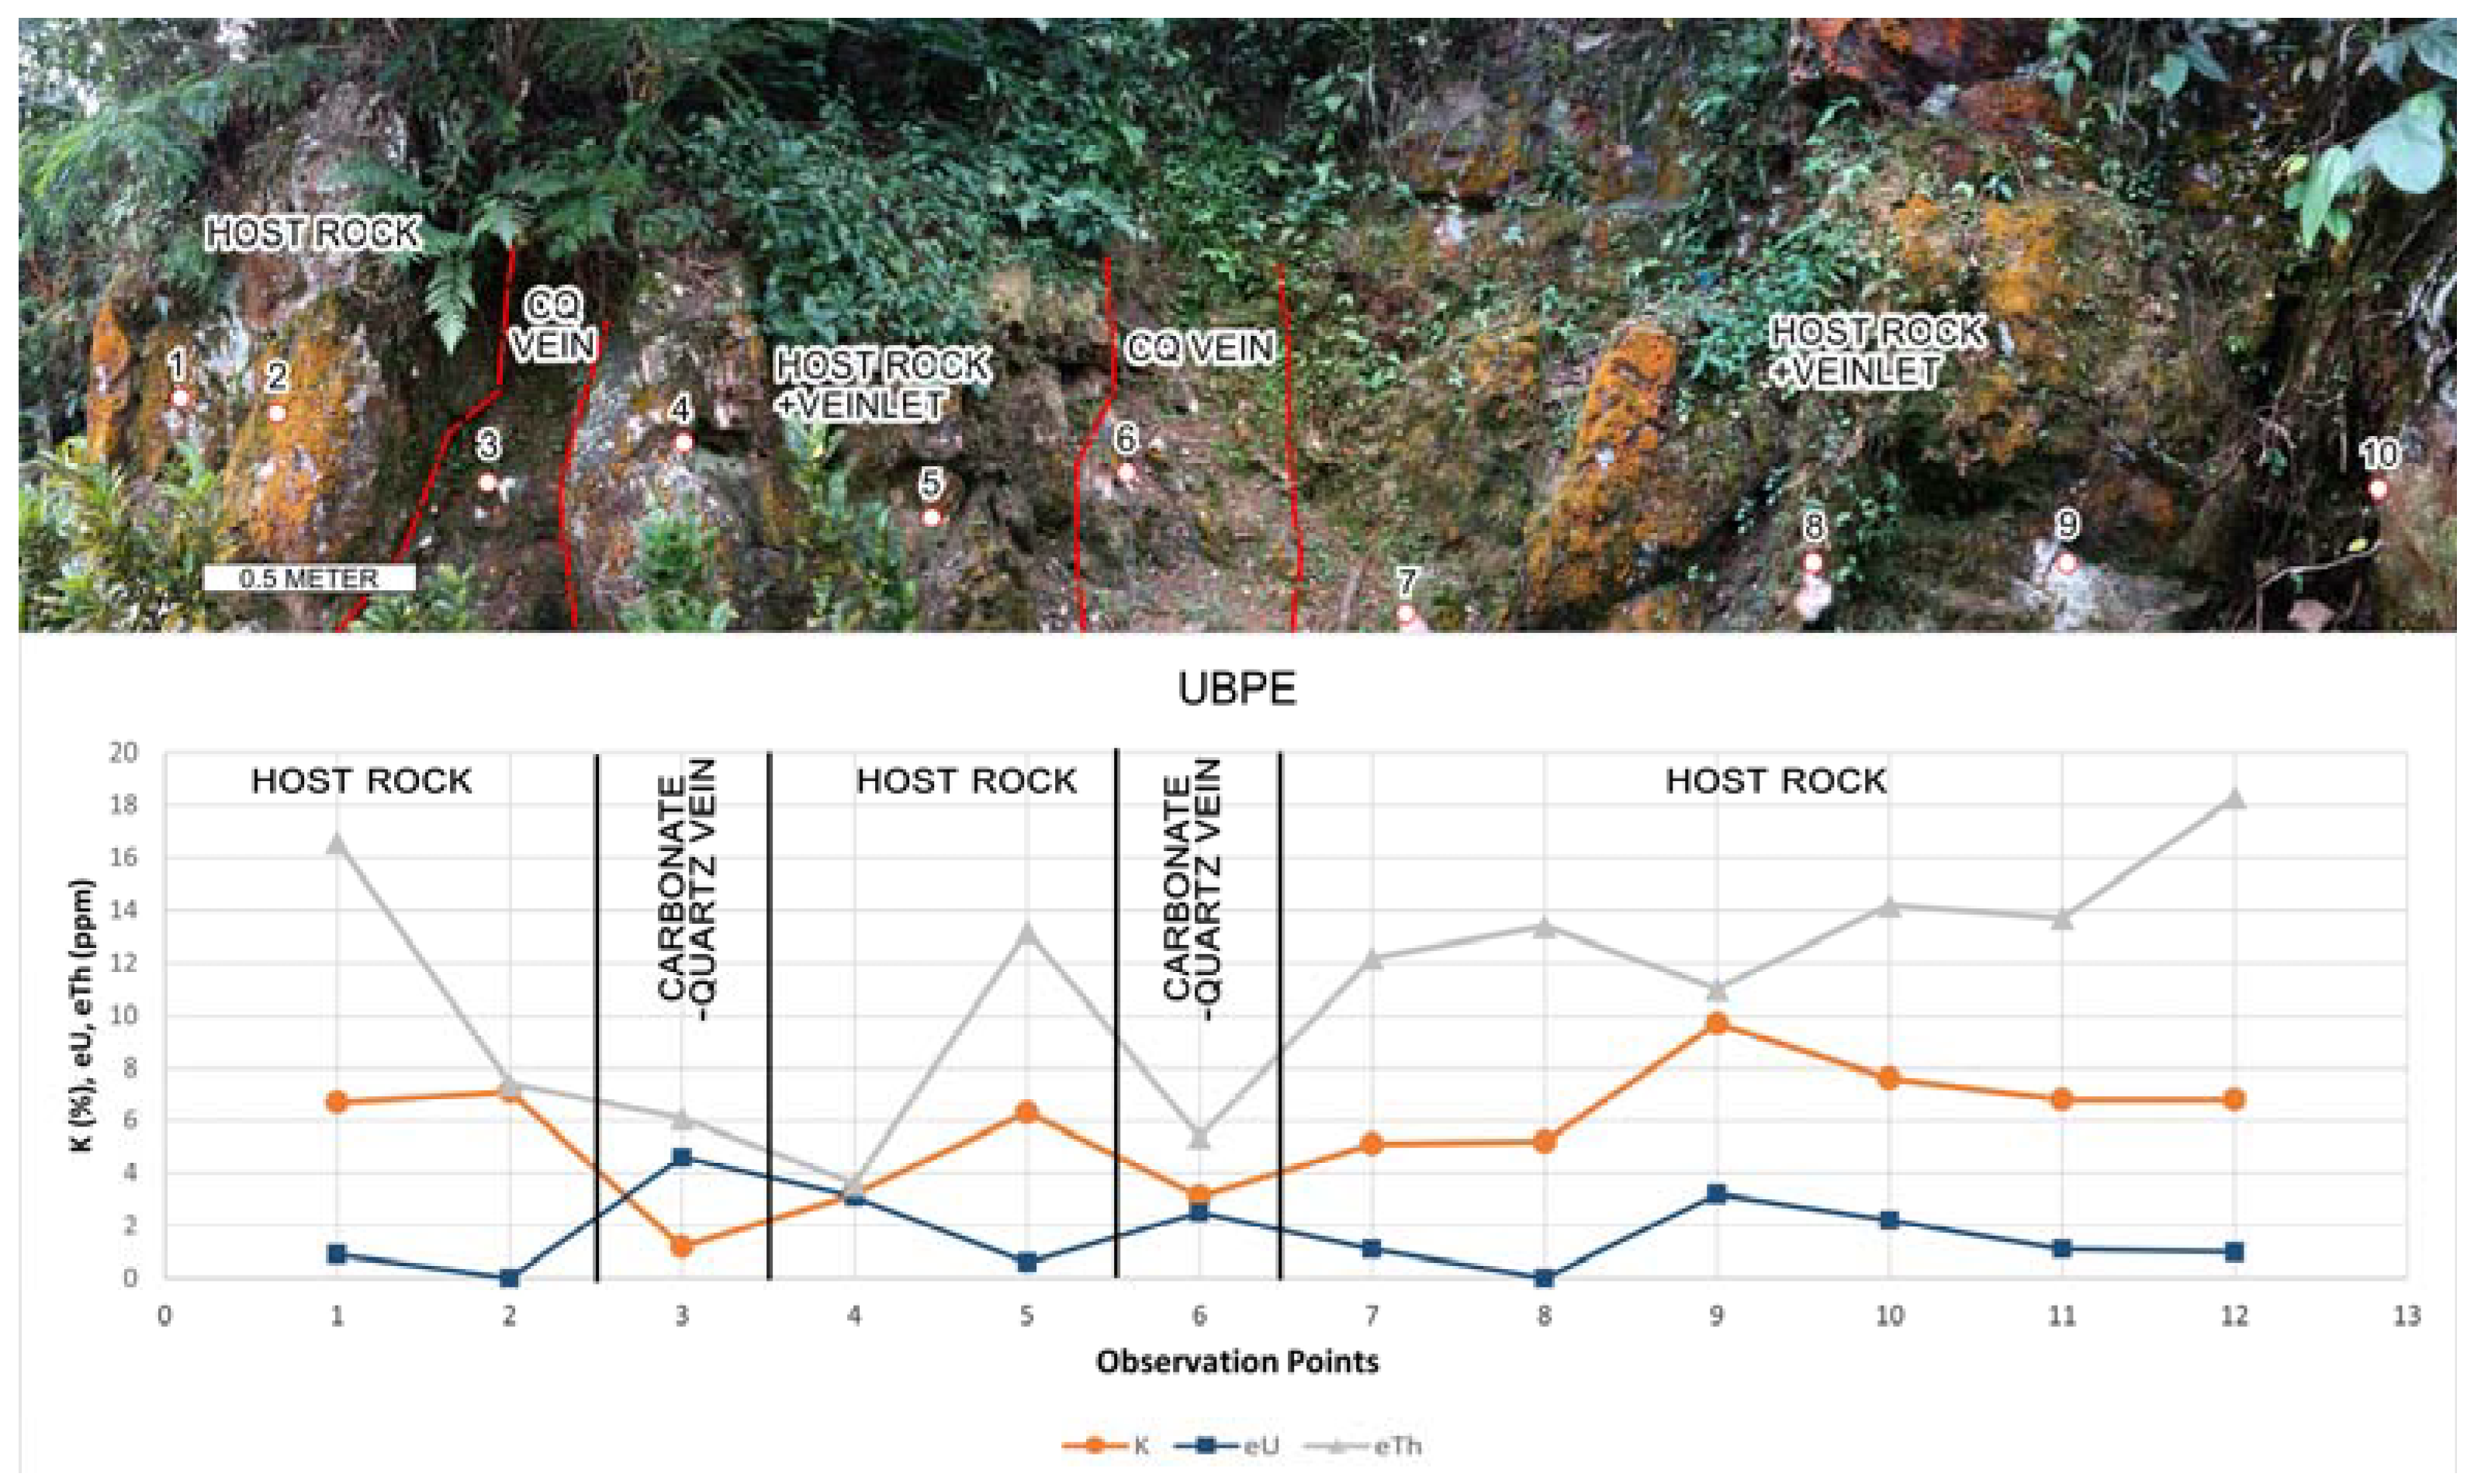
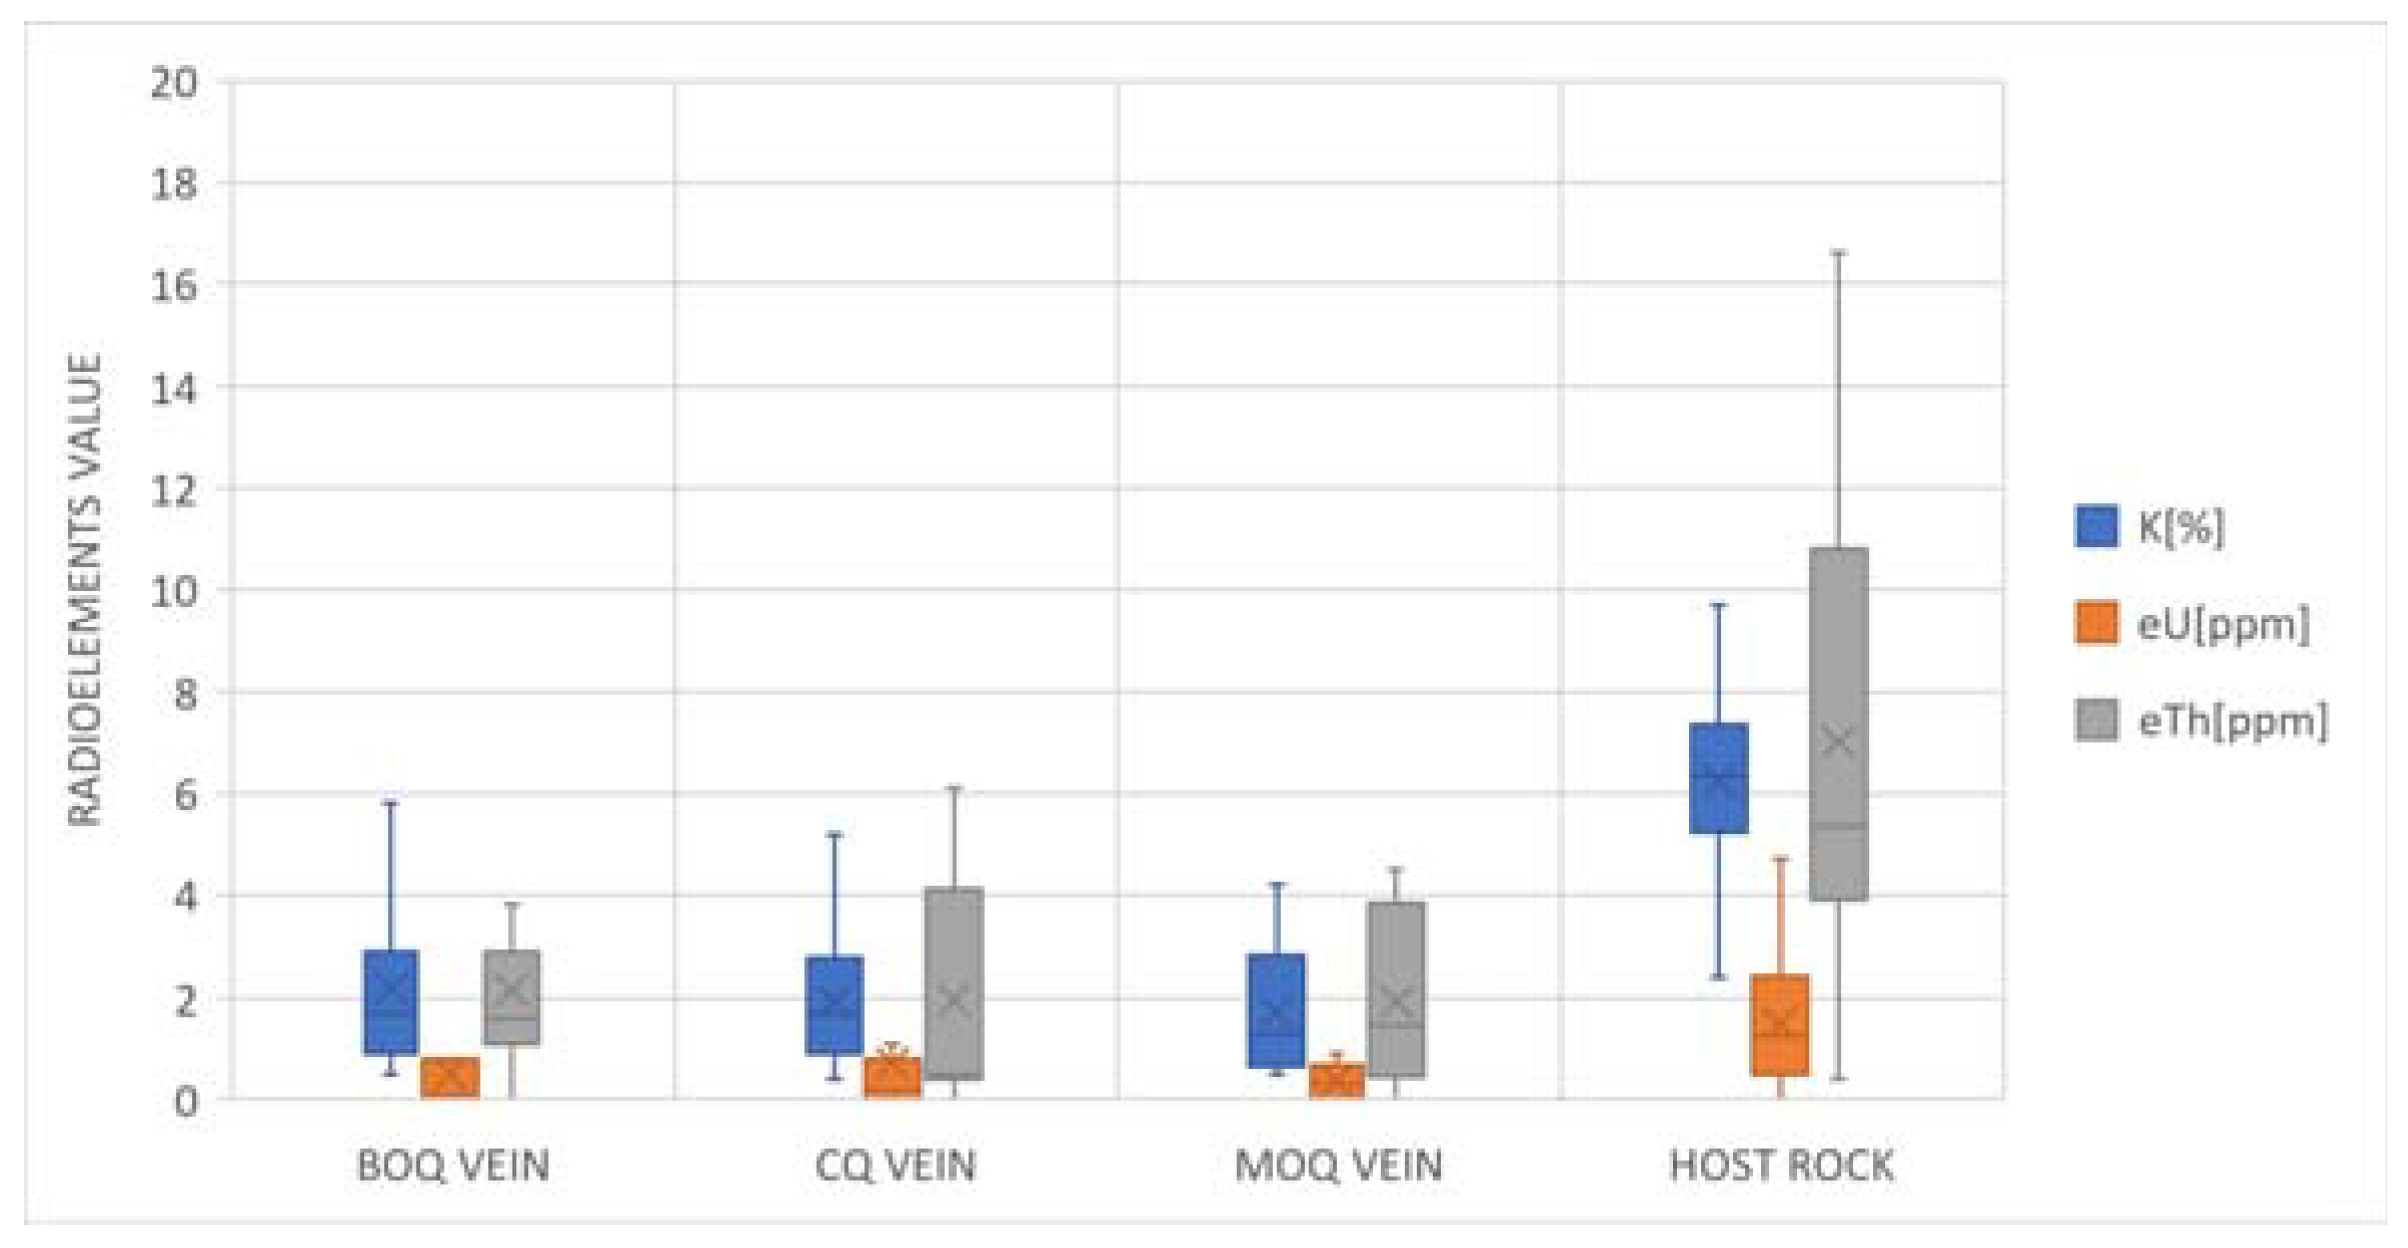
4.2. Radiometric Signatures of the Mining Fronts and Outcrop

The radiometric measurement was conducted on Ciguha, Ciurug, and Gudang Handak veins at various mining elevations. The Ciguha vein was measured at 490 m (CGH 490) and 492 m (CGH 492). The Ciurug vein was measured at 456 m (CRG 456) and the Gudang Handak vein at 450 m (GDH 450) and 460 m (GDH 460). A total of 33 measurements on the vein and 44 measurements on the host rock were obtained. There were no noteworthy differences between the K, eU, and eTh value distributions among the vein types, but the values in the host rock were generally distributed at higher values. Significant variations were noted on all radioelement values, where their mean in the host rock was three times higher than in the veins. There was also a significant increase in the range for eU and eTh.
The CGH 490 front is a good observation location in terms of representativeness because it contains three of the four vein types in the Pongkor deposit. The types of veins observed in this front were carbonate-quartz vein, manganese oxide-quartz vein, and banded quartz facies. The radiometric measurements of the cross-section of the CGH 490 front can be seen in Figure 4. The K, eU, and eTh values were relatively elevated in the host rock and fell in the veins. The radioelements value also decreased on the contact between the host rock and the vein (i.e., observation point 17). The elevated values of K and eTh were consistent, while the eU values were somehow varied. At some points, the eU showed low values in the host rock, as low as in the veins. The radioelement values among vein types were not so different.
Only the carbonate-quartz veins were found in the CGH 492 front. Figure 5 displays the radiometric signature of the CGH 492 front. The radiometric signature was not as ideal as the CGH 490 front, but a decrease in radioelements in the veins was observed, similar to the CGH 490 front, particularly the low K signature.
Meanwhile, the eTh and eU were relatively less consistent. The same phenomena were observed in the CRG 456 front, as depicted in Figure 6. The banded quartz veins observed in the CRG 456 front showed a low signature of all radioelements. We note a slight increase in radioactive elements in the host rock. The increase was best observed in the eTh signature. As for eU and eTh, on the transition between vein and host rock (observation points 5 and 6), the pattern was varying.
The pattern where the radioelements increase at the host rock and decrease at the vein was also observed in the GDH 450 front (Figure 7). The banded quartz vein type was observed on this front. The difference from the other front is a slight decrease of eTh in the host rock, as seen in observation points 6 and 7.
This eTh decrease was similar to the GDH 460 radiometric signature (Figure 8). We found three types of veins in this area. The increasing values of all radioelements were spotted in the host rock, along with lower values in the veins. The higher values on the manganese oxide-quartz vein than other vein types were also noticed.
The UBPE outcrop was weathered to a low degree. Nevertheless, the host rock and veins were still well-distinguished. The radiometric measurement cross-section of the UBPE outcrop is displayed in Figure 9. The increase in the host rock and decrease in the carbonate-quartz veins were obtained consistently for K and eTh. Despite that, the eU values were not synced with other radioelement signatures. Somehow, the eU values were decreased in the host rock and increased in the veins.

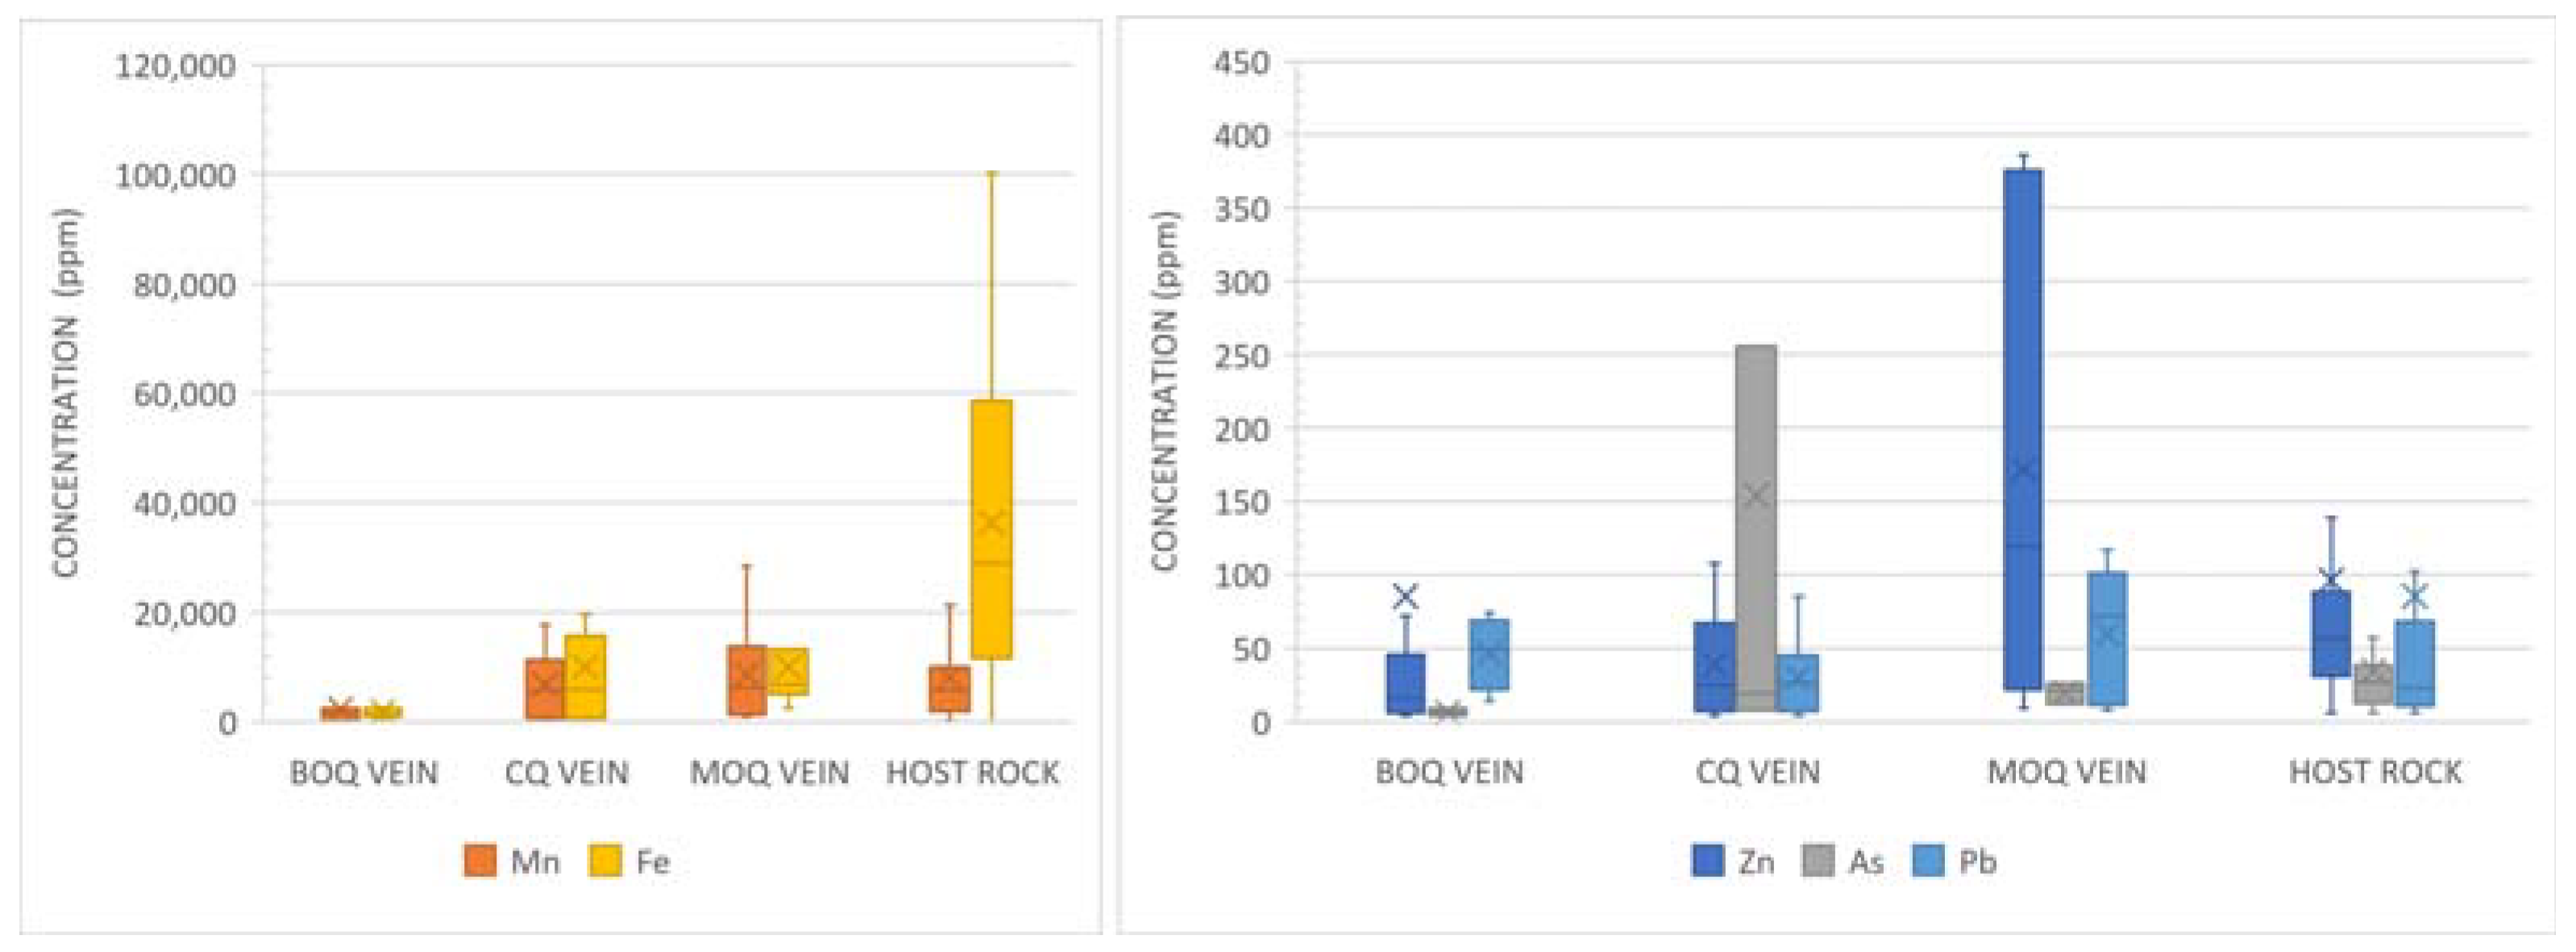
4.3. Geochemistry of the Mining Fronts and Outcrop

The K value from the pXRF has a strong Pearson’s correlation of 0.67 to the K value from the radiometric method among all samples. Thus, other sample elements were apple-to-apple comparable in terms of the sample size of the direct pXRF (centimetric) with the indirect method of radiometric measurement (decimetric). From the geochemical analysis, we selected five pathfinder elements of gold mineralization [36], which correspond to the elements in the Pongkor deposit [32] and have consistent results from the pXRF in the host rock and all vein types.
The pathfinder elements used were Mn, Fe, Zn, As, and Pb. Pearson’s correlation between the pathfinder elements and the radiometric signature can be seen in Table 1. In host rock, there is a moderate correlation between eU-Pb and eTh-As. In the BOQ vein, the correlation between K-Mn, K-Fe, K-Pb, eTh-Mn, and eTh-Fe is moderate. Meanwhile, eU-Pb shows a strong correlation. In the CQ vein, eU-Zn and eTh-Zn have a moderate correlation, and eU-Pb has a strong correlation. In the MOQ vein, K-Mn, K-Zn, K-Pb, eU-Mn, eU-Fe, eU-Zn, eU-Pb, eTh-Zn, and eTh-Pb have a moderate correlation and a strong correlation, as shown by K-As and eTh-As.
The statistical distribution of pathfinder elements in all types of veins and host rock is presented in Figure 10. Compared to the veins, the Fe content of the host rock was much higher. No other pathfinders follow this behavior. On the vein types, all pathfinders exhibited various ups and downs. The Mn composition in the MOQ vein was slightly higher and had a broader range than the other veins and host rock. The contents of As in the CQ vein and Zn in the MOQ vein were significantly higher than in other vein types and host rocks. The Pb content was not as fluctuating as other pathfinders.

5. Discussion

The altered zone shows highly elevated K content, more than twice that of the unaltered zone (Figure 11). Potassium is geochemically more mobile than other radioelements. This increase in K% content in the altered zone indicates migration of potassium and accumulation in the altered zone, leading to potassic alteration. In the Pongkor gold deposit, K-bearing minerals found in the altered rocks are illite and adularia [16,30,33]. Illite is found in several alteration types, such as argillic and potassic alteration. Adularia was commonly found in potassic alteration and all vein types [16]. The low K content in the unaltered zone was due to limited K-bearing minerals in unaltered andesitic rocks such as biotite.
Following K content enrichment in the altered host rock, the eTh concentration also slightly increases. The most significant contrast is in the K value. The K value in the unaltered zone is distributed at a low value with a short range of generally less than 1.4%. The altered zone’s K distribution generally increased to more than 1.4% (Figure 3 and Figure 11).
Thorium, an immobile element, is usually not much affected by hydrothermal alteration processes. Nevertheless, in this research area, the presence of thorium increases in the altered zone. The increase in Th usually does not accompany potassium in hydrothermal alteration processes [6,8,13]. Nonetheless, separate analysis of radioelements cannot give a reliable clue for the hydrothermally altered zone by itself because the increase or decrease of radioelements can be a result of several processes other than hydrothermal alteration [37,38]. In this case, the radioelement ratios were suitable for determining where potassium concentrations were high. High K/eTh ratios, which imply a hydrothermally altered area, clearly distinguish the altered zone from the unaltered zone in this research area.
Radioelement signatures in the mining fronts show distinguishable patterns between host rocks and all vein types. In the host rock, radioelement content reaches twice to three times what it does in the vein (Figure 12). The hydrothermal alteration involves the fracture system’s fluid-rock interaction and mineral precipitation. One of the effects of fluid-rock interaction in host rocks is increasing the potassium content in the host rock in the form of secondary K-feldspar [19,33]. Due to this, the radioelements, especially potassium, show an increasing pattern in the host rock. In the quartz vein, even though some K-Feldspar (adularia) precipitates, there is no deposition or precipitation of other minerals containing radioelements [19,33]. Thus, the radioactive signature is low in the vein.
Radiometric measurement for eU shows the varying signatures in the host rock and veins. Considered a mobile element, the nature of the U may cause the fluctuation. In the mining case, when the hydrothermal fluid interacts with the host rock under oxidizing conditions, an amount of U can be leached from the host rock and then absorbed by secondary minerals in the vein [39]. This process may be followed by other oxidizing conditions on the veins and host rock, causing U to move so that the eU concentrations can vary along the vein cross-sections.
The gold pathfinder elements used in this research were correlated to several ore minerals found in the Pongkor Gold deposit. The Mn originated from manganese minerals such as rhodonite or rhodocrosite, customarily found in the Pongkor vein [16]. The Fe was a reflection of the pyrite (FeS2) or chalcopyrite (CuFeS2) mineral that disseminated throughout the vein [16,32]. The source of Pb is galena (PbS), and Zn comes from sphalerite (ZnS) [16,32]. The origin of As interpreted, could be from pearceite ((AgCu)16As2S11) or proustite (Ag3AsS3), which form infill or vug filling [32].
The correlation between all pathfinders and the radioelements in the host rock was dominantly poor (Table 1). The host rock in mining fronts was dominantly controlled by propylitic alteration, which formed chlorite, epidote, carbonate, and quartz [16]. On the other hand, ore minerals are dominantly controlled by the formation of the vein [16,32]. Therefore, the differences in the processes experienced by the host rock and the presence of ore minerals cause a low correlation coefficient between the pathfinders and radioelements.
Generally, all pathfinder elements have a moderate negative correlation to radioelements except for Pb in the BOQ vein, Pb in the CQ vein, and As in the MOQ vein, which have a good to strong positive correlation (Table 1). In the vein, the possible sources for radioelement minerals are secondary K–feldspar (adularia) and clay minerals (illite) [16,19,33]. The occurrences of those radioelement minerals were associated with the ore minerals in the vein, thus resulting in a good correlation number for both elements. The negative results of the Pearson correlation indicate that radioelements and pathfinders are not hosted in the same minerals [40]. For Pb in the BOQ vein and As in the MOQ vein that have a good to strong positive correlation to radioelements, it is most likely caused by the adsorption process of Pb and As in clay minerals (illite) [41,42,43].
Based on this study, radiometric mapping has an excellent benefit for the exploration of LS epithermal gold deposits. In this research area, the alteration covers a large zone in the middle pyroclastic unit [30]. At the surface, these altered rocks occupy an area of more than 3 × 3 km2 (Figure 2). Therefore, in the preliminary exploration stage for delineating the alteration zone, a 100- to 200 m line spacing could be applied. An iso K or eTh/K map could be selected for this purpose.
Furthermore, more detailed radiometric mapping could be applied to delineate vein bodies. The thickness of the veins varies. For example, Pasir Jawa averages 4.32 m, Ciguha 3.45 m, and Kubang Cicau 4.11 m [16,32]. Line spacing of 5 to 10 m could be applied for this purpose. The mineralized vein would be identified as having a low K or eTh value. To enhance the contrast of the altered host rock with the mineralized vein in the radiometric map, the iso K x eTh could be selected.

6. Conclusions

The radiometric measurement method is a potent tool for exploration in epithermal LS gold deposits. This method could differentiate between unaltered and altered host rocks related to gold mineralization. Furthermore, the radioelement characteristics of the mineralized vein and altered host rock were distinguishable. Geochemically, the radioelements show an excellent correlation with several gold pathfinder elements.
In this study, the unaltered host rocks are characterized by low K and high eTh/K ratios. Conversely, the altered host rock has a high K and a low eTh/K value. In the mining fronts, the mineralization veins show low radioelement signatures. The range of the radioelement’s signatures is relatively similar throughout different mineralization vein facies.
The gold pathfinders used in this research, Mn, Fe, Zn, As, and Pb, show good association with the positive or negative radioelements. The positive correlation of Pb and As to the radioelements indicates the adsorption process of both elements to the clay mineral (illite) found in the mineralization vein. The negative correlation of the pathfinders to the radioelements implies that both pathfinders and radioelements were not hosted in the same mineral. The possible radioactive minerals in the vein were secondary K-Feldspar (adularia). On the other hand, the pathfinders corresponded to several ore minerals such as rhodonite, rhodochrosite, pyrite, chalcopyrite, sphalerite, galena, pearceite, and proustite.
Based on this study, radiometric mapping has an excellent benefit for the exploration of LS epithermal gold deposits. Two stages of the radiometric mapping approach might be applied: a preliminary exploration stage for delineating the alteration zone and a more detailed stage for delineating vein bodies.

Author Contributions

Conceptualization, H.S., I.G.S., R.C.C. and T.B.A.; methodology, H.S., I.G.S., R.C.C., T.B.A. and F.D.I.; validation, H.S., F.D.I., S.S. and A.S.; formal analysis, T.B.A., R.C.C., F.P., H.A.P., D.M., K.S.W. and S.W.; investigation, H.S., I.G.S., F.D.I., R.C.C., T.B.A. and B.S.; resources, H.S., I.G.S., F.D.I., R.C.C., T.B.A., F.P., A.S. and S.S.; data curation, R.C.C., T.B.A., F.P., A.S. and H.A.P.; writing—original draft preparation, H.S., R.C.C. and T.B.A.; writing—review and editing, K.S.W., S.W., M.B., I.S. and B.S.; visualization, T.B.A. and R.C.C.; supervision, K.S.W., S.W., M.B., I.S. and B.S.; project administration, F.D.I. and B.S.; funding acquisition, H.S., F.D.I., I.G.S., R.C.C. and T.B.A. All authors have read and agreed to the published version of the manuscript.

Funding

This research was funded by the National Research and Innovation Agency, grant numbers RP ORNM 105/2023 and RP HITN D2471/2023 (SK B-528/III.2/TN/12/2022).

Data Availability Statement

All relevant data are in this paper.

Acknowledgments

The authors thank PT. Antam Tbk., especially the GM of UBPE Pongkor, Muhidin, and Vice GM, Octa Benny Raharja, for their support during data acquisition and investigation in the Pongkor mining area. We also thank the geologist and mine engineer colleagues of the Geomin Antam Team in UBPE Pongkor, Satria Besari, Dwi Margianto, Jumbadi, Suparjono, and Andik Purwoko for the discussion during the field survey. We also thank our Head of the Research Center, Syaiful Bakhri, for all of the support on the field investigation and laboratory analysis. We also thank our internship students Alhayyu Druvadi Adnoor, Muhammad Helmi Fauzi, Aghnia Syahputri Dimar, Fathiah Mubina, Muh Irdhan, Alwinas David Sanjaya, and Angel Nathasya Emerald for their assistance in data curation and formal analysis.

Conflicts of Interest

Author Bronto Sutopo was employed by the company PT. Antam Tbk. The remaining authors declare that the research was conducted in the absence of any commercial or financial relationships that could be construed as a potential conflict of interest.

References

  1. Elkhateeb, S.O.; Abdellatif, M.A.G. Delineation potential gold mineralization zones in a part of Central Eastern Desert, Egypt using Airborne Magnetic and Radiometric data. NRIAG J. Astron. Geophys. 2018, 7, 361–376. [Google Scholar] [CrossRef]
  2. Chiozzi, P.; Pasquale, V.; Verdoya, M. Radiometric survey for exploration of hydrothermal alteration in a volcanic area. J. Geochem. Explor. 2007, 93, 13–20. [Google Scholar] [CrossRef]
  3. Syaeful, H.; Sukadana, I.G.; Sumaryanto, A. Radiometric Mapping for Naturally Occurring Radioactive Materials (NORM) Assessment in Mamuju, West Sulawesi. Atom Indones. 2014, 40, 33–39. [Google Scholar] [CrossRef]
  4. Gde Sukadana, I.; Wayan Warmada, I.; Harijoko, A.; Indrastomo, F.D.; Syaeful, H. The Application of Geostatistical Analysis on Radiometric Mapping Data to Recognized the Uranium and Thorium Anomaly in West Sulawesi, Indonesia. IOP Conf. Ser. Earth Environ. Sci. 2021, 819, 012030. [Google Scholar] [CrossRef]
  5. El-Sadek, M.A. Radiospectrometric and magnetic signatures of a gold mine in Egypt. J. Appl. Geophys. 2009, 67, 34–43. [Google Scholar] [CrossRef]
  6. Shives, R.B.K.; Charbonneau, B.W.; Ford, K.L. The detection of potassic alteration by gamma-ray spectrometry-Recognition of alteration related to mineralization. Geophysics 2000, 65, 2001–2011. [Google Scholar] [CrossRef]
  7. Atta, S.K. Mapping subsurface geological structures in the Birimian Supergroup, Ghana using airborne magnetic and radiometric data: Implications for gold exploration. J. Afr. Earth Sci. 2023, 205, 105003. [Google Scholar] [CrossRef]
  8. Olomo, K.O.; Bayode, S.; Alagbe, O.A.; Olayanju, G.M.; Olaleye, O.K. Multifaceted investigation of porphyry Cu-Au-Mo deposit in hydrothermal alteration zones within the gold field of Ilesha Schist Belt. Malaysian J. Geosci. 2022, 6, 45–53. [Google Scholar] [CrossRef]
  9. Salawu, N.B.; Omosanya, K.O.L.; Eluwole, A.B.; Saleh, A.; Adebiyi, L.S. Structurally-controlled Gold Mineralization in the Southern Zuru Schist Belt NW Nigeria: Application of Remote Sensing and Geophysical Methods. J. Appl. Geophys. 2023, 211, 104969. [Google Scholar] [CrossRef]
  10. Honarmand, M. Application of Airborne Geophysical and ASTER Data for Hydrothermal Alteration Mapping in the Sar-Kuh Porphyry Copper Area, Kerman Province, Iran. Open J. Geol. 2016, 6, 1257–1268. [Google Scholar] [CrossRef]
  11. Kwan, K.; Prikhodko, A.; Legault, J.M.; Plastow, G.C.; Kapetas, J.; Druecker, M. VTEM airborne EM, aeromagnetic and gamma-ray spectrometric data over the Cerro Quema high sulphidation epithermal gold deposits, Panama. Explor. Geophys. 2016, 47, 179–190. [Google Scholar] [CrossRef]
  12. Richarte, D.; Correa-Otto, S.; Lince Klinger, F.; Giménez, M. Geophysical characterization of a low sulfidation epithermal gold and silver deposit, Mendoza, Argentina. J. S. Am. Earth Sci. 2023, 123, 104227. [Google Scholar] [CrossRef]
  13. Maden, N.; Akaryali, E. Gamma ray spectrometry for recognition of hydrothermal alteration zones related to a low sulfidation epithermal gold mineralization (eastern Pontides, NE Türkiye). J. Appl. Geophys. 2015, 122, 74–85. [Google Scholar] [CrossRef]
  14. Feebrey, C.A.; Hishida, H.; Yoshioka, K.; Nakayama, K. Geophysical Expression of Low Sulphidation Epithermal Au-Ag Deposits and Exploration Implications -Examples from the Hokusatsu Region of SW Kyushu, Japan. Resour. Geol. 1998, 48, 75–86. [Google Scholar] [CrossRef]
  15. Susilohadi, S.; Gaedicke, C.; Ehrhardt, A. Neogene structures and sedimentation history along the Sunda forearc basins off southwest Sumatra and southwest Java. Mar. Geol. 2005, 219, 133–154. [Google Scholar] [CrossRef]
  16. Milési, J.P.; Marcoux, E.; Sitorus, T.; Simandjuntak, M.; Leroy, J.; Bailly, L. Pongkor (west Java, Indonesia): A Pliocene supergene-enriched epithermal Au-Ag-(Mn) deposit. Miner. Depos. 1999, 34, 131–149. [Google Scholar] [CrossRef]
  17. Warmada, I.W.; Lehmann, B.; Simandjuntak, M.; Hemes, H.S. Fluid inclusion, rare-earth element and stable isotope study of carbonate minerals from the Pongkor epithermal gold-silver deposit, West Java, Indonesia. Resour. Geol. 2007, 57, 124–135. [Google Scholar] [CrossRef]
  18. Titisari, A.D.; Phillips, D.; Warmada, I.W.; Hartono; Idrus, A. 40Ar/39Ar geochronology of the Pongkor low sulfidation epithermal gold mineralisation, West Java, Indonesia. Ore Geol. Rev. 2020, 119, 103341. [Google Scholar] [CrossRef]
  19. Syafrizal; Imai, A.; Watanabe, K. Origin of ore-forming fluids responsible for gold mineralization of the Pongkor Au-Ag deposit, West Java, Indonesia: Evidence from mineralogic, fluid inclusion microthermometry and stable isotope study of the Ciurug-Cikoret veins. Resour. Geol. 2007, 57, 136–148. [Google Scholar] [CrossRef]
  20. Prihatmoko, S.; Idrus, A. Low-sulfidation epithermal gold deposits in Java, Indonesia: Characteristics and linkage to the volcano-tectonic setting. Ore Geol. Rev. 2020, 121, 103490. [Google Scholar] [CrossRef]
  21. Carlile, J.C.; Mitchell, A.H.G. Magmatic arcs and associated gold and copper mineralization in Indonesia. J. Geochem. Explor. 1994, 50, 91–142. [Google Scholar] [CrossRef]
  22. Setijadji, L.D.; Kajino, S.; Imai, A.; Watanabe, K. Cenozoic island arc magmatism in Java Island (Sunda Arc, Indonesia): Clues on relationships between geodynamics of volcanic centers and ore mineralization. Resour. Geol. 2006, 56, 267–292. [Google Scholar] [CrossRef]
  23. Clements, B.; Hall, R. Cretaceous to Late Miocene Stratigraphic and Tectonic Evolution of West Java. In Proceedings of the 31st Annual Convention Proceedings of Indonesian Petroleum Association; Jakarta, Indonesia, 14–16 May 2007. [CrossRef]
  24. Wang, D.; Lin, F.; Shi, M.; Wang, H.; Yang, X. Geological setting, tectonic evolution and spatio-temporal distributions of main mineral resources in South East Asia: A comprehensive review. Solid Earth Sci. 2023, 8, 34–48. [Google Scholar] [CrossRef]
  25. Zhang, Z.; Shu, Q.; Yang, X.; Wu, C.; Zheng, C.; Xu, J. Review on the Tectonic Terranes Associated with Metallogenic Zones in Southeast Asia. J. Earth Sci. 2019, 30, 1–19. [Google Scholar] [CrossRef]
  26. Angeles, C.A.; Prihatmoko, S.; Walker, J.S. Geology and Alteration-Mineralization Characteristics of the Cibaliung Epithermal Gold Deposit, Banten, Indonesia. Resour. Geol. 2002, 52, 329–339. [Google Scholar] [CrossRef]
  27. Harijoko, A.; Sanematsu, K.; Duncan, R.A.; Prihatmoko, S.; Watanabe, K. Timing of the mineralization and volcanism at Cibaliung gold deposit, western Java, Indonesia. Resour. Geol. 2004, 54, 187–195. [Google Scholar] [CrossRef]
  28. Lubis, H.; Prihatmoko, S.; Herunanto, Y. Geology and exploration for low-sulfidation epithermal gold-silver mineralization in Kerta, Banten, Indonesia. In Proceedings of the MGEI Annual Convention on Banda and Eastern Sunda Arcs (BESA), Malang, Indonesia, 26–27 November 2012; pp. 39–71. [Google Scholar]
  29. Marcoux, E.; Milési, J.P. Epithermal gold deposits in West Java, Indonesia: Geology, age and crustal source. J. Geochem. Explor. 1994, 50, 393–408. [Google Scholar] [CrossRef]
  30. Basuki, A.; Aditya Sumanagara, D.; Sinambela, D. The Gunung Pongkor gold-silver deposit, West Java, Indonesia. J. Geochem. Explor. 1994, 50, 371–391. [Google Scholar] [CrossRef]
  31. Rosana, M.F.; Matsueda, H. Cikidang Hydrothermal Gold Deposit in Western Java, Indonesia. Resour. Geol. 2002, 52, 341–352. [Google Scholar] [CrossRef]
  32. Warmada, I.W.; Lehmann, B.; Simandjuntak, M. Polymetallic sulfides and sulfosalts of the Pongkor epithermal gold-silver deposit, West Java, Indonesia. Can. Mineral. 2003, 41, 185–200. [Google Scholar] [CrossRef]
  33. Syafrizal; Imai, A.; Motomura, Y.; Watanabe, K. Characteristics of gold mineralization at the Ciurug vein, Pongkor gold-silver deposit, West Java, Indonesia. Resour. Geol. 2005, 55, 225–238. [Google Scholar] [CrossRef]
  34. Bakhsh, R.A.; Ahmed, A.H. The Umm Matierah gold prospect: Mineralogical and geochemical characteristics of a potential low-sulfidation epithermal gold deposits, southeastern Arabian Shield, Saudi Arabia. J. Asian Earth Sci. X 2023, 9, 100153. [Google Scholar] [CrossRef]
  35. Arhin, E.; Boadi, S.; Esoah, M.C. Identifying pathfinder elements from termite mound samples for gold exploration in regolith complex terrain of the Lawra belt, NW Ghana. J. Afr. Earth Sci. 2015, 109, 143–153. [Google Scholar] [CrossRef]
  36. Balaram, V.; Sawant, S.S. Indicator Minerals, Pathfinder Elements, and Portable Analytical Instruments in Mineral Exploration Studies. Minerals 2022, 12, 394. [Google Scholar] [CrossRef]
  37. Akinlalu, A.A. Radiometric Mapping for The Identification of Hydrothermally Altered Zones Related to Gold Mineralization in Ife–Ilesa Schist Belt, Southwestern Nigeria. Indones. J. Earth Sci. 2023, 3, A519. [Google Scholar] [CrossRef]
  38. Ohioma, O.J.; Ezomo, F.; Akinsunmade, A. Delineation of Hydrothermally Altered Zones that Favour Gold Mineralization in Isanlu Area, Nigeria Using Aeroradiometric Data. Int. Ann. Sci. 2017, 2, 20–27. [Google Scholar] [CrossRef]
  39. Omel’yanenko, B.I.; Petrov, V.A.; Poluektov, V.V. Behavior of uranium under conditions of interaction of rocks and ores with subsurface water. Geol. Ore Depos. 2007, 49, 378–391. [Google Scholar] [CrossRef]
  40. Abd El-Naby, H.H.; Saleh, G.M. Radioelement distributions in the Proterozoic granites and associated pegmatites of Gabal El Fereyid area, Southeastern Desert, Egypt. Appl. Radiat. Isot. 2003, 59, 289–299. [Google Scholar] [CrossRef]
  41. Omoniyi, I.M.; Oludare, S.M.B.; Oluwaseyi, O.M. Determination of radionuclides and elemental composition of clay soils by gamma- and X-ray spectrometry. Springerplus 2013, 2, 1–11. [Google Scholar] [CrossRef]
  42. Varner, T.S.; Kulkarni, H.V.; Bhuiyan, M.U.; Cardenas, M.B.; Knappett, P.S.K.; Datta, S. Mineralogical Associations of Sedimentary Arsenic within a Contaminated Aquifer Determined through Thermal Treatment and Spectroscopy. Minerals 2023, 13, 889. [Google Scholar] [CrossRef]
  43. Rehman, A.; Rukh, S.; Ayoubi, S.A.; Khattak, S.A.; Mehmood, A.; Ali, L.; Khan, A.; Malik, K.M.; Qayyum, A.; Salam, H. Natural Clay Minerals as Potential Arsenic Sorbents from Contaminated Groundwater: Equilibrium and Kinetic Studies. Int. J. Environ. Res. Public Health 2022, 19, 16292. [Google Scholar] [CrossRef]
Figure 1. The location of the Pongkor low-sulfidation epithermal gold deposit (black star).
Resources 13 00002 g001
Figure 2. Detailed geological maps and primary vein systems of the Pongkor deposit.
Resources 13 00002 g002
Figure 3. The scatter plots of K vs. eTh distinguish the altered zone from the unaltered zone. The dashed line is the boundary of K between the altered and unaltered zones.
Resources 13 00002 g003
Figure 4. Radiometric measurements cross-section of CGH 490 Front.
Resources 13 00002 g004
Figure 5. Radiometric measurements of the cross-section of CGH 492 Front.
Resources 13 00002 g005
Figure 6. Radiometric measurements of the cross-section of CRG 456 Front.
Resources 13 00002 g006
Figure 7. Radiometric measurements of the cross-section of the GDH 450 Front.
Resources 13 00002 g007
Figure 8. Radiometric measurements of the cross-section of the GDH 460 Front.
Resources 13 00002 g008
Figure 9. Radiometric measurements show the cross-section of the UBPE outcrop.
Resources 13 00002 g009
Figure 10. The box and whisker plot shows the statistical distribution of pathfinder elements in all types of veins and host rocks.
Resources 13 00002 g010
Figure 11. Box and whisker plot of the radioelement measurements in the unaltered and altered zones (the × marks represent the mean of the distribution).
Resources 13 00002 g011
Figure 12. Box and whisker plot of the radioelement measurements in the veins and host rock of all the mining fronts and outcrops (the × marks represent the mean of the distribution; BOQ vein = Banded Opaline Quartz; CQ = Carbonate-Quartz vein; MOQ = Manganese Oxide Quartz vein).
Resources 13 00002 g012
Table 1. Pearson’s correlation between epithermal gold mineralization pathfinder elements and the radiometric signature of host rock and vein types.
UnitRadioelementMnFeZnAsPb
Host RockK (%)0.000.29−0.020.14−0.07
eU (ppm)−0.20−0.04−0.18−0.03−0.44
eTh (ppm)0.00−0.370.00−0.430.35
BOQ VeinK (%)−0.48−0.460.06 0.59
eU (ppm)−0.08−0.180.12 0.71
eTh (ppm)−0.46−0.53−0.10 0.29
CQ VeinK (%)0.260.04−0.13−0.17−0.09
eU (ppm)0.16−0.27−0.43−0.10−0.60
eTh (ppm)−0.03−0.30−0.48−0.28−0.14
MOQ VeinK (%)−0.57−0.24−0.420.97−0.41
eU (ppm)−0.52−0.44−0.410.17−0.57
eTh (ppm)−0.280.05−0.400.85−0.48
Note: yellow (0.4–0.59) for moderate correlation, orange (0.6–1.0) for strong correlation.
Disclaimer/Publisher’s Note: The statements, opinions and data contained in all publications are solely those of the individual author(s) and contributor(s) and not of MDPI and/or the editor(s). MDPI and/or the editor(s) disclaim responsibility for any injury to people or property resulting from any ideas, methods, instructions or products referred to in the content.

