Article

Evaluation of Sourcing Decision for Hydrogen Supply Chain Using an Integrated Multi-Criteria Decision Analysis (MCDA) Tool

1
Department of Industrial Engineering, Ubonratchathani University, Ubonratchathani 34190, Thailand
2
Faculty of Engineering, Thonburi University, Bangkok 10160, Thailand
3
Institute of Logistics and Material Handling Systems (ILM), Otto von Guericke University Magdeburg, 39106 Magdeburg, Germany
*
Author to whom correspondence should be addressed.
Resources 2023, 12(4), 48; https://doi.org/10.3390/resources12040048
Submission received: 5 March 2023 / Revised: 1 April 2023 / Accepted: 4 April 2023 / Published: 10 April 2023
(This article belongs to the Special Issue Decision Making in Resources Management: Problems, Methods and Tools)

Abstract

:
The use of fossil fuels has caused many environmental issues, including greenhouse gas emissions and associated climate change. Several studies have focused on mitigating this problem. One dynamic direction for emerging sources of future renewable energy is the use of hydrogen energy. In this research, we evaluate the sourcing decision for a hydrogen supply chain in the context of a case study in Thailand using group decision making analysis for policy implications. We use an integrative multi-criteria decision analysis (MCDA) tool which includes an analytic hierarchy process (AHP), fuzzy AHP (FAHP), and data envelopment analysis (DEA) to analyze weighted criteria and sourcing alternatives using data collected from a group of selected experts. A list of criteria related to sustainability paradigms and sourcing decisions for possible use of hydrogen energy, including natural gas, coal, biomass, and water, are evaluated. Our results reveal that political acceptance is considered the most important criterion with a global weight of 0.514 in the context of Thailand. Additionally, natural gas is found to be the foreseeable source for hydrogen production in Thailand with a global weight of 0.313. We also note that the analysis is based on specific data inputs and that an alternative with a lower score does not imply that the source is not worth exploring.

1. Introduction

Renewable energy has gained worldwide interest due to increasing energy demand as well as a rising concerns over the environmental impact of traditional fuel consumption around the globe. Use of renewable energy in a production system reduces negative environmental impacts, and, therefore, controls climate change [1,2]. It is considered a type of energy that can be collected from natural resources and processes derived from a number of sources and forms, such as direct derivation from the sun and heat generation within the earth. Within the renewable energy definition are also electricity and heat generated from solar, wind, ocean, hydropower, biomass, geothermal resources, biofuels, and hydrogen derived from renewable resources. The trend towards renewable energy systems has been rapidly shown to be more efficient and economical, with the share of total energy consumption continuously increasing [3,4].
The environmental concerns related to energy production and consumption are globally increasing; these include Greenhouse Gas (GHG) emissions, air pollution, global warming, climate change, water pollution, and solid waste disposal [5]. The European Union (EU) has declared a number of goals one of which is reducing greenhouse gas emissions by about 80–95% by 2050. The Paris Agreement has further stipulated that all parties in the globe should strive to formulate long-term low GHG emission development strategies [6]. Thus far, many countries have taken a variety of actions through strategic policies aiming at meeting energy needs and environmental requirements more securely and sustainably, including the United States, the EU, Germany, China, and Thailand [7,8]. One of the most vigorous vectors for emerging sources of future renewable energy is the use of hydrogen energy.
According to the Global Hydrogen Generation Market Size Report [9], the global hydrogen generation market was valued at $129.85 billion in 2021 and is expected to expand at a compound annual growth rate of 6.4% from 2022 to 2030. The utilization of hydrogen will not only improve the sustainability of the renewable energy system but also overall system flexibility. Thus, hydrogen technology advancement from various energy sectors and effective logistics systems in the hydrogen supply chain network (HSCN) could help to increase operational flexibility and perform a pivotal function by linking diverse industrial sectors for future low-carbon energy systems [10]. The significant progress of hydrogen technologies and products has been realized in recent years especially for the usage of fuel cell electric vehicles (FCEV). Nonetheless, the insufficiency of existing infrastructure is one of the hurdles to boosting the hydrogen economy. Thus, an investigation of large-scale infrastructure based on a proper assessment of country-wide strategies is needed. Additionally, an assessment of sustainable hydrogen production technology along the HSCN is needed [11,12].
In Thailand, the growth of a number of environmentally friendly sectors such as biotechnology, biochemical, biopharmaceutical, and bioenergy has been fostered to support global and national bioeconomy plans [13]. In particular, the Thai government’s initiatives and policies are to transition from the utilization of coal/natural gas sources of energy to biomass sources of renewable energy as part of the national renewable energy plan. That is, biomass from the first (e.g., corn, sugarcane, and starch) and the second (e.g., cellulosic materials, wood residue, waste biomass) generations of bioenergy are an on-going focus of the Thai government. A number of tax incentives for on-going projects of the Thai government to promote renewable energy have been reported, including support for farmers to grow fast-growing trees, the promotion of electricity manufacturing from garbage-derived energy, the promotion of projects associated with solar and wind energy, and the funding of research and development activities for research hubs focusing on bioenergy. Compared to the rising usage of biomass-based fuel energy in Thailand, hydrogen energy-based research in Thailand is still relatively new.
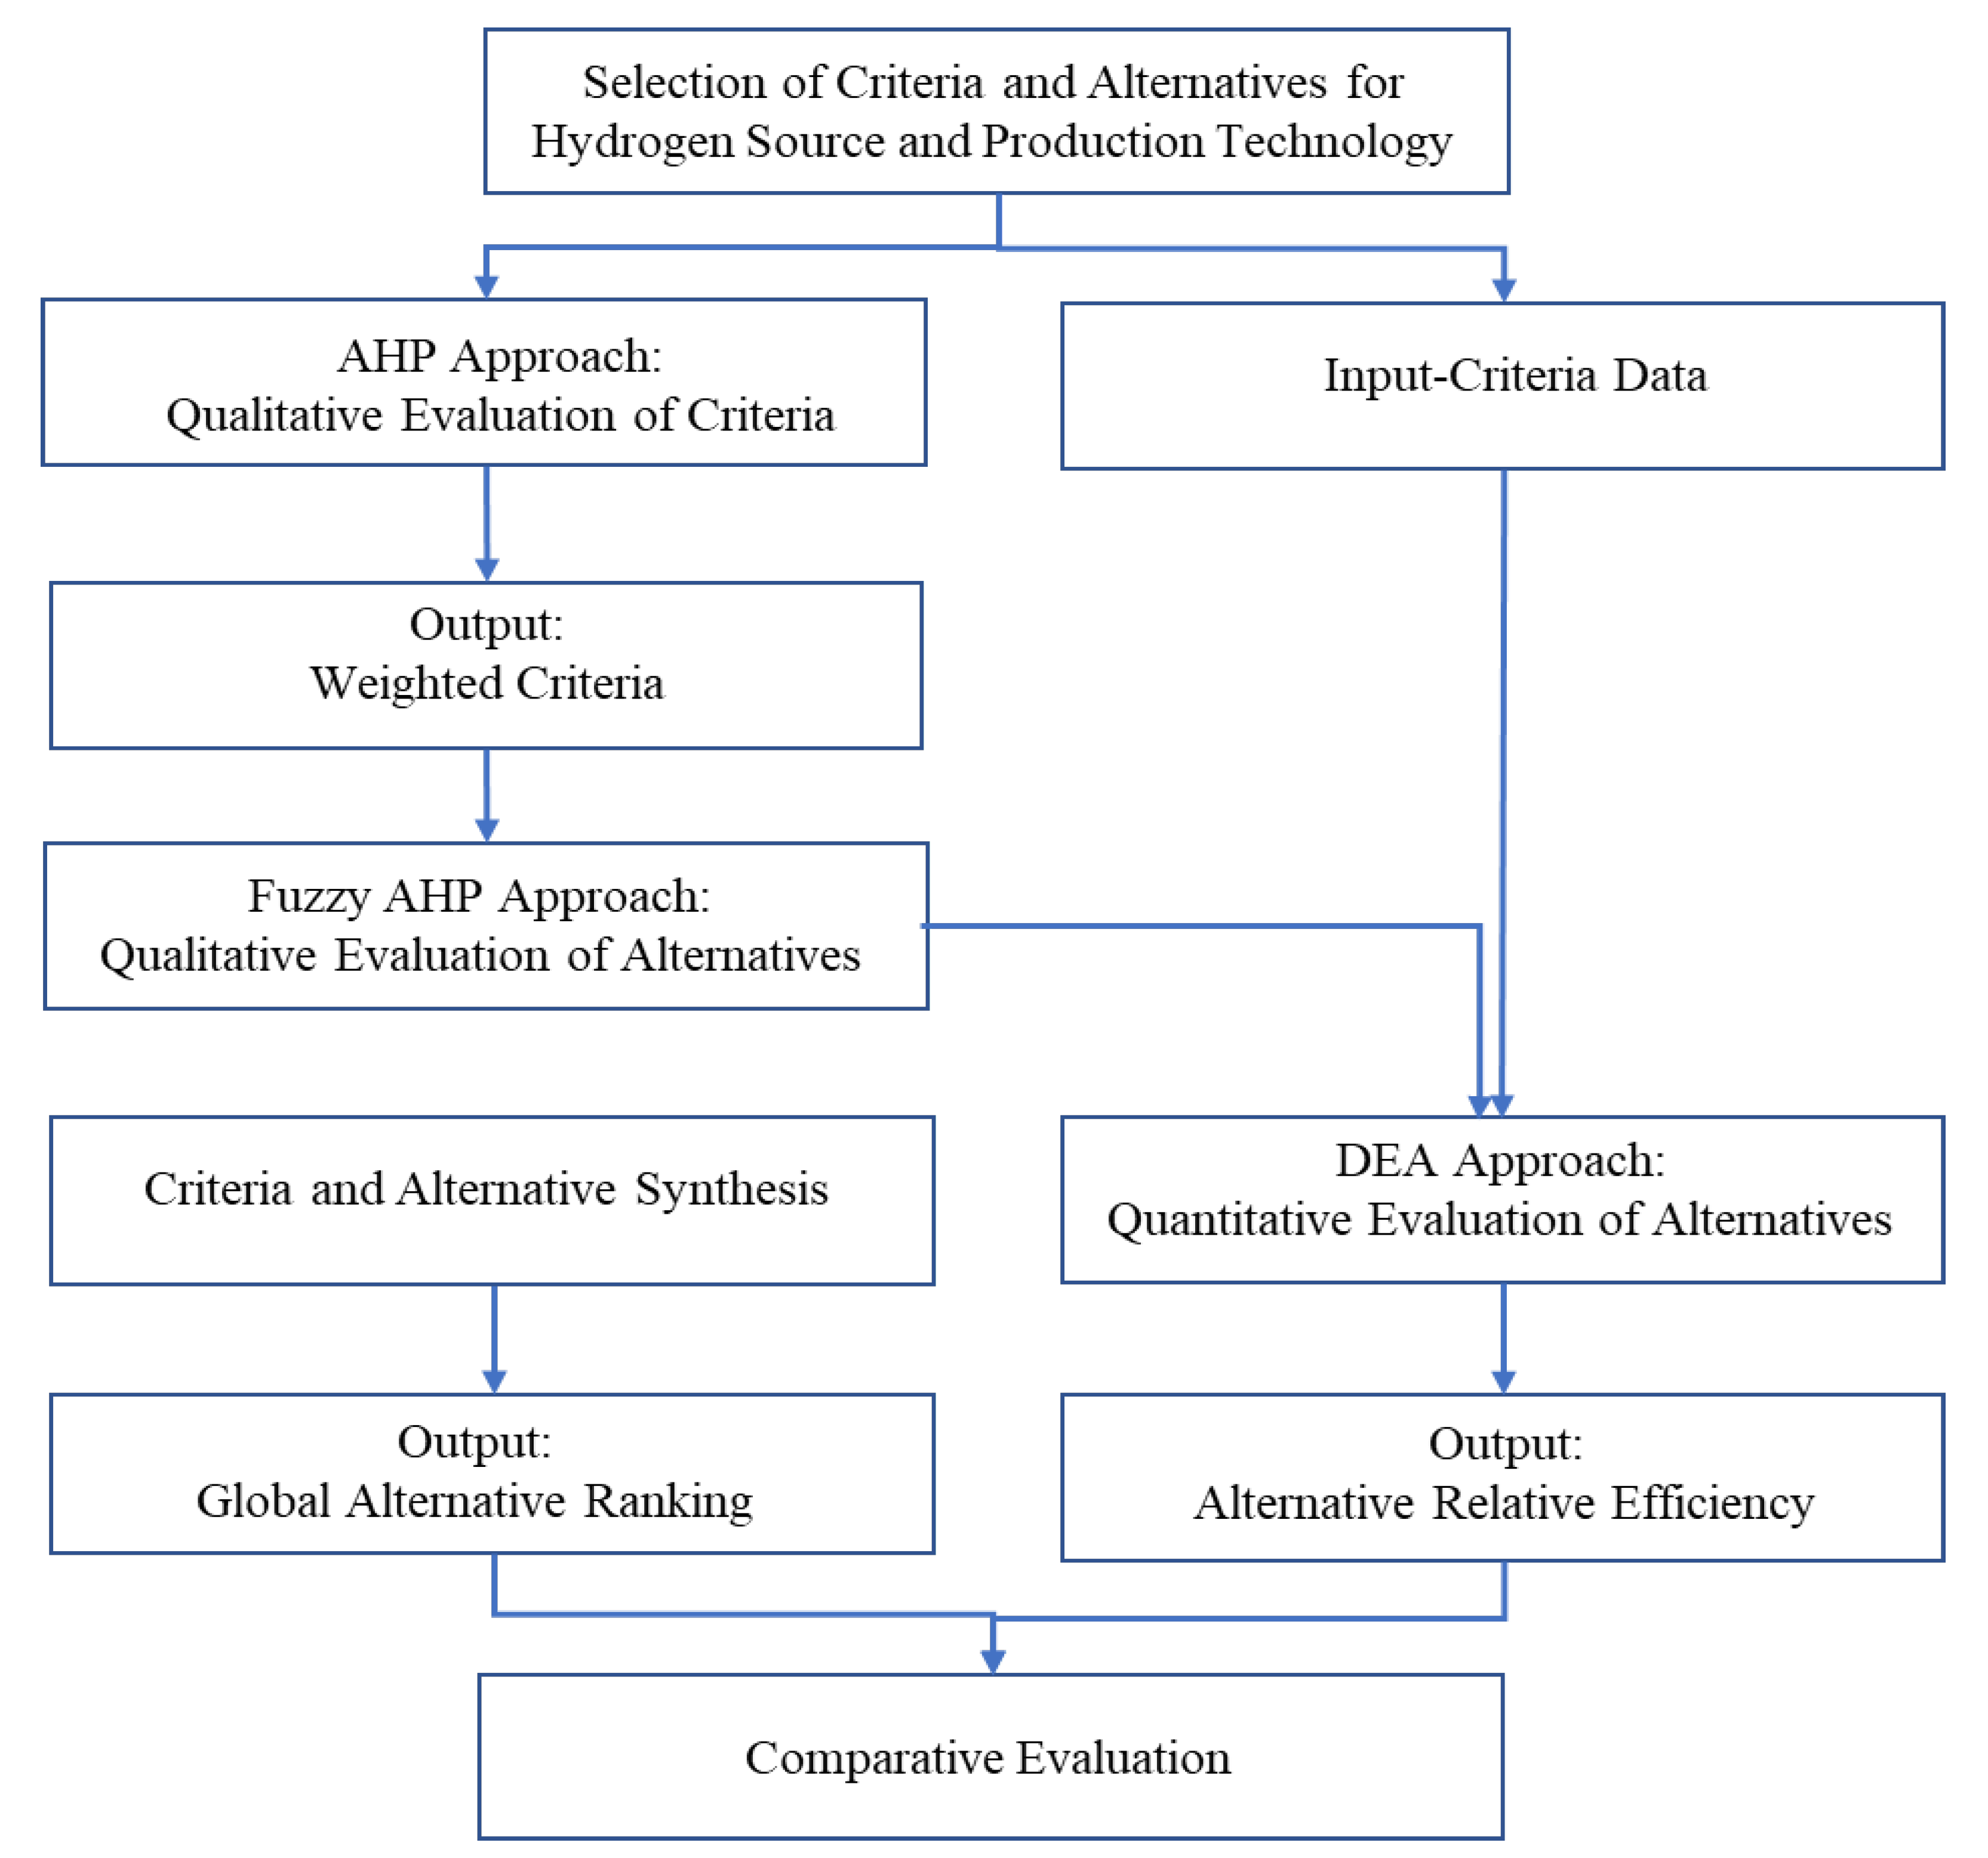
In this research, our main contributions are threefold. First, we evaluate the sourcing decision for hydrogen supply chains in the context of a case study in Thailand using an analysis of group decision making for policy implications. Second, our methodology is integrative of the multi-criteria decision analysis (MCDA) tool. Third, a sensitivity analysis is performed to evaluate changes in criteria preferences for policy implications. Specifically, an analytic hierarchy process (AHP), a fuzzy analytic hierarchy process (FAHP), and data envelopment analysis (DEA) tools are successively used to analyze weighted criteria and sourcing alternatives. Five selective criteria are evaluated: political acceptance, economic desirability, social acceptance, resource potential, and environmental perception. In addition, four production alternatives for hydrogen are assessed, including natural gas, coal, biomass, and water. The AHP technique in particular has been applied in this study due to its simplicity and capability to aid decision makers in evaluating criteria. Then, the FAHP is further used to incorporate uncertainty in decision makers’ judgements in the evaluation of alternatives. Additionally, the DEA approach is sequentially used to analyze the relative efficiency of the decision-making units (DMUs) representing hydrogen energy’s source alternatives, given the weighted results obtained from the FAHP technique. Then, the comparative study and managerial insights are further developed and provided.
The remainder of this paper is structured as follows: In Section 2, we provide an overview of relevant literature. The proposed integrative MCDA tool is developed in Section 3. Then, the case study in Thailand and results are assessed and deliberated in Section 4. We further discuss managerial insights in Section 5. Finally, the research conclusions and suggested future research directions are outlined in Section 6.

2. Literature Review

The hydrogen economy is an economy that relies on hydrogen as the commercial energy that delivers a substantial portion of national energy and services. The concept of hydrogen energy is expected to become a reality when hydrogen production from various renewable energy sources can be economically obtained and used in an environmentally friendly manner. There are a number of leading countries in the globe that initiate policies and plans to boost the hydrogen economy. Based on the low-carbon hydrogen index ranking analyzed by Cornwall Insight [14], the top fifteen countries that are leaders in the hydrogen economy with a strong potential for production or consumption of hydrogen energy are Germany, followed by South Korea, Spain, Japan, United Kingdom, France, Canada, Chile, Netherlands, Australia, Portugal, Norway, United States, Italy, and Ireland.
For example, Germany has implemented an advanced hydrogen strategy. A countrywide hydrogen network to boost hydrogen infrastructure has been established by the German Ministry of Transport. In addition, regulations concerning the hydrogen network are provided to gradually build up a hydrogen infrastructure in the country. The Hydrogen Starter Network 2030 has been proposed as a part of the Gas Network Development Plan 2020–2030 to support the core of the national hydrogen pipelines. According to a report from the Green Car Congress [15], Germany’s Federal Ministry of Economics and the Federal Ministry of Transport have supported 62 large-scale hydrogen projects as a part of the national hydrogen strategy and of the joint European hydrogen project. In addition, the United States of America is one of the nations to conduct early research and adopt clean energy solutions for various sectors, such as power generation, manufacturing, and transportation. The USA’s federal government provides study plans in accordance with the national hydrogen energy vision and a roadmap to support the development of hydrogen infrastructure in the country through a number of projects [9].
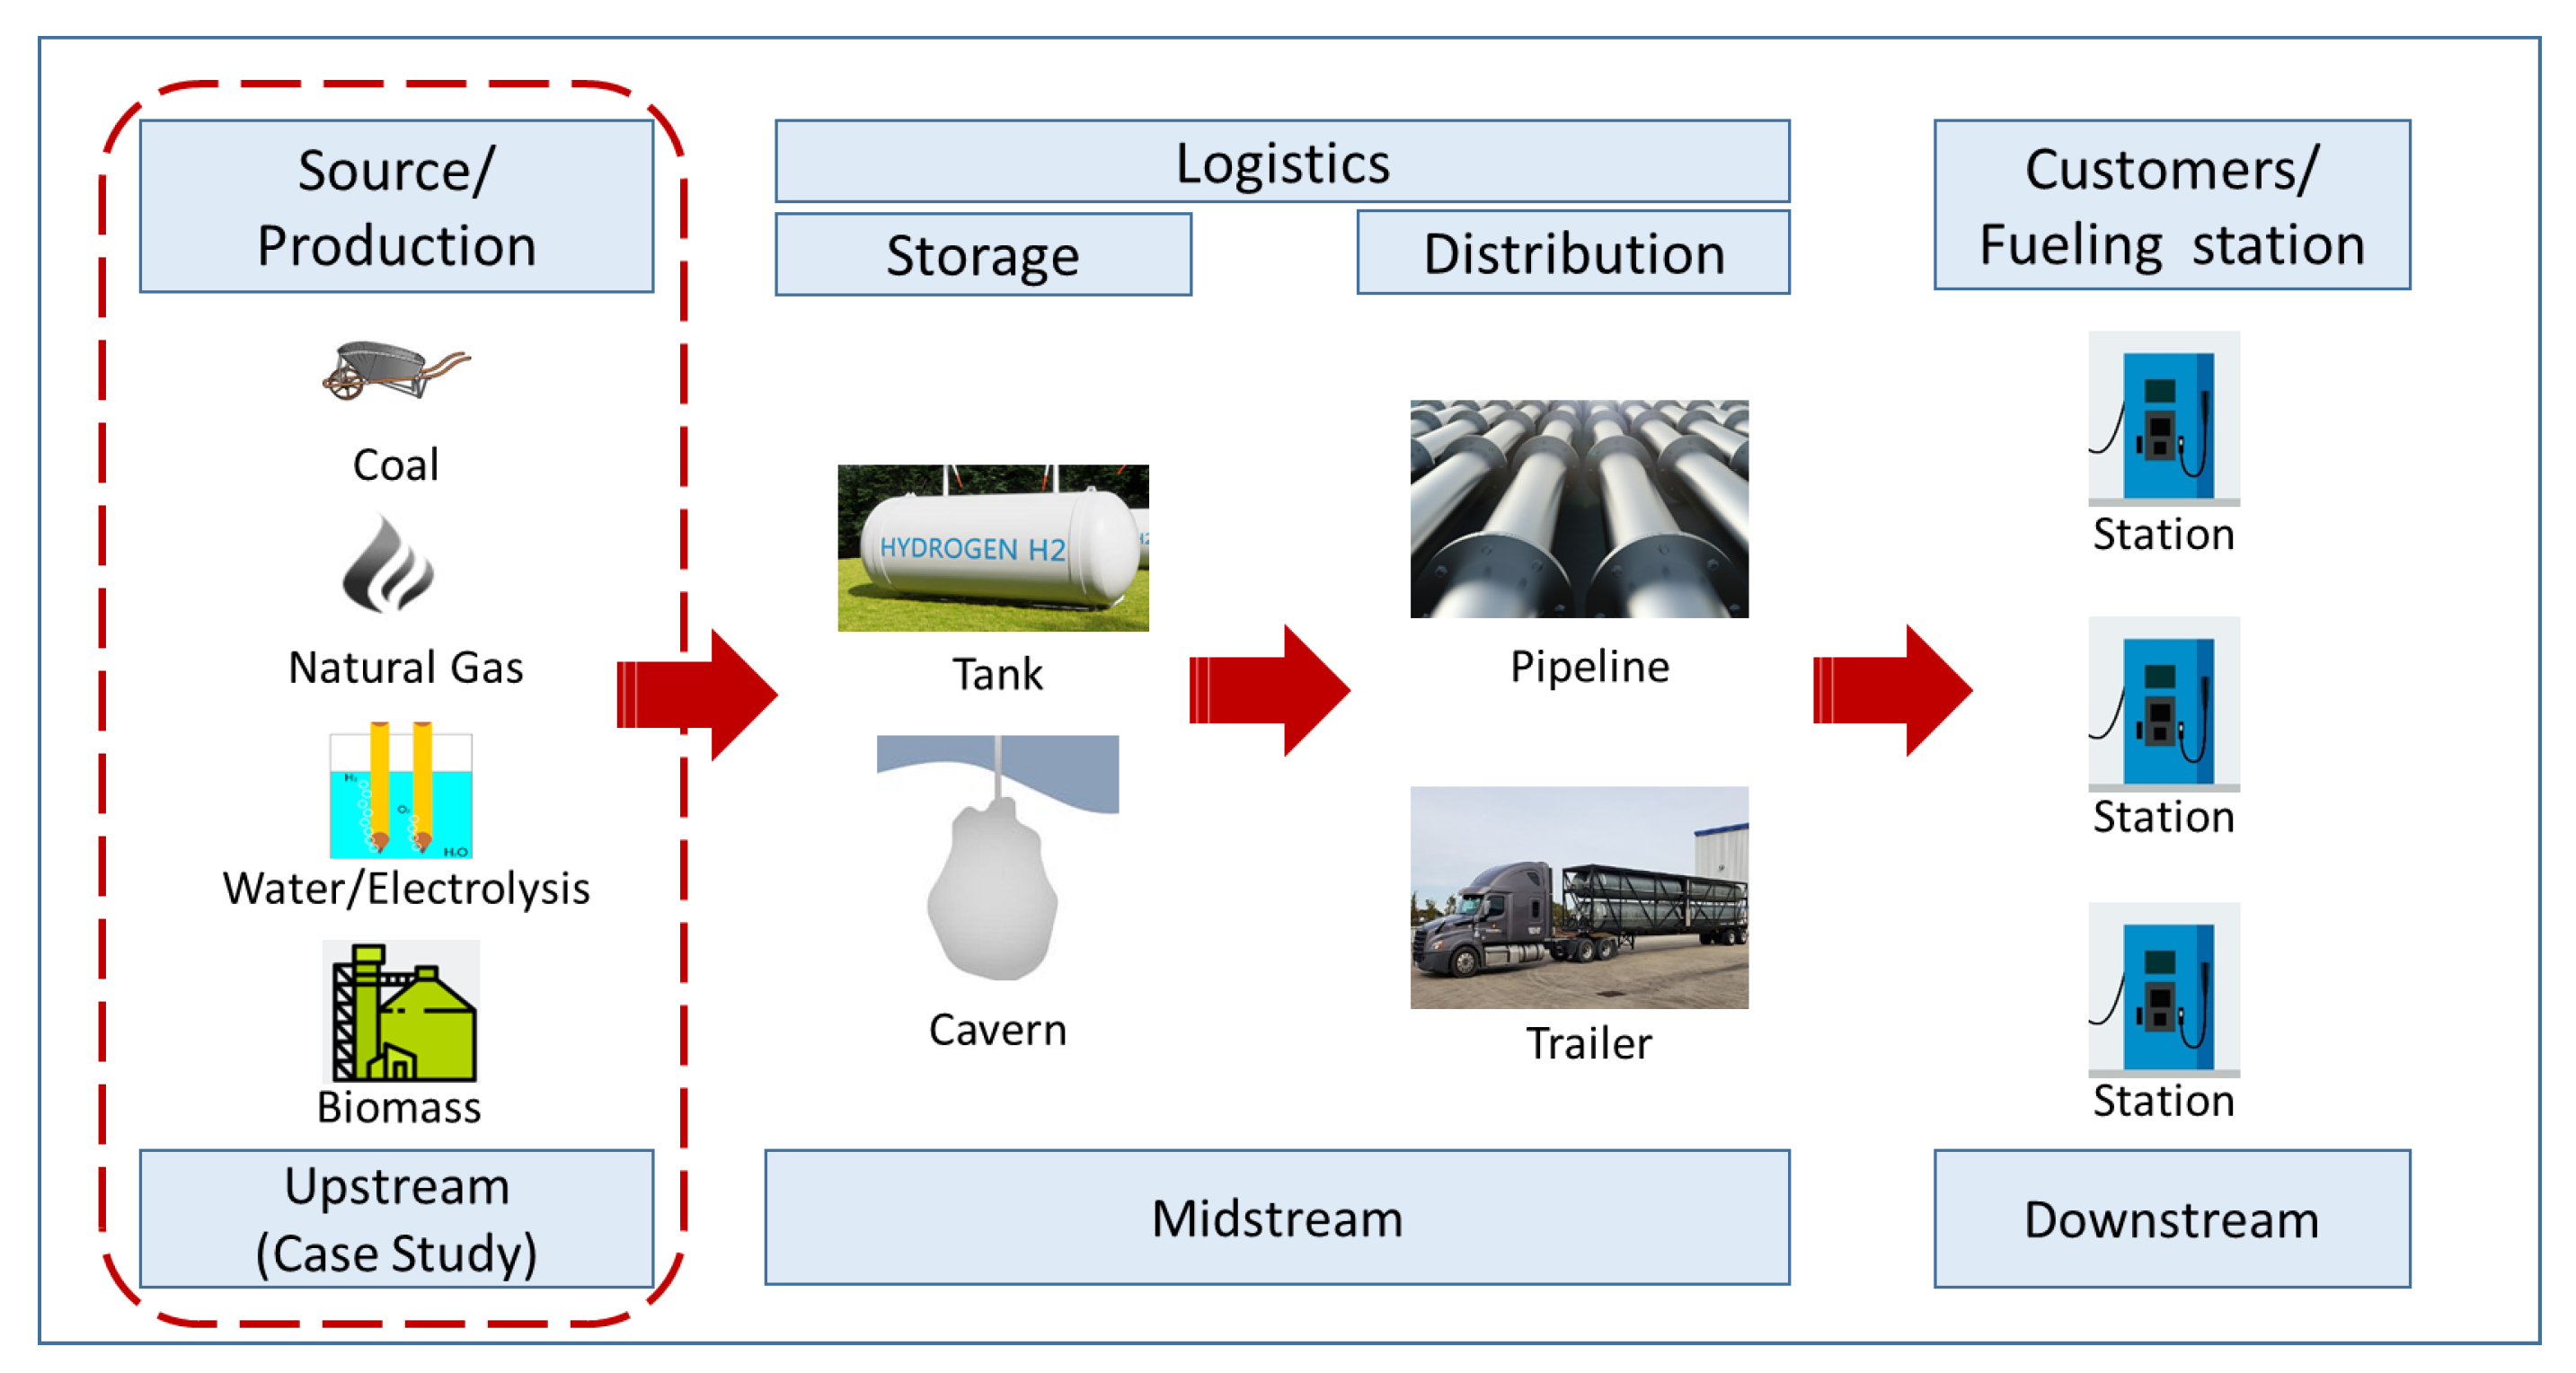
Infrastructure expansion is a key aspect for the development of HSCN. The HSCN typically begins at the energy source and ends at the fueling station, with various alternatives existing at each link of the infrastructure network. The produced hydrogen can also be distributed using a number of distribution channels and transportation modes depending on the physical forms of hydrogen as well as the energy demand profile. For example, while liquefied hydrogen can be transported in tankers via roads and railways, gaseous hydrogen may be distributed via pipelines in the network [16]. In addition, storage decisions are a vital function of the HSCN; they are also complex due to the dissimilar physical forms of hydrogen. Finally, the locational choice of the fueling station also depends on whether hydrogen will be delivered to the station or produced and stored on-site. It is thus imperative to analyze the context of HSCN not only from well-to-tank (i.e., from fuel production of the energy source to fuel supply) or tank-to-wheels (i.e., from fuel supply to the use of fuel in the vehicle) perspectives, but also from the perspective of well-to-wheels exploration.
The growth of a foreseeable hydrogen market inevitably requires complex analyses for the entire HSCN system in order to achieve optimal nationwide designs and plans. Challenges for complex HSCN thus depend on the interactions between different parts of the chain, which should be properly evaluated. That is, the interactions and flows among key stakeholders and activities of HSCN can be seen as one type of renewable-energy supply chain, but it is more challenging due to the complexity of the network itself and the various hydrogen production technologies that may complicate the evaluation of the network with respect to the commodity type and the distribution mode. A number of existing studies clearly point out that various aspects of the HSCN need to be further evaluated using advanced analytical models and proper decision levels for the analysis [17,18].
For example, existing analytical models developed in the area of HSCN rely typically on cost minimization. Thus, other criteria related to environmental (e.g., GHG emissions, waste reduction) and social requirements (e.g., poverty reduction potential, quality of life) are also needed for a sustainability analysis [19]. Moreover, decisions for logistics and supply chain management are typically divided into three levels depending on the types and periods of making decisions; these are strategic, tactical, and operational decision making. Strategic decisions for the HSCN in particular pertain to design and policy-related decisions on sourcing, technology types, type of storage, capacity level, locations, allocation and distribution between facilities, and transportation modes. Additionally, given that HSCN starts from various upstream energy sources that can be transformed in respective midstream and downstream processes, uncertainties become inevitably involved in a number of steps of the chain. Thus, the integration of uncertain aspects of real-life applications is also suggested by existing studies as an essential part of managerial decision making in order to increase competitiveness, efficiency, and responsiveness of the HSCN [20].
With respect to the sources of hydrogen supply in the upstream processes of the HSCN, various types of hydrogen technology exist. Different color codes are often used to indicate the origin of the hydrogen sources and technologies [21]. For example, grey hydrogen is created from natural gas using steam methane reformation (SMR) but without capturing the GHG made in the process. While grey hydrogen may emit GHGs that adversely affect environmental concerns, the blue-color coded hydrogen refers to hydrogen technologies that are capable of capturing carbon dioxide emissions during production and storage activities. The SMR, in particular, is a method of producing hydrogen from natural gas; currently, this is considered the cheapest source of industrial hydrogen. Meanwhile, green hydrogen involves the production of hydrogen using renewable energy, which has a clear advantage in achieving the extensive deployment of a low-carbon footprint in the energy system. In contrast to green hydrogen, the black coal in the hydrogen-making process is considered the most environmentally damaging.
Green hydrogen production, in particular, is specifically related to the electrolysis technique in which water and electricity from renewable energy sources, such as wind and solar, are mainly used. Although green hydrogen is considered a promising technology to achieve extensive deployment with low-carbon footprint in the energy system, the economic aspect of green hydrogen is still currently an expensive option. Grey and blue hydrogens cost around USD 1.00–1.80 per kilogram and USD 1.40–2.40 per kilogram, respectively. Meanwhile, green hydrogen costs approximately between USD 2.50 and USD 6.80 per kilogram. Thus, tradeoffs clearly exist among environmental and economic criteria in this regard [22]. Selecting hydrogen sources and technology types can be conceived as a type of MCDA problem concerned with multiple criteria and a number of finite alternatives.
Thus, the purpose of MCDA is to support decision makers where a unique optimal solution does not exist, and it is necessary to use decision makers’ preferences to differentiate between solutions. The MCDA technique has evolved and has had many applications in the literature (e.g., [23,24,25]). Recent studies show that the trend in MCDA research is to integrate two or more tools to tackle the limitations of a particular, single method [26,27]. A number of literature review-type studies also provide directions for future tools using the MCDA technique (e.g., [28,29,30,31]). These studies similarly suggest that future applications include addressing more complex issues based on the integrated application of various techniques. Although applications in MCDA have been increasingly found in the literature, the selection problem for hydrogen sources and technology type is still relatively limited. Additionally, an application specifically for a case study in Thailand has not been found to date.
On the basis of the hydrogen source, the options have been categorized according to existing technology types. These technologies also depend on various criteria under consideration. For example, the SMR technology using natural gas as a source for hydrogen production is considered a mature and economical technology in current hydrogen generation. The process of coal gasification uses steam and oxygen to break the molecular bonds in coal to form a gaseous mixture of hydrogen and carbon dioxide. One of the drawbacks of producing hydrogen from coal and natural gas is the production of carbon dioxide during the reforming process, meaning that carbon capture will be an important operation for the environmentally benign utilization of these resources in the future. Meanwhile, biomass gasification uses a controlled process to convert biomass to hydrogen without combustion. The use of the biomass is another interesting pathway since biomass is not only an abundant resource but can also help to remove carbon dioxide from the atmosphere. Finally, there has been an increase in new electrolysis installations with the aim to produce hydrogen from water with the clear benefit of a zero-carbon emission technique. Regardless, most of the electrolysis projects are still relatively expensive and are limited to only some countries [31,32,33,34,35,36,37].
Studies relevant to the application of MCDA for hydrogen energy are scarce and can be found only in a few country-specific studies. Additionally, existing studies utilizing the MCDA technique for hydrogen-related selection problems are found mainly in the category of hydrogen site selection, storage type selection, and production method evaluation. We highlight more existing literature concerning the application of MCDA for hydrogen energy in Table A1 in Appendix A. Next, we further discuss and highlight our proposed study as follows:
  • Studies related to MCDA tools are found in a wide range of applications in the literature. However, research that focuses on an area of renewable energy is scarce. Additionally, hydrogen energy-based specific studies are relatively new and limited to only a few country-wide case studies;
  • Current studies related to the selection problem of hydrogen production source and technology types analyze only weighted criteria and/or the ranking of alternatives. However, there is a need to also evaluate the relative efficiency of each alternative for hydrogen source and technology type. Thus, the efficiency optimization is conducted through the DEA analysis in our study;
  • Existing studies typically use a single tool under the MCDA approach to tackle the specific problem. However, there is a need to integrate MCDA tools in order deal with limitations of a particular, single method. Thus, our research utilizes AHP, fuzzy AHP, and DEA in an integrated way;
  • Additionally, information obtained from decision makers may be incomplete, deficient, and vague. Thus, uncertainty in making decisions should be considered. In this study, we integrate fuzzy logic based on a probabilistic triangular distribution with the MCDA approach to incorporate the possibility of uncertain decisions for evaluating relevant alternatives;
  • While there are prevalent studies related to hydrogen production and supply chains in some specific western countries, studies in emerging countries, especially in Asia, are uncommon but necessary. Thus, we focus our research on the case study in Thailand to contribute to the literature in this regard.

3. Methodology

In this section, we illustrate the MCDA-based approach to evaluate conflicting criteria and choices of hydrogen–energy sources. The integrated AHP, FAHP, and DEA tools are sequentially used to analyze weighted criteria as well as sourcing alternatives with data collected from a group of selected experts. Initially, the well-known AHP approach is introduced and applied to evaluate related criteria. Then, the fuzzy logic based on a triangular distribution is further applied to the AHP approach to support uncertain decision making for alternative evaluations. Additionally, the weighted results for alternatives with respect to each criterion obtained from the FAHP technique and the input data relevant to quantitative input criteria are further used for relative efficiency analysis using the DEA technique. Additionally, we conduct a comparative study between the application of both F/AHP and DEA. The general structure of the proposed methodology is illustrated in Figure 1.

3.1. Analytic Hierarchy Process (AHP)

We initially discuss the AHP procedure used to evaluate selective criteria for analyzing the selection problem of a hydrogen source and technology in Thailand. The AHP technique was initially developed in the 1970s by Saaty [38] to aid complex decision making; it is fundamentally based on three important procedures of hierarchy structure, priority examination, and consistency confirmation. Since its development, the AHP technique has proven useful in a number of application areas (e.g., [39,40,41]). The logical hierarchy of the AHP technique is constructed such that a decision maker(s) can systematically assess the priority of alternatives by making pairwise comparisons among criteria and respective alternatives, leading to the synchronization of global criteria and the weights of alternatives. In contrast to other usual MCDA techniques, AHP also allows the investigation of judgement consistency, which is a key contribution of AHP that sets it apart from other tools.
The hierarchy structure of AHP can be constructed so that the goal or objective is at the top level, the criteria and/or sub-criteria at the intermediate level, and associated alternatives follow at the bottom level. We note that a number of researchers apply AHP at the criteria/sub-criteria level only with the aim to evaluate the importance of relevant factors/criteria without explicitly discussing alternatives. Choosing appropriate criteria and alternatives is an initial but important step since the designated criteria can influence not only the evaluation of criteria judgement but also the selection of ranked alternatives. Next, after the pairwise comparison matrices have been pairwise collected and assessed, the matrices will be normalized to obtain numerical weights for making decisions.
We briefly discuss the mathematical procedure of the AHP as follows: initially, the comparison between two elements using AHP can be made using the relative important scale between 1–9, which can be translated as an equal preference or 1, moderately preferred or 3, strongly preferred or 5, very strongly preferred or 7, and extreme preference or 9, respectively with 2, 4, 6, and 8 as intermediate values. These comparisons can be recorded in a positive reciprocal matrix ( A ) as shown in Equation (1). Next, the priority vector or normalized principal eigenvector ( p ) can be computed and the maximum eigenvalue ( λ max ) is obtained. The eigenvector shows the relative weights of criteria obtained by computing the arithmetic average of all criteria, where the sum of all values in the vector is one (Equation (2)). Finally, a global ranking of decision alternatives ( g i ) can be analyzed, which is based on an additive aggregation with the normalization of the sum of the local priorities of criteria ( w j ) and alternatives with respect to each criterion ( l i j ), as illustrated in Equation (3).
A = [ 1 a 12 a 1 n a 21 1 a 2 n a j i = 1 a i j 1 a n 1 1 ] ,
A p = λ max p ,
g i = j w j l i j .
As discussed earlier, the key contribution of the AHP technique is its capability to evaluate whether a decision maker is consistent in making decisions. A traditional approach to evaluate the consistency of the AHP is to compute the consistency ratio, where the 10% threshold is commonly accepted. Regardless, the drawback of the above method for evaluating consistency is a lack of feasibility for a varied number of elements of matrix size. In this study, we evaluate the consistency by following [42], which provides the evaluation based on the maximum eigenvalue ( λ max ) and is more flexible depending on both the confidence level for consistency ( α ) and the matrix size ( n ) under consideration. Equations (4) and (5) provide the consistency evaluation function and the computation of the suggested upper bound of the maximum eigenvalue ( λ max U p p e r   B o u n d ) for evaluating consistency judgement, respectively. The assessed maximum eigenvalue of a decision matrix will be considered acceptably consistent when the computed maximum eigenvalue ( λ max ) is less than the upper bound of maximum eigenvalue. Additionally, Table 1 provides computed upper bound values based on the above equations for the matrix size of four (i.e., four alternatives) and five (i.e., five criteria).
C o n s i s t e n c y   E v a l u a t i o n = F ( n ,   α ) ,
λ max U p p e r   B o u n d = n + α ( 1.7699 n 4.3513 ) .

3.2. Fuzzy Analytic Hierarchy Process (FAHP)

We next discuss the FAHP technique. It is an integrated method between the AHP and fuzzy logic. The FAHP technique is further used to evaluate desired alternatives for a hydrogen source and technology in Thailand. We intend to apply the fuzzy logic here, given that the ideas for evaluating hydrogen sources in Thailand are still relatively novel and thus involve a degree of uncertainty.
Given that uncertain conditions exist in the decision-making process, the fuzzy set representing the uncertain sets, in which the set elements have degrees of membership, can be further integrated with the AHP technique. Thus, the FAHP technique will consist of four key components of evaluation criteria ( C j ;   j = 1 , 2 , , n ), alternatives ( M i ;   i = 1 , 2 , , m ), weighting vectors ( w = ( w 1 ,   w 2 , ,   w n ) ), and linguistic judgments ( r i j ). Similar to the AHP technique, the initial stage of the FAHP technique is to determine relevant criteria and associated sub-criteria of the decision problem in the form of a hierarchical structure. After the FAHP hierarchy is constructed, all the criteria at the same level of the hierarchical structure will be compared against the criterion of the former level using linguistic terms for making fuzzy pairwise comparisons. These linguistic terms can be used to later develop fuzzy comparison matrices as illustrated in Table 2.
In order to account for fuzzy comparison of the linguistic judgment, a fuzzy set membership function can be created and computed using various types of probability distributions. In this study, the triangular distribution is used for the decision-making environment, since the three key parameters of the triangular distribution can denote the worst, moderate, and the best view. Accordingly, a triangular fuzzy number with the minimum value (L), the most likely value (M), and the maximum value (U) can be represented using the verbal judgement of associated linguistic terms. The fuzzy comparison matrix ( A ˜ ) representing fuzzy linguistic judgments is illustrated as shown in Equation (6), in which the positive judgment can be treated as an inverse order of the fuzzy number of the equivalent negative judgment and vice versa. Additionally, a fuzzy comparison matrix can be developed as illustrated in Equation (7) where x i j represents a triangular fuzzy number with the minimum (L), the most-likely (M), and the maximum value (U).
A ˜ = [ 1 r ˜ 12 r ˜ 1 n r ˜ 21 1 r ˜ 2 n r ˜ j i = r ˜ i j 1 1 r ˜ n 1 1 ] ,
A ˜ = [ 1 ( x 12 , L , x 12 , M , x 12 , U ) ( x 1 n , L , x 1 n , M , x 1 n , U ) ( x 21 , L , x 21 , M , x 21 , U ) 1 ( x 2 n , L , x 2 n , M , x 2 n , U ) r ˜ j i = r ˜ i j 1 1 ( x n 1 , L , x n 1 , M , x n 1 , U ) 1 ] .
Next, the geometric mean method is applied for the normalization process in which the fuzzy weight can be computed based on the r ˜ i as illustrated in Equations (8) and (9). We note that the fuzzy addition ( ) and fuzzy multiplication ( ) operations represent addition and multiplication of fuzzy numbers, which can be later used to obtain fuzzy weights as illustrated in Equations (10) and (11) for fuzzy addition and Equations (12) and (13) for fuzzy multiplication.
w ˜ i = r ˜ i ( r ˜ 1 r ˜ 2     r ˜ n ) 1 ,
r ˜ i = [ ( j = 1 n x i j , L ) 1 / n ( j = 1 n x i j , M ) 1 / n ( j = 1 n x i j , U ) 1 / n ] ,
r ˜ 1 r ˜ 2 = ( r 1 , L , r 1 , M , r 1 , U ) ( r 2 , L , r 2 , M , r 2 , U ) ,
( r 1 , L , r 1 , M , r 1 , U ) ( r 2 , L , r 2 , M , r 2 , U ) = ( r 1 , L + r 2 , L ) ,   ( r 1 , M + r 2 , M ) ,   ( r 1 , U + r 2 , U ) ,
r ˜ 1 r ˜ 2 = ( r 1 , L , r 1 , M , r 1 , U ) ( r 2 , L , r 2 , M , r 2 , U ) ,
( r 1 , L , r 1 , M , r 1 , U ) ( r 2 , L , r 2 , M , r 2 , U ) = ( r 1 , L × r 2 , L ) ,   ( r 1 , M × r 2 , M ) ,   ( r 1 , U × r 2 , U ) .
Finally, the process of defuzzification is required, which is the process of obtaining a quantifiable result in crisp numerical value, given the fuzzy sets and corresponding membership degrees. That is, we defuzzify the fuzzy weight to obtain crisp numerical values using the center of area (COA) method as presented in Equation (14). Finally, the crisp numerical value is normalized for weight interpretation.
w i = ( w i , L + w i , M + w i , U 3 ) ,
n i w = w i w i .

3.3. Data Envelopment Analysis (DEA)

We next concisely discuss the DEA technique to evaluate the relative efficiency of the sourcing decision for hydrogen energy. In particular, DEA is a type of multi-criteria productivity analysis model which compares each variable with the best performing one. Variables in DEA analysis are often referred to as decision-making units (DMUs), which are considered alternatives in the MCDA approach. The main aim of DEA is not only to analyze relative efficiency of DMUs, but also to explore benchmarking guidelines for inefficient DMUs of interest [43,44,45].
The advantages of DEA include the capability to handle multiple input and output criteria, where the sources of inefficiency can be investigated and quantified. Moreover, DEA also allows inter-criteria comparisons with the real dimension and quantity of units of criteria. The initial mathematical notation of the output-oriented DEA model was developed and named after its developers: the Charnes, Cooper, and Rhodes (CCR) model [46]. In particular, the relative efficiency of a particular DMU can be analyzed and obtained by solving the DEA optimization model, where the objective function is to maximize the ratio of the weighted sum of the outputs to the weighted sum of the inputs. Then, given the non-linear form of the DEA model, the non-linear term can be transformed and converted into the linear programming problem as shown in the DEA model (M2) in Equations (16)–(20). The notations for x i , k 0 , y j , k 0 , U i , and V j are declared as the amount of input data, the amount of output data, the weight assigned to input, and the weight assigned to output, respectively.
The analyzed DMU will be considered efficient if it obtains a score of one, whereas scores that are less than one imply relative inefficiency. Moreover, more than one alternative may be found to be efficient, which can serve as benchmarking guidelines for inefficient DMUs in need of further improvement.
M a x i m i z e     E f f i c i e n c y   j J y j , k 0 V j
S u b j e c t   t o :     i I x i , k 0 U i = 1
j J y j , k V j i I x i , k U i 0   ; k K
U i 0 ;   i I
V j 0 ;   j J

4. Case Study and Results

4.1. Case Study

We next discuss the problem statement for our case study. The flow of HSCN is initially illustrated as shown in Figure 2. The upstream process includes sourcing decisions for hydrogen energy production, such as coal, natural gas, electrolysis (water), and biomass. Next, the midstream process pertains to logistics processes that include both storage and distribution decisions, which are interrelated. Storage decisions can be in the form of tank and cavern, whereas distribution alternatives include pipelines and trailers which can also be combined. Finally, the downstream process includes last-mile customers, such as fueling stations for electric vehicles. We note that an aim of our current study is to analyze potential sources for future hydrogen production of the evaluated HSCN using a case study and expert opinion in the context of Thailand; this lies in the upstream process of the HSCN.
There are four key sourcing alternatives for hydrogen energy production. They are further discussed as follows.
Alternative 1 (A1)—The source of natural gas for gas reforming/gasification production: The first alternative is to use synthesis gas, which is a mixture of hydrogen, carbon monoxide, and a small amount of carbon dioxide created by reacting natural gas with high-temperature steam. Currently, the process of reforming low-cost natural gas is providing hydrogen for FCEVs worldwide.
Alternative 2 (A2)—The source of coal for coal gasification production: The process of coal gasification uses steam and oxygen to break molecular bonds in coal and form a gaseous mixture of hydrogen and carbon monoxide. It is possible that carbon dioxide and pollutants may be removed from gas obtained from coal gasification.
Alternative 3 (A3)—The source of biomass for biomass gasification production: This technology uses a controlled process involving heat, steam, and oxygen to convert biomass to hydrogen and other products, without combustion. Currently, key challenges to hydrogen production via biomass gasification are noted for costs associated with capital equipment and biomass feedstock.
Alternative 4 (A4)—The source of water for electrolysis production: Electrolysis is the process of using electricity to split water into hydrogen and oxygen. This method is considered a leading hydrogen production pathway to achieve the goal of zero GHG emissions. Regardless, some challenges are noted, such as the capital cost of the electrolyzer unit and improving energy efficiency for converting electricity to hydrogen over a wide range of operating conditions.
We next discuss decision criteria for hydrogen energy production. They are evaluated and collected based on the subjective literature review (e.g., [47,48]) as follows.
Criteria 1 (C1)—Political acceptance criterion: The first criterion is how a decision maker perceives the possibility for approval of governmental policy and is defined as conforming to energy policy and regulation from the government of Thailand.
Criteria 2 (C2)—Economic desirability criterion: The second criterion is how a decision maker recognizes the value of economic aspects of the sustainability paradigm and is concerned with economic benefit and investment worthiness by considering relevant economic growth in Thailand.
Criteria 3 (C3)—Social acceptance criterion: The third criterion is how a decision maker evaluates the value of social aspects of the sustainability paradigm and is a factor related to the acceptance or resistance perspective of society both at the local and national level.
Criteria 4 (C4)—Resource potential criterion: The fourth criterion is how a decision maker perceives the potential of available resources and is related to the availability and sufficiency of the source of raw materials in Thailand.
Criteria 5 (C5)—Environmental perception criterion: The fifth criterion is how a decision maker evaluates the value of environmental aspects of the sustainability paradigm based on the importance of environmental concerns, waste generation, pollution effects, as well as the capability for environmental management.

4.2. Criteria Evaluation

We next present the analysis of criteria for the hydrogen sourcing decision using the AHP technique. We note that the obtained weighted criteria will be further used as inputs for an analysis of the alternatives for hydrogen sourcing decisions using the FAHP technique. The hierarchy structure of the proposed problem is initially illustrated in Figure 3, in which level 0 implies the goal, level 1 presents a list of assessed criteria, and level 2 presents associated alternatives for selecting the hydrogen source and technology in Thailand.
Additionally, in order to properly evaluate both criteria and alternatives, a group of decision makers who are qualified as experts are interviewed and asked to provide judgment decisions. These experts are chosen based on their background, experience, and publication record in the field. Nine representative decision makers (i.e., DM1, DM2, …, DM9) are chosen: five of them are from academic institutes and four of them are from governmental units and companies. These experts have had experience in energy-related research and practice for more than five years. Next, data collected for criteria evaluation from these experts are analyzed using a group decision-making technique based on the AHP methodology [49,50].
We next discuss analyzed results obtained from the AHP methodology. Initially, the mathematical aggregation is performed in the pairwise comparison matrix of each decision maker/expert using a geometric mean approach. Then, criteria weights are evaluated and synthesized for group decision making. We note that the geometric mean procedure is a well-known technique for group decision making in AHP due to its capability to lower the rank reversal issue in AHP. Table 3 illustrates the analyzed individual and group decision-making results for the criteria.
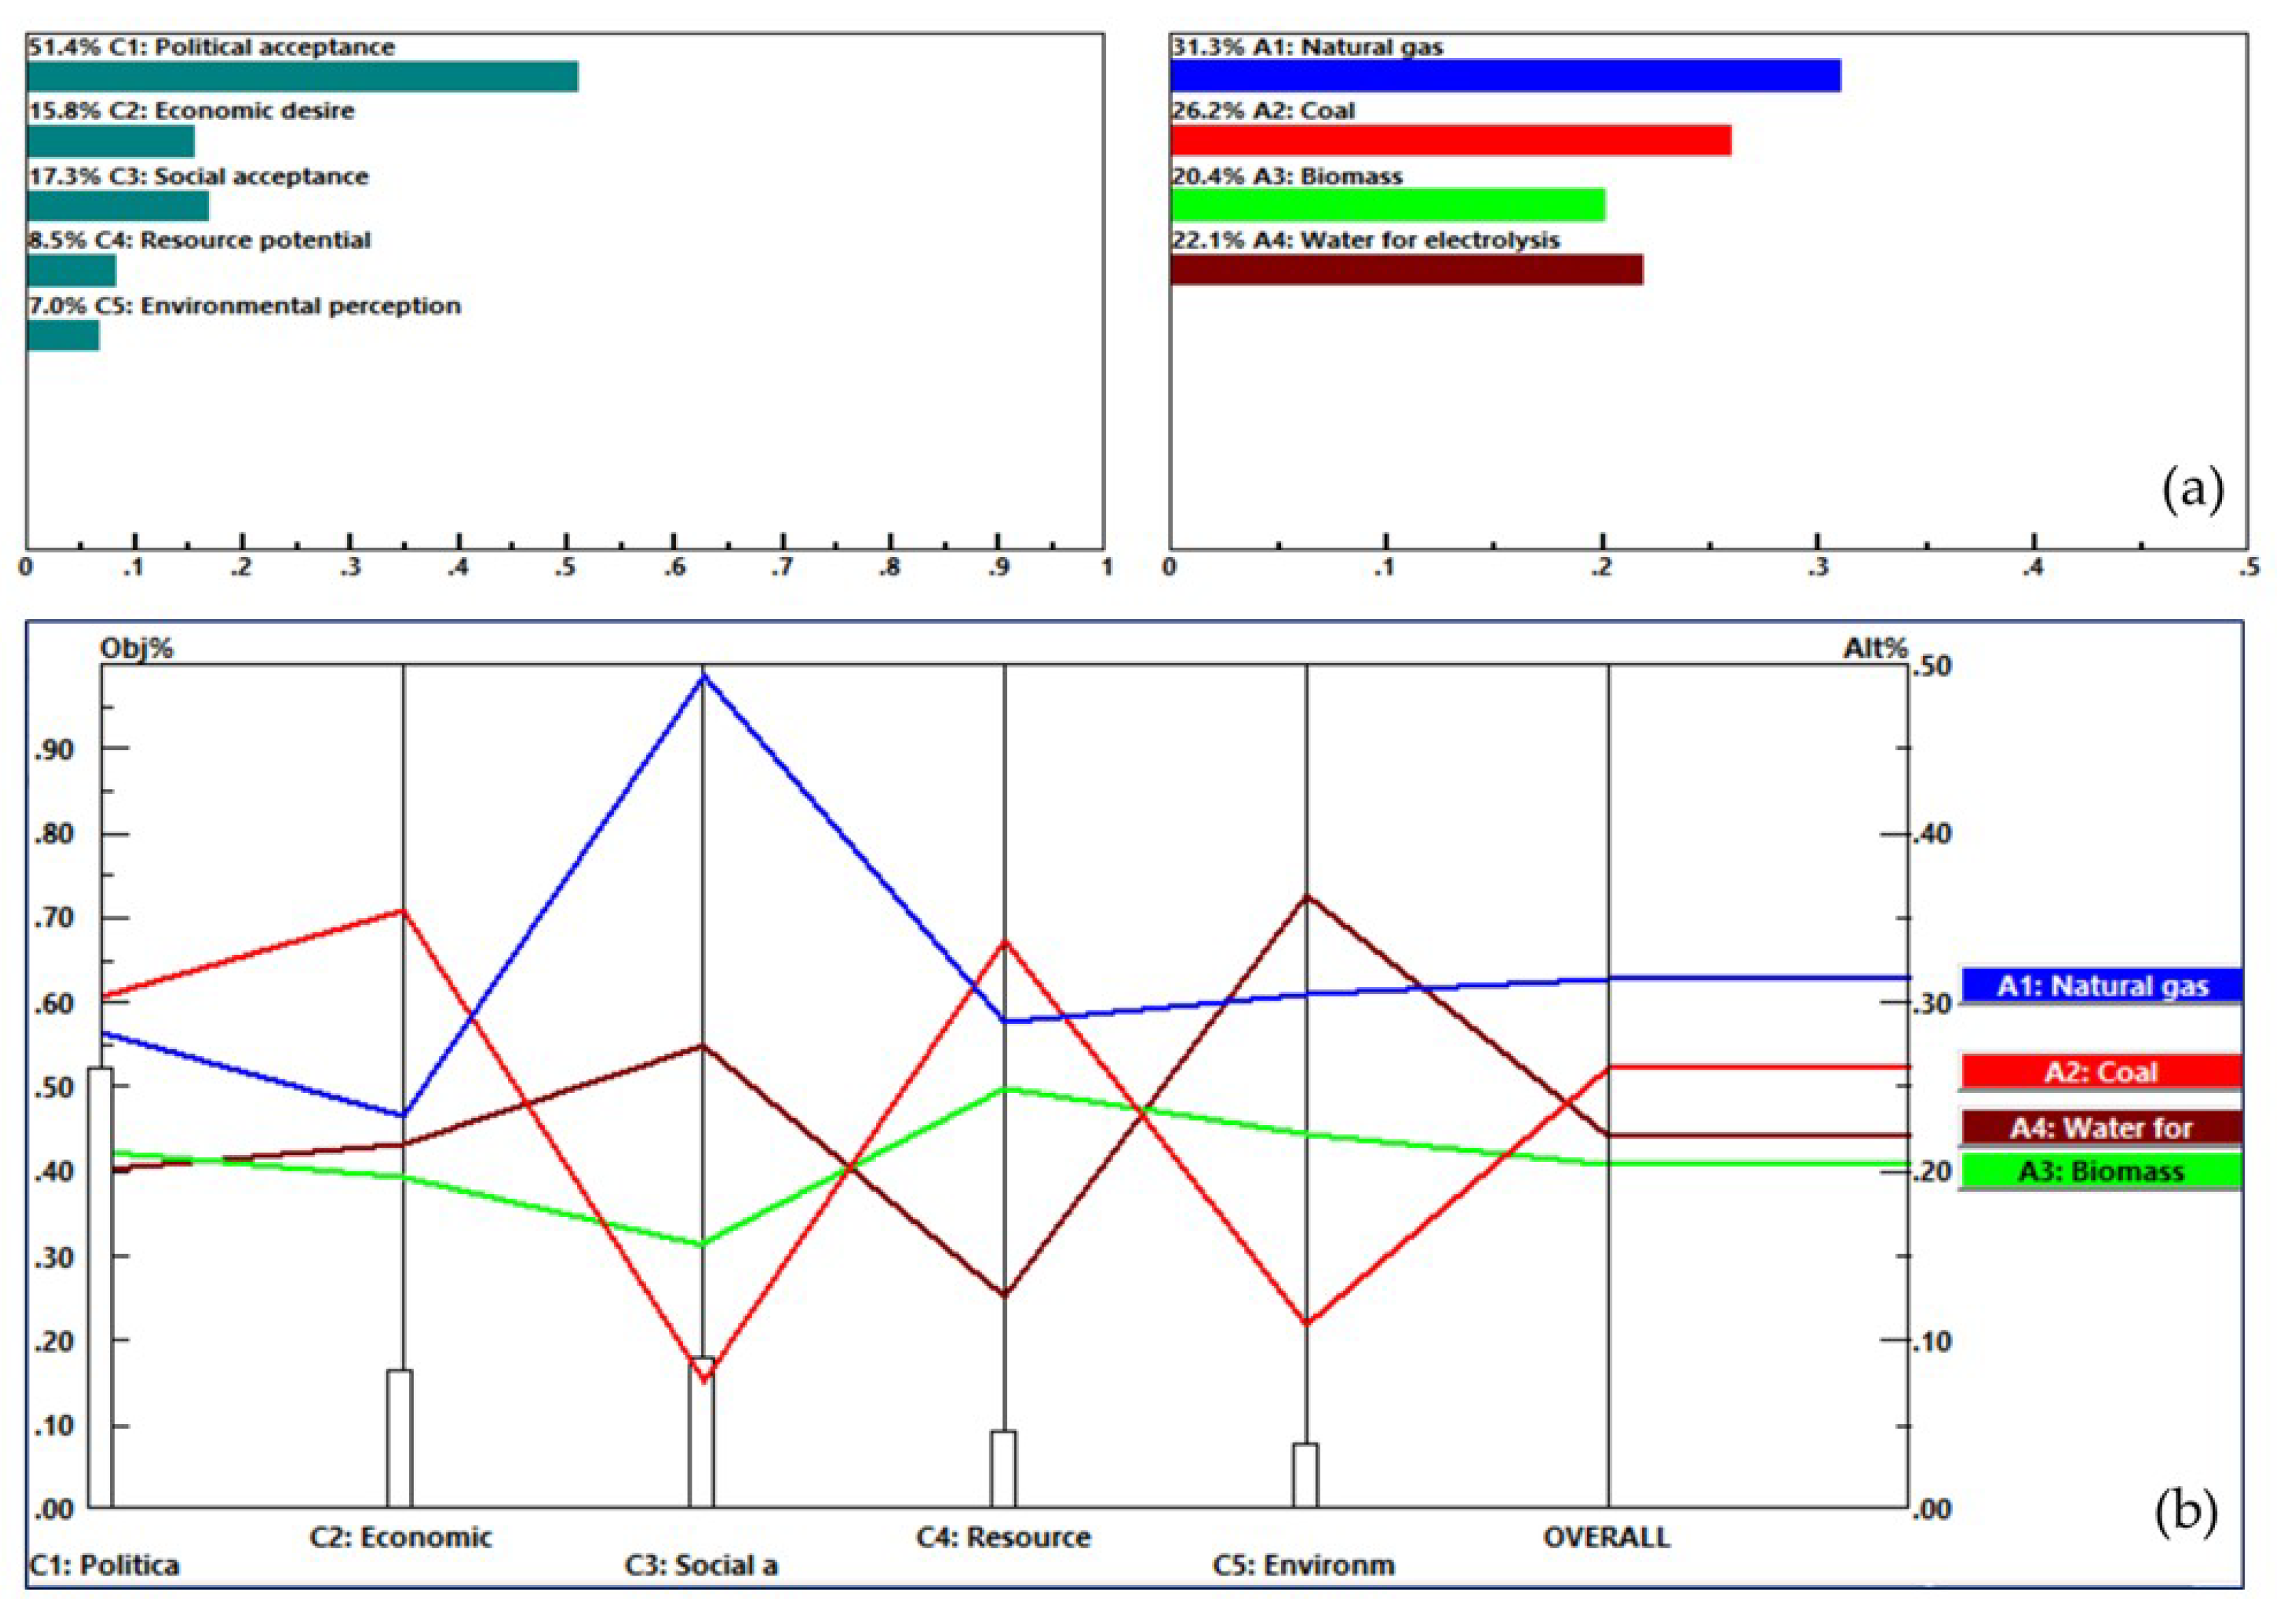
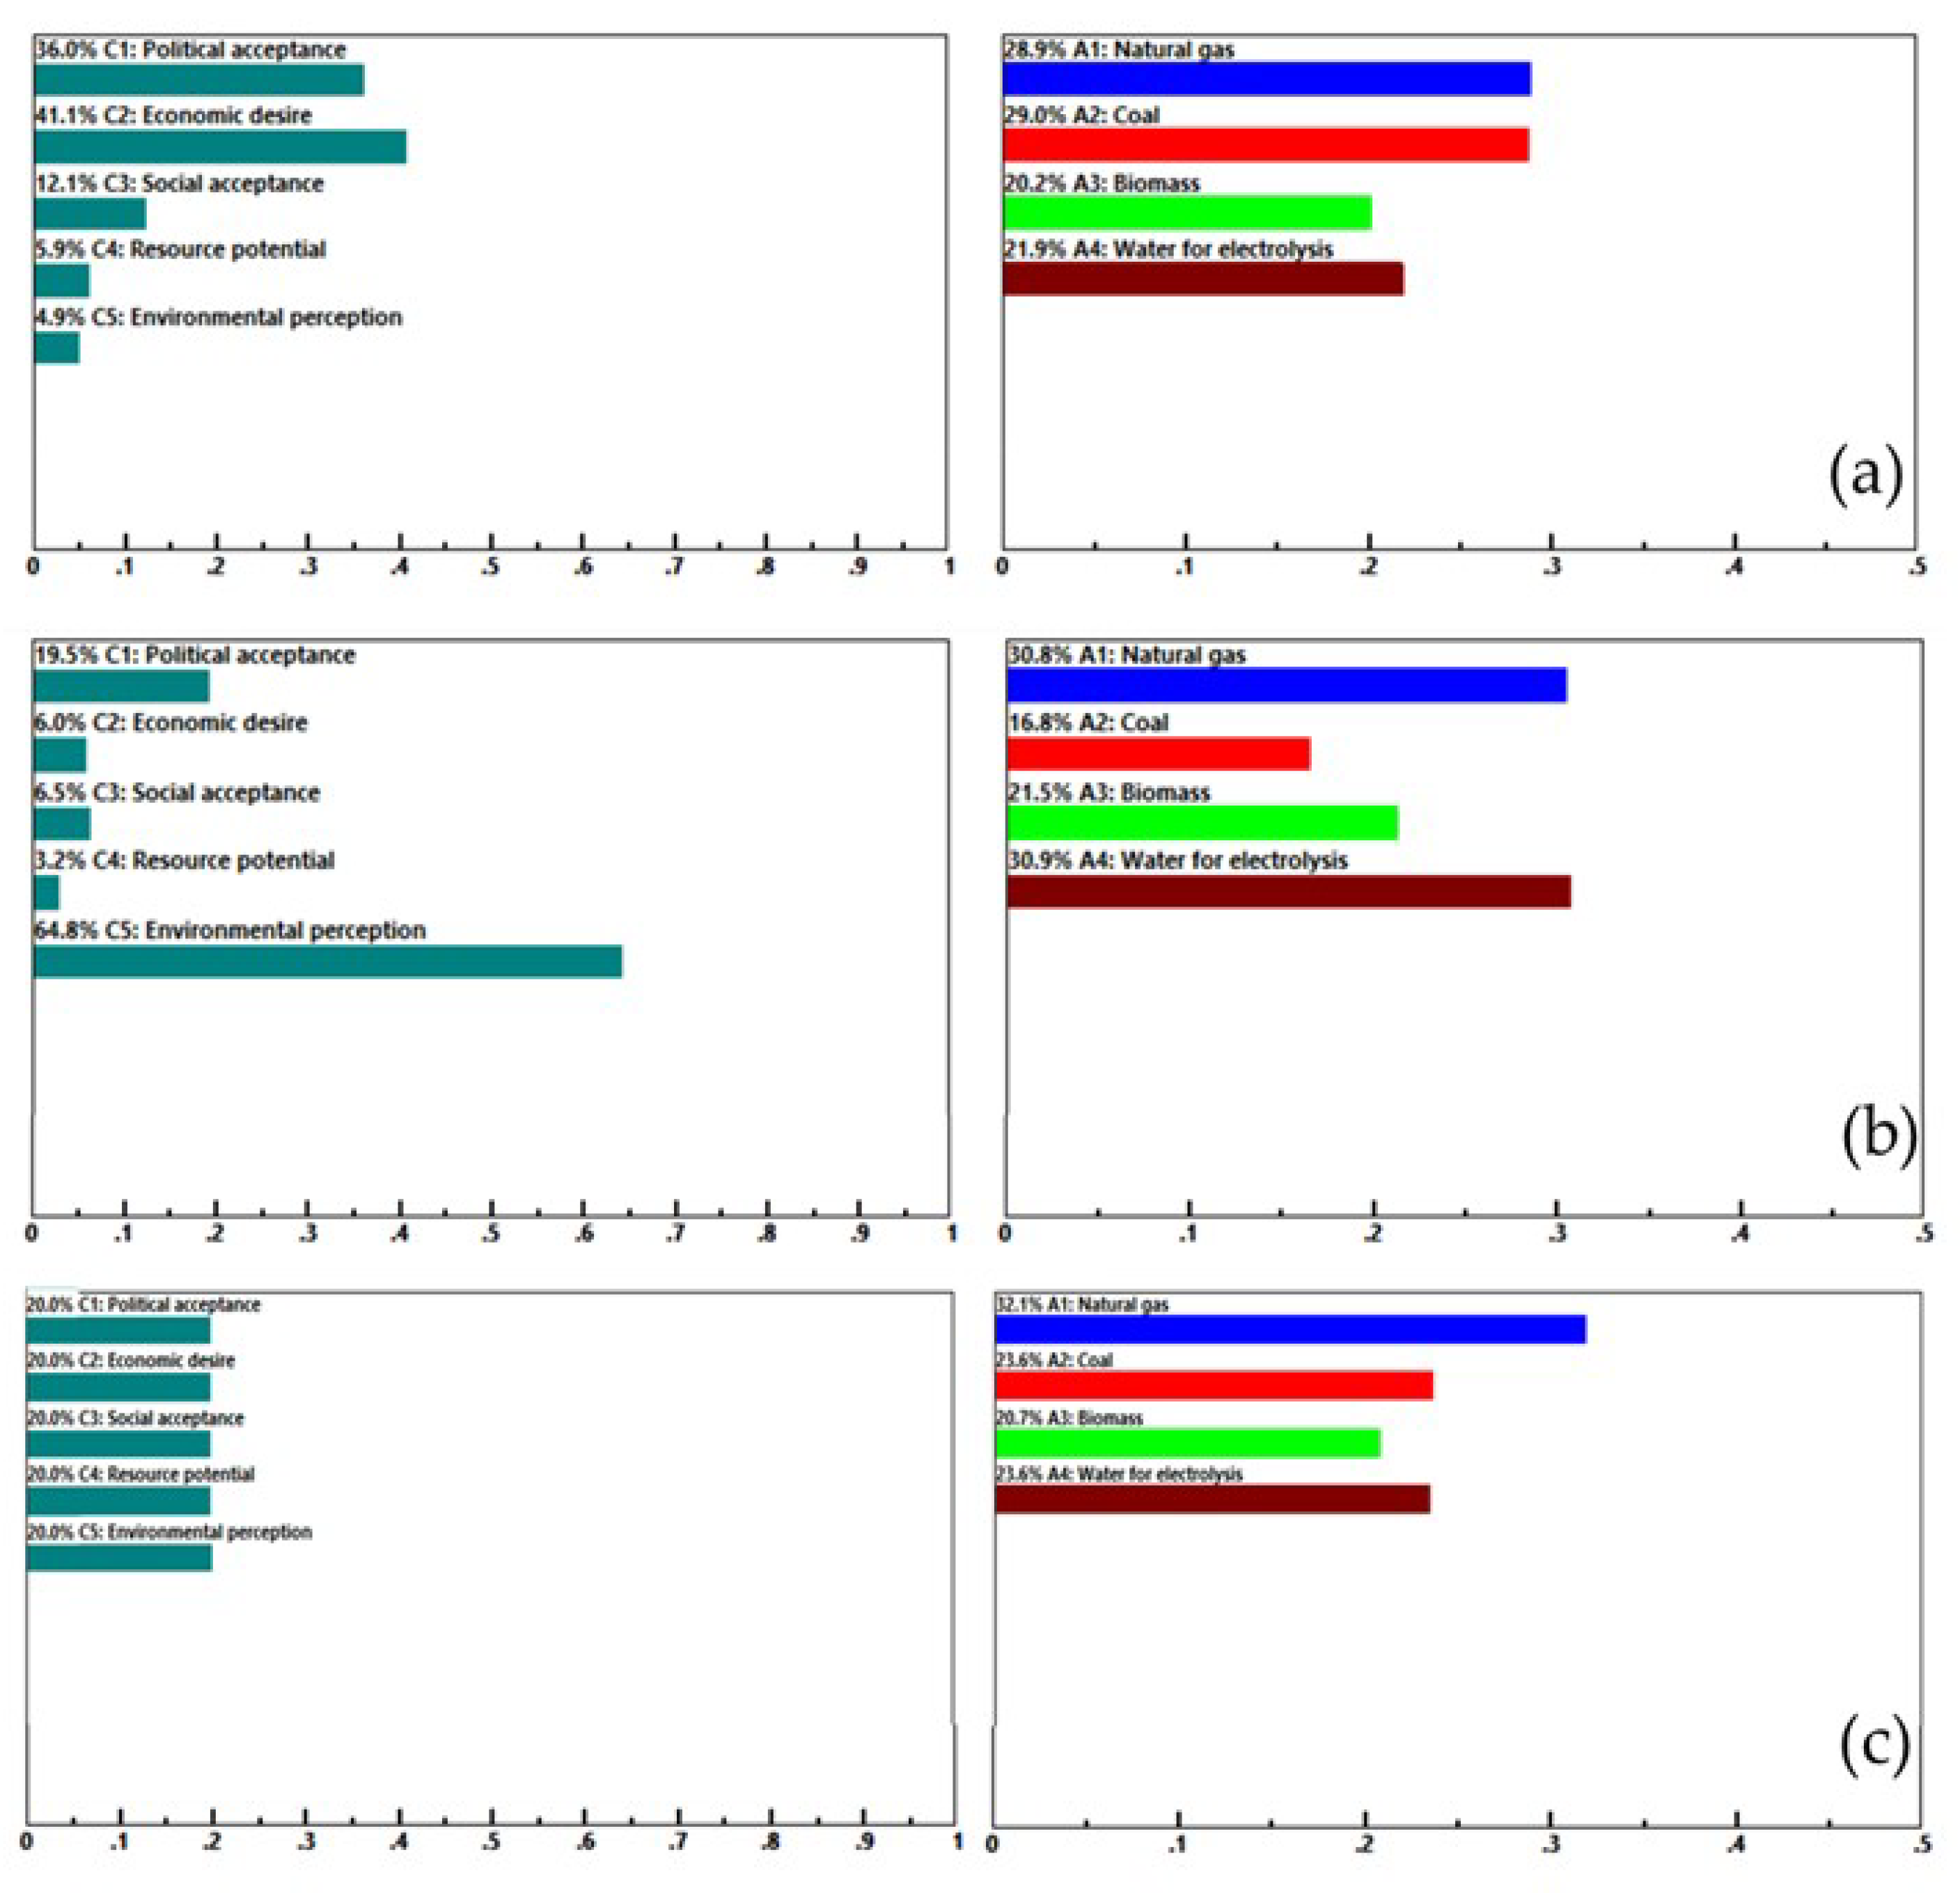
As shown in the table, there are some tradeoffs among subjective opinions for relevant criteria from expert opinions. Overall, the examined group decision making suggests that the highest-weighted criterion is C1 (political acceptance with weight 51.3%), followed by C3 (social acceptance with weight 17.2%), C2 (economic desirability with weight 15.5%), C4 (resource potential with weight 8.8%), and C5 (environmental perception with weight 7.2%). Additionally, we also conduct the consistency analysis by providing the maximum eigenvalue of the decision matrix of each decision maker. Our analysis shows that the computed maximum eigenvalues for all decision makers are overall within the range of the confidence level for consistency, i.e., between 0.01 and 0.20.

4.3. Alternative Evaluation

We next present the analysis of alternatives for hydrogen sourcing decisions using the FAHP approach by considering uncertainty in decision making using fuzzy set modeling. Initially, we compute the fuzzy weight for alternatives under each criterion for hydrogen sources using the FAHP technique for all decision makers as presented in Table 4. For example, the first decision maker (DM1) provides a fuzzy judgement, such that the minimum value (L), the most likely value (M), and the maximum value (U) for the local fuzzy weight of natural gas for gas reforming/gasification production (A1) under the political-acceptance criterion (C1) are 0.13, 0.26, and 0.48, respectively. Additionally, based on the most likely value (M), the local fuzzy weights for all alternatives under C1 of the first decision maker are 0.26, 0.37, 0.20 and 0.17. Computational results for all other numerical values shown in the table can be similarly interpreted.
Next, we evaluate the group decision-making results for all alternatives with respect to each criterion as illustrated in Table 5. That is, we defuzzify the fuzzy weight values into the crisp numerical format using Equation (14) introduced earlier. Then, the obtained crisp numerical value is further normalized to convert the weight value to be in a range between 0 and 1 using Equation (15). For example, the fuzzy weight based on the minimum (i.e., 0.13, 0.21, 0.10, and 0.10), the most likely (i.e., 0.26, 0.37, 0.20, and 0.17), and the maximum values (i.e., 0.48, 0.61, 0.43, and 0.33) of the first decision maker (i.e., D1) for all alternatives with respect to the first criterion (i.e., C1) can be defuzzified and normalized to 0.25, 0.35, 0.22, and 0.18 for A1, A2, A3, and A4, respectively. Similarly, the computational scores for other decision makers can be interpreted.
Furthermore, the group decision-making results for local alternative weights are computed with respect to each criterion as shown in Table 5. Clearly, there are some trade-offs not only among decision makers, but also among the alternatives for hydrogen production sources provided for group decision making’s local weights. For example, the natural gas alternative (i.e., A1) is considered the most superior option in terms of political acceptance (i.e., C1) and social acceptance (i.e., C3). The coal alternative (i.e., A2) is perceived as the best option in terms of economic desirability (i.e., C2) and resource potential (i.e., C4). The biomass gasification (i.e., A3) is perceived as challenging due partly to processing and future stability. Finally, the water electrolysis option (i.e., A4) is found to be best suited with respect to environmental perception (i.e., C5).
Finally, based on the results obtained from group decision making for both criteria weights using AHP and alternative weights for each criterion using FAHP, the global weight and the ranking of decision alternatives can be analyzed and summarized as shown in Table 6. Clearly, each expert has diverse opinions about both criteria and alternatives for hydrogen sourcing decisions. In particular, the group ranking list for criteria is C1 (political acceptance with 0.514) followed by C3 (social acceptance with 0.173), C2 (economic desirability with 0.158), C4 (resource potential with 0.085), and C5 (environmental perception with 0.070). In addition, the relevant alternatives for hydrogen sourcing decisions are found to be A1 (natural gas with 0.313), followed by A2 (coal alternative with 0.262), A4 (water electrolysis with 0.221), and A3 (biomass gasification with 0.204). Figure 4a illustrates the results of group decision making for criteria and alternatives. Additionally, Figure 4b shows tradeoffs among criteria with respect to each alternative.

4.4. Relative Efficiency Analysis Using the DEA Technique

We next discuss the analysis for the DEA technique to evaluate the relative efficiency of sourcing decisions for hydrogen energy. The DEA analysis requires both input criteria-and output criteria-type data to investigate the DMUs (i.e., alternatives) under consideration. We note that advantages of DEA include the capability to accommodate multiple inputs and outputs, to use any input–output measurement with diverse unit range, and to analyze the problem of interest without requiring the production function [46].
There are four DMUs under consideration, which are DMU1 or A1 (i.e., natural gas for gas reforming), DMU2 or A2 (coal for coal gasification), DMU3 or A3 (biomass for biomass gasification), and DMU4 or A4 (water for electrolysis). Next, we collect input data from the Department of Alternative Energy Development and Efficiency (DEDE), Ministry of Energy in Thailand (2022) for our analysis. The first (I1) and the second (I2) input criteria are the average production technology efficiency (percent) and the estimated hydrogen price per kilograms (USD), respectively. Additionally, analyzed weights for the four alternatives with respect to each criterion obtained earlier using the FAHP technique are used as quantitative output criteria for the DEA analysis: O1 or C1 (political acceptance), O2 or C2 (economic desirability), O3 or C3 (social acceptance), O4 or C4 (resource potential), and O5 or C5 (environmental perception).
We summarize relevant data in Table 7. Additionally, analyzed results for relative efficiency using the DEA approach are also presented in the table. Our analysis suggests that DMU1 (i.e., natural gas for gas reforming), DMU2 (coal for coal gasification), and DMU 4 (water for electrolysis) are considered relatively efficient, whereas DMU 3 (biomass for biomass gasification) is still considered inefficient with respect to other alternatives subject to the relevant criteria under consideration. We note that the purpose of conducting the DEA analysis is also to verify and validate the alternatives by comparing the efficiency score obtained from the DEA quantitative analysis and the ranking list obtained from the integrated AHP and FAHP approaches, which are based on subjective opinions from experts.

5. Sensitivity Analysis and Managerial Insights

5.1. Sensitivity Analysis

We further conduct the sensitivity analysis using expert choice [51] by varying the criteria weights for the group decision-making outcome as presented in Figure 5. Initially, the sensitivity analyses are performed to evaluate the coal (Figure 5a) and the water electrolysis (Figure 5b) alternatives. As expected, the results suggest that when the criterion weight of economic desirability increases to 0.411, the coal alternative is ranked first (i.e., the global score of the A2 is the highest), as shown in Figure 5a. Similarly, when the criterion weight of environmental perception increases to 0.648, the water for electrolysis is ranked first (i.e., the global score of the A4 is the highest), as shown in Figure 5b. We note that since the biomass alternative (i.e., A3) has no clear lead with respect to criteria evaluation in our study, the biomass alternative still does not outperform other alternatives with varying criteria weights. Additionally, we further examine the sensitivity analysis when all the criteria are importantly equal (i.e., each criterion has a respective weight of 0.20), as presented in Figure 5c. The assessment shows that the first-ranked alternative is natural gas (i.e., A1 with 0.321), followed by coal and water for electrolysis (i.e., A2 with 0.236 and A4 with 0.236) with the same weights, and biomass (i.e., A3 with 0.207).

5.2. Managerial Implications

MCDA has been proven a successful method that can evaluate multiple conflicting criteria in making decisions and planning. Evaluating sourcing decisions at the upstream processes of the hydrogen supply chain network is an important step towards achieving a proper design for the network. Making decisions for hydrogen sources and technology types for hydrogen energy faces a similar issue, given conflicting criteria with tradeoffs among criteria of interest. It is also necessary to understand the context of each particular hydrogen technology, where the sourcing decision highly depends on the technology under consideration. In this study, the AHP, FAHP, and DEA tools are successively used to analyze weighted criteria and sourcing alternatives by considering five selective criteria (i.e., political acceptance, economic desirability, social acceptance, resource potential, and environmental perception) and four potential sources (i.e., natural gas, coal, biomass, and water). Several authors (e.g., [52]) suggest that the limitation of using a particular method alone can be minimized. Thus, combining MCDA tools in the framework for the selection problem of a hydrogen source allows a quantitative evaluation of alternatives with respect to each criterion and provides a concrete ranking list that suits well the requirements from each decision maker. Additionally, incorporating the fuzzy set with the MCDA tools provides a basis for modeling the uncertainty from the subjective opinions of the participating decision makers.
Initially, when the integrated AHP and FAHP are analyzed, the ranking list following an analysis of group decision making can be obtained. The highest-weighted criterion is found to be political acceptance, followed by social acceptance, economic desirability, resource potential, and environmental perception. Political acceptance is clearly the most influential criterion, especially for Thailand, where a direction from government policy plays a key role for renewable energy planning. In addition, both the economic desirability and social acceptance criteria are found to be approximately equally important. Finally, both perspectives for resource potential and environmental perception criteria are found to be as important but to a lesser degree than both the economic desirability and social acceptance criteria.
Additionally, the overall best alternative as a sourcing alternative and technology type for producing hydrogen energy in Thailand is natural gas, followed by the coal alternative, water electrolysis, and biomass gasification. Natural gas and coal are found to be favorable alternatives. This is expected, given that Thailand can potentially move to an initial state of so-called grey hydrogen in the foreseeable energy plan. Natural gas is also perceived as a promising option with regard to its political and social acceptance. In addition, whereas water electrolysis is viewed as the best option especially for environmental concerns, the technological limitations and knowhow are still important aspects to consider. Finally, the biomass option is found to be the least preferred alternative when compared to other choices for hydrogen sourcing in Thailand. There are some supporting remarks from a group of experts concerning the scarcity of water resources as well as societal perceptions about hydrogen energy. Additionally, the economies of scale for the use of biomass as a hydrogen energy source still requires further attention according to expert opinion.
We further verify and validate our results by evaluating the efficiency score obtained from the DEA’s quantitative analysis and the ranking list obtained from the integrated AHP and FAHP approaches, which is based on subjective opinions of experts. The relative efficiency is further evaluated for all alternatives of hydrogen sourcing decisions using the integrated FAHP and DEA. Our analysis shows that coal gasification, natural gas reforming/gasification, and water electrolysis are comparatively efficient (i.e., 1.00 or 100%), whereas biomass gasification is relatively inefficient (i.e., 0.901 or 90%). Our efficiency-optimization analysis shows a similar trend and complements the results obtained from the integrated subjective evaluation introduced earlier. The ranking list obtained from our study and existing studies are compared (Table 8). Our study’s finding is supported by the suggestion from Raychaudhuri and Ghosh [53], who suggest policy-related challenges in Asian and European countries in terms of governments’ non-intervention approaches. The ranking list differs among studies, which also depend on expert opinion and country-specific policies and background. We note that the analysis is based on specific data inputs and subjective opinions of the experts being evaluated in our study. Thus, alternatives with lower scores do not imply that the source for producing hydrogen in the context of HSCN is not worth exploring. In contrast, further quantitative analysis should be further examined and evaluated for insightful implications.

6. Conclusions

The worldwide hydrogen economy relies on using hydrogen as an alternative energy source to deliver considerable amounts of energy at the national level. This is expected to become a foreseeable reality for energy alternatives in the future. A number of nations across the globe have taken a variety of measures and contributed with various policies to enhance the future of the hydrogen economy. Thailand, in particular, currently utilizes biomass-based fuel energy as a key source in its renewable energy plan. However, hydrogen energy-based research in Thailand is still relatively novice. In this study, we analyze potential sources for future hydrogen production of the evaluated hydrogen supply chain network using a case study and expert opinion in the context of Thailand, which lies in the upstream process of the chain. The problem of interest involves multiple criteria related to political acceptance, economic desirability, social acceptance, resource potential, and environmental perception, as well as related alternatives including natural gas, coal, biomass, and water.
This paper provides a case study to demonstrate how the sourcing decision for hydrogen production alternatives can be analyzed using a framework of integrative MCDA integrating both quantitative and qualitative measurements for a group of decision makers. The integrative MCDA was proposed, where the AHP technique was initially applied to evaluate criteria, the FAHP was later applied to assess alternatives under each criterion, and the DEA approach was finally used to analyze relative efficiency in our study. Our analysis reveals the perception of key experts; a ranking list and efficiency data of both criteria and alternatives can be obtained for future analysis of hydrogen source-related policy for hydrogen supply chain network development.
A number of limitations, and thus, future research directions, can be suggested. The integrative AHP and FAHP approach is based on a subjective evaluation of expert opinions. Both qualitative and quantitative analysis should be further conducted and integrated to enhance an understanding for policy implications. The mixed method research design can be further used to analyze both quantitative and qualitative data within the same study. Additionally, the dependency among criteria and alternatives can be further examined using advanced MCDA, such as an analytic network process (ANP). Advanced statistical analysis can also be used for relationship analysis between criteria and interested alternatives. With respect to efficiency analysis, some variations in DEA, such as super-efficiency DEA can be further examined. This can also provide more discriminatory power to efficiency analysis. Our plan for future research is to focus more on model development and analysis of supply chain aspects with special consideration for the midstream and downstream sections of the chain. Additionally, it is interesting to further evaluate the context of different countries, especially of developing and developed countries, for gaining merit of possible policies.

Author Contributions

K.R. contributed to manuscript writing, model development, and analysis. W.C. contributed to the data collection. T.G. contributed to manuscript writing and editing, and J.J. contributed to the data collection and manuscript editing. All authors have read and agreed to the published version of the manuscript.

Funding

This research was funded by the Office of the Permanent Secretary for Higher Education, Science, Research and Innovation (MHESI) under research grant RGNS63-245 ‘Development of Decision Support System for Biofuel Logistics under Uncertainty Consideration’.

Data Availability Statement

Data available on request.

Acknowledgments

We thank all data providers and suggestions from the three anonymous reviewers. We note that the opinions expressed are those of the authors and do not necessarily reflect the views of the funding agencies.

Conflicts of Interest

The authors declare no conflict of interest.

Abbreviations

MCDAMulti-Criteria Decision Analysis
AHPAnalytic Hierarchy Process
FAHPFuzzy Analytic Hierarchy Process
DEAData Envelopment Analysis
GHGGreenhouse Gas
FCEVFuel-Cell Electric Vehicle
EUEuropean Union
HSCNHydrogen Supply Chain Network
DMUDecision-Making Unit
CCRCharnes, Cooper, and Rhodes
AHP
A A positive reciprocal matrix
λ max The maximum eigenvalue
p Normalized principal eigenvector
g i Global alternative weight
w j Priority weight of criteria
l i j Local alternative weight with respect to each criterion
λ max U p p e r B o u n d Upper bound of maximum eigenvalue
FAHP
A ˜ A fuzzy comparison matrix
LThe minimum value of the triangular distribution
MThe most-likely value of the triangular distribution
UThe maximum value of the triangular distribution
r ˜ i Fuzzy comparison element
Fuzzy addition operator
Fuzzy multiplication operator
n i w Crisp numerical value
DEA
x i , k 0 Parameter for the amount of input data
y j , k 0 Parameter for the amount of output data
U i Decision variable representing weight assigned to the input
V j Decision variable representing weight assigned to the output

Appendix A

Table A1. Summary of selected MCDA studies for the hydrogen-related selection problem.
StudyMethodUncertaintyProblemAlternatives
Montignac et al. [32]MACBETH techniquexSelection of hydrogen storage technologiesCompressed, liquid and solid
Acar et al. [33]Hesitant fuzzy AHPHesitant fuzzySelection of hydrogen production methodsGrid electrolysis, wind electrolysis, photovoltaic electrolysis, nuclear
thermochemical water splitting cycles, solar, and photoelectrochemical cells
Xu et al. [34]DEA, FAHP, FTOPSISFuzzySelection of hydrogen production in ChinaThermochemical, electrolysis, direct water splitting, biological
Shah [20]Fuzzy Delphi, FAHP and DEAFuzzySelection of hydrogen source in PakistanWind, solar, biomass, municipal solid waste, geothermal, and micro-hydro.
Wulf et al. [35]PROMETHEELife cycle impact assessmentSelection of location for sustainable industrial hydrogen productionAustria, Germany and
Spain
Li et al. [36]SMCDA with GISxSelection of site for offshore wind farm sitingFour different altitudes of areas in the UK
Xuan et al. [37]SWARA, WASPAS, COPRAS, EDAS, and WSMxSelection of site location for solar-powered hydrogen production plant Thirteen provinces of Uzbekistan
This study Integrative AHP, FAHP, DEAFuzzySelection of hydrogen source and technology Natural gas, coal, biomass, and water

References

  1. Elahi, E.; Khalid, Z.; Tauni, M.Z.; Zhang, H.; Lirong, X. Extreme weather events risk to crop-production and the adaptation of innovative management strategies to mitigate the risk: A retrospective survey of rural Punjab, Pakistan. Technovation 2022, 117, 102255. [Google Scholar] [CrossRef]
  2. Elahi, E.; Khalid, Z.; Zhang, Z. Understanding farmers’ intention and willingness to install renewable energy technology: A solution to reduce the environmental emissions of agriculture. Appl. Energy 2022, 309, 118459. [Google Scholar] [CrossRef]
  3. Farias, C.B.B.; Barreiros, R.C.S.; da Silva, M.F.; Casazza, A.A.; Converti, A.; Sarubbo, L.A. Use of Hydrogen as Fuel: A Trend of the 21st Century. Energies 2022, 15, 311. [Google Scholar] [CrossRef]
  4. Gawusu, S.; Zhang, X.; Jamatutu, S.A.; Ahmed, A.; Amadu, A.A.; Djam Miensah, E. The dynamics of green supply chain management within the framework of renewable energy. Int. J. Energy Res. 2022, 46, 684–711. [Google Scholar] [CrossRef]
  5. Levenda, A.M.; Behrsin, I.; Disano, F. Renewable energy for whom? A global systematic review of the environmental justice implications of renewable energy technologies. Energy Res. Soc. Sci. 2021, 71, 101837. [Google Scholar] [CrossRef]
  6. Mandley, S.J.; Daioglou, V.; Junginger, H.M.; van Vuuren, D.P.; Wicke, B. EU bioenergy development to 2050. Renew. Sustain. Energy Rev. 2020, 127, 109858. [Google Scholar] [CrossRef]
  7. Department of Alternative Energy Development and Efficiency (DEDE). Research and Development in the Field of Energy Conservation and Renewable Energy in Thailand. 2021. Available online: http://weben.dede.go.th/ (accessed on 1 May 2022).
  8. Energy Tracker Asia. Southeast Asia Looks beyond Coal. 2022. Available online: https://energytracker.asia/ (accessed on 1 May 2022).
  9. Global Hydrogen Generation Market Size Report. Grand View Research. 2022. Available online: https://www.grandviewresearch.com/ (accessed on 1 May 2022).
  10. Körner, A.; Tam, C.; Bennett, S.; Gagné, J. Technology Roadmap-Hydrogen and Fuel Cells; International Energy Agency (IEA): Paris, France, 2015. [Google Scholar]
  11. Ren, X.; Li, W.; Ding, S.; Dong, L. Sustainability assessment and decision making of hydrogen production technologies: A novel two-stage multi-criteria decision making method. Int. J. Hydrogen Energy 2020, 45, 34371–34384. [Google Scholar] [CrossRef]
  12. Talebian, H.; Herrera, O.E.; Mérida, W. Policy effectiveness on emissions and cost reduction for hydrogen supply chains: The case for British Columbia. Int. J. Hydrogen Energy 2021, 46, 998–1011. [Google Scholar] [CrossRef]
  13. Thailand Board of Investment (BOI). Thailand’s Bio Economy. 2022. Available online: https://www.boi.go.th/ (accessed on 1 May 2022).
  14. Cornwall Insight. Low-Carbon Hydrogen Index. 2022. Available online: https://www.cornwall-insight.com/ (accessed on 1 May 2022).
  15. Green Car Congress. 2021. Available online: https://www.greencarcongress.com/ (accessed on 1 May 2022).
  16. Yoon, H.J.; Seo, S.K.; Lee, C.J. Multi-period optimization of hydrogen supply chain utilizing natural gas pipelines and byproduct hydrogen. Renew. Sustain. Energy Rev. 2022, 157, 112083. [Google Scholar] [CrossRef]
  17. Atashbar, N.Z.; Labadie, N.; Prins, C. Modelling and optimization of biomass supply chains: A review. Int. J. Prod. Res. 2018, 56, 3482–3506. [Google Scholar] [CrossRef] [Green Version]
  18. Ransikarbum, K.; Mason, S.J. A bi-objective optimisation of post-disaster relief distribution and short-term network restoration using hybrid NSGA-II algorithm. Int. J. Prod. Res. 2021, 60, 5769–5793. [Google Scholar] [CrossRef]
  19. Ransikarbum, K.; Pitakaso, R.; Kim, N.; Ma, J. Multicriteria decision analysis framework for part orientation analysis in additive manufacturing. J. Comput. Des. Eng. 2021, 8, 1141–1157. [Google Scholar] [CrossRef]
  20. Shah, S.A.A. Feasibility study of renewable energy sources for developing the hydrogen economy in Pakistan. Int. J. Hydrogen Energy 2020, 45, 15841–15854. [Google Scholar] [CrossRef]
  21. Van de Graaf, T.; Overland, I.; Scholten, D.; Westphal, K. The new oil? The geopolitics and international governance of hydrogen. Energy Res. Soc. Sci. 2020, 70, 101667. [Google Scholar] [CrossRef] [PubMed]
  22. Collins, L. A Wake-Up Call on Green Hydrogen: The Amount of Wind and Solar Needed Is Immense; Recharge: London, UK, 2020. [Google Scholar]
  23. Chaiyaphan, C.; Ransikarbum, K. Criteria Analysis of Food Safety using the Analytic Hierarchy Process (AHP)—A Case study of Thailand’s Fresh Markets. In Proceedings of the 2019 Research, Invention, and Innovation Congress (RI2C 2019), Bangkok, Thailand, 11–13 December 2019; EDP Sciences: Les Ulis, Frace, 2020; Volume 141, p. 02001. [Google Scholar]
  24. Ransikarbum, K.; Leksomboon, R. Analytic Hierarchy Process Approach for Healthcare Educational Media Selection: Additive Manufacturing Inspired Study. In Proceedings of the 2021 IEEE 8th International Conference on Industrial Engineering and Applications (ICIEA), Chengdu, China, 23–26 April 2021; IEEE: Piscataway, NJ, USA, 2021; pp. 154–158. [Google Scholar]
  25. Laganà, I.R.; Colapinto, C. Multiple criteria decision-making in healthcare and pharmaceutical supply chain management: A state-of-the-art review and implications for future research. J. Multi-Criteria Decis. Anal. 2022, 29, 122–134. [Google Scholar] [CrossRef]
  26. Goyal, P.; Kumar, D.; Kumar, V. Application of multicriteria decision analysis (MCDA) in the area of sustainability: A literature review. Int. J. Anal. Hierarchy Process 2020, 12, 720. [Google Scholar] [CrossRef]
  27. Chanthakhot, W.; Ransikarbum, K. Integrated IEW-TOPSIS and fire dynamics simulation for agent-based evacuation modeling in industrial safety. Safety 2021, 7, 47. [Google Scholar] [CrossRef]
  28. Dos Santos, P.H.; Neves, S.M.; Sant’Anna, D.O.; de Oliveira, C.H.; Carvalho, H.D. The analytic hierarchy process supporting decision making for sustainable development: An overview of applications. J. Clean. Prod. 2019, 212, 119–138. [Google Scholar] [CrossRef]
  29. Liu, Y.; Eckert, C.M.; Earl, C. A review of fuzzy AHP methods for decision-making with subjective judgements. Expert Syst. Appl. 2020, 161, 113738. [Google Scholar] [CrossRef]
  30. Yu, D.; He, X. A bibliometric study for DEA applied to energy efficiency: Trends and future challenges. Appl. Energy 2020, 268, 115048. [Google Scholar] [CrossRef]
  31. Yu, D.; Kou, G.; Xu, Z.; Shi, S. Analysis of collaboration evolution in AHP research: 1982–2018. Int. J. Inf. Technol. Decis. Mak. 2021, 20, 7–36. [Google Scholar] [CrossRef]
  32. Montignac, F.; Mousseau, V.; Bouyssou, D.; Aloulou, M.A.; Rousval, B.; Damart, S. An MCDA approach for evaluating hydrogen storage systems for future vehicles. In Evaluation and Decision Models with Multiple Criteria; Springer: Berlin/Heidelberg, Germany, 2015; pp. 501–532. [Google Scholar]
  33. Acar, C.; Beskese, A.; Temur, G.T. Sustainability analysis of different hydrogen production options using hesitant fuzzy AHP. Int. J. Hydrogen Energy 2018, 43, 18059–18076. [Google Scholar] [CrossRef]
  34. Xu, L.; Wang, Y.; Shah, S.A.A.; Zameer, H.; Solangi, Y.A.; Walasai, G.D.; Siyal, Z.A. Economic viability and environmental efficiency analysis of hydrogen production processes for the decarbonization of energy systems. Processes 2019, 7, 494. [Google Scholar] [CrossRef] [Green Version]
  35. Wulf, C.; Zapp, P.; Schreiber, A.; Kuckshinrichs, W. Setting thresholds to define indifferences and preferences in PROMETHEE for life cycle sustainability assessment of European hydrogen production. Sustainability 2021, 13, 7009. [Google Scholar] [CrossRef]
  36. Li, Z.; Tian, G.; El-Shafay, A.S. Statistical-analytical study on world development trend in offshore wind energy production capacity focusing on Great Britain with the aim of MCDA based offshore wind farm siting. J. Clean. Prod. 2022, 363, 132326. [Google Scholar] [CrossRef]
  37. Xuan, H.A.; Trinh, V.V.; Techato, K.; Phoungthong, K. Use of hybrid MCDM methods for site location of solar-powered hydrogen production plants in Uzbekistan. Sustain. Energy Technol. Assess. 2022, 52, 101979. [Google Scholar]
  38. Mu, E. The Past and Future of AHP/ANP: An ISAHP2020 Perspective. Int. J. Anal. Hierarchy Process 2020, 12, 842. [Google Scholar] [CrossRef]
  39. Ransikarbum, K.; Kim, N. Multi-criteria selection problem of part orientation in 3D fused deposition modeling based on analytic hierarchy process model: A case study. In Proceedings of the 2017 IEEE International Conference on Industrial Engineering and Engineering Management (IEEM), Singapore, 10–13 December 2017; IEEE: Piscataway, NJ, USA, 2017; pp. 1455–1459. [Google Scholar]
  40. Darko, A.; Chan, A.P.C.; Ameyaw, E.E.; Owusu, E.K.; Pärn, E.; Edwards, D.J. Review of application of analytic hierarchy process (AHP) in construction. Int. J. Constr. Manag. 2019, 19, 436–452. [Google Scholar] [CrossRef]
  41. Ransikarbum, K.; Pitakaso, R.; Kim, N. A decision-support model for additive manufacturing scheduling using an integrative analytic hierarchy process and multi-objective optimization. Appl. Sci. 2020, 10, 5159. [Google Scholar] [CrossRef]
  42. Alonso, J.A.; Lamata, M.T. Consistency in the analytic hierarchy process: A new approach. Int. J. Uncertain. Fuzziness Knowl. -Based Syst. 2006, 14, 445–459. [Google Scholar] [CrossRef] [Green Version]
  43. Ransikarbum, K.; Kim, N. Data envelopment analysis-based multi-criteria decision making for part orientation selection in fused deposition modeling. In Proceedings of the 2017 4th International Conference on Industrial Engineering and Applications (ICIEA), Nagoya, Japan, 21–23 April 2017; IEEE: Piscataway, NJ, USA, 2017; pp. 81–85. [Google Scholar]
  44. Kohl, S.; Schoenfelder, J.; Fügener, A.; Brunner, J.O. The use of Data Envelopment Analysis (DEA) in healthcare with a focus on hospitals. Health Care Manag. Sci. 2019, 22, 245–286. [Google Scholar] [CrossRef] [PubMed]
  45. Ransikarbum, K.; Pitakaso, R.; Kim, N. Evaluation of assembly part build orientation in additive manufacturing environment using data envelopment analysis. In Proceedings of the 2019 7th Asia Conference on Mechanical and Materials Engineering (ACMME 2019), Tokyo, Japan, 14–17 June 2019; EDP Sciences: Les Ulis, Frace, 2019; Volume 293, p. 02002. [Google Scholar]
  46. Cooper, W.W.; Seiford, L.M.; Tone, K. Data Envelopment Analysis: A Comprehensive Text with Models, Applications, References and DEA-Solver Software; Springer: New York, NY, USA, 2007; Volume 2, p. 489. [Google Scholar]
  47. Li, L.; Manier, H.; Manier, M.A. Hydrogen supply chain network design: An optimization-oriented review. Renew. Sustain. Energy Rev. 2019, 103, 342–360. [Google Scholar] [CrossRef]
  48. Aditiya, H.B.; Aziz, M. Prospect of hydrogen energy in Asia-Pacific: A perspective review on techno-socio-economy nexus. Int. J. Hydrogen Energy 2021, 46, 35027–35056. [Google Scholar] [CrossRef]
  49. Ishizaka, A.; Labib, A. Review of the main developments in the analytic hierarchy process. Expert Syst. Appl. 2011, 38, 14336–14345. [Google Scholar] [CrossRef] [Green Version]
  50. Ho, W.; Ma, X. The state-of-the-art integrations and applications of the analytic hierarchy process. Eur. J. Oper. Res. 2018, 267, 399–414. [Google Scholar] [CrossRef]
  51. Expert Choice. 2023. Available online: https://www.expertchoice.com/ahp-software (accessed on 1 May 2022).
  52. Keren, B.; Hadad, Y.; Laslo, Z. Combining AHP and DEA methods for selecting a project manager. Manag. J. Sustain. Bus. Manag. Solut. Emerg. Econ. 2014, 19, 17–28. [Google Scholar] [CrossRef]
  53. Raychaudhuri, A.; Ghosh, S.K. Biomass supply chain in Asian and European countries. Procedia Environ. Sci. 2016, 35, 914–924. [Google Scholar] [CrossRef]
Figure 1. The methodology flow for hydrogen-source selection problem.
Resources 12 00048 g001
Figure 2. The focus of the case study based on the typical flow of HSCN.
Resources 12 00048 g002
Figure 3. The hierarchy of the proposed selection problem.
Resources 12 00048 g003
Figure 4. (a) Group decision making (b) Criteria tradeoffs of each sourcing alternative.
Resources 12 00048 g004
Figure 5. Sensitivity analysis (a) A2 alternative, (b) A4 alternative, (c) equal weight.
Resources 12 00048 g005
Table 1. Computed upper bound of maximum eigenvalue for consistency evaluation.
Matrix SizeThe Confidence Level for Consistency
3 0.010.050.100.200.50
44.0274.1364.2734.5465.364
55.0455.2255.4505.9007.249
Table 2. Membership of the fuzzy set (fuzzy numbers) based on the triangular distribution.
Fuzzy NumberVerbal Judgment
(1, 1, 1)Equally preferred
(1, 2, 3)Equally to moderately preferred
(2, 3, 4)Moderately preferred
(3, 4, 5)Moderately to strongly preferred
(4, 5, 6)Strongly preferred
(5, 6, 7)Strongly to very strongly preferred
(6, 7, 8)Very strongly preferred
(7, 8, 9)Very to extremely strongly preferred
(9, 9, 9)Extremely preferred
Table 3. Group decision-making results for criteria evaluation of hydrogen sources.
Decision MakerCriteriaConsistency
C1C2C3C4C5The Maximum
Eigenvalue
DM10.3250.0860.1460.2920.1515.208
DM20.6010.1790.0980.0900.0325.351
DM30.5800.0650.2070.0660.0835.238
DM40.5560.1110.1110.1110.1115.000
DM50.3410.1650.3400.0660.0885.258
DM60.4970.2060.1570.0360.1045.209
DM70.2740.1820.4110.0860.0465.202
DM80.5910.2090.0900.0550.0555.277
DM90.5520.2040.1270.0850.0325.298
Group decision
(Geometric mean)
0.5130.1550.1720.0880.072
Table 4. Fuzzy weights for alternatives under each criterion for hydrogen sources.
C1C2C3C4C5
A1A2A3A4A1A2A3A4A1A2A3A4A1A2A3A4A1A2A3A4
Decision maker 1 (DM1)
L0.130.210.100.100.140.210.100.100.310.050.090.180.140.270.130.100.190.280.070.05
M0.260.370.200.170.240.380.180.200.500.070.140.290.230.410.210.150.320.490.120.07
U0.480.610.430.330.430.610.360.430.530.730.200.120.380.590.320.250.560.790.210.13
Decision maker 2 (DM2)
L0.200.150.110.290.100.200.040.230.360.060.070.110.070.080.140.230.090.030.190.43
M0.250.230.150.380.170.330.060.440.560.100.110.200.120.150.290.450.120.030.260.58
U0.300.330.200.480.300.600.100.750.820.200.190.310.260.290.580.820.160.040.380.77
Decision maker 3 (DM3)
L0.240.170.160.050.110.270.180.050.470.040.100.140.180.150.150.040.190.030.190.37
M0.490.240.210.060.170.470.290.080.690.060.140.220.340.300.300.060.230.030.230.52
U0.660.350.280.090.280.750.470.130.980.090.220.340.640.570.570.110.290.040.290.68
Decision maker 4 (DM4)
L0.110.100.160.290.250.250.250.250.200.050.110.150.310.240.240.160.190.050.270.09
M0.150.130.260.480.250.250.250.250.380.070.190.270.340.240.240.170.310.080.470.14
U0.340.250.420.740.250.250.250.250.620.100.360.470.380.250.250.190.550.130.770.23
Decision maker 5 (DM5)
L0.110.230.110.130.150.420.160.030.280.040.100.180.130.470.150.030.320.040.320.32
M0.170.370.200.260.190.570.200.040.480.060.160.290.170.610.190.040.320.040.320.32
U0.330.610.430.360.240.760.260.060.740.090.270.450.210.780.230.050.320.040.320.32
Decision maker 6 (DM6)
L0.380.380.050.050.300.300.050.100.330.050.110.130.190.190.370.030.140.040.050.63
M0.440.440.060.060.400.400.070.140.530.070.170.210.230.230.520.030.180.050.070.70
U0.500.500.070.070.510.510.100.200.790.100.300.330.290.290.680.040.220.070.090.79
Decision maker 7 (DM7)
L0.260.020.420.030.100.210.360.030.150.060.080.210.290.220.100.030.200.070.050.30
M0.380.020.560.040.130.300.520.040.320.090.130.340.480.340.140.050.320.110.070.50
U0.600.030.730.050.200.440.740.060.540.170.240.560.730.560.220.070.550.180.120.78
Decision maker 8 (DM8)
L0.100.200.040.220.070.040.160.470.330.050.080.130.450.450.050.050.300.390.060.03
M0.170.400.070.360.100.050.230.620.530.080.130.230.450.450.050.050.370.520.070.03
U0.310.700.110.640.130.070.340.810.790.140.210.360.450.450.050.050.500.660.080.04
Decision maker 9 (DM9)
L0.160.120.120.170.110.160.030.320.200.050.100.180.060.070.130.400.060.030.180.52
M0.270.220.200.310.170.270.050.510.380.070.160.300.090.110.210.590.090.040.230.64
U0.430.340.370.580.310.430.070.780.620.120.270.500.160.180.320.850.120.050.300.78
Table 5. Group decision-making results for alternatives under each criterion.
CriteriaAlternativesDM1DM2DM3DM4DM5DM6DM7DM8DM9Group
C1A10.250.250.490.150.180.440.380.170.270.286
A20.350.230.240.130.370.440.030.390.210.263
A30.220.150.210.260.220.060.560.070.200.218
A40.180.380.060.460.230.060.040.360.310.233
C2A10.240.170.170.250.190.390.140.100.180.203
A20.350.340.460.250.570.390.300.050.270.332
A30.190.060.290.250.200.070.520.230.050.207
A40.220.430.080.250.040.140.040.620.500.258
C3A10.420.560.610.400.480.530.350.540.410.479
A20.260.120.050.070.060.070.110.090.080.101
A30.140.120.130.220.170.190.160.140.180.161
A40.180.200.200.300.290.220.380.230.330.259
C4A10.240.130.340.340.170.230.470.450.100.275
A20.390.150.300.240.600.230.350.450.110.313
A30.210.290.300.240.190.510.140.050.210.238
A40.160.430.060.170.040.030.050.050.580.174
C5A10.360.170.230.320.320.370.330.380.090.286
A20.470.030.030.080.040.050.110.510.040.151
A30.120.270.230.460.320.070.070.070.230.205
A40.050.530.510.140.320.510.490.030.640.358
Table 6. Synthesized global weight for group decision making.
Decision MakerGlobal Weight
C1C2C3C4C5A1A2A3A4
DM10.3270.0840.1460.2940.1490.2890.3540.1860.171
DM20.6270.1680.0970.0790.0280.2010.2510.1860.362
DM30.5960.0730.1960.0490.0850.4520.2200.2040.124
DM40.5560.1110.1110.1110.1110.2450.1370.2740.345
DM50.3400.1640.3410.0650.0900.3410.2410.1930.224
DM60.5080.2170.1470.0340.0940.4120.3290.0960.163
DM70.2790.1730.4260.0790.0430.3050.1630.3280.205
DM80.6150.2000.0820.0520.0520.2100.3150.1050.370
DM90.5750.1950.1220.0790.0290.1980.2290.1890.384
Group0.5140.1580.1730.0850.0700.3130.2620.2040.221
Table 7. Analysis of criteria for a hydrogen source alternative using DEA.
AlternativesInput CriteriaOutput CriteriaRelative Efficiency
I1I2O1 (C1)O2 (C2)O3 (C3)O4 (C4)O5 (C5)
DMU1 (A1)76.51.340.2860.2030.4790.2750.2861.000
DMU2 (A2)63.00.920.2630.3320.1010.3130.1511.000
DMU3 (A3)53.01.810.2180.2070.1610.2380.2050.901
DMU4 (A4)31.03.390.2330.2580.2590.1740.3581.000
Table 8. Comparison of results of selected existing studies.
Study Ranking Results
This studyCriteriaPolitical—Social—Economic—Resource—Environment
Alternatives Natural Gas—Coal—Water for Electrolysis—Biomass
Acar et al. [33]CriteriaTechnical—Environment—Availability—Economic—Social
AlternativesGrid electrolysis—Photo electrochemical cell—Wind electrolysis—Solar thermochemical—Nuclear
Xu et al. [34]CriteriaCapital cost—Production—Feedstock—O and M—Emissions
AlternativesWind—PV Electrolysis—Biomass gasification—Grid Electrolysis—Solar—Photobiological—Natural gas—Coal—Photoelectrochemical—Biomass liquid reforming—Microbial biomass
Disclaimer/Publisher’s Note: The statements, opinions and data contained in all publications are solely those of the individual author(s) and contributor(s) and not of MDPI and/or the editor(s). MDPI and/or the editor(s) disclaim responsibility for any injury to people or property resulting from any ideas, methods, instructions or products referred to in the content.

