Article

Development of a MATLAB-GAMS Framework for Solving the Problem Regarding the Optimal Location and Sizing of PV Sources in Distribution Networks

by
David Steveen Guzmán-Romero
1,
Brandon Cortés-Caicedo
2 and
Oscar Danilo Montoya
1,*
1
Grupo de Compatibilidad e Interferencia Electromagnética (GCEM), Facultad de Ingeniería, Universidad Distrital Francisco José de Caldas, Bogotá 110231, Colombia
2
Departamento de Mecatrónica y Electromecánica, Facultad de Ingeniería, Instituto Tecnológico Metropolitano, Medellín 050036, Colombia
*
Author to whom correspondence should be addressed.
Resources 2023, 12(3), 35; https://doi.org/10.3390/resources12030035
Submission received: 18 January 2023 / Revised: 23 February 2023 / Accepted: 27 February 2023 / Published: 3 March 2023
(This article belongs to the Special Issue Decision Making in Resources Management: Problems, Methods and Tools)

Abstract

:
This paper addresses the planning problem regarding the location and sizing of PV generators in distribution networks with a radial topology. This problem is mathematically modeled using a mixed integer nonlinear programming (MINLP) model, which seeks to reduce the total annual operating costs of the system for a planning horizon of 20 years. The objective function used in this paper comprises three elements: (i) the energy purchase costs at the substation node (i.e., the main supply node), (ii) the investment costs for the integration of PV generators, and (iii) the costs associated with the operation and maintenance of these devices. To solve this problem, the interconnection of MATLAB and GAMS software is proposed, while using a master–slave methodology, with which a high-quality solution to this problem is achieved. In the master stage, the MATLAB software is used as a tool to program a discrete version of the sine–cosine algorithm (DSCA), which determines the locations where the PV generators are to be installed. In the slave stage, using one of the solvers of the GAMS software (BONMIN) with the known locations of the PV generators, the MINLP model representing the problem to be studied is solved in order to find the value of the objective function and the nominal power of the PV generators. The numerical results achieved in the IEEE 33- and 69-node systems are compared with the mixed-integer conic programming model solution reported in the specialized literature, thus demonstrating the efficiency and robustness of the proposed optimization methodology.

1. Introduction

1.1. General Context

Due to the growing concern about global warming, mitigating the emission of polluting gases has become an important issue in recent years [1,2,3]. According to [4], for 2018, the amount of CO 2 emissions caused by electricity generation increased by 1.7%. It is for this reason that, in many countries, the integration of photovoltaic (PV) systems into the grid is being supported and carried out by both utilities and government agencies, which has led to a structural change for energy suppliers, opening up competition in the generation and distribution markets [5].
Additionally, the ability to collect solar energy and supply it in the form of electricity has become a reality thanks to the development of solar panels and power electronics-based converters [6,7]. Therefore, companies are looking for new technologies to provide their customers with energy quality and reliability, so that the consumer, as a competitive decentralized generator, can use PV systems for various purposes, as is the case of residential or commercial use, seeking to supply a generated demand [6]. This allows consumers to take advantage of the solar resource to supply their own demand and thereby save money.
One of the main advantages of implementing PV generators in distribution power systems is that they can improve the network voltage profiles, reduce the branch load level, and provide environmental benefits by reducing pollutant gas emissions if adequate planning and operation strategies are implemented [8]. Otherwise, the high integration of PV systems in distribution networks can generate problems with regard to the network’s operating limits, as mentioned in [9], which causes a poor energy dispatch and may imply economic penalties for not complying with operation restrictions. Therefore, one of the main challenges that arise when integrating PV systems into electrical systems is to correctly determine their best location and optimal size, as the technical-operating status of the electrical system can be seriously compromised with an inadequate integration of these devices [10]. Consequently, the PV generator integration problem is part of the mixed-integer nonlinear linear programming (MINLP) family of models, which includes other planning problems for the expansion of distribution networks, such as the optimal reconfiguration of distribution networks, the selection of the optimal conductor size, and the location and sizing of existing and new substations, among others.

1.2. Literature Review

Some works have addressed the problem of integrating distributed energy resources into distribution networks for multi-period scenarios. The authors of [11] used multi-period planning for the integration of multiple energy resources in microgrids, aiming for the minimization of investment and grid operation costs for all periods. The authors of [10] proposed the integration of batteries and distributed generators based mainly on renewable energy sources at medium and low voltages. The problem was decoupled into two stages. First, a heuristic simulation-based algorithm defined the placement of the distributed energy resources, and the solution of the mixed-integer linear programming model defined their optimal daily outputs, which, together with test systems consisting of 11, 135, and 230 buses, demonstrated the effectiveness of the proposed approach in comparison with conic programming models. The authors of [12] studied the problem regarding the optimal siting and sizing of air-based energy sources in distribution and transmission networks. This problem was represented through an MINLP model, which was solved through the GAMS specialized software. Their main contribution was the discovery of the capabilities of the reactive component of wind generator power to minimize the grid energy losses. The main issue with this study is that the authors did not consider any costs in the objective function, which implies that the systems may be oversized. The same concept was extended to high-voltage transmission networks in [13] by considering PV generators with dynamic apparent power capacities. The exact MINLP model was also solved in the GAMS environment. However, the investment and operating costs of renewable energies were not taken into account. The study by [14] proposed a convex optimization model based on second-order conic programming to minimize, through the integration of PV sources, the total greenhouse gas emissions of distribution networks in rural areas. With the proposed optimization approach, the search for the global optimum could be ensured. However, the authors did not include economics in the optimal sizing problem, and, as a consequence, it was not possible to apply this approach to real life. In light of the above, the main contributions of this research are the formulation of a MINLP model that formulates the optimal siting problem by minimizing the total costs of energy acquisition at the compensator node, as well as those associated with PV generator investment and operating costs, for a planning horizon of 20 years.
Similarly, PV panels, given their characteristics, can improve the voltage profiles of the power supply and reduce the load level of the branches. In addition, thanks to the use of the solar resource as a source of energy, no greenhouse gas emissions are generated when producing electricity [8]. Therefore, a large number of PV generators have been installed in distribution networks around the world, implying that the number of PV systems in distribution networks should increase and be comparable to the output of the main source. In this case, PV systems could have serious implications for important technical aspects, such as the quality of power supplied to customers by power utilities, operational protection systems, and the islanding of PV systems [15,16]. In practice, utility regulations dictate that, if the output is greater than 10% of power, PV systems must operate with a power factor greater than 0.85 (supply or return). In some cases, voltage compensation systems may be operated outside this limit with the consent of the utility company. To determine if the PV array has a significant impact on the supply voltage, the size and location of the PV array must be considered. This means that the voltage quality, influenced by the large number and location of grid-connected PV systems, becomes an important issue. This paper summarizes the results of a large number of random PV array installations in order to provide useful guidance for the future implementations of PV arrays in distribution systems. Therefore, within the framework of research on distribution networks, there are multiple methods and/or possible solutions to the problem regarding the optimal placement and sizing of photovoltaic sources with different approaches, such as reducing power losses, improving voltage regulation, and minimizing operating costs, among others.
In 2012, ref. [17] presented the combination of genetic algorithms and particle swarm optimization with the objective of minimizing grid power losses, improving voltage regulation, and enhancing voltage stability with regard to system operation and safety constraints in radial distribution systems. In 2017, ref. [18] presented an approach towards symbiotic organism search in order to minimize active power loss. A year later, ref. [19] proposed the implementation of the population-based incremental learning algorithm, along with the use of particle swarm optimization to optimally locate distribution generators, and ref. [20] suggested the use of the artificial bee colony algorithm to minimize power distribution losses and improve voltage profiles. In 2019, ref. [21] presented a heuristic algorithmic approach aimed at the optimal allocation of distributed generation and capacitor banks, and ref. [22] followed a master–slave optimization approach with the constructive heuristic vortex search algorithm, which works upon the basis of a Gaussian distribution and a variable radius function in order to explore and exploit the solution space.
Then, in 2022, the authors of ref. [23] proposed a mixed-integer conic model (MIC), whose main contribution was to find the optimal global solution through the combination of the branch-and-cut method, which does not yield local optimal solutions, as is the case of other types of algorithms. In ref. [24], the annual operating costs of distribution networks were reduced by means of the discrete-continuous vortex search algorithm. Finally, the authors of ref. [25] located and sized PV systems by means of a generalized normal distribution optimization approach, and, in ref. [26], the location and sizing of PVs was carried out using a modified gradient-based metaheuristic optimizer.
Finally, the objective function of many of the aforementioned studies aimed at minimizing the total electrical energy losses, which can be easily modified into a multi-objective problem when the optimal location and sizing of dispersed generation systems is required. Therefore, many optimization algorithms were used to meet the multiple design objectives. Furthermore, multi-objective algorithms can be divided into classical [27] and artificial intelligence algorithms. Classical algorithms include several approaches, such as the analytical one [28], which uses the iterative Newton–Raphson method for solving the load flow problem; linear programming [29] in order to minimize the cost of energy sales according to the existing demand and maximize the benefit of customers who have distributed generation; dynamic programming [30], which seeks to minimize distributed generation curtailment and load disconnection, considering the current and future cost of energy, the uncertainty of distributed generation, the reconfiguration of the grid, and the reduction of distributed generation; and the exhaustive search technique [31], with which all possible inputs of an objective function are evaluated in order to determine the best input; even though the process is not efficient, it is reliable when it comes to arriving at the result. However, artificial and hybrid intelligence algorithms perform better than classical ones. The superiority of the former stems from their ability to find better optimal solutions at the cost of complexity. Many proposals have addressed dispersed generation planning using various artificial intelligence algorithms, such as ant colony search [32], the Monte Carlo algorithm [33], artificial bee colonies [34], and hybrid techniques [35]. The Jaya algorithm is among the intelligent algorithms proposed by Rao and published in 2016 [36]. This algorithm aims for victory in finding the best solution, hence the name Jaya (a Sanskrit word meaning victory). The authors of [37] used a modified version of the crow search algorithm, adapting it into a discrete–continuous form for the location and sizing of PV systems in distribution networks. So far, this has been the study that has yielded the best results regarding the reduction of power purchasing, investment, and operation and maintenance costs associated with PV systems. Here, the proposed methodology is modified and implemented in order to estimate the optimal capacities and the best locations for very high-penetration PV systems.
A summary of the algorithms that have been implemented, along with their year of publication, can be found in Table 1.

1.3. Motivation, Contributions, and Scope

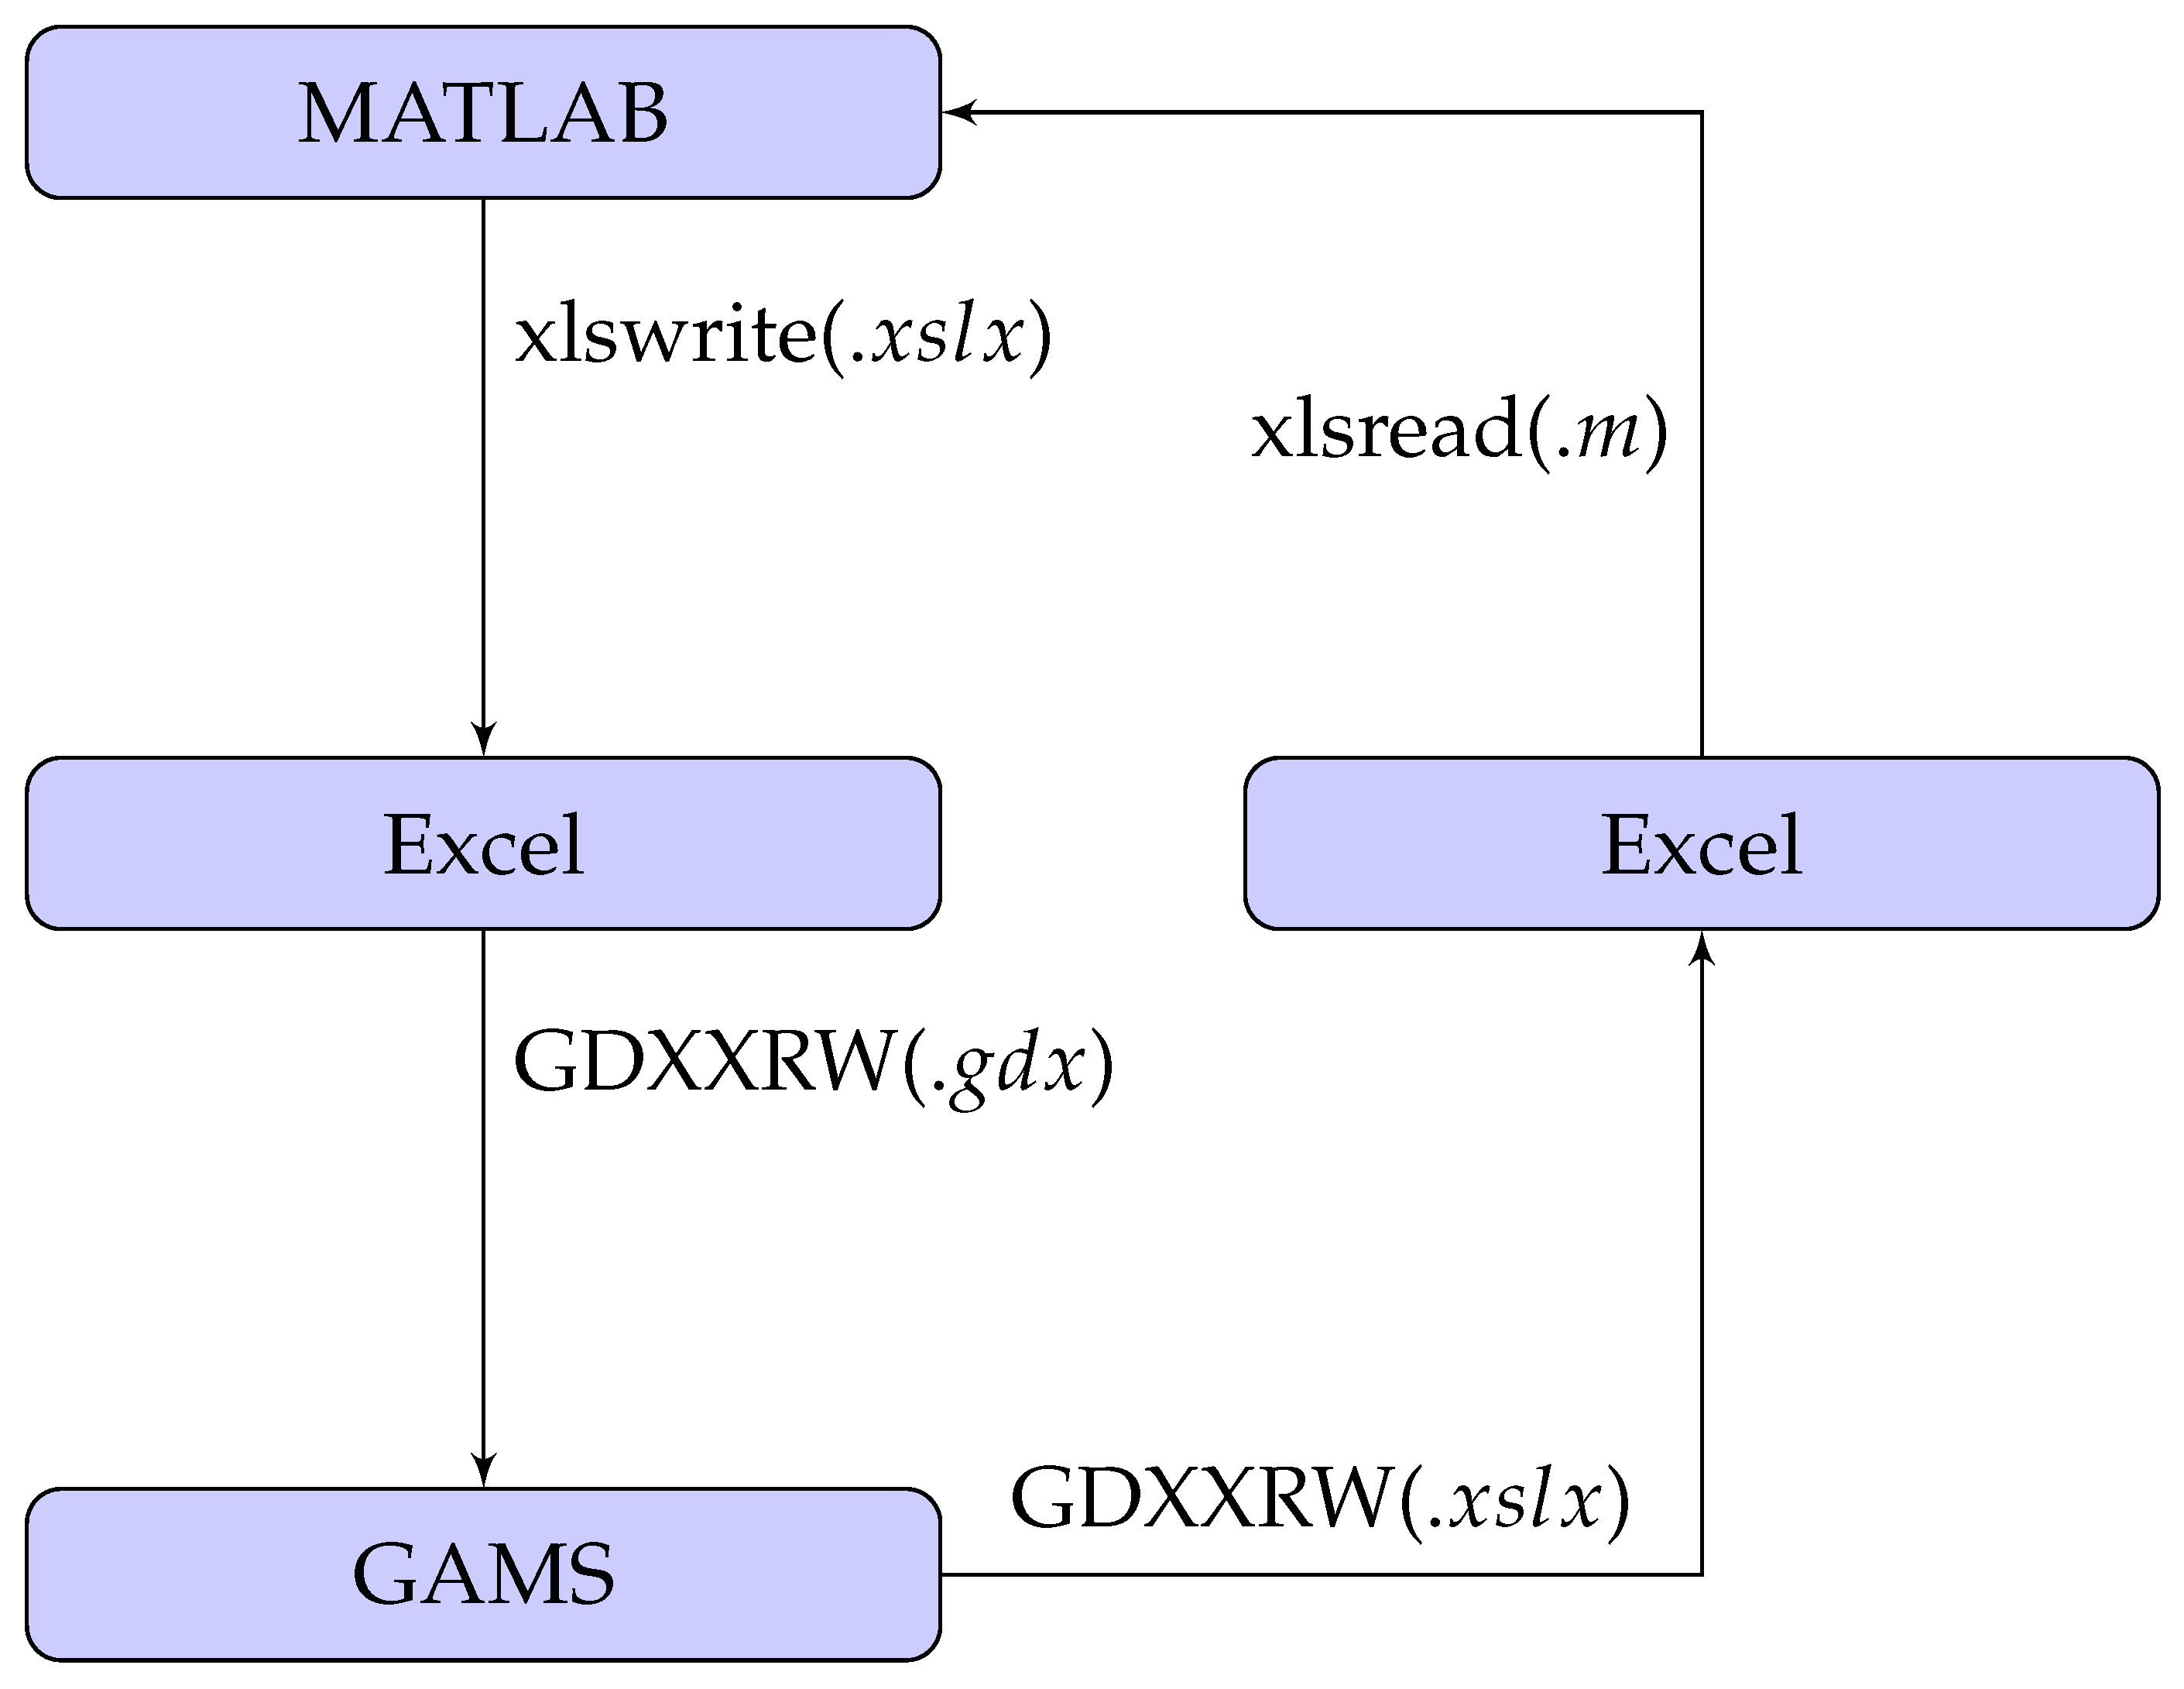
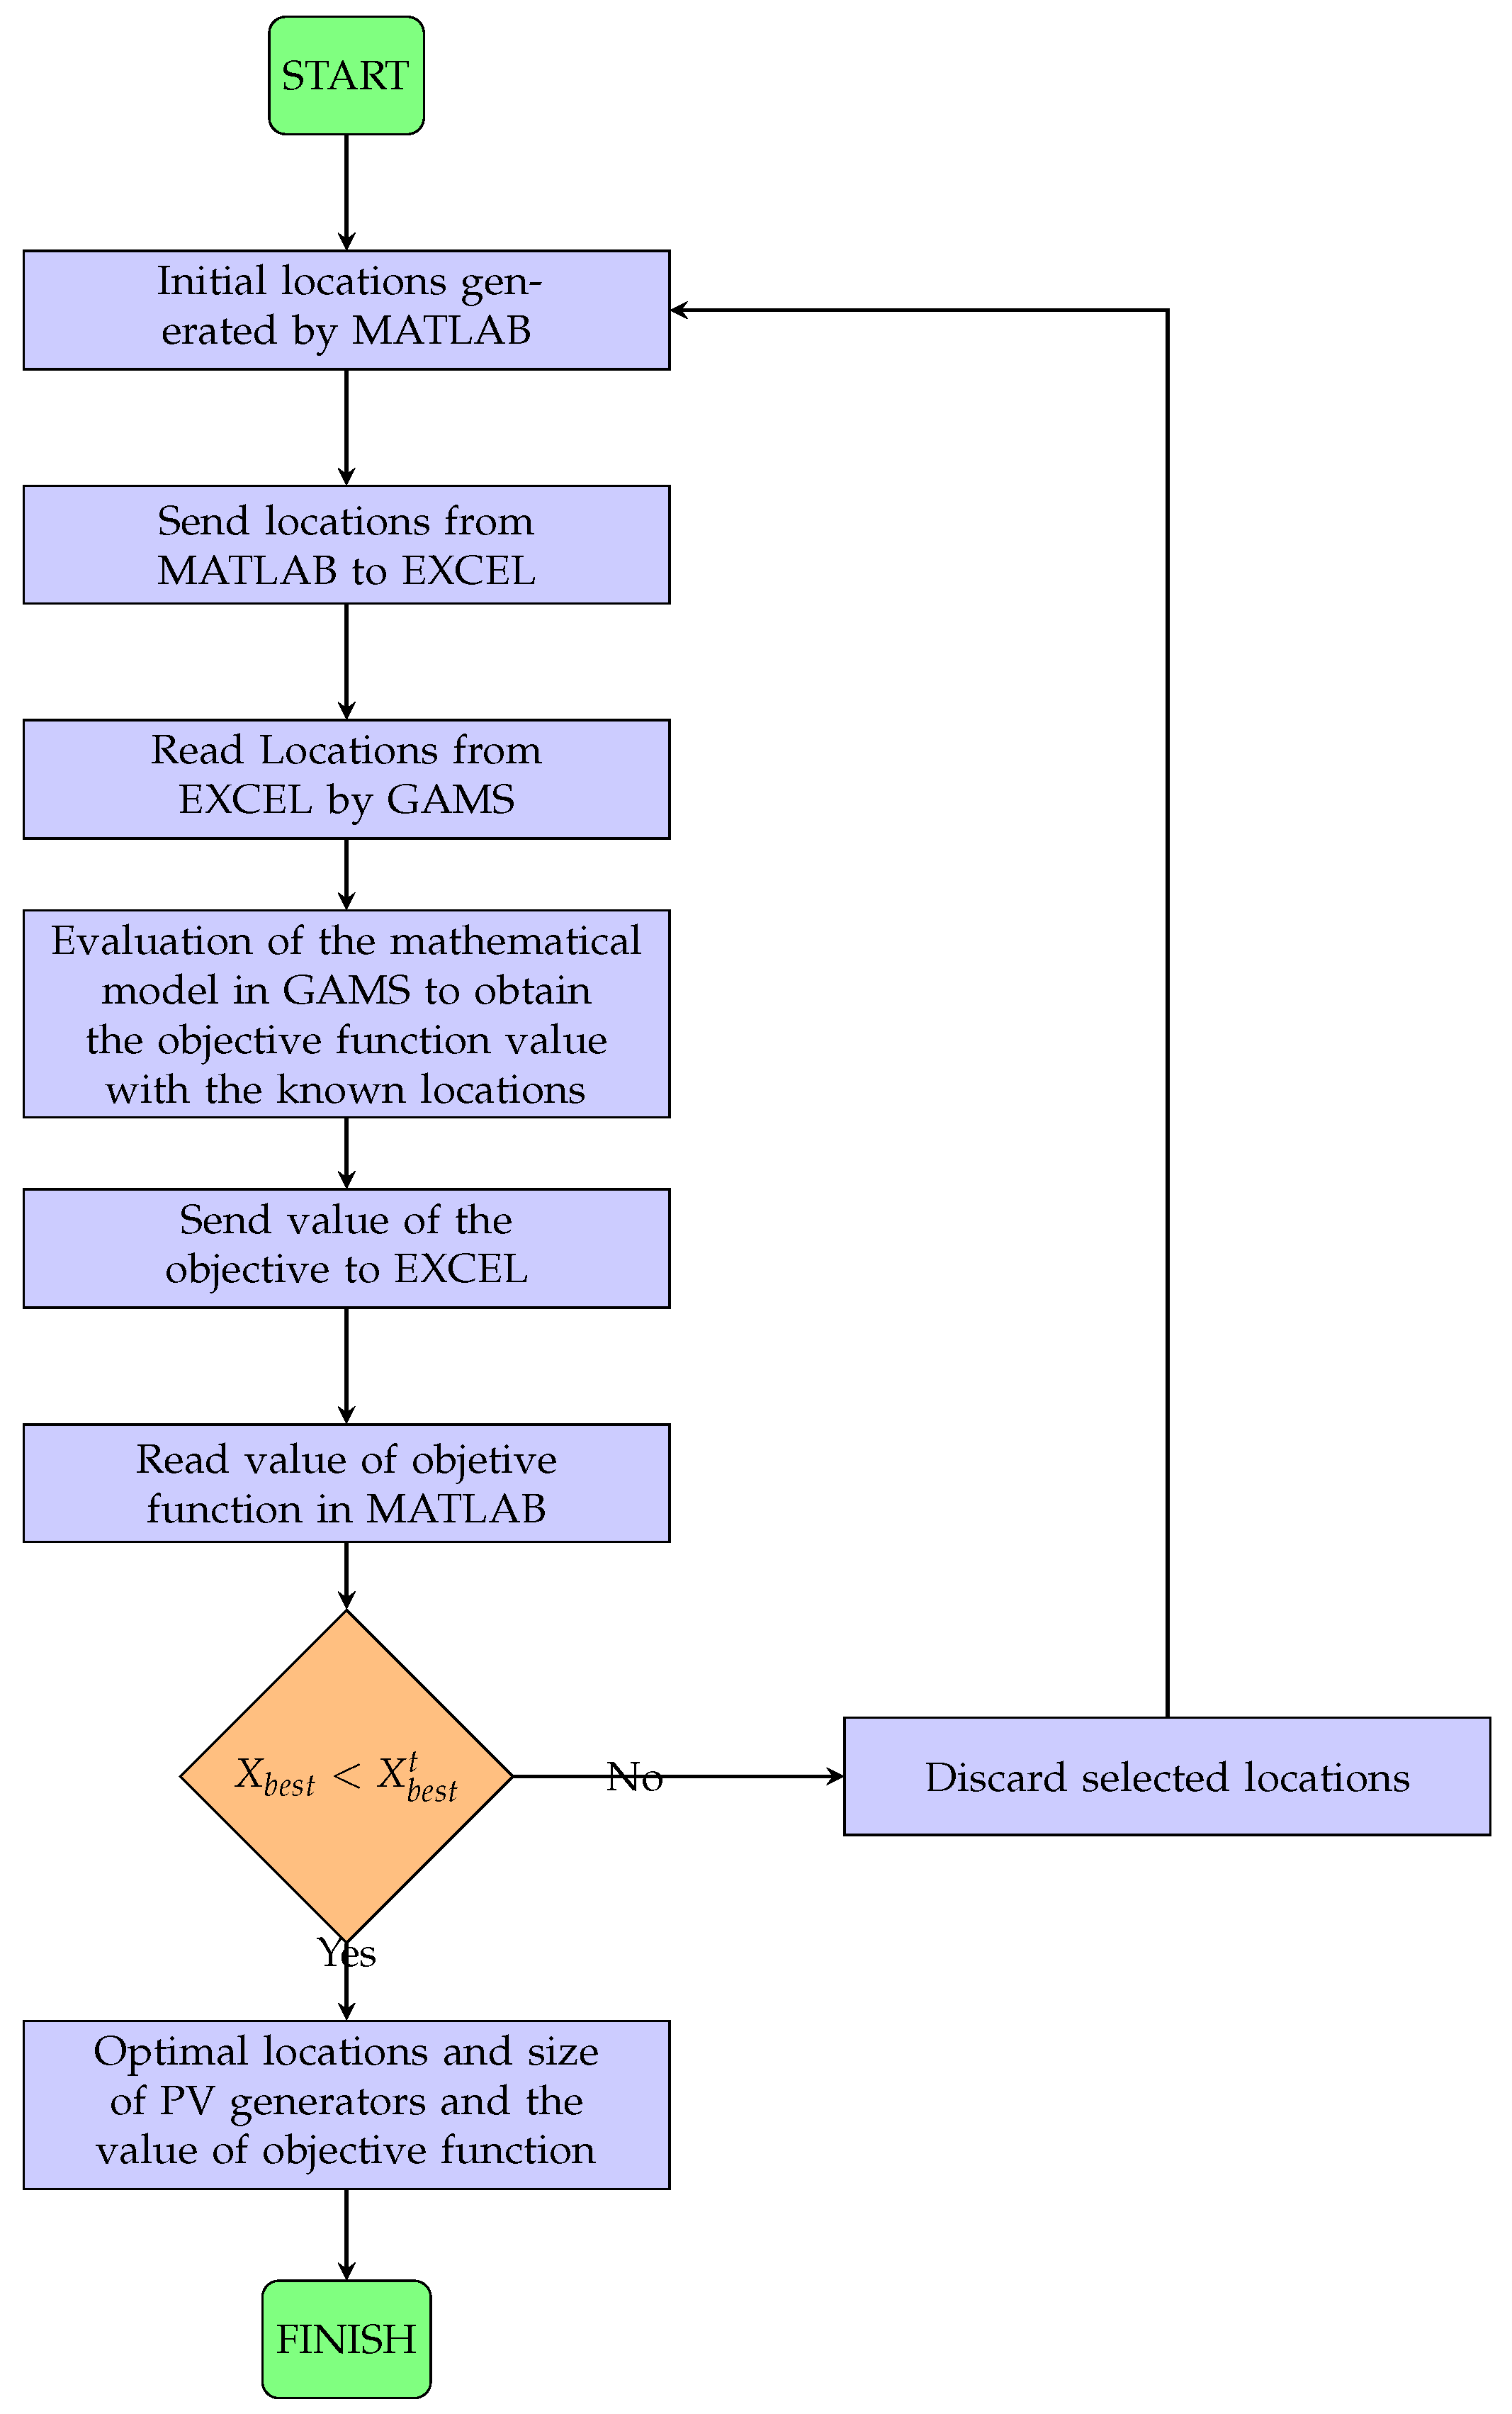
In order to find a strategy for reducing the time and computational resources required to perform an optimization process, this study proposes the communication between two specialized software applications in order to achieve the best locally optimal solution. As evidenced above, different optimization methodologies have been implemented which allow obtaining a solution to the problem regarding the location and sizing of PV generators in distribution systems. However, most of these solutions can get stuck in local optima, which is why this paper proposes an optimization methodology that interconnects the interfaces of MATLAB and GAMS through a master–slave methodology, with the aim to solve the problem under study. The main advantage of this methodology is that it allows said problem to be divided by stages in order to find a high-quality solution. The master stage was programmed in MATLAB, where the discrete version of the sine–cosine algorithm was used to determine the location of the PV generators. In addition, in the GAMS software, using the BONMIN solver and the locations proposed in the master stage, the mathematical model that represents the problem is solved, thus finding the optimal size of the PV generators and an objective function value that respects all the technical-operating conditions of the system. The main contributions of this research are:
i.
A complete description of the mathematical formulation representing the problem of the siting and sizing of PV generators in distribution networks while considering the deactivation of maximum power point tracking.
ii.
A new optimization methodology based on the interconnection of MATLAB and GAMS that allows finding the best locally optimal solution to the problem under study.
iii.
A new master–slave methodology to solve the mathematical model representing the problem under study. In the master stage, the MATLAB software is used as a tool to develop the discrete version of the sine–cosine algorithm, with the aim to determine the locations of the PV generators. Then, in the slave stage, GAMS is used to solve the MINLP model that represents the studied problem, thus yielding the objective function value and the necessary nominal power to be generated by the PV systems.
It is worth mentioning that this research identifies, as an opportunity for research, the possibility of exploiting the advantages of combinatorial optimization methods in order to solve optimization problems with discrete variables, as is the case of the sine–cosine algorithm and its implementation in the MATLAB software, with the effectiveness and robustness exhibited by the nonlinear programming tools available in the GAMS software. This, in order to obtain an efficient solution methodology that allows the improvement of the reported results regarding the optimal placement and sizing of PV generation units in AC distribution grids. Note that the numerical results of this research will be regarded as the new reference for the studied problem for future research focusing on the area of renewable generation and its applications for electrical distribution networks.

1.4. Document Structure

This research paper has the following structure. Section 2 presents the mathematical formulation associated with the problem of integrating PV systems in distribution grids, whose objective function is to minimize the total annual operating costs. The proposed MATLAB–GAMS interface is presented in Section 3. This interface uses a master–slave methodology that combines the DSCA and the BONMIN solver. Section 4 presents the main specifications of the 33- and 69-node test systems, the behavior of the generation and demand curves used, and the constraints to be observed in order to find a value that satisfies the objective function. Section 5 discusses on the results achieved for the analyzed problem and the convergence analysis of the proposed methodology. Finally, Section 6 presents the conclusions of this study and future lines of research.

2. Mathematical Formulation

The mathematical formulation is divided into three sections in order to better explain each of the stages of the problem. The first section deals with the formulation of the objective function, the second section shows each of the model’s constraints, and the third section describes and elaborates on each constraint.

2.1. Formulating Objective Function

To solve the optimization problem, an objective function Z minimizes the electric system’s total annual operating costs. To this effect, the power purchasing costs at the substation node ( f 1 ), the investment necessary to acquire the PV generators ( f 2 ), and the costs associated with the operation and maintenance of these generators ( f 3 ) are taken into account. The objective function, as well as each of its component functions, is presented from (1)–(4).
min Z c o s t = f 1 + f 2 + f 3 ,
f 1 = C k W h T t a 1 1 + t a N t h H i N P i , h g c Δ h t T 1 + t e 1 + t a t ,
f 2 = C p v T t a 1 1 + t a N t i N P i p v ,
f 3 = C O & M T h H i N P i , h p v Δ h ,
Here, Z c o s t represents the total annual operating cost of the distribution network. f 1 is the part of the objective function that models the annualized cost of purchasing power at the substation node terminals. f 2 is the part of the objective function that accounts for the annualized investment costs of the PV generation sources. f 3 is the component of the objective function that models the operating and maintenance costs of the PV generation sources. C k W h refers to the cost of purchasing energy in the spot market. T is the number of days in a year (i.e., 365 days). t a is the expected rate of return for the investments made within the planning project. N t is the number of periods considered in the planning horizon. Δ h is the duration for which the electricity variables are assumed to be constant. t e is the expected percentage increase of the cost of purchasing power over the planning horizon. C p v shows the average cost of one kW of installed power from a PV generation source. C O & M represents the cost of operating and maintaining the PV generation sources. Finally, N , H , and T are the sets containing all of the network nodes, periods, and years of the planning horizon, respectively.

2.2. Set of Constraints

To solve this problem, the objective function must be bounded by the technical-operating constraints that model the operation of an electrical system within a PV generation environment. This type of constraint includes the reactive and active power balances, the voltage regulation limits of the nodes, and the limits regarding the power that can be delivered by the generators, among others.
P i , h g c P i , h d + P i , h p v = V i , h j N Y i , j V j , h cos θ i , h θ j , h φ i , j , i N , h H ,
Q i , h g c Q i , h d = V i , h j N Y i , j V j , h sin θ i , h θ j , h φ i , j , i N , h H ,
P i g c , min P i , h g c P i g c , max , i N , h H ,
Q i g c , min Q i , h g c Q i g c , max , i N , h H ,
x i P i p v , min P i p v x i P i p v , max , k N ,
P i p v , min P i , h p v P i p v G h p v , i N , h H ,
V i min V i , h V i max , i N , h H ,
i N x i N p v a v a ,
x i 0 , 1 , i N ,
Here, P i g c , min is the active power of a conventional generator located at i in period h. P i , h d is the active power demanded at node i in period of time h. P i , h p v is the active power generated by a PV generation source located at node i in period h. Q i , h g c is the reactive power of a conventional generator located at node i in period h. Q i , h d is the reactive power demanded at node i in time period h. G h p v is the expected solar generation curve in the catchment area where the distribution network is located. x i is a binary variable representing the location of the PV generation source (i.e., 1 if connected or 0 if not connected). V i , h and V j , h are the voltage magnitudes at nodes i and j during time period h, respectively, while Y i j is the magnitude of the admittance relating nodes i and j, which has an angle v a r p h i i , j . θ i , h , and θ j , h are the angles of the voltages at nodes i and j during time period h, respectively. V i m i n , V i m a x are the lower and upper voltage limits for each node i. P i p v , min and P i p v , max are the lower and upper power limits that can be delivered by a PV generation source located at node i. P i g c , min and P i g c , max are the lower and upper values of active power delivered by the conventional generator located at node i. Q i g c , m i n and Q i g c , m a x are the lower and upper values of reactive power supplied by the conventional generator located at node i. Finally, N p v is the constant associated with the number of distributed generators in the system.

2.3. Model Interpretation

The interpretation of the MINLP model described in Equations (1)–(13), the following is as follows. Equation (1) describes the total costs for a year of operation of the distribution network. This comprises Equation (2), which represents the annual energy purchasing costs at the terminals of the conventional generation nodes; Equation (3), which expresses the installation costs of the PV generation sources, considering a rate of return and bringing it to the current year by employing annuity; and Equation (4), which represents the operation and maintenance costs of the PV generation system, based on the power generated and the number of hours in which it delivers energy to the grid. As for the problem’s constraints, the active and reactive power balance are defined in Equations (5) and (6), respectively. These equations must be fulfilled in a distribution system that has PV panels as its power supply source. Given their nature, these equations behave in a nonlinear and non-convex way. Box constraints (7) and (8) limit the power delivered by the conventional generator within a predetermined range. Inequality (9) allows knowing the location of the PV generator within the network using a binary variable (i.e., decision variable), which can take values of 0 or 1, according to Equation (13), so, if its value is 0, it means that the PV generator is not located at node i; if it is 1, the PV generator is located at node i. Inequality (10) allows PV generation sources to disable maximum power-point tracking in order to maintain the power balance in all periods. Box constraint (11) sets the voltage regulation limits for each node in the system. Finally, inequality (12) states that the number of PV systems in the network cannot be greater than the number available for installation.

3. Proposed Hybrid Optimization Approach

A master–slave methodology is employed to solve the problem regarding the location and optimal sizing of PV generation sources in distribution systems, which interconnects the interfaces of MATLAB and GAMS as the basis of operation. In the master stage, the MATLAB implementation of a discrete version of the DSCA is proposed. The DSCA is in charge of defining the locations where the available PV generation sources will be installed. On the other hand, in the slave stage, the GAMS software (with the known locations) determines the nominal power of each PV generation source. Similarly, the slave stage evaluates the constraints associated with the problem, which are defined in Equations (5)–(13), in order to determine the value of the objective function (Equation (1)).

3.1. Master Stage: DSCA

The DSCA is a metaheuristic optimization technique that explores and exploits the solution space by using sine and cosine trigonometric functions, which vary in amplitude as the iterations progress [44]. The SCA has been applied in different fields of power systems. In [45], the SCA was used to determine the optimal power flow in order to solve multi-objective problems containing variables such as generation costs, power losses, CO2 emissions, and voltage profiles, among others. The authors of [46] used the SCA in order to optimize the reactive power generated in power systems integrating a distributed generator, employing the IEEE 14-node test system. In [47], an automatic generation control was implemented, using the SCA to determine the gains of a PID controller to be applied in hydrothermal generators.
One of the main characteristics of the DSCA is that it is a population-based optimization technique, i.e., the optimization process starts with a set of random solutions. This set is repeatedly evaluated by an objective function and improved by applying a set of evolutionary rules, which will be shown below.

3.2. Initial Population

The initial population of individuals in the DSCA takes the structure shown in (14):
X t = X 11 t X 12 t X 1 N v t X 21 t X 22 t X 2 N v t X N i 1 t X N i 2 t X N i , N v t
where X t is the population of individuals at iteration t, N i is the number of individuals that make up the population, and N v is the number of variables or the dimension of the solution space. For this research paper, this denotes the number of PV generation sources to be installed in the electric system (i.e., N p v a v a ). To create the initial population of individuals, Equation (15) is used, which generates a matrix of discrete random numbers within the lower and upper bounds defined for the problem regarding the location of each PV generation source.
X 0 = r o u n d ( y min o n e s ( N i , N v ) + ( y max y min ) r a n d ( N i , N v ) )
Here, o n e s ( N i , N v ) is a matrix of ones. r a n d ( N i , N v ) is a matrix of random numbers between 0 and 1 generated by a uniform distribution. r o u n d ( ) is a function that rounds each population element to the nearest integer. Finally, y min and y max are vectors representing the maximum and minimum bounds of the decision variables associated with the location of PV systems at the demand nodes.
Finally, each individual in the population is evaluated with regard to the objective function through the slave stage, and the best solution is selected as the best individual found so far (i.e., X b e s t t ).

3.3. Evolution Criteria

The DSCA was designed to evolve by considering a simple sine–cosine rule, where there is a 50% probability of evolving with the sine function and 50% of evolving with the cosine function, as shown in (16) [44]. With this equation, starting from X b e s t t , it is possible to generate new individuals P i t + 1 .
P i t + 1 = r o u n d ( X i t + r 2 sin r 3 r 4 X b e s t t X i t ) if r 1 < 0.5 r o u n d ( X i t + r 2 cos r 3 r 4 X b e s t t X i t ) if r 1 0.5
where P i t + 1 is the individual resulting from the application of the evolution criterion and represents a possible solution that can replace X i t ; the parameter r 1 is a random number between 0 and 1, which guarantees the equality of commutations between the trigonometric sine and cosine functions [48]; the parameter r 2 is a variable responsible for determining the point to which the resulting new individual [48] should be moved in the solution space, near the best solution X b e s t t , as shown in r 2 .
r 2 = a t a t max
where t is the current iteration, t max is the maximum number of iterations, and a is a constant, which takes a value of 2 in this paper, as recommended in [48]. Moreover, r 3 is a random number between 0 and 2 π which is responsible for determining how far or how close the new potential solution moves with respect to the current best solution [48]. Finally, r 4 is a random number between 0 and 1.

3.4. Updating the Individuals

Finally, an individual X i t from the current population is replaced if and only if the result of the objective function of a potential individual P i t + 1 is lower (i.e., minimization problem); otherwise, this individual remains in the population. Such behavior is evident in (18).
X i t + 1 = P i t + 1 if F ( P i t + 1 ) < F ( X i t ) X i t + 1 otherwise
where F ( · ) represents the evaluation of an individual’s objective function in the slave stage. Once the individuals in the population are updated, the best individual in the new population X t + 1 is taken as X b e s t .
Algorithm 1 summarizes the implementation of the DSCA to solve the PV generation source location problem.
Algorithm 1: Sine–cosine algorithm to solve the problem regarding the siting and sizing of PV generation sources [49].
Resources 12 00035 i001

3.5. Slave Stage: GAMS

GAMS is a specialized software that models real-world optimization problems in a simple programming language [50]. This software allows solving linear, nonlinear, and mixed-integer optimization problems (linear and nonlinear), finding solutions of excellent quality, with reduced processing times and low standard deviations. Sometimes, it can even find the optimal solutions of the problem [50]. This tool provides the user with an interface in which the mathematical model of a problem can be entered in a simple way, it has several solvers for the user to choose, and it shows the behavior of the model and the resulting variables.
The purpose of the slave stage, executed by GAMS, is to evaluate the optimization model based on the locations generated by the DSCA, in order to determine the dimensions of each PV generator and, with these two parameters, to evaluate the objective function in compliance with the restrictions outlined in Section 2. After this process, GAMS delivers the total cost associated with the objective function, and this value is sent to MATLAB as an input parameter in the execution of the DCSA.

3.6. Interface Connection

To interconnect both interfaces, it is necessary to consider the file compatibility of both programs [51]. In this regard, the Excel software is used as an intermediary to ensure an effective exchange of information between MATLAB and GAMS. Thus, the interfaces are interconnected via . x l s x files, through which the data necessary for the evaluation of the MINLP model defined in Section 2 are sent and received. However, as shown in Figure 1, it is necessary to use a function that allows for the reading and writing of these files in the software, as mentioned earlier.
In the case of the GAMS software, the GDXXRW function is used, which allows for the reading and writing of Excel spreadsheets [52]. This function allows creating a . g d x file for reading multiple data ranges in . x s l x format in the GAMS software. Reciprocally, this function allows writing data from the GAMS software into a . x s l x file for further processing in Excel. In the case of MATLAB, the xlswrite and xlsread functions are used. The former allows writing data with a . m extension in . x l s x files, which is used to write the locations of the PV generators; and the latter allows reading the . x l s x file within MATLAB. This function is used to read the value of the objective function resulting from the evaluation in GAMS.
Finally, a summary of the proposed methodology is presented in Figure 2. This figure represents the work cycle upon which the implemented methodology is based. MATLAB is entrusted with evaluating the objective function associated with the total costs (as described in Equation (1)) within the DSCA algorithm, generating a set of initial PV generator locations, which are then sent to Excel to be later read by GAMS. Afterwards, the locations are evaluated, considering all constraints regarding the number of generators, optimal power flow, and power balance. Finally, the size of the generators and the new value of the objective function are obtained. The latter is sent to an Excel file to be read by MATLAB, which restarts the process and evaluates the number of predetermined iterations.
One of the advantages of this information exchange is that it allows for the connection between both interfaces, with the ability to execute . x l s x and . c s v files, which allows processing large amounts of data in reduced computation times. However, it should be noted that the GDXXRW function is only available for devices with a Windows operating system [52].

4. Test Systems

This section presents the test systems used to validate the MATLAB-GAMS interface developed within the framework of a master–slave operation scheme. The electrical systems correspond to the IEEE 33- and 69-node test feeders with a radial topology. The main technical specifications of each test system are shown below.

4.1. First Test Feeder: IEEE 33-Node

This test feeder consists of 33 nodes and 32 lines, and it was initially proposed in [53]. The substation node or slack node is located at node 1 and has a nominal voltage of 12.66 kV. Its electrical diagram is shown in Figure 3a. In addition, the electrical parameters (i.e., the impedance of the distribution lines and complex power consumption at the demand nodes) can be consulted in in [54].

4.2. Second Test Feeder: IEEE 69-Node

The IEEE 69-node test feeder has 69 nodes and 68 distribution lines. It was initially proposed in [55]. The substation node is located at node 1 and operates at a nominal voltage of 12.66 kV. Figure 3b shows the network configuration diagram. The electrical parameters of this test system are specified in [54].

4.3. Additional Parametric Information

To find the value of the objective function defined in Equation (1), the parametric information shown in Table 2 is used [56,57].
Additionally, as input for the MINLP model, this study takes the typical generation and demand behavior curves for an average day in the city of Medellín, Colombia, as shown in Figure 4 [58].

5. Numerical Results and Simulations

This section presents the numerical results, validations, analysis, and discussions derived from applying the proposed methodology to solve the problem regarding the location and sizing of PV generation sources in the two test systems selected for this study. All numerical simulations were performed by interfacing MATLAB version 2020b and GAMS on a computer with an Intel(R) Core(TM) i5-8260 processor CPU@2.40Ghz, 12 GB of RAM, and a 64-bit Windows 10 Home operating system.
To demonstrate the effectiveness of the proposed master–slave optimization methodology, i.e., the DSCA (MATLAB) in the master stage and the BONMIN solver (GAMS) in the slave stage, to solve the studied problem, the results are compared with those obtained in [23]. The cited paper is the most recent research that performs a conic relaxation of the MINLP model presented in Section 2, obtaining a mixed integer conic programming model (MIC b e t a ), with β being a parameter that controls the value of the objective function and can take values of 0, 1 / 2 , and 1. Note that both methodologies solve the problem of siting and sizing PV generation sources by not following the PV generation curve (Figure 5), i.e., the PV generators, depending on the system’s power conditions, will not always inject their maximum capacity. In addition, numerical comparisons with literature reports based on combinatorial optimization methods are also included. The methods used for comparison are the discrete-continuous versions of the vortex search algorithm (DCVSA), the generalized normal distribution optimizer (DCGNDO), and the crow search algorithm (DCCSA) [37].

5.1. Numerical Results for IEEE 33-Node Test System

Table 3 shows the results of the DCSA-BONMIN and MIC β master–slave methodology in the IEEE 33-node test system. The information is presented as follows: the methodology; the location where the PV generators are installed, along with their nominal powers; and the percentage of reduction obtained by each methodology with respect to the benchmark case.
Based on Table 3, the following remarks can be made. (i) The best solution obtained for this problem so far was found by M I C 1 , with a total annual operating cost of USD/year 2,597,139.00. In addition, the worst solution was found by M I C 0 , with a total annual operating cost of USD/year 2,603,465.00. (ii) The proposed methodology finds the best solution, achieving a decrease of 1,103,324.12 USD/year with respect to the baseline case, which confirms that the overall optimal cost solution for the 33-node test system is 2,597,131.26 USD/year and is obtained by locating the PV generators at nodes 14, 24, and 30, with an installed power capacity of 5.0736 MWp. (iii) The DSCA-BONMIN approach offers better performance in the objective function regarding the comparison methodologies, with reductions of USD 6333.74/year with respect to M I C 0 , USD/year 151.74 with respect to M I C 1 / 2 , and USD/year 7.74 with respect to M I C 1 . (iv) The methodologies used to determine the placement and sizing of PV generators allow for reductions of more than 29% with respect to the benchmark case, with DSCA-BONMIN being the methodology that achieves the most significant reduction (29.8159%). By comparing this proposal to the alternative solution methodologies, a decrease in the annual operating costs of approximately 0.1712% compared to M I C 0 can be observed, as well as 0.0041% compared to M I C 1 / 2 and 0.0002% compared to M I C 1 .

5.2. Comparison with Metaheuristics—IEEE 33-Node Test System

Table 4 shows the best results obtained by the metaheuristic algorithms, which are compared to those of the proposed methodology.
In order to compare the results of the proposed approach with respect to methodologies that have implemented metaheuristic algorithms, the results of the DCCSA algorithm [37] were taken as a reference, since they have so far reported the greatest cost reduction, considering that the methodologies proposed in the research of the DCCSA algorithm have the restriction of delivering the maximum energy produced by the PV panels (MPPT) to the entire electrical power system.
In addition, our proposal is compared against other algorithms such as the DCVSA [24] and the DCGNDO [25]. It can be observed that the DCVSA entails an improvement of 27.0424% with respect to the base case, and a difference of 2.7776% with respect to the DSCA-BONMIN methodology, which represents a total cost of 102,630.45 USD/year. With respect to the DCGNDO and DCCSA, although the locations and sizing proposed in these two algorithms are very similar, the DSCA-BONMIN methodology implies improvements of 2.7764 and 2.7751%, which represents an economic value of 102,340.5 USD/year.

5.3. Numerical Results for IEEE 69-Node Test System

Regarding the 69-bus system, Table 5 shows the values obtained by the DSCA-BONMIN and MIC methodologies for comparison purposes. It contains data similar to that in Table 3.
According to the results shown in Table 1, it is possible to state the following. (i) The solutions with the lowest reductions are M I C 1 / 2 and M I C 1 , which minimize the total costs up to USD/year 2,721,282. (ii) With the DSCA-BONMIN methodology, a better solution can be obtained which reduces the total costs by USD/year 1,157,492.30, locating the PV generators at nodes 8, 17, and 61, with a total installed power of 53,013 MWp. (iii) Regarding M I C 0 , M I C 1 / 2 and M I C 1 , DSCA-BONMIN achieved reductions of USD/year 31,313.37, USD/year 574.37, and USD/year 574.37, respectively. (iv) With the methodologies that have been proposed for siting and sizing PV generators in distribution systems, a reduction of around 29% with respect to the benchmark case was achieved. The proposed methodology obtained a reduction percentage of 29.8%. In comparison with the other methodologies shown in Table 1, DSCA-BONMIN outperforms M I C 0 by 0.8074%, M I C 1 / 2 by 0.0148%, and M I C 1 / 2 by 0.0148%.

5.4. Comparison with Metaheuristics—IEEE 69-Node Test System

Table 6 shows the best results obtained by some metaheuristic algorithms, which are compared against those of the proposed methodology for IEEE 69-bus test system
Following the same analysis described in Section 5.2, Table 6 shows a comparison of the results obtained by the proposed methodology with respect to the DCVSA, the DCGNDO, and the DCCSA. The DCVSA shows an improvement of 27.1502% with respect to the base case, and a difference of 2.6998% with respect to the DSCA-BONMIN methodology, which represents a total cost of 104,556.75 USD/year. With respect to the DCGNDO and the DCCSA, although the locations and sizing proposed in these two algorithms are very similar, the DSCA-BONMIN methodology shows an improvement of 2,6911%, which represents an economic value of 104,215.42 USD/year.

5.5. Convergence Analysis

To show the convergence behavior of the proposed DSCA-BONMIN approach in solving the problem studied herein, Figure 5 shows how the value of the objective function evolves as the number of iterations increases for the IEEE 33- and 69-bus systems.
Figure 5a,b show the convergence graph of the implemented methodology for the IEEE 33-node and 69-node test systems. It can be noted that the DSCA-BONMIN, in its first iteration, finds values of USD/year 2,598,423.07 for the 33-node system and USD/year 2,722,082.87 for the 69-node system. Around iteration 22, the DSCA-BONMIN finds the lowest objective function value for the 33-node system, whereas for the 69-node system, it finds the lowest value around iteration 26, which shows that the proposed methodology converges quickly to an efficient solution. The above confirms that the DSCA-BONMIN is an effective and robust tool to solve the problem regarding the location and sizing of PV generators in power distribution systems with the aim to reduce their annual operating costs. This makes the proposed methodology the best option when solving the problem under study in the IEEE 33- and 69-node test systems, achieving the best solution from an economic point of view while observing all of the system’s technical and operating constraints.

6. Conclusions and Future Works

This research paper proposes an optimization methodology based on the connection of the MATLAB and GAMS interfaces to solve the location and sizing problem of PV generators in distribution power grids. One of the main advantages of this methodology is that it allows solving both parts of the problem separately by means of a master–slave methodology while ensuring a high-quality solution. In the master stage, the DSCA, programmed in the MATLAB software, selects the best locations for the PV generators. In the slave stage, the GAMS software, via the BONMIN solver, is entrusted with solving the MINLP programming model, where, with the locations provided by the master stage, all of the mathematical model’s constraints are evaluated, the nominal power of each PV generator is determined, and the value of the objective function is also evaluated. The objective function employed in this research is the minimization of the total annual operating costs of an electrical distribution system for a planning horizon of 20 years, which is composed of three parts: the cost of purchasing electrical energy at the terminals of the main generator or the substation node, the installation cost of the components required for the PV generation systems, and their operation and maintenance costs.
According to the numerical results obtained in the IEEE 33- and 69-node test systems, the proposed approach is robust, efficient, and practical when compared to the mixed integer conic programming model (MIC) reported in the specialized literature.
The main conclusions of this study are presented below:
  • For the proposed simulation scenario, the master–slave methodology, when compared to the base case, allows for reductions of approximately USD/year 1,103,324.12 and USD/year 1,157,492.3 in the IEEE 33- and 69-node test systems, respectively. These results constitute the highest reductions when solving the problem regarding the siting and sizing of PV generators, with values of 29.82% for the 33-node system and 29.85% for the 69-node grid. This means that the MATLAB-GAMS interface achieves a high-quality solution for the problem addressed in this research paper.
  • The proposed solution methodology succeeds in finding a high-quality solution to the problem, outperforming the solutions reported by the MIC in the specialized literature. The literature reports that the MIC solution ensures that the optimal global point is found via the interior-point method combined with the branch-and-cut optimization approach. However, the presence of binary variables increases the complexity of the problem, making it difficult to find the global optimum due to the approximations involved in the MIC approach. The above demonstrates that the proposed methodology is the best at solving problems that involve binary and continuous variables, as it separates the location problem from the sizing problem.
  • As seen in the convergence curve, the proposed methodology is independent of the number of nodes in the system under study. Due to the high complexity of the MINLP model, as the number of nodes in the system increases, the solution space becomes larger, and the chances of getting stuck in a locally optimal solution increase. However, it takes the proposed methodology about 22 and 26 iterations to find a high-quality solution for the IEEE 33- and 69-bus test systems, respectively. The above leads to the conclusion that the MATLAB-GAMS interface is the best choice for solving the problem regarding the location and sizing of PV generators in distribution power grids.
As future work, the following studies could be conducted: (i) using metaheuristic algorithms with a high numerical performance to solve the PV generator location problem, such as the vortex search algorithm, the ant lion optimizer, or the crow search algorithm, among others; (ii) using a multi-objective formulation to solve the studied problem from the economic, technical, and environmental points of view while observing the technical operating conditions of the system; and (iii) using the proposed methodology to solve the problem regarding the location and sizing of D-STATCOMs in distribution grids.

Author Contributions

Conceptualization, methodology, software, and writing—review and editing, D.S.G.-R., B.C.-C. and O.D.M. All authors have read and agreed to the published version of the manuscript.

Funding

This research received no external funding.

Institutional Review Board Statement

Not applicable.

Informed Consent Statement

Not applicable.

Data Availability Statement

Not applicable.

Acknowledgments

This work is derived from the undergraduate project titled Desarrollo de una interfaz MATLAB-GAMS para la resolución del problema de ubicación y dimensionamiento óptimo de fuentes fotovoltaicas en redes de distribución, submitted by David Steveen Guzmán Romero to the Electrical Engineering Program of the Department of Engineering of Universidad Distrital Francisco José de Caldas as a partial requirement for obtaining a Bachelor’s degree in Electrical Engineering.

Conflicts of Interest

The authors declare no conflict of interest.

References

  1. Beltrán-Telles, A.; Morera-Hernández, M.; López-Monteagudo, F.E.; Villela-Varela, R. Prospectiva de las energías eólica y solar fotovoltaica en la producción de energía eléctrica. CienciaUAT 2017, 11, 105–117. [Google Scholar] [CrossRef] [Green Version]
  2. Andrade-Castañeda, H.J.; Arteaga-Céspedes, C.C.; Segura-Madrigal, M.A. Emisión de gases de efecto invernadero por uso de combustibles fósiles en Ibagué, Tolima (Colombia). Cienc. Tecnol. Agropecu. 2017, 18, 103–112. [Google Scholar] [CrossRef] [Green Version]
  3. Wang, G.; Shi, R.; Cheng, W.; Gao, L.; Huang, X. Bibliometric Analysis for Carbon Neutrality with Hotspots, Frontiers, and Emerging Trends between 1991 and 2022. Int. J. Environ. Res. Public Health 2023, 20, 926. [Google Scholar] [CrossRef] [PubMed]
  4. Adib, R.; Zervos, A.; Eckhart, M.; El-Ashry, M.; Hales, D.; Hamilton, K.; Rae, P. Available online: https://www.ren21.net/wp-content/uploads/2019/05/gsr_2020_full_report_en.pdf (accessed on 5 January 2023).
  5. de la Ley, G.P.P.l.A.d.L.I.T. Invierta y Gane con Energía. Available online: https://www1.upme.gov.co/Documents/Cartilla_IGE_Incentivos_Tributarios_Ley1715.pdf (accessed on 5 January 2023).
  6. Srisaen, N.; Sangswang, A. Effects of PV grid-connected system location on a distribution system. In Proceedings of the APCCAS 2006-2006 IEEE Asia Pacific Conference on Circuits and Systems, Singapore, 4–7 December 2006; IEEE: Piscataway, NJ, USA, 2006; pp. 852–855. [Google Scholar]
  7. Tan, W.H.; Mohamad-Saleh, J. Critical Review on Interrelationship of Electro-Devices in PV Solar Systems with Their Evolution and Future Prospects for MPPT Applications. Energies 2023, 16, 850. [Google Scholar] [CrossRef]
  8. Hoff, T.; Shugar, D.S. The value of grid-support photovoltaics in reducing distribution system losses. IEEE Trans. Energy Convers. 1995, 10, 569–576. [Google Scholar] [CrossRef]
  9. Iria, J.; Scott, P.; Attarha, A.; Gordon, D.; Franklin, E. MV-LV network-secure bidding optimisation of an aggregator of prosumers in real-time energy and reserve markets. Energy 2022, 242, 122962. [Google Scholar] [CrossRef]
  10. Valencia, A.; Hincapie, R.A.; Gallego, R.A. Optimal location, selection, and operation of battery energy storage systems and renewable distributed generation in medium–low voltage distribution networks. J. Energy Storage 2021, 34, 102158. [Google Scholar] [CrossRef]
  11. Wei, J.; Zhang, Y.; Wang, J.; Cao, X.; Khan, M.A. Multi-period planning of multi-energy microgrid with multi-type uncertainties using chance constrained information gap decision method. Appl. Energy 2020, 260, 114188. [Google Scholar] [CrossRef]
  12. Gil-González, W.; Montoya, O.D.; Grisales-Noreña, L.F.; Perea-Moreno, A.J.; Hernandez-Escobedo, Q. Optimal placement and sizing of wind generators in AC grids considering reactive power capability and wind speed curves. Sustainability 2020, 12, 2983. [Google Scholar] [CrossRef] [Green Version]
  13. Buitrago-Velandia, A.F.; Montoya, O.D.; Gil-González, W. Dynamic reactive power compensation in power systems through the optimal siting and sizing of photovoltaic sources. Resources 2021, 10, 47. [Google Scholar] [CrossRef]
  14. Molina, A.; Montoya, O.D.; Gil-González, W. Exact minimization of the energy losses and the CO2 emissions in isolated DC distribution networks using PV sources. Dyna 2021, 88, 178–184. [Google Scholar] [CrossRef]
  15. Cortinas, D.; Juston, P. Assessing the impact of dispersed generation on medium voltage networks: Analysis methods. In Proceedings of the PowerTech Budapest 99, Abstract Records, (Cat. No.99EX376), Budapest, Hungary, 29 August–2 September 1999; IEEE: Piscataway, NJ, USA, 2003. [Google Scholar]
  16. Hadjsaid, N.; Canard, J.F.; Dumas, F. Dispersed generation impact on distribution networks. IEEE Comput. Appl. Power 1999, 12, 22–28. [Google Scholar] [CrossRef]
  17. Moradi, M.H.; Abedini, M. A combination of genetic algorithm and particle swarm optimization for optimal DG location and sizing in distribution systems. Int. J. Electr. Power Energy Syst. 2012, 34, 66–74. [Google Scholar] [CrossRef]
  18. Nguyen, T.P.; Dieu, V.N.; Vasant, P. Symbiotic organism search algorithm for optimal size and siting of distributed generators in distribution systems. Int. J. Energy Optim. Eng. 2017, 6, 1–28. [Google Scholar] [CrossRef]
  19. Grisales-Noreña, L.; Gonzalez Montoya, D.; Ramos-Paja, C. Optimal sizing and location of distributed generators based on PBIL and PSO techniques. Energies 2018, 11, 1018. [Google Scholar] [CrossRef] [Green Version]
  20. Deshmukh, R.; Kalage, A. Optimal placement and sizing of distributed generator in distribution system using artificial bee colony algorithm. In Proceedings of the 2018 IEEE Global Conference on Wireless Computing and Networking (GCWCN), Lonavala, India, 23–24 November 2018; IEEE: Piscataway, NJ, USA, 2018. [Google Scholar]
  21. Bayat, A.; Bagheri, A. Optimal active and reactive power allocation in distribution networks using a novel heuristic approach. Appl. Energy 2019, 233–234, 71–85. [Google Scholar] [CrossRef]
  22. Bocanegra, S.Y.; Montoya, O.D. Heuristic approach for optimal location and sizing of distributed generators in AC distribution networks. WSEAS Trans. Power Syst. 2019, 14, 113–121. [Google Scholar]
  23. Montoya, O.D.; Ramos-Paja, C.A.; Grisales-Noreña, L.F. An efficient methodology for locating and sizing PV generators in radial distribution networks using a mixed-integer conic relaxation. Mathematics 2022, 10, 2626. [Google Scholar] [CrossRef]
  24. Cortés-Caicedo, B.; Molina-Martin, F.; Grisales-Noreña, L.F.; Montoya, O.D.; Hernández, J.C. Optimal design of PV systems in electrical distribution networks by minimizing the annual equivalent operative costs through the discrete-continuous Vortex Search Algorithm. Sensors 2022, 22, 851. [Google Scholar] [CrossRef]
  25. Montoya, O.D.; Grisales-Noreña, L.F.; Ramos-Paja, C.A. Optimal allocation and sizing of PV generation units in distribution networks via the generalized normal distribution optimization approach. Computers 2022, 11, 53. [Google Scholar] [CrossRef]
  26. Montoya, O.D.; Grisales-Noreña, L.F.; Giral-Ramírez, D.A. Optimal placement and sizing of PV sources in distribution grids using a modified gradient-based metaheuristic optimizer. Sustainability 2022, 14, 3318. [Google Scholar] [CrossRef]
  27. Ghosh, S.; Ghoshal, S.P.; Ghosh, S. Optimal sizing and placement of distributed generation in a network system. Int. J. Electr. Power Energy Syst. 2010, 32, 849–856. [Google Scholar] [CrossRef]
  28. Hung, D.Q.; Mithulananthan, N.; Bansal, R.C. Analytical Expressions for DG Allocation in Primary Distribution Networks. IEEE Trans. Energy Convers. 2010, 25, 814–820. [Google Scholar] [CrossRef]
  29. Rider, M.J.; López-Lezama, J.M.; Contreras, J.; Padilha-Feltrin, A. Bilevel approach for optimal location and contract pricing of distributed generation in radial distribution systems using mixed-integer linear programming. IET Gener. Transm. Distrib. 2013, 7, 724–734. [Google Scholar] [CrossRef]
  30. Wang, C.; Lei, S.; Ju, P.; Chen, C.; Peng, C.; Hou, Y. MDP-based distribution network reconfiguration with renewable distributed generation: Approximate dynamic programming approach. IEEE Trans. Smart Grid 2020, 11, 3620–3631. [Google Scholar] [CrossRef]
  31. Pesaran, M.; Zin, A.A.M.; Khairuddin, A.; Shariati, O. Optimal sizing and siting of distributed generators by exhaustive search. Distrib. Gener. Altern. Energy J. 2015, 30, 29–56. [Google Scholar] [CrossRef]
  32. Kasaei, M. Optimal placement of distributed generation and capacitor in distribution networks by ant colony algorithm. Int. J. Tech. Phys. Probl. Eng. 2014, 20, 52–56. [Google Scholar]
  33. Dadkhah, A.; Bayati, N.; Khodadadi, A. An investigation of the impact of size and location of DG on system reliability by employing sequential Monte Carlo simulation. Int. J. Electr. Electron. Eng. Telecommun. 2016, 5, 1–11. [Google Scholar]
  34. Das, C.K.; Bass, O.; Kothapalli, G.; Mahmoud, T.S.; Habibi, D. Optimal placement of distributed energy storage systems in distribution networks using artificial bee colony algorithm. Appl. Energy 2018, 232, 212–228. [Google Scholar] [CrossRef]
  35. Su, H. Siting and sizing of distributed generators based on improved simulated annealing particle swarm optimization. Environ. Sci. Pollut. Res. Int. 2019, 26, 17927–17938. [Google Scholar] [CrossRef]
  36. Venkata Rao, R. Jaya: A simple and new optimization algorithm for solving constrained and unconstrained optimization problems. Int. J. Ind. Eng. Comput. 2016, 7, 19–34. [Google Scholar] [CrossRef]
  37. Cortés-Caicedo, B.; Grisales-Noreña, L.F.; Montoya, O.D.; Perea-Moreno, M.A.; Perea-Moreno, A.J. Optimal Location and Sizing of PV Generation Units in Electrical Networks to Reduce the Total Annual Operating Costs: An Application of the Crow Search Algorithm. Mathematics 2022, 10, 3774. [Google Scholar] [CrossRef]
  38. Kollu, R.; Rayapudi, S.R.; Sadhu, V.L.N. A novel method for optimal placement of distributed generation in distribution systems using HSDO: DG PLACEMENT IN DISTRIBUTION SYSTEMS USING HSDO. Int. Trans. Electr. Energy Syst. 2014, 24, 547–561. [Google Scholar] [CrossRef]
  39. Kaur, S.; Kumbhar, G.; Sharma, J. A MINLP technique for optimal placement of multiple DG units in distribution systems. Int. J. Electr. Power Energy Syst. 2014, 63, 609–617. [Google Scholar] [CrossRef]
  40. Sultana, S.; Roy, P.K. Multi-objective quasi-oppositional teaching learning based optimization for optimal location of distributed generator in radial distribution systems. Int. J. Electr. Power Energy Syst. 2014, 63, 534–545. [Google Scholar] [CrossRef]
  41. Gupta, S.; Saxena, A.; Soni, B.P. Optimal placement strategy of distributed generators based on radial basis function neural network in distribution networks. Procedia Comput. Sci. 2015, 57, 249–257. [Google Scholar] [CrossRef] [Green Version]
  42. Mohanty, B.; Tripathy, S. A teaching learning based optimization technique for optimal location and size of DG in distribution network. J. Electr. Syst. Inf. Technol. 2016, 3, 33–44. [Google Scholar] [CrossRef] [Green Version]
  43. Sultana, S.; Roy, P.K. Krill herd algorithm for optimal location of distributed generator in radial distribution system. Appl. Soft Comput. 2016, 40, 391–404. [Google Scholar] [CrossRef]
  44. Mahdad, B.; Srairi, K. A new interactive sine cosine algorithm for loading margin stability improvement under contingency. Electr. Eng. 2018, 100, 913–933. [Google Scholar] [CrossRef]
  45. Shaik, K.; K, R. Solving multi objective power flow problem using enhanced sine cosine algorithm. Ain Shams Eng. J. 2021, 12, 3803–3817. [Google Scholar]
  46. Wang, L.; Shi, Z.; Wang, Z. Reactive power optimization for power system with distributed generations using PSO hybrid SCA algorithm. In Proceedings of the 2021 IEEE 10th Data Driven Control and Learning Systems Conference (DDCLS), Suzhou, China, 14–16 May 2021; IEEE: Piscataway, NJ, USA, 2021; pp. 248–253. [Google Scholar]
  47. Oleiwi, A.O.; Jasim Sultan, A. AGC of hydro-thermal power systems using sine cosine optimization algorithm. In Proceedings of the 2021 3rd International Conference on Electrical, Control and Instrumentation Engineering (ICECIE), Kuala Lumpur, Malaysia, 27 November 2021; IEEE: Piscataway, NJ, USA, 2021; pp. 1–7. [Google Scholar]
  48. Mirjalili, S. SCA: A Sine Cosine Algorithm for solving optimization problems. Knowl. Based Syst. 2016, 96, 120–133. [Google Scholar] [CrossRef]
  49. Khalilpourazari, S.; Pasandideh, S.H.R. Sine—cosine crow search algorithm: Theory and applications. Neural Comput. Appl. 2020, 32, 7725–7742. [Google Scholar] [CrossRef]
  50. Soroudi, A. Power System Optimization Modeling in GAMS; Springer: Berlin/Heidelberg, Germany, 2017; Volume 78. [Google Scholar]
  51. Porkar, S.; Poure, P.; Abbaspour-Tehrani-fard, A.; Saadate, S. A novel optimal distribution system planning framework implementing distributed generation in a deregulated electricity market. Electr. Power Syst. Res. 2010, 80, 828–837. [Google Scholar] [CrossRef]
  52. Gams. GDXXRW. Available online: https://www.gams.com/latest/docs/T_GDXXRW.html (accessed on 12 November 2022).
  53. Baran, M.E.; Wu, F.F. Network reconfiguration in distribution systems for loss reduction and load balancing. IEEE Power Eng. Rev. 1989, 9, 101–102. [Google Scholar] [CrossRef]
  54. Sahoo, N.; Prasad, K. A fuzzy genetic approach for network reconfiguration to enhance voltage stability in radial distribution systems. Energy Convers. Manag. 2006, 47, 3288–3306. [Google Scholar] [CrossRef]
  55. Baran, M.E.; Wu, F.F. Optimal capacitor placement on radial distribution systems. IEEE Trans. Power Deliv. 1989, 4, 725–734. [Google Scholar] [CrossRef]
  56. Castiblanco-Pérez, C.M.; Toro-Rodríguez, D.E.; Montoya, O.D.; Giral-Ramírez, D.A. Optimal Placement and Sizing of D-STATCOM in Radial and Meshed Distribution Networks Using a Discrete-Continuous Version of the Genetic Algorithm. Electronics 2021, 10, 1452. [Google Scholar] [CrossRef]
  57. Wang, P.; Wang, W.; Xu, D. Optimal sizing of distributed generations in DC microgrids with comprehensive consideration of system operation modes and operation targets. IEEE Access 2018, 6, 31129–31140. [Google Scholar] [CrossRef]
  58. Grisales-Noreña, L.F.; Montoya, O.D.; Ramos-Paja, C.A. An energy management system for optimal operation of BSS in DC distributed generation environments based on a parallel PSO algorithm. J. Energy Storage 2020, 29, 101488. [Google Scholar] [CrossRef]
Figure 1. Representation of the information exchange in the connection of the MATLAB-GAMS interfaces.
Resources 12 00035 g001
Figure 2. Flow chart of the proposed methodology.
Resources 12 00035 g002
Figure 3. Electrical scheme of the test feeders: (a) IEEE 33-node and (b) IEEE 69-node.
Resources 12 00035 g003
Figure 4. Average solar generation and power demand curve for a typical day in Medellín, Colombia.
Resources 12 00035 g004
Figure 5. Behavior of the objective function value for the test feeders: (a) IEEE 33-node and (b) IEEE 69-node.
Resources 12 00035 g005
Table 1. Summary of methodologies used in the literature for PV placement and sizing.
Method/AlgorithmAcronymRefObjective Function
Genetic Algorithm and Particle Swarm OptimizerGA-PSO[17]Minimization of power losses
Harmonic Search AlgorithmHSA[38]Minimizing power losses
Mixed Integer Nonlinear ProgrammingMINLP[39]Minimizing real power losses
Optimization based on Quasi-Oppositional TeachingQOTLBO[40]Minimization of power losses, improving voltage profiles, and maximizing voltage stability
Radial Basis Function Neural Network and Particle Swarm OptimizationRBFNN-PSO[41]Minimizing power losses
Teaching Learning-Based OptimizationTLBO[42]Minimizing power losses, improving voltage profiles, and maximizing voltage stability
Krill-Herd AlgorithmKHA[43]Minimizing power losses
Search for Symbiotic OrganismsSOS[18]Minimizing active power losses
Population-Based Incremental Learning and Particle Swarm OptimizerPBIL-PSO[19]Minimizing power losses and square error in the voltage profiles
Artificial Bee Colony AlgorithmABC[20]Minimizing power distribution losses and enhancing voltage profiles
Heuristic Algorithmic ApproachAHA[21]Minimizing power losses and improving voltage profiles
Constructive Heuristic Vortex Search AlgorithmCHVSA[22]Minimizing active power losses
Mixed-integer conicMIC[23]Minimizing the costs of power purchasing and PV purchasing, investment, and operation
Discrete-Continuous Vortex Search AlgorithmDCVSA[24]Minimizing the costs of power purchasing and PV purchasing, investment, and operation
Generalized Normal Distribution OptimizationDCGNDO[25]Minimizing the costs of power purchasing and PV purchasing, investment, and operation
Metaheuristic Optimizer based on a Modified GradientMGbMO[26]Minimizing the costs of power purchasing and PV purchasing, investment, and operation
Discrete–Continuous version of the Crow Search AlgorithmDSCSA[37]Minimizing the costs of power purchasing and PV purchasing, investment, and operation
Table 2. Parametric information for evaluating the objective function.
ParameterUnitValueParameterUnitValue
C k W h 0.1390USD/kWh t e 2%
C p v 1036.49USD/kWp N t 10años
C O & M 0.0019USD/kWh P i p v , m i n 0kW
Δ h 1hour P i p v , m a x 2400kW
T365days N p v a v a 3-
t a 10% Δ V ± 10 %
Table 3. Numerical results obtained by the metaheuristic optimizers and the proposed methodology.
MethodLocation (Node)Size (MW) A c o s t (USD/Year)Reduction (%)
Benchmark case--3,700,455.38-
MIC 0 [11, 16, 32][1.8400, 0.6799, 2.3083]2,603,465.0029.64
MIC 1 / 2 [13, 24, 29][1.4116, 1.7145, 1.9471]2,597,283.0029.81
MIC 1 [13, 24, 30][1.4392, 1.7745, 1.8596]2,597,139.0029.82
DSCA-BONMIN[14, 24, 30][1.3877, 1.8007, 1.8852]2,597,131.2629.82
Table 4. Comparison of the results obtained by the metaheuristic optimizers and the proposed methodology.
MethodLocation (Node)Size (MW) A c o s t (USD/Year)Reduction (%)
Benchmark case--3,700,455.38-
DCVSA[11, 14, 31][0.7606, 1.0852, 1.8030]2,699,761.7127.0424
DCGNDO[10, 16, 31][1.0083, 0.9137, 1.7257]2,699,671.7627.0436
DCCSA[10, 16, 31][1.0093, 0.9138, 1.7246]2,699,671.7627.0449
DSCA-BONMIN[14, 24, 30][1.3877, 1.8007, 1.8852]2,597,131.2629.82
Table 5. Numerical results obtained by the metaheuristic optimizers and the proposed methodology.
MethodLocation (Node)Size (MW) A c o s t (USD/Year)Reduction (%)
Benchmark case--3,878,199.93-
MIC 0 [23, 27, 46][2.3578, 0.0585, 2.4000]2,752,021.0029.04
MIC 1 / 2 [17, 49, 61][1.0977, 1.7981, 2.4000]2,721,282.0029.83
MIC 1 [17, 49, 61][1.0977, 1.7981, 2.4000]2,721,282.0029.83
DSCA-BONMIN[8, 17, 61][2.0714, 0.8300, 2.3999]2,720,707.6329.85
Table 6. Comparison of the results obtained by the metaheuristic optimizers and the proposed methodology.
MethodLocation (Node)Size (MW) A c o s t (USD/Year)Reduction (%)
Benchmark case--3,700,455.38-
DCVSA[16, 61, 63][0.2632, 2.2719, 2.2934]2,825,264.5627.1502
DCGNDO[21, 61, 64][0.4812, 2.4, 0.9259]2,824,923.3827.1589
DCCSA[21, 61, 64][0.4816, 2.4, 0.9254]2,824,923.0527.1589
DSCA-BONMIN[8, 17, 61][2.0714, 0.8300, 2.3999]2,720,707.6329.85
Disclaimer/Publisher’s Note: The statements, opinions and data contained in all publications are solely those of the individual author(s) and contributor(s) and not of MDPI and/or the editor(s). MDPI and/or the editor(s) disclaim responsibility for any injury to people or property resulting from any ideas, methods, instructions or products referred to in the content.

