1. Introduction
A finding published in the Lancet notes that “the risk for infection is highly dependent on distance to the individual infected and the type of face mask and eye protection worn” [
1]. In many instances, either congestion or large passenger flow occurs at urban rail transit (URT) station platforms. However, there is a research gap regarding pedestrian social distancing necessary to prevent person-to-person transmission of COVID-19 or, in general, any coronavirus. Based on 504 questionnaires surveyed during the COVID-19 time, we identified multiple, observational simulation performances to investigate optimum distance for avoiding person-to-person virus transmission.
With the gradual resumption of the economy and transportation in China, passengers have been seeking efficiency-oriented travel, in addition to contagion prevention. A reasonable management policy at URT, to a certain extent, not only facilitates passengers’ travel efficiency, but also reduces the risks of COVID-19 transmission. Note that URT was suspended in many cities in China during the most threatening period of COVID-19, while some URT has now returned to normalcy. However, some related management policies are hysteretic (and questionable), and need verification. The study of determining reasonable social distancing is then developed as our objective, where necessary, to balance both efficiency and safety to produce a tradeoff effect.
Employing some necessary contagion prevention management measures/policies, some service areas have resumed the previous normalization in a sustainable manner. One challenge the transport management encounters is to observe contagion prevention social distancing without losing the dominance of travel efficiency. However, seeking the tradeoff between COVID-19 pandemic prevention and improving orderliness for boarding/alighting/walking is multifaceted. Pedestrian simulation has been proposed in the literature, but few studies have investigated the tradeoff mechanism. A date-based simulation experiment is a useful approach, from the operator’s perspective, for determining contagion prevention social distancing as requested in public, and enables efficient travel under the management policy.
This study focuses on pedestrian distancing by using investigation-based simulation that explores and investigates contagion prevention social distancing among individual passengers, and specifically examines their effectiveness. In view of COVID-19 transmission characteristics, one limitation of existing studies—and policies derived from them—is that they only recommend subjective measures, such as wearing masks, reducing the number of passengers serviced and continuously sterilizing the air. Indeed, there is little research on quantitative guidance for passenger flow control in URT that is framed against the backdrop of the COVID-19 pandemic. Therefore, a multicriteria decision-making framework that can take various system performance measures and users’ path choices into account is warranted.
Taking the complexity of station layout and the unpredictability of pedestrian routes into consideration, a large-scale, city-wide and online questionnaire survey was conducted over three months. It was based on 504 samples considered on the WeChat electronic platform. The modeling parameters set and simulation layout are built explicitly from real data as the input of the experiment.
In this study, the pedestrian-restricted movement issue (density/time) is regarded as the key criterion of the management policy. The psychological, contagion prevention, social distancing between people in THE pedestrian flow is tested in the simulation. The conventional habits of distance at URT, prior to 2019, is obviously unable to satisfy the requirements of epidemic prevention. For instance, large passenger flow disposal and commuter passenger flow guidance are not yet able to prevent the spread of COVID-19. Based on the classical social force model (SFM) of pedestrian psychology [
2], we use AnyLogic software (version 8.6, The AnyLogic Company formerly XJ Technologies, Lisboa, Portugal) to build simulation scenarios. Taking Xinjiekou Station, Nanjing URT, China as a case for empirical study and a statistical base, we illustrate the movement paths based on SFM by observing pedestrian distancing of 0.5 m, 1.0 m and 2.0 m, respectively. These experimental activities are based on SFM-oriented simulation frameworks.
1.1. Literature Review
With respect to passenger flow control management, the reasonable policy that enables reductions in common and excessive congestion is usually performed/interpreted by a passenger demand assignment problem. To address this problem, Yuan et al. [
3] established a mixed integer linear programming model to optimize the solution with the research target of passenger waiting time. Jiang et al. [
4] developed a new method of enhanced learning to optimize passenger flow at stations over a given period of time, and reduce passenger detention rate, thereby ensuring passenger safety. Li et al. [
5] used the model prediction control valve method, combined with URT line and passenger flow control, for their study. This allowed for analyzing the optimal control strategy of train regulation and passenger flow control. Based on pedestrian simulation, an evaluation grid was constructed to control the intensity of passenger flow [
6]. Burdzik et al. [
7] focused on the passenger flow interactions with a minimum spread risk of COVID-19 and other infectious diseases. Crowding satisfaction and delays are modeled and estimated by valid simulation.
Passenger dynamic observations at URT can be modelled on a simulation approach to uncover the character of the unpredictable mobility. For further insight into papers using this approach, the reader may refer to Yao et al. [
8], Zhao et al. [
9], Jin et al. [
10], and Shang et al. [
11]. Yao et al. [
8] propose a dynamic passenger allocation model based on the route selection. The results facilitate the dynamic supply and demand relationship in the public transport network. Zhao et al. [
9] examine the movement characteristics of pedestrians at stations where the URT is connected to a shopping mall. Jin et al. [
10] study the dynamic changes in one-way flow and bi-directional flow rates in high-density situations. In considering the discrete passenger flow states, Shang et al. [
11] execute a space–time hyper network flow distribution, analyze pedestrian path selection behaviors and improve passenger flow organization.
We consider the operational URT efficiency aspect using train scheduling optimization problem. Li et al. [
12] propose a service frequency optimization tactic to encourage some passengers to move their journeys from peak to off-peak hours and ease congestion. Wang et al. [
13] use sequential quadratic programming and genetic algorithms to solve train scheduling problems in terms of departure time, arrival time, and passenger arrival rate. Combined with factors from Beijing URT operation, Wang et al. [
14] propose passenger demand control methods by solving the mixed integer linear programming problem. For the purpose of reducing the operation cost and waiting time of passengers, Yin et al. [
15] propose the train scheduling problem on the bi-directional URT, and validate the Beijing subway, based on the heuristic algorithm of Lagrange relaxation combined with the programming model.
This study develops the simulation-based approach for public management policy in the case of specific URT stations. The aim of the present work is grounded in the variability of contagion prevention social distancing in walking patterns subject to COVID-19 pandemic circumstances. Hoogendoorn and Bovy [
16] set up a pedestrian utility function to simulate the different walking conditions and uncertainty levels derived from route/area selections. Tong and Cheng [
17] propose a pedestrian flow simulation model based on multi-agent technology, which takes the factors of distance and pedestrian psychology into account. Weng et al. [
18] develop a model based on the maximum likelihood regression tree from a pedestrian perspective to predict delayed responses to URT accidents. Xiao et al. [
19] propose a heuristic-based pedestrian flow simulation performance that is compatible with the normal movement of passengers.
The majority of pedestrian simulation models are derived from the classical social force model (SFM) [
20]. In focusing on export selection performances, Zheng et al. [
21] simulate pedestrian micro behaviors and analyze the difference between actual data and experimental data. Li et al. [
22] study the impact of passenger obstacles on walking efficiency. According to the platform queue, the subway station capacity was calculated by means of the Markov chain [
23]. Jiang et al. [
24] describe the typical phases of dynamic pedestrian evacuation. In considering station service capacity, Xu et al. [
25] set different demand scenarios and combine data closure analysis to assess station service capacity. Using data obtained from the Vienna URT station data, pedestrian paths were simulated based on continuous observation of perceived times [
26]. Chen et al. [
27] develop a multi-agent, learning-based pedestrian simulation approach, whose adaptation was proved for pedestrian scenes. Zhang et al. [
28] establish a micro-simulation model of off-board behavior based on cellular automata, which evaluates the facilities and passenger organization managements at URT stations. Feng et al. [
29] use the p-space method to describe the basic topological space of the URT network. Zheng et al. [
30] simulate the progress of pedestrian evacuation in an emergency, by testing the emergency diffusion fields according to the panic indexes.
The known commercial software AnyLogic was selected for our pedestrian simulation. AnyLogic [
31] is a valid tool for analyzing pedestrian movements. The use of this common tool allows other scholars/readers to repeat the experimental results. From the literature we learn that Zuo et al. [
32] used AnyLogic to simulate emergency evacuation performance, subject to the restricted usable spaces in the high-density pedestrian evacuating process. Liu and Hong [
33] employ AnyLogic to track pedestrians’ distribution and actions of entering, boarding and alighting at a URT station. Zhang et al. [
34] adapt AnyLogic to perform transfer of passengers at a Wuhan URT station. Overall, we decided to use this tool because it takes regional density, average passenger flow speed and the time distribution of entrances and exits as the criteria, where the feasible passenger flow guidance is verified through simulation experiments.
1.2. Motivation and Contribution
1.2.1. Background, Motivation and Framework
At the global spread era of COVID-19, and potential spread of other coronaviruses in the post-epidemic era, URT operation is affected and regulated by the specific passenger management policy. Passengers are advised to maintain a certain social distance to prevent contagions. In order to reflect epidemic prevention requirements, the pedestrian flow paths at the URT stations are simulated. Hereby pedestrian distancing is set at 0.5 m, 1.0 m and 2.0 m, respectively. A comparative analysis of pedestrians’ boarding, alighting and exiting behaviors was then simulated, testing different scales of distancing.
In the field of public health security, the trade-off between congestion and operational efficiency is a key issue for controlling coronaviruses. This distancing management is meaningful for devising the optimal passenger flow control policy. The trauma from what happened after the arrival of the COVID-19 pandemic is still scorched in people’s minds. Thus, our motivation is to provide guidance for preparedness policy that can be used during the pandemic time of any coronaviruses.
Unlike the existing literature, which focuses on the effectiveness of pedestrian evacuation, and only takes bottleneck congestion into account, our study seeks to validate a reasonable passenger flow control regulation and contagion prevention social distancing observation. We seek to analyze pedestrians’ restricted movements at a URT station platform by exploring different social distances through simulation experiments. In order to determine optimal pedestrian distancing and ensure both efficiency and contagion prevention, we develop a simulation-based methodology, to verify and calibrate the model parameters precisely. The purpose is to help clarify elements of the passenger management policy for the COVID-19 pandemic.
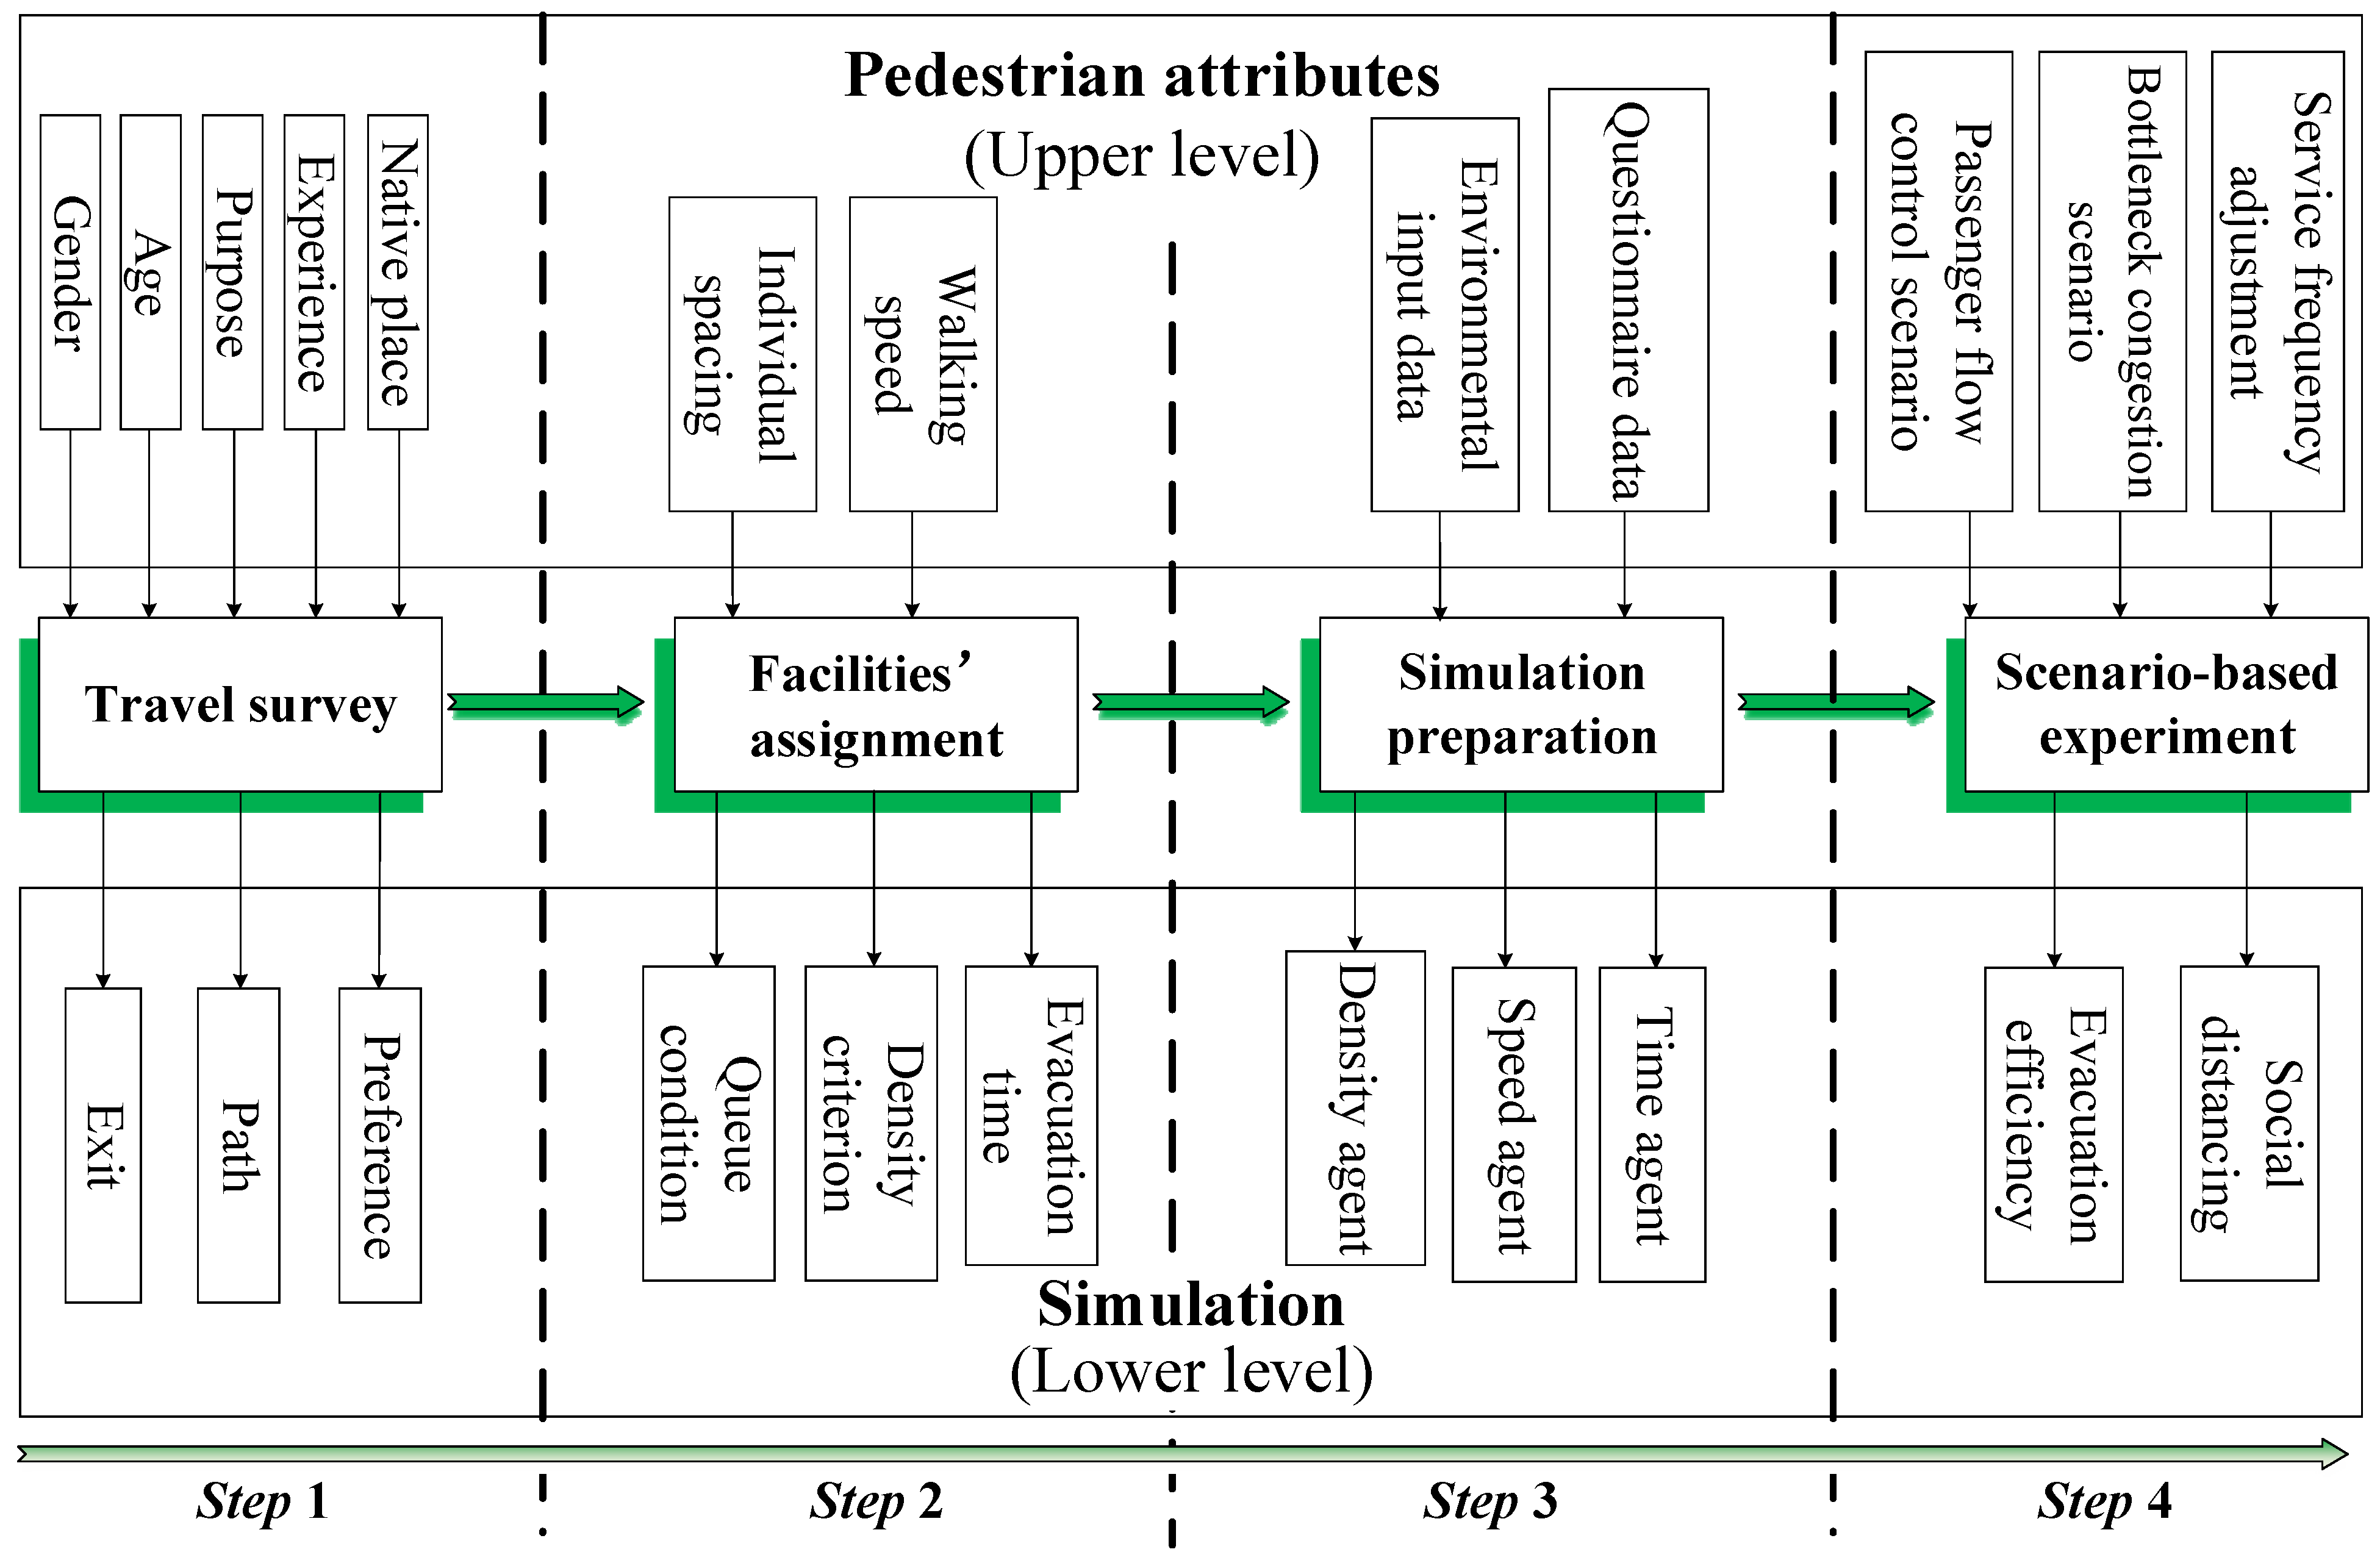
Figure 1 illustrates the simulation-based methodology framework. The whole process is divided into four steps, as shown in
Figure 1, namely travel survey, facilities’ assignment, simulation preparation, and a scenario-based experiment. Details of the four steps appear in
Section 3,
Section 4 and
Section 5.
1.2.2. Contribution
The first contribution of our study, in terms of COVID-19 transmission prevention on URT, concentrates on the tradeoff between service-based efficiency and contagion-prevention distancing control. Our study utilizes a simulation-based approach. A case verification is achieved based on the SFM by an empirical survey of parameter calibration. Thus, our study, under COVID-19 pandemic circumstances, which is explicitly concerned with better reproduction of passenger behaviors, allows for congestion in a URT.
Improved accuracy of simulation is our second contribution. More precise parameter calibration is fulfilled in the AnyLogic context. These parameters include user heterogeneity, age, gender, purpose, path choice and familiarity degree. To obtain this information, a questionnaire survey was conducted for pedestrian flow under the epidemic control policy. The survey helps in studying and comprehending pedestrians’ exiting choices, queue lengths, queuing behavior, and total alighting times.
1.3. Outline
The paper structure is as follows:
Section 2 presents the social force model, to calibrate the pedestrians’ attributes.
Section 3 introduces the simulation process under public management.
Section 4 analyzes the simulation results by testing social distances in walking dynamics. Finally, a case study of Nanjing Xinjiekou URT station is validated in
Section 5. Conclusions and future research prospects are presented in
Section 6.
2. Methodology
In this section, the simulation model is described. The simulation context and SFM-based parameter calibration are presented.
2.1. Pedestrian Flow Model
Social force refers to the psychological mechanism of human response to stimulation, according to the psychological level. Pedestrians make the benefit-maximizing choice after a general assessment of different courses of action, so as to mentally produce the driving force of action and take practical actions. Pedestrians are familiar with daily walking, so the resulting reactions are unconscious but predictable. Helbing et al. [
2] introduce the SFM. It states the microscopic forces between pedestrians and pedestrians, pedestrians and targets, pedestrians and obstacles, and is intended to make pedestrians move according to certain routes.
Derived from Newton’s law and vector mechanics,
Pedestrian driving force refers to pedestrians at a certain speed along a certain route to the destination. Friction exists in the process, due to physical contact with the high density of pedestrians or obstacles, which is the repulsive force from other pedestrians. According to Helbing et al. [
2,
35], the equation of motion of SFM can be described by
where
denotes the resultant force acting on pedestrian
a.
is the pedestrian self-driving force (the direction of the force is consistent with the direction of the target).
is pedestrian
a subject to repulsion from pedestrian
i.
is set to pedestrian
a subject to repulsion from obstacle
w.
implies pedestrian
a attracted to the attraction element.
denotes a disturbance term.
Assume pedestrian mass in calculations
, where all forces are equal to the acceleration at this time. In the case of SFM, the role of attracting elements or pedestrian groups is often ignored, and
is omitted to make Equation (2):
Define the path used by pedestrian a reaching his/her destination as a collection of , where K represents the total number of pedestrians’ paths. The components of the resultant force are analyzed separately, using Equations (1) and (2).
2.2. Interaction Effect
- (1)
Following Helbing and Molnar [
20], self-driving force is expressed by:
where
is the desired speed of pedestrian
a.
denotes the unit vector of time
t to target
(
=
).
denotes the actual speed of pedestrian
a at time interval
t.
is time constant.
- (2)
The interaction force between pedestrians, described in Helbing and Molnar [
20], is
where
is set to the vector difference between the pedestrian position at time interval
t and
i position (
).
is the interaction force’s strength between pedestrians.
is the action distancing of the interaction force between pedestrians.
- (3)
The repulsion of pedestrians and obstacles, based on Helbing and Molnar [
20], is
where
implies the vector difference between pedestrian
a and obstacle
w at the closest point to the pedestrian at time interval
t (
).
is the force’s strength between pedestrians and obstacles.
is the action distance between pedestrians and obstacles.
- (4)
Disturbance term
Disturbance term refers to the sum of all random fluctuations of pedestrians in the walking surroundings. Moreover, in the calculation formulas in this paper, it applies to pedestrians’ reduced acceleration or deceleration due to random disturbance.
3. Simulation
3.1. Simulation Preparation
The AnyLogic simulation software is a tool that combines discrete system dynamics and multi-agents. More specifically, it has the advantage of a possible setting of simulation rules related to pedestrian distancing. It is widely used in supply chain, pedestrian traffic simulation, urban development, disease diffusion, and other fields. It adopts the latest design methodology of complex systems, introduces unified modeling language into the modeling simulation context, and can describe discrete and continuous behavior explicitly.
The pedestrian library module enables us to describe pedestrian flow, and bottleneck points in the restricted movement of passengers, and it can be found through the simulation for evaluating the station’s traffic capacity. Regarding characteristics of the SFM, we put the corresponding modules from the pedestrian library into the model. Thereby, we depict passengers’ restricted movements diagram by the walking paths. It should be noted that all passengers exiting the URT station obey the First-In-First-Out principle.
Survey 1: Questionnaire survey, in which 504 samples of the travel-demand questionnaire were distributed randomly online for people who have lived in Nanjing for more than a few years.
Survey 2: Field survey, from which the station infrastructure data measurement is collected.
3.2. Pedestrian Library Module
In the Pedestrian Library module, simulated station surroundings are built as a background diagram by using the survey data. Furthermore, we then create a simulation surrounding module by using spatial markers and functions to complete scene construction and the modeling of pedestrians’ activities. The simulation modeling process of the Pedestrian Library is presented in detail in
Figure 2.
We use the AnyLogic software’s Pedestrian Library module to describe the pedestrian agents in the simulation. In addition, control functions in the Pedestrian Library, on the basis of PedSource, PedGoTo, PedSink, PedService, PedWait, are carried out to figure out the pedestrian decision-making process.
3.3. Restricted Movement
3.3.1. Pedestrian Agent
For the completion of scene construction and pedestrian agent modeling, it is necessary to comprehensively consider various factors for simulating restricted movements at the URT station. In other words, time, speed and density agents are observed so as to evaluate the restricted movement process throughout its experimental form.
- (i)
Time agent: Evaluate if there is any delay in the URT station exiting process. As a primary evaluation index, the time agent enables assessment of the speed of exiting flow, which is the intuitive indicator for passengers.
- (ii)
Speed agent: The walking speed of a pedestrian, in comparison with the agent’s average speed.
- (iii)
Density agent: The density of the pedestrian flow is introduced to analyze the status of traffic. Certainly, the density at different facilities is variant, as an important indicator for analyzing congestion of the corridor or lack thereof.
Generally speaking, passengers at stations are dispersing spontaneously. This involves a natural social distancing because, by their very nature, people do not like to be too close to each other. We used the simulation parameter density agent to control the number of passengers allowed to enter the station and, as a result, to derive the space between people. Hence, if the space is quantitatively controlled by the simulation, the averagely restricted social distances can be satisfied.
3.3.2. Parameter Setting
A noticeable social distance, e.g., 2 m, is hard to impose. In our study we are referring to it as a maximal controlled average distance. A long distance such as this will only allow a certain number of passengers to enter the station. Thus, this will create longer passenger queues at the entrance.
- (1)
Individual space
According to the SFM nested into AnyLogic software, a hierarchical architecture defining the individual pedestrian space is needed. Particularly, repulsion is caused by the existence of individual spatial needs. In the process of individual space setting, three situations are set based on Zhang et al. [
28], specifically, allowing for a pedestrian oval cellular space with a long axis of, 57.9 cm, and a short axis of 33 cm [
36]. This corresponds with the elliptical area formula, such that an adult man needs an area of about 0.146 m
2, rather than the distensible rectangular area that is about 0.191 m
2. In the
PedSource set, the default pedestrian diameter distribution is uniform, with a determination of 0.4 m or 0.5 m. The calculated area is 0.126 m
2 to 0.196 m
2, so the diameter’s parameter is 0.4 m to 0.5 m.
Explicitly, the pedestrian distancing agent is set as triple-tuple. We set variable sd as social distance, and mark the case considered as ‘k’, making it sdk. In the case k = 1, 2, 3 for each group: (i) define k = 1 under normal circumstances, the default value of the diameter parameters is 0.4 m to 0.5 m; (ii) k = 2, in the case of an epidemic, the diameter of pedestrians that meets contagion-prevention social distancing is 0.9 m to 1.0 m. Furthermore, in (iii), we set k = 3 as, under the heavy influence of the pandemic, some pedestrians demonstrate higher demand for individual space than general pedestrian requirements. Taking the real needs and requests of pedestrians and contagion-prevention social distancing into consideration, the diameter for pedestrians is set at 1.5 m to 2.0 m. This setting is based on our assumption of uniform personal space or body diameters for simulating a mass number of moving pedestrians. In other words, we do not simulate individual user’s behavior or characteristics.
- (2)
Walking speed
Pedestrian walking speed varies with factors such as passenger flow density, gender, and age. Referring to Chandra and Bhari [
37], the surveyed average male pedestrian speed is 1.31 m/s, and the surveyed average female pedestrian is 1.16 m/s. According to the properties of the
Pedsource module, we write the walking speed according to the investigation data.
4. Case Study
4.1. Input
4.1.1. Data
We use the Xinjiekou Station case to validate the effectiveness of the simulation. Xinjiekou Station is the transfer station of Nanjing URT between Line 1 and Line 2. By virtue of the station’s location in the center of Nanjing, it leverages the advantages of geographical location to raise the possibility of large passenger flow. Note that Xinjiekou Station is the only subway station in Asia with 24 exits. The station platform is all island style, where Line 1 is located on the third floor, and Line 2 is located on the second floor. It should be noted that our study only considers exiting passenger paths. Line 1 is north–south, 311.872 m long and 24.2 m wide. On the other side, Line 2 is east–west, 440.3 m long and 21.6 m wide. By measuring the dimensions of the local elevator and stairs in the subway station, it is found that the elevator width is precisely between 1.30 m and 1.45 m. In addition, the stair width is between 2.34 m and 5 m. The dimensions of the elevator and stairs are based on a scale of one meter, which is approximately equal to 10 pixels. So far, the observation information stipulates the scale of the simulation environment.
In order to acquire the data of passengers in URT, we conducted an online questionnaire for a total of 504 questionnaires collected and validated. Allowing for unused/closed 17th, 18th, 19th and 24th exits of the subway station, they are excluded from the content of the questionnaire.
4.1.2. Scenario
According to the real structural diagram/data of Xinjiekou Station, the basic scene surroundings are constructed. Within the AnyLogic context, we use the
wall,
rectangular wall and
ring wall tools in the Pedestrian Library to draw the peripheral wall of the URT station, and limit the pedestrian walking range. Then, we activate the
escalator group and
ramp to guide existing pedestrians to change floors. Let the
target line label for generation and arrival of pedestrian flow, and
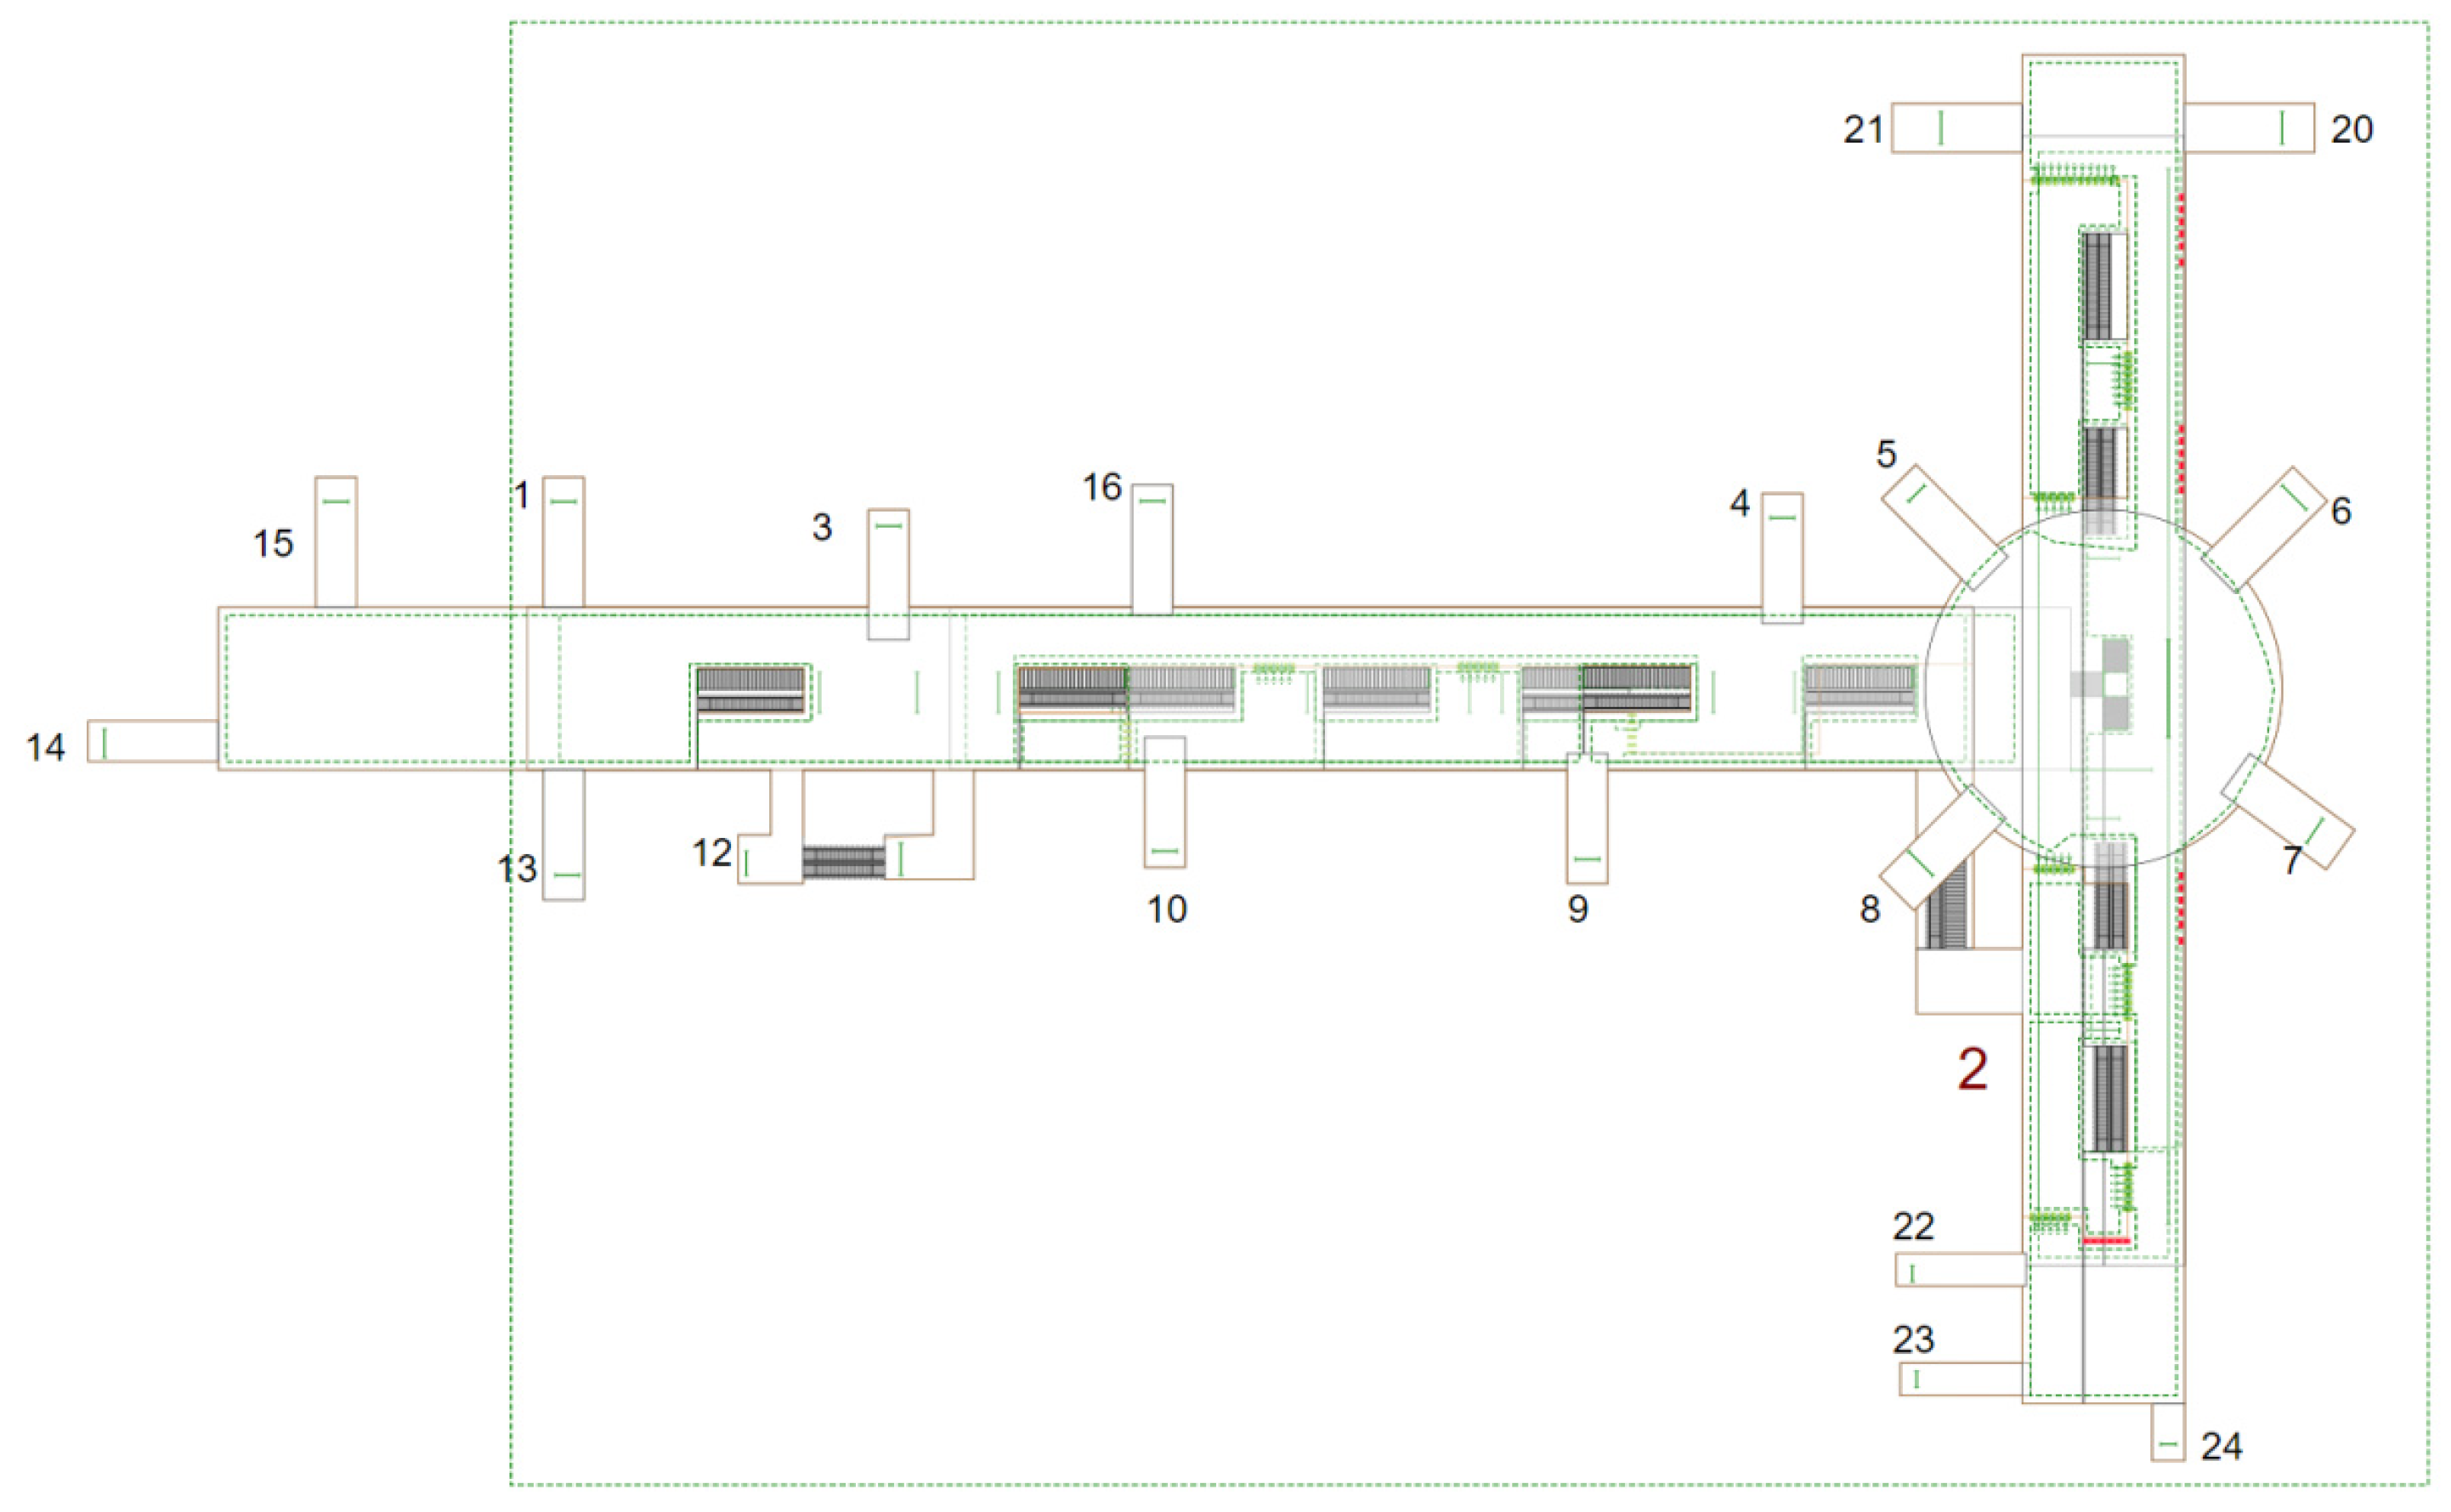
line service, represent the number, location, and turnstile service. Given that the station is a three-layer platform, we precisely set up the layer layout and assign various service facilities, including security inspection equipment, ticket vending machine, and automatic fare gate, for simulation. Explicitly, the first and second layers are platform layers and the third layer is the URT hall. The pedestrian distribution ground layer is depicted in
Figure 3 and
Figure 4.
4.1.3. Paths
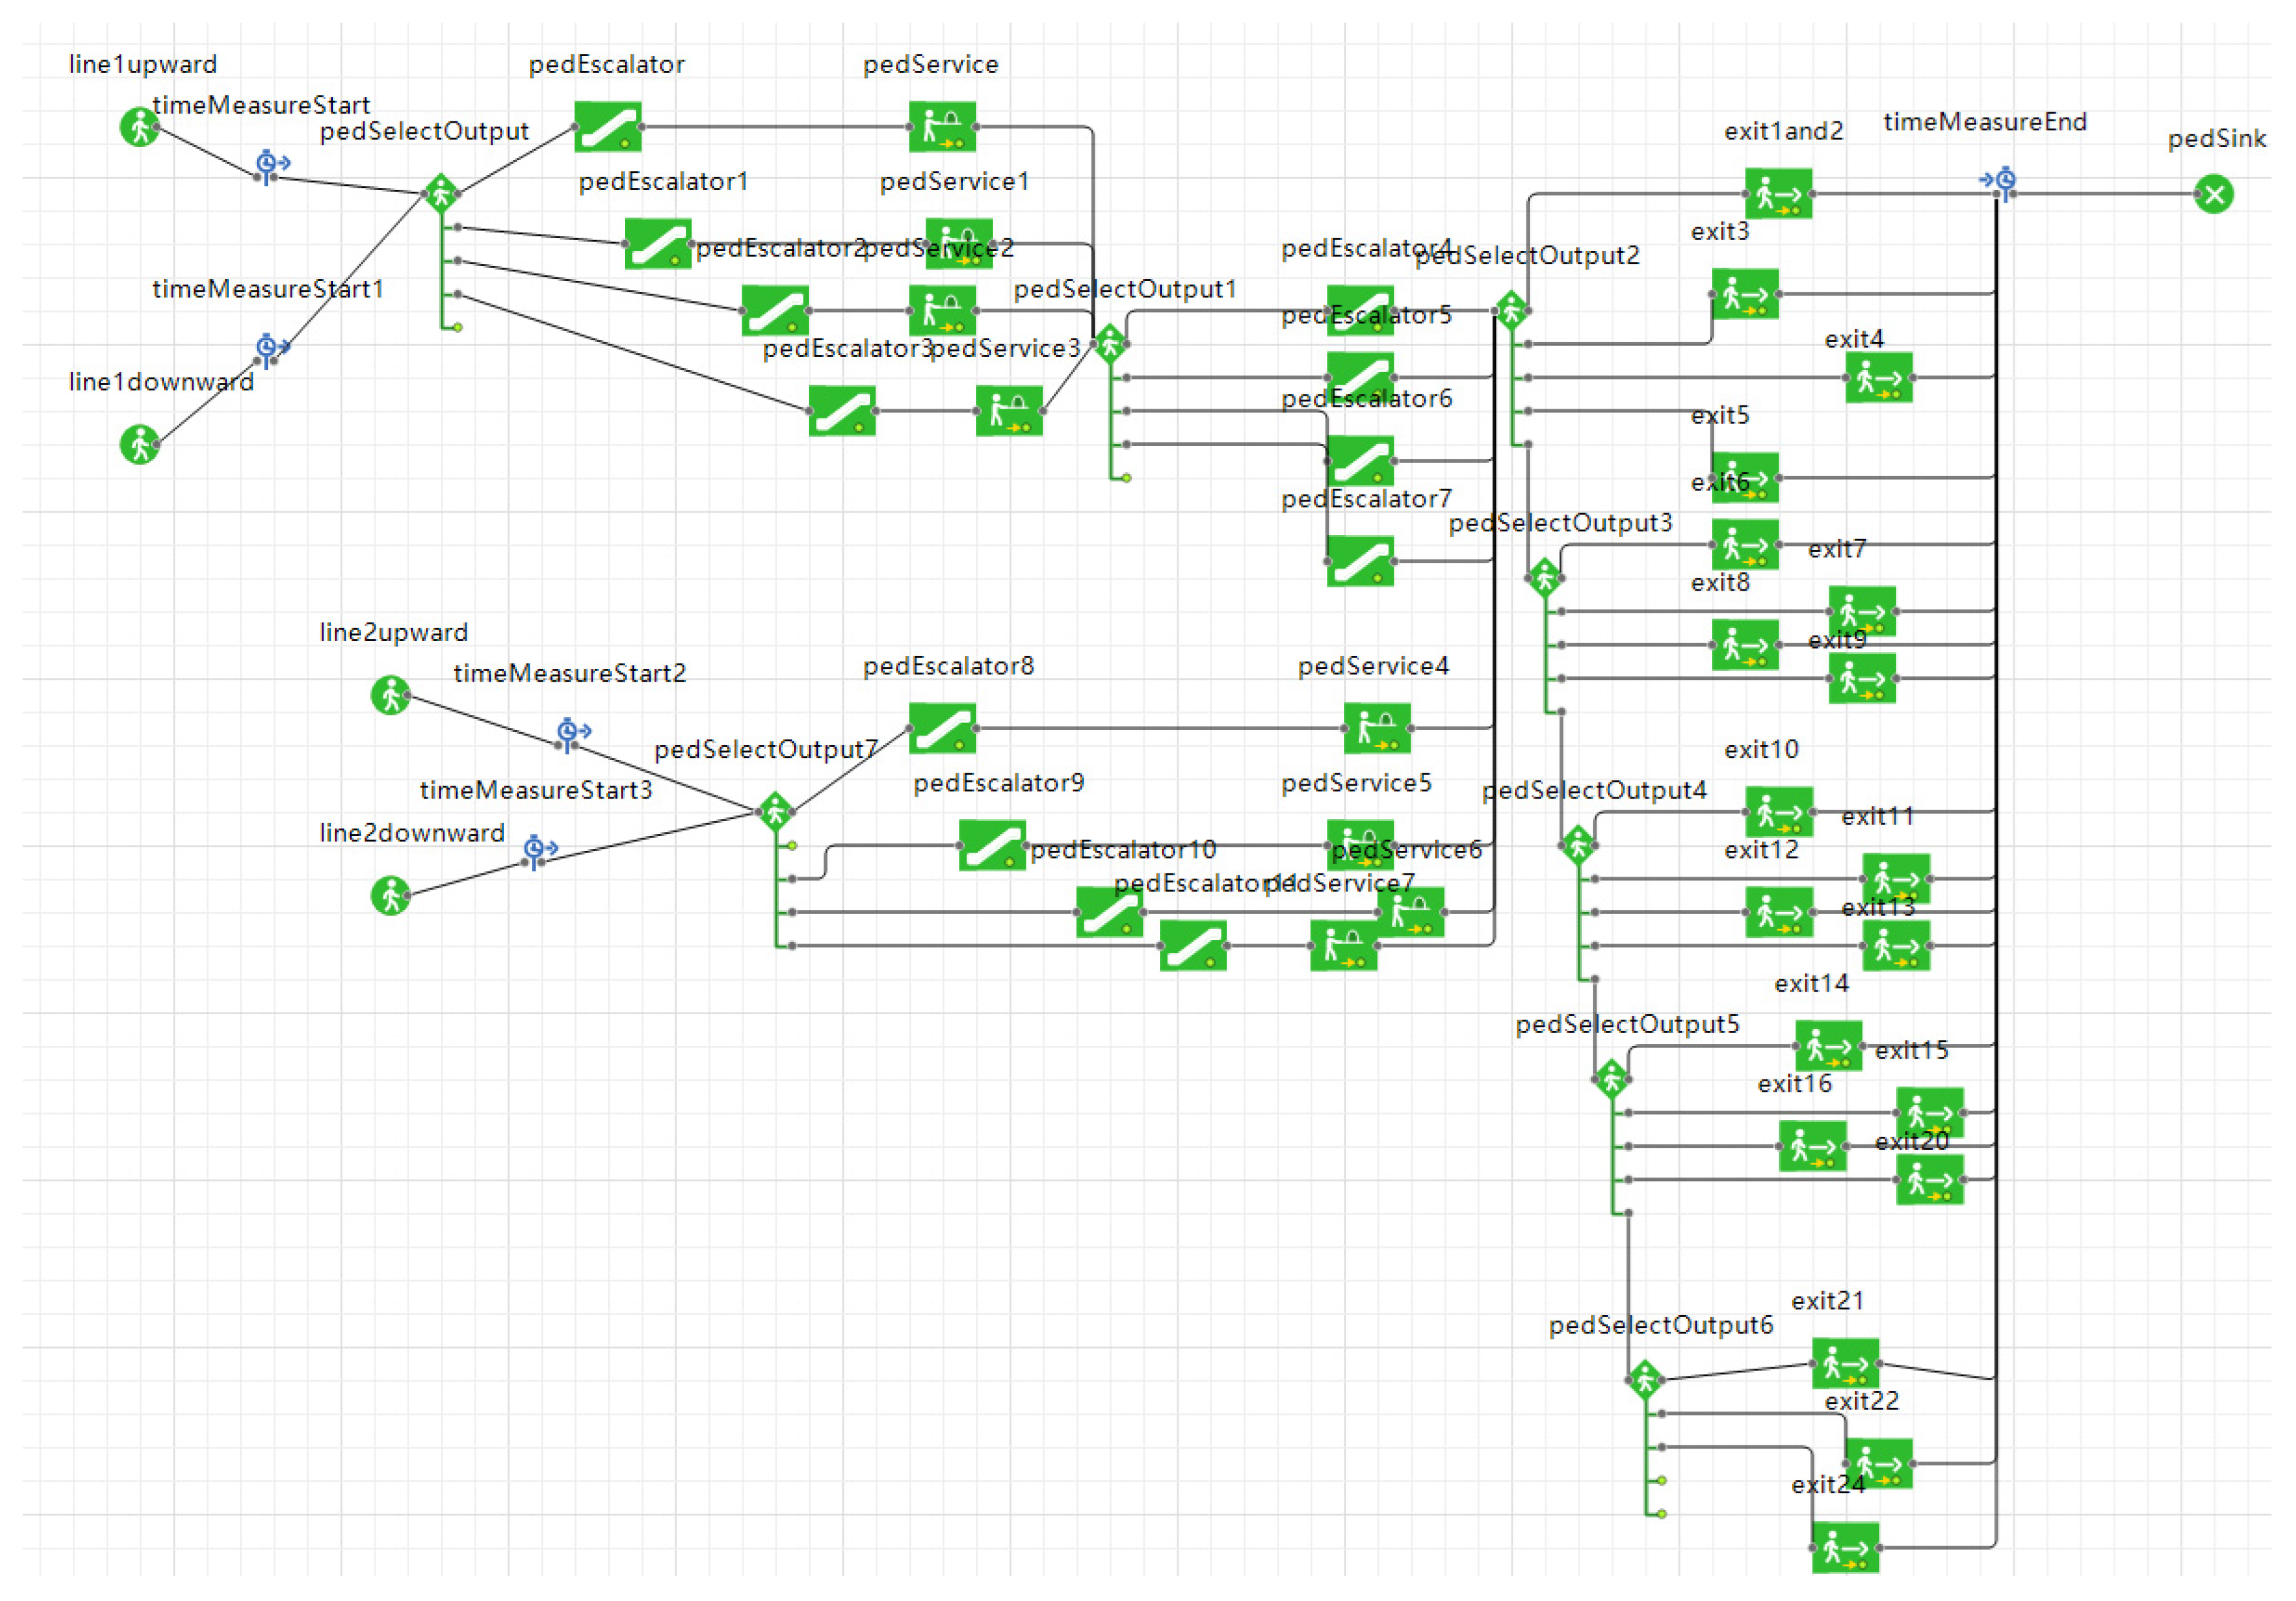
In the real world, once passengers alight from trains to exit the station, they are supposed to make rational decisions based on expected destinations. Similarly, the walking process can be separated into several individual segments, such as path selection, stair elevator service, turnstile service and final route selection. Corresponding to the above segments, the pedestrian agent module is carried out by using PedSource and PedGoTo, PedService, respectively.
Based on the pedestrians’ actual restricted movement path, we set the probability for selecting different ladder groups. We assigned pedestrians to the required exit from the corresponding turnstiles, according to the actual questionnaire survey results. The decision-making control modules are connected to show a complete flowchart of the passenger’s exit path, as shown in detail in
Figure 5.
4.1.4. Parameterization
- (1)
Pedestrian parameters setting
We used the survey data to calibrate the pedestrian agent.
Table 1 illustrates the gender attributes of the passengers surveyed.
Passengers’ choices for different exits are derived from the questionnaire statistics. Corresponding data are shown in
Table 2. The 17th, 18th, 19th, and 24th exits are not taken into consideration.
Based on the data above, taking the probability of passenger selection exit into account, we set activation rules for the pedestrian flow by parameter calibration. In addition, the basic overall questionnaire data are clearly provided in the tables in
Appendix A.
- (2)
Infrastructure data setting
We have the
SetSpeed module to set passengers’ walking speed. Set ladder group data in the Escalator-group, such as ladder speed, width, length, etc. Pedestrian speed is based on observed average value, although in principle it is a random variable. Otherwise, the simulation is too complex to execute. The detailed parameters are shown in
Table 3.
4.2. Xinjiekou Station Simulation
As per the official data of the Nanjing Traffic Design Institute in 2018, Nanjing Subway Corporation presently uses Type-A train, marshalling six-car trains. Satisfying the URT safety standard, the upper bound of the loading threshold (capacity) is 2520 pax/train, where pax stands for passengers. At the time when the COVID-19 pandemic prevailed, the daily level of demand at Xinjiekou Station fell to hundreds of orders of magnitude. In effect, during a given day, the surveyed overall demand is 117,588 pax/day. It is assumed that the number of passengers desiring to exit is 1000 per train, based on the service frequency.
Regarding train agents, the arrival interval time of trains on Line 1 and Line 2 is 100 s, while the arrival interval time of the trains on the other side of Line 1 and Line 2 start from 200 s, meaning the arrival time interval is 300 s. As per the different pedestrian diameters (i.e., distancing), the multi-agent-based simulation is carried out respectively. In order to observe the impact of pedestrian distancing on congestion precisely, as large passenger flow exits, comparative analysis is conducted and the pedestrian behaviors at the same turnstile are intercepted for this purpose.
4.2.1. Different Distancing Queues for Pedestrians at the Same Turnstile
Figure 6,
Figure 7 and
Figure 8 shows the pedestrian queuing situation on the right side of the 22nd exit for purposes of analysis and comparison. Given pedestrian distancing of 0.4–0.5 m, from the view of simulated 3D, the crowding degree of pedestrian flow is the largest, so the service rate of the turnstile is the lowest. Furthermore, when the distancing is 1.5–2.0 m, there is no need to wait in front of the turnstile, despite passenger movement efficiency being restricted. When distancing is 0.9–1.0 m, pedestrians are less likely to form a long queue. Subsequently, the service rate of the turnstile is higher than the other two distancing cases.
4.2.2. Simulation of Density Diagram with Different Distancing
- (1)
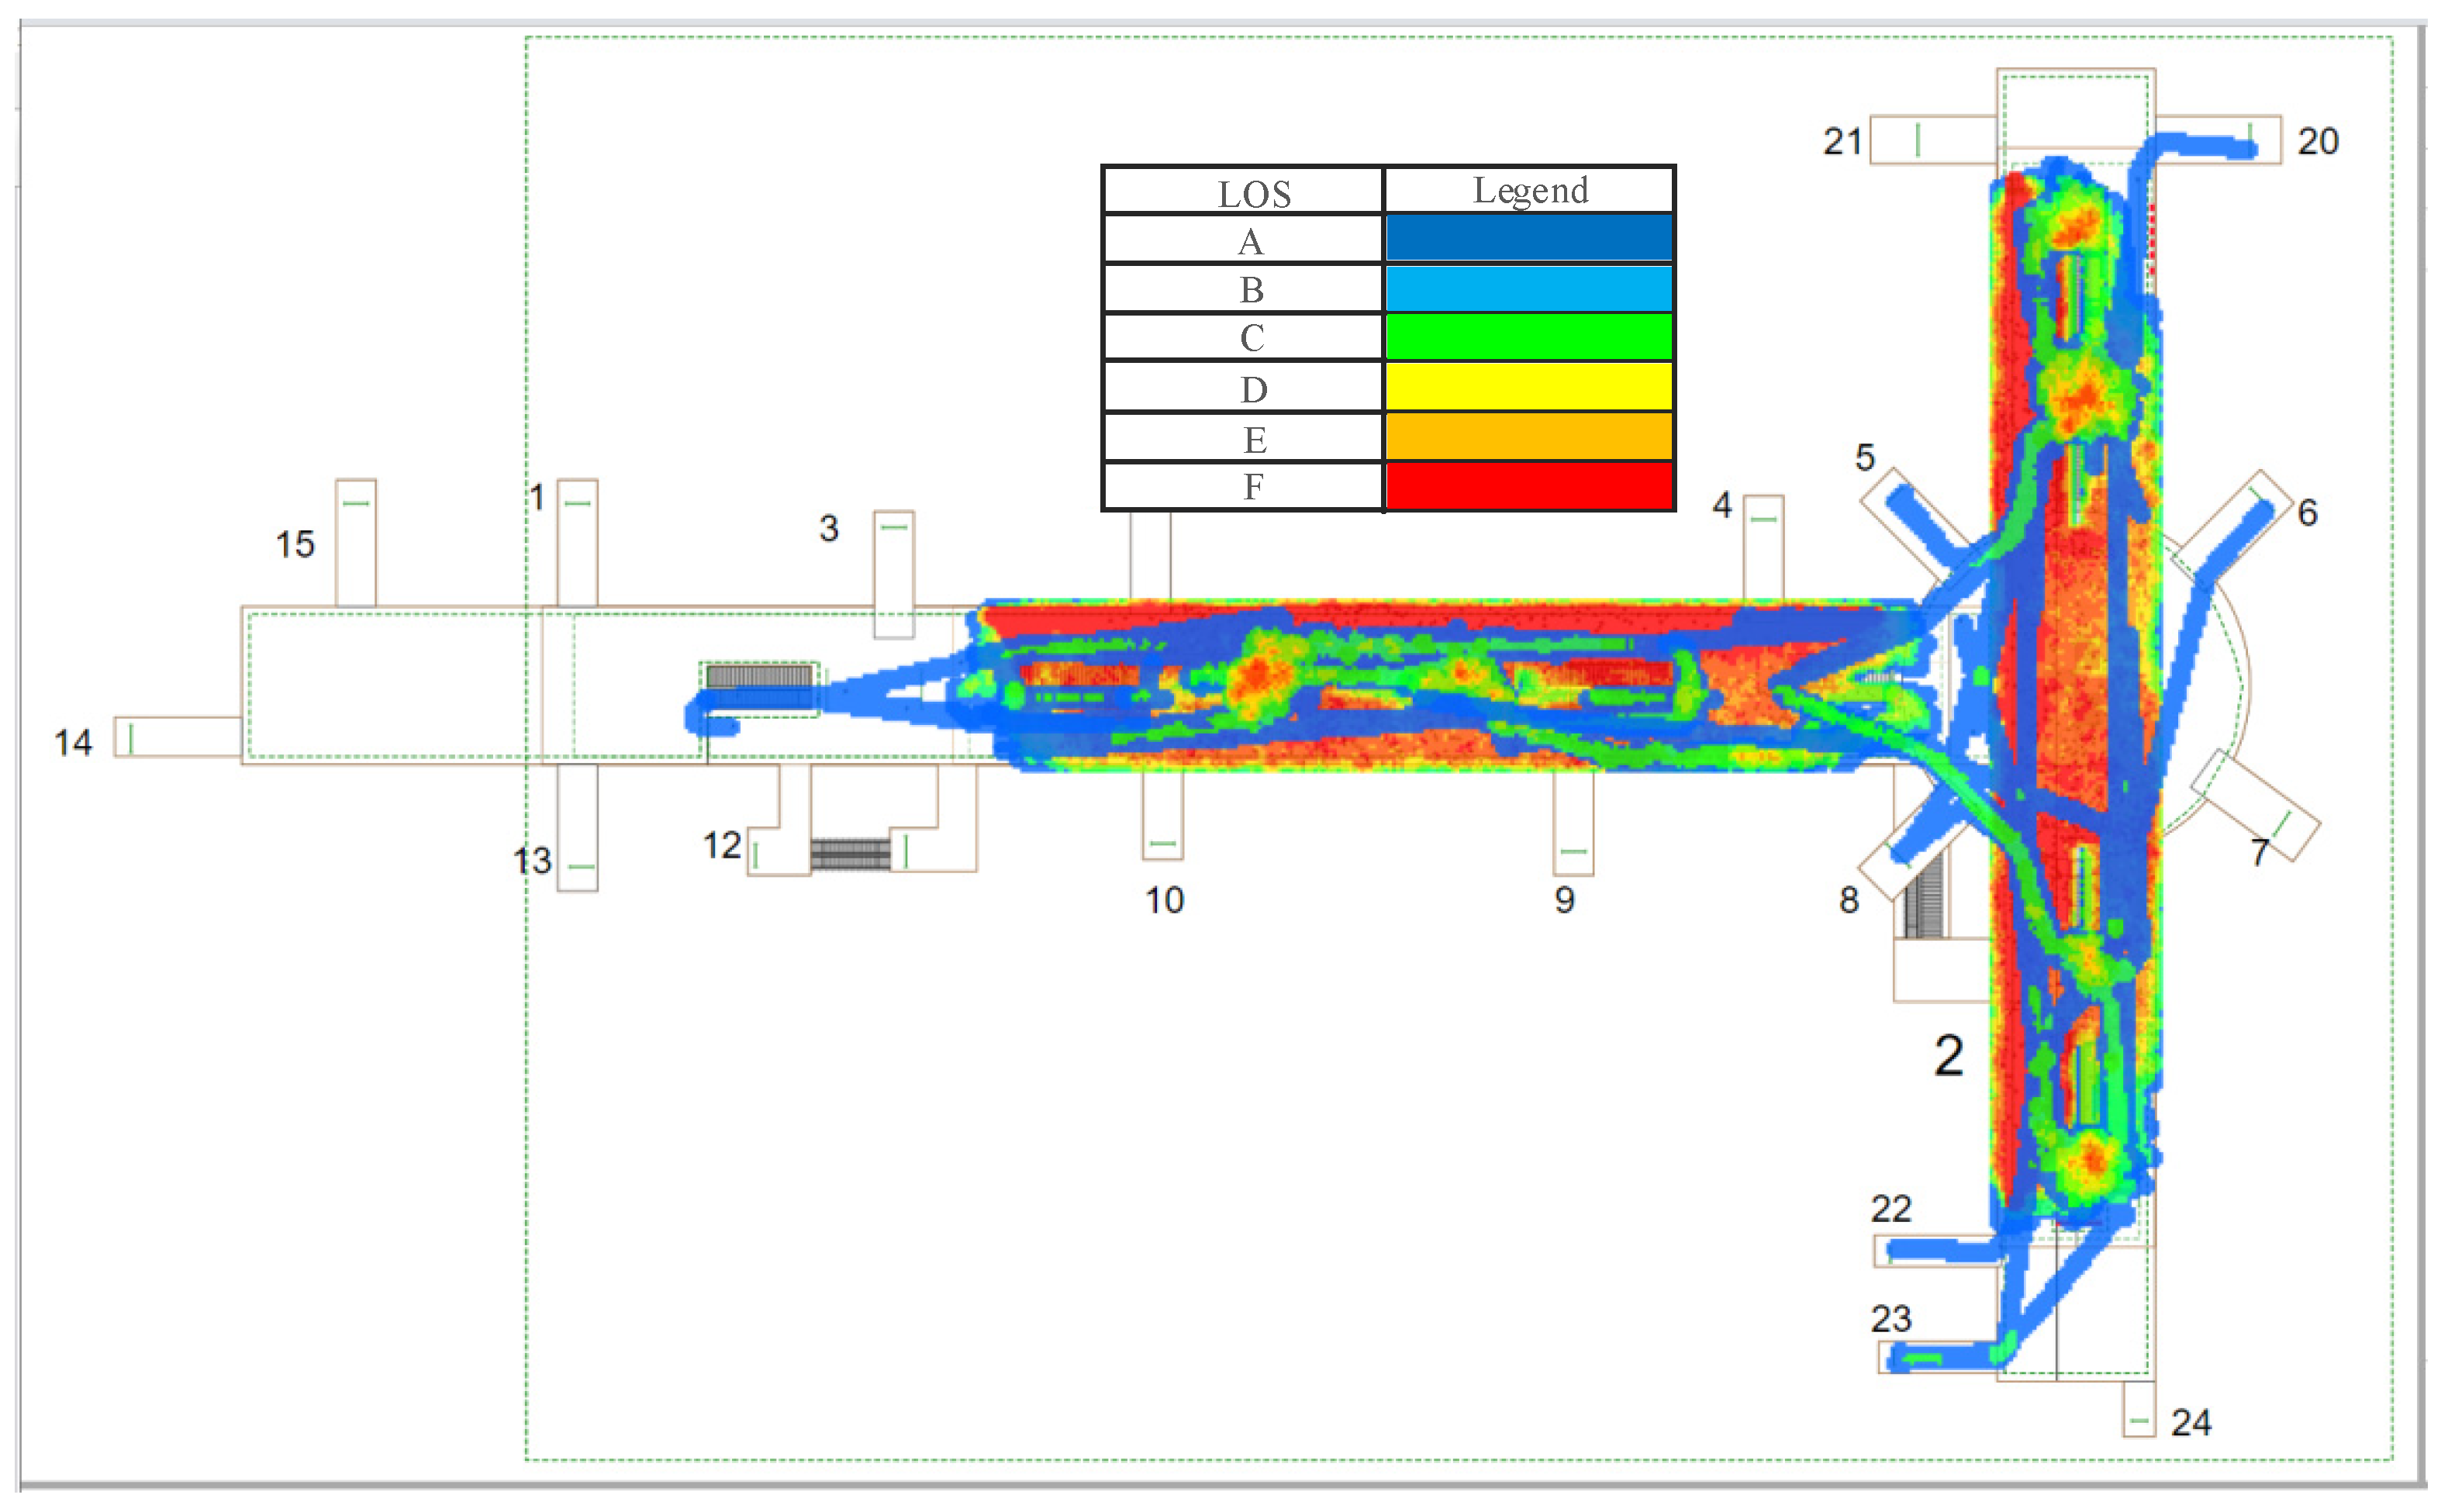
Simulation of distancing observed between 0.4 m and 0.5 m
Figure 9 explicitly shows the performance of pedestrian restricted movement when the running time of the simulation is at 200 s. Allowing for the impact of the COVID-19 pandemic on denseness, low-density aggregation appears in such areas as escalators, stairs, and existing turnstiles in the short queue. This distancing distinctly affects serving efficiency, in comparison to daily life prior to the pandemic. The physical distancing of less than 0.5 m cannot contribute to lowering the risk of infection [
1], and the low bound of the distancing therefore hardly enables prevention, which gets even worse, especially when medical protection facilities are lacking. Hence, the infection risk remains with distancing of about 0.5 m, although rapid restricted movement is feasible.
Next, considering the convenience of implementing a management policy, the observations of distancing are explored per approximate 0.5 m as a simulation step/unit. In
Figure 9,
Figure 10 and
Figure 11, six different colors denote multiple levels of passenger density: (i) serious congestion is depicted by red, (ii) normal dynamics are demonstrated by green, and (iii) sparse flow pattern are indicated by blue. Based on Fruin [
38],
Table 4 shows the densities and space associated with the six different colors of
Figure 9,
Figure 10 and
Figure 11.
- (2)
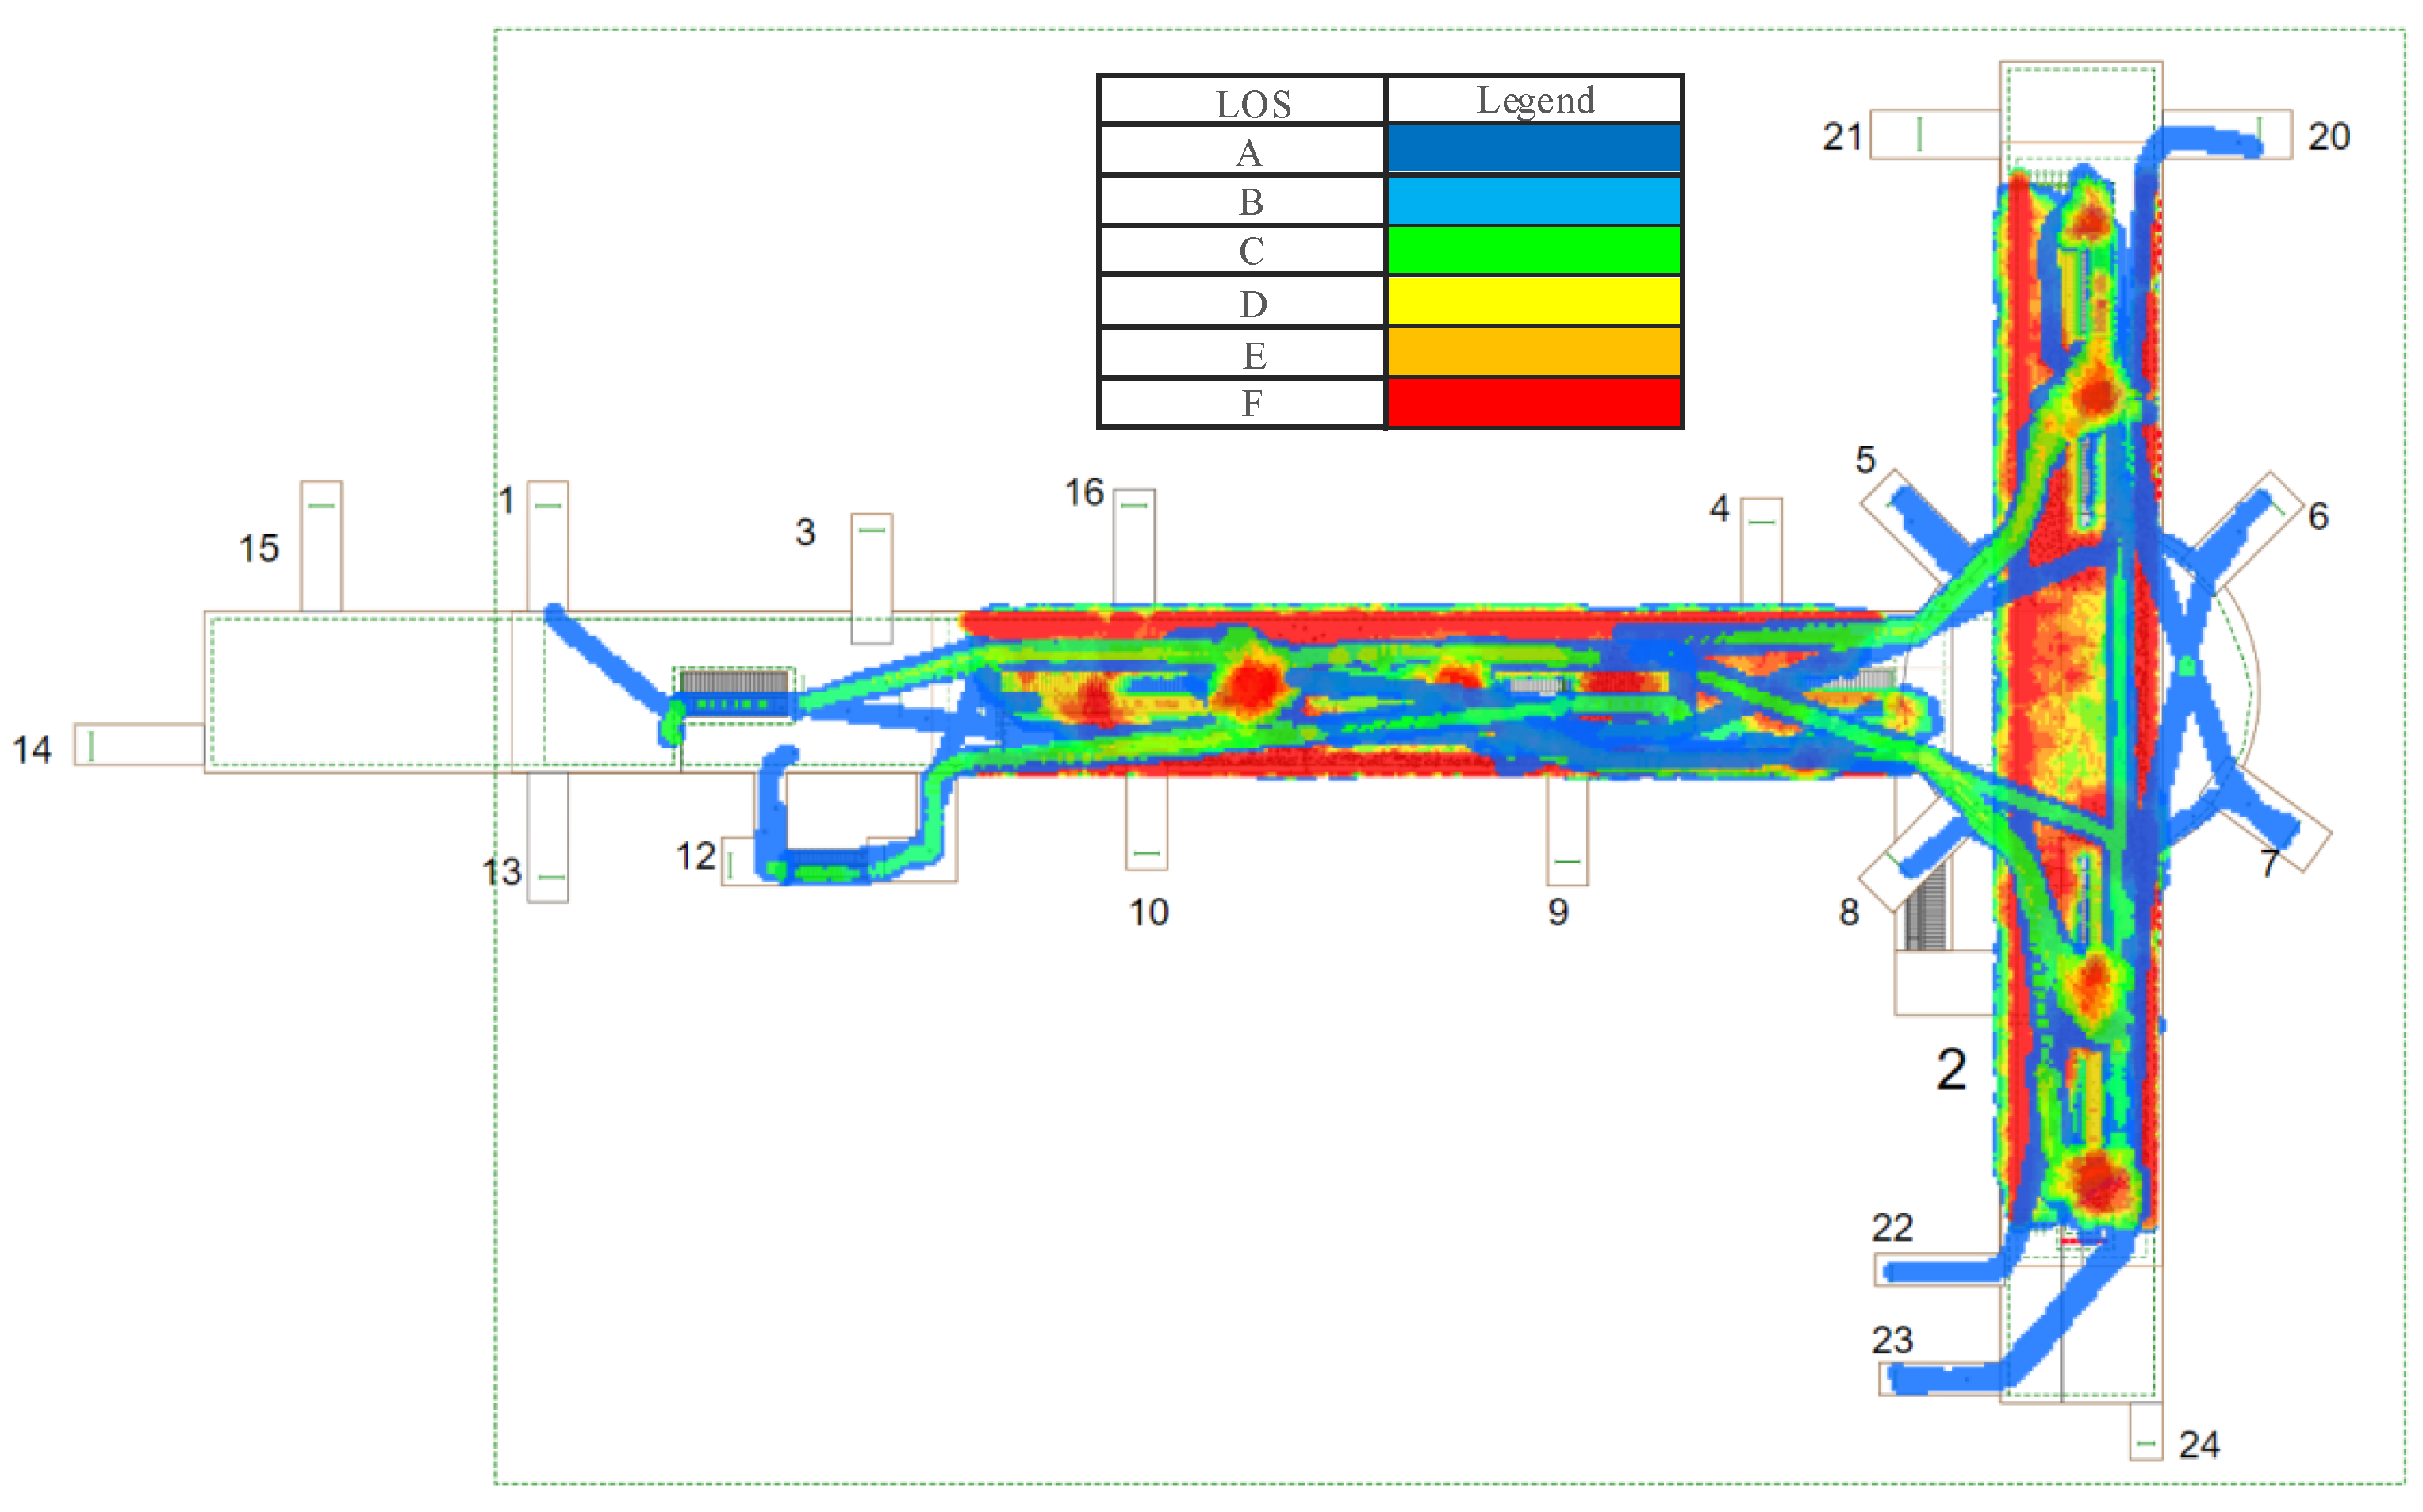
Simulation observing distancing between 0.9 m and 1.0 m
Figure 10 visibly captures the restricted movement situation of pedestrians under observational distancing between 0.9 m and 1.0 m. Allowing for the self-organized pedestrian crowd effect [
35], optimized distancing (about 1.0 m) can reduce a clogging effect from the close distance (about 0.5 m) between pedestrians. Interestingly, the relationship between contagion-prevention social distancing and efficiency is observed to be significant. In other words, distancing dynamics still do not have a completely positive correlation with efficiency.
- (3)
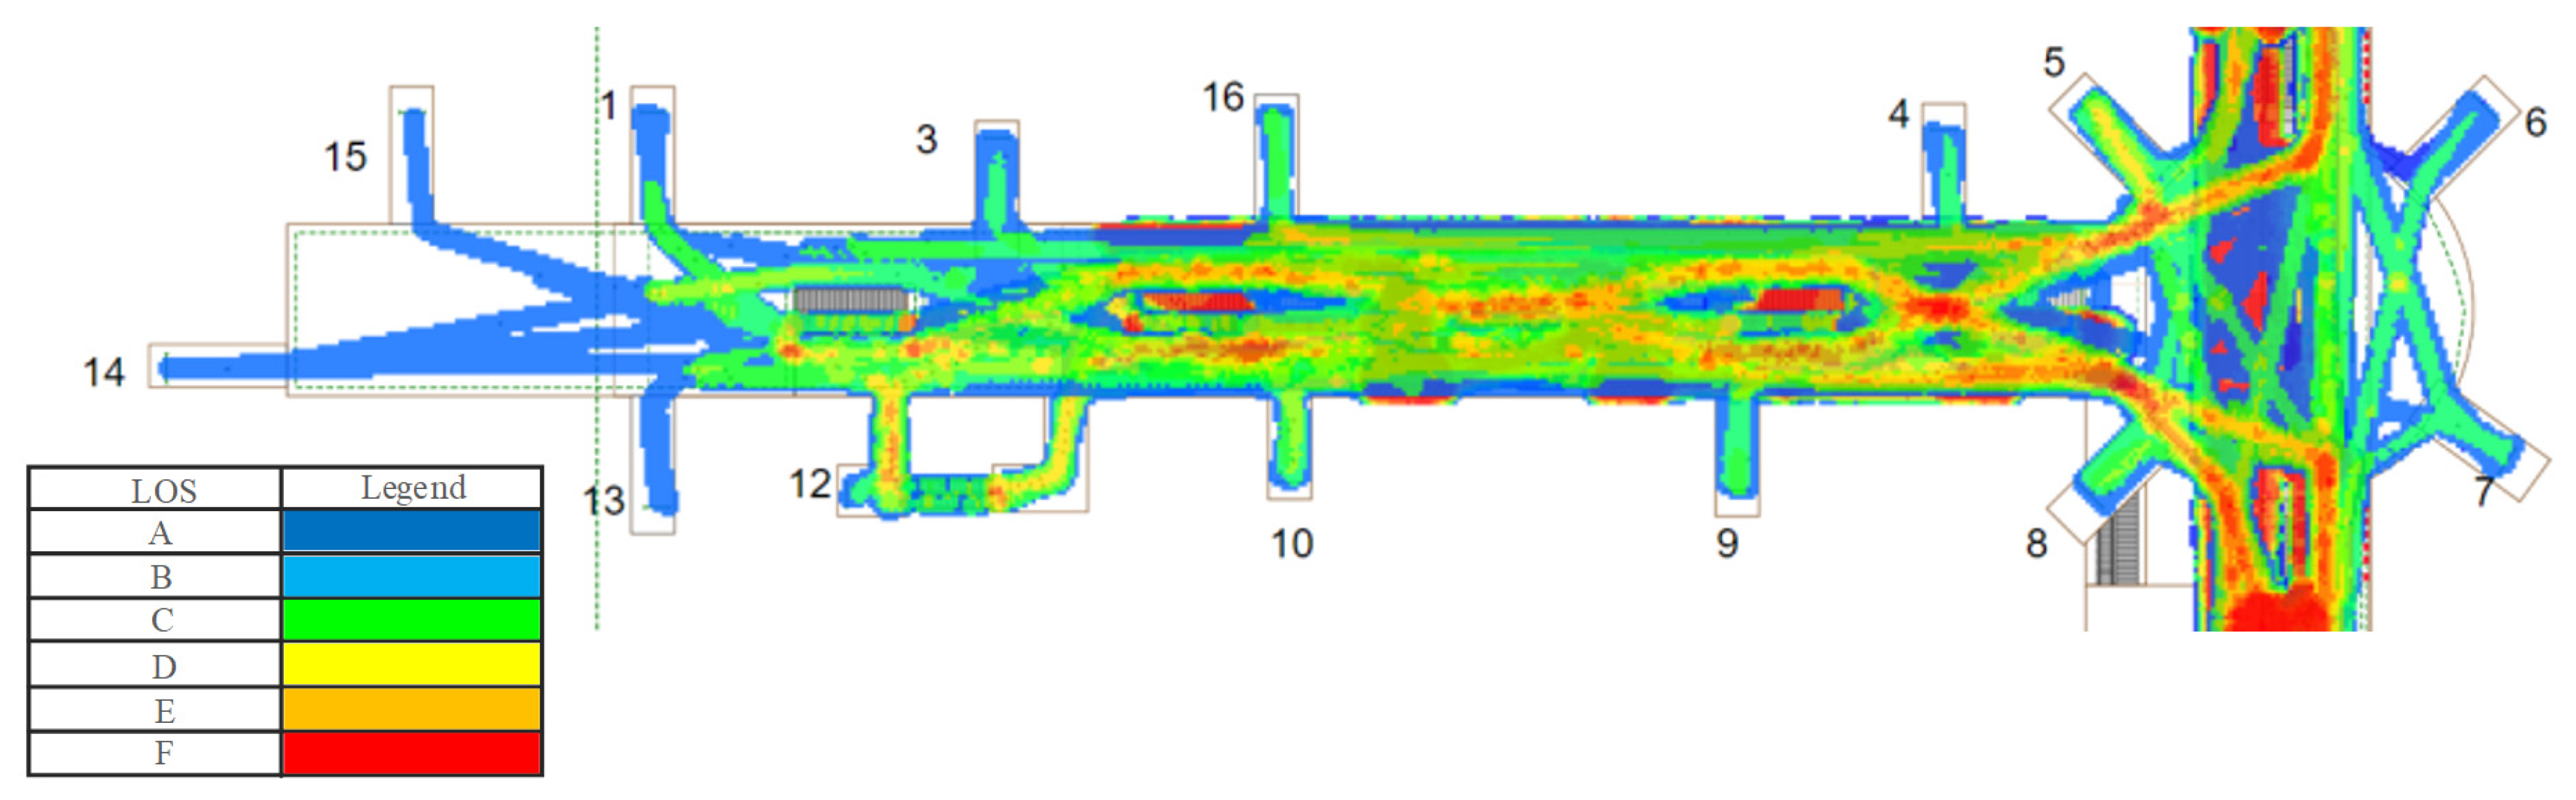
Simulation observing distancing between 1.5 m and 2.0 m
Figure 11 shows the situation with distancing of 1.5–2.0 m. It can be clearly observed that the greater the distancing, the lower the degree of passenger congestion. However, excessive distancing leads to low platform utilization, hence distancing management between 1.5 m and 2.0 m is unfeasible for satisfying the walk efficiency of pedestrians.
4.3. Results
- (1)
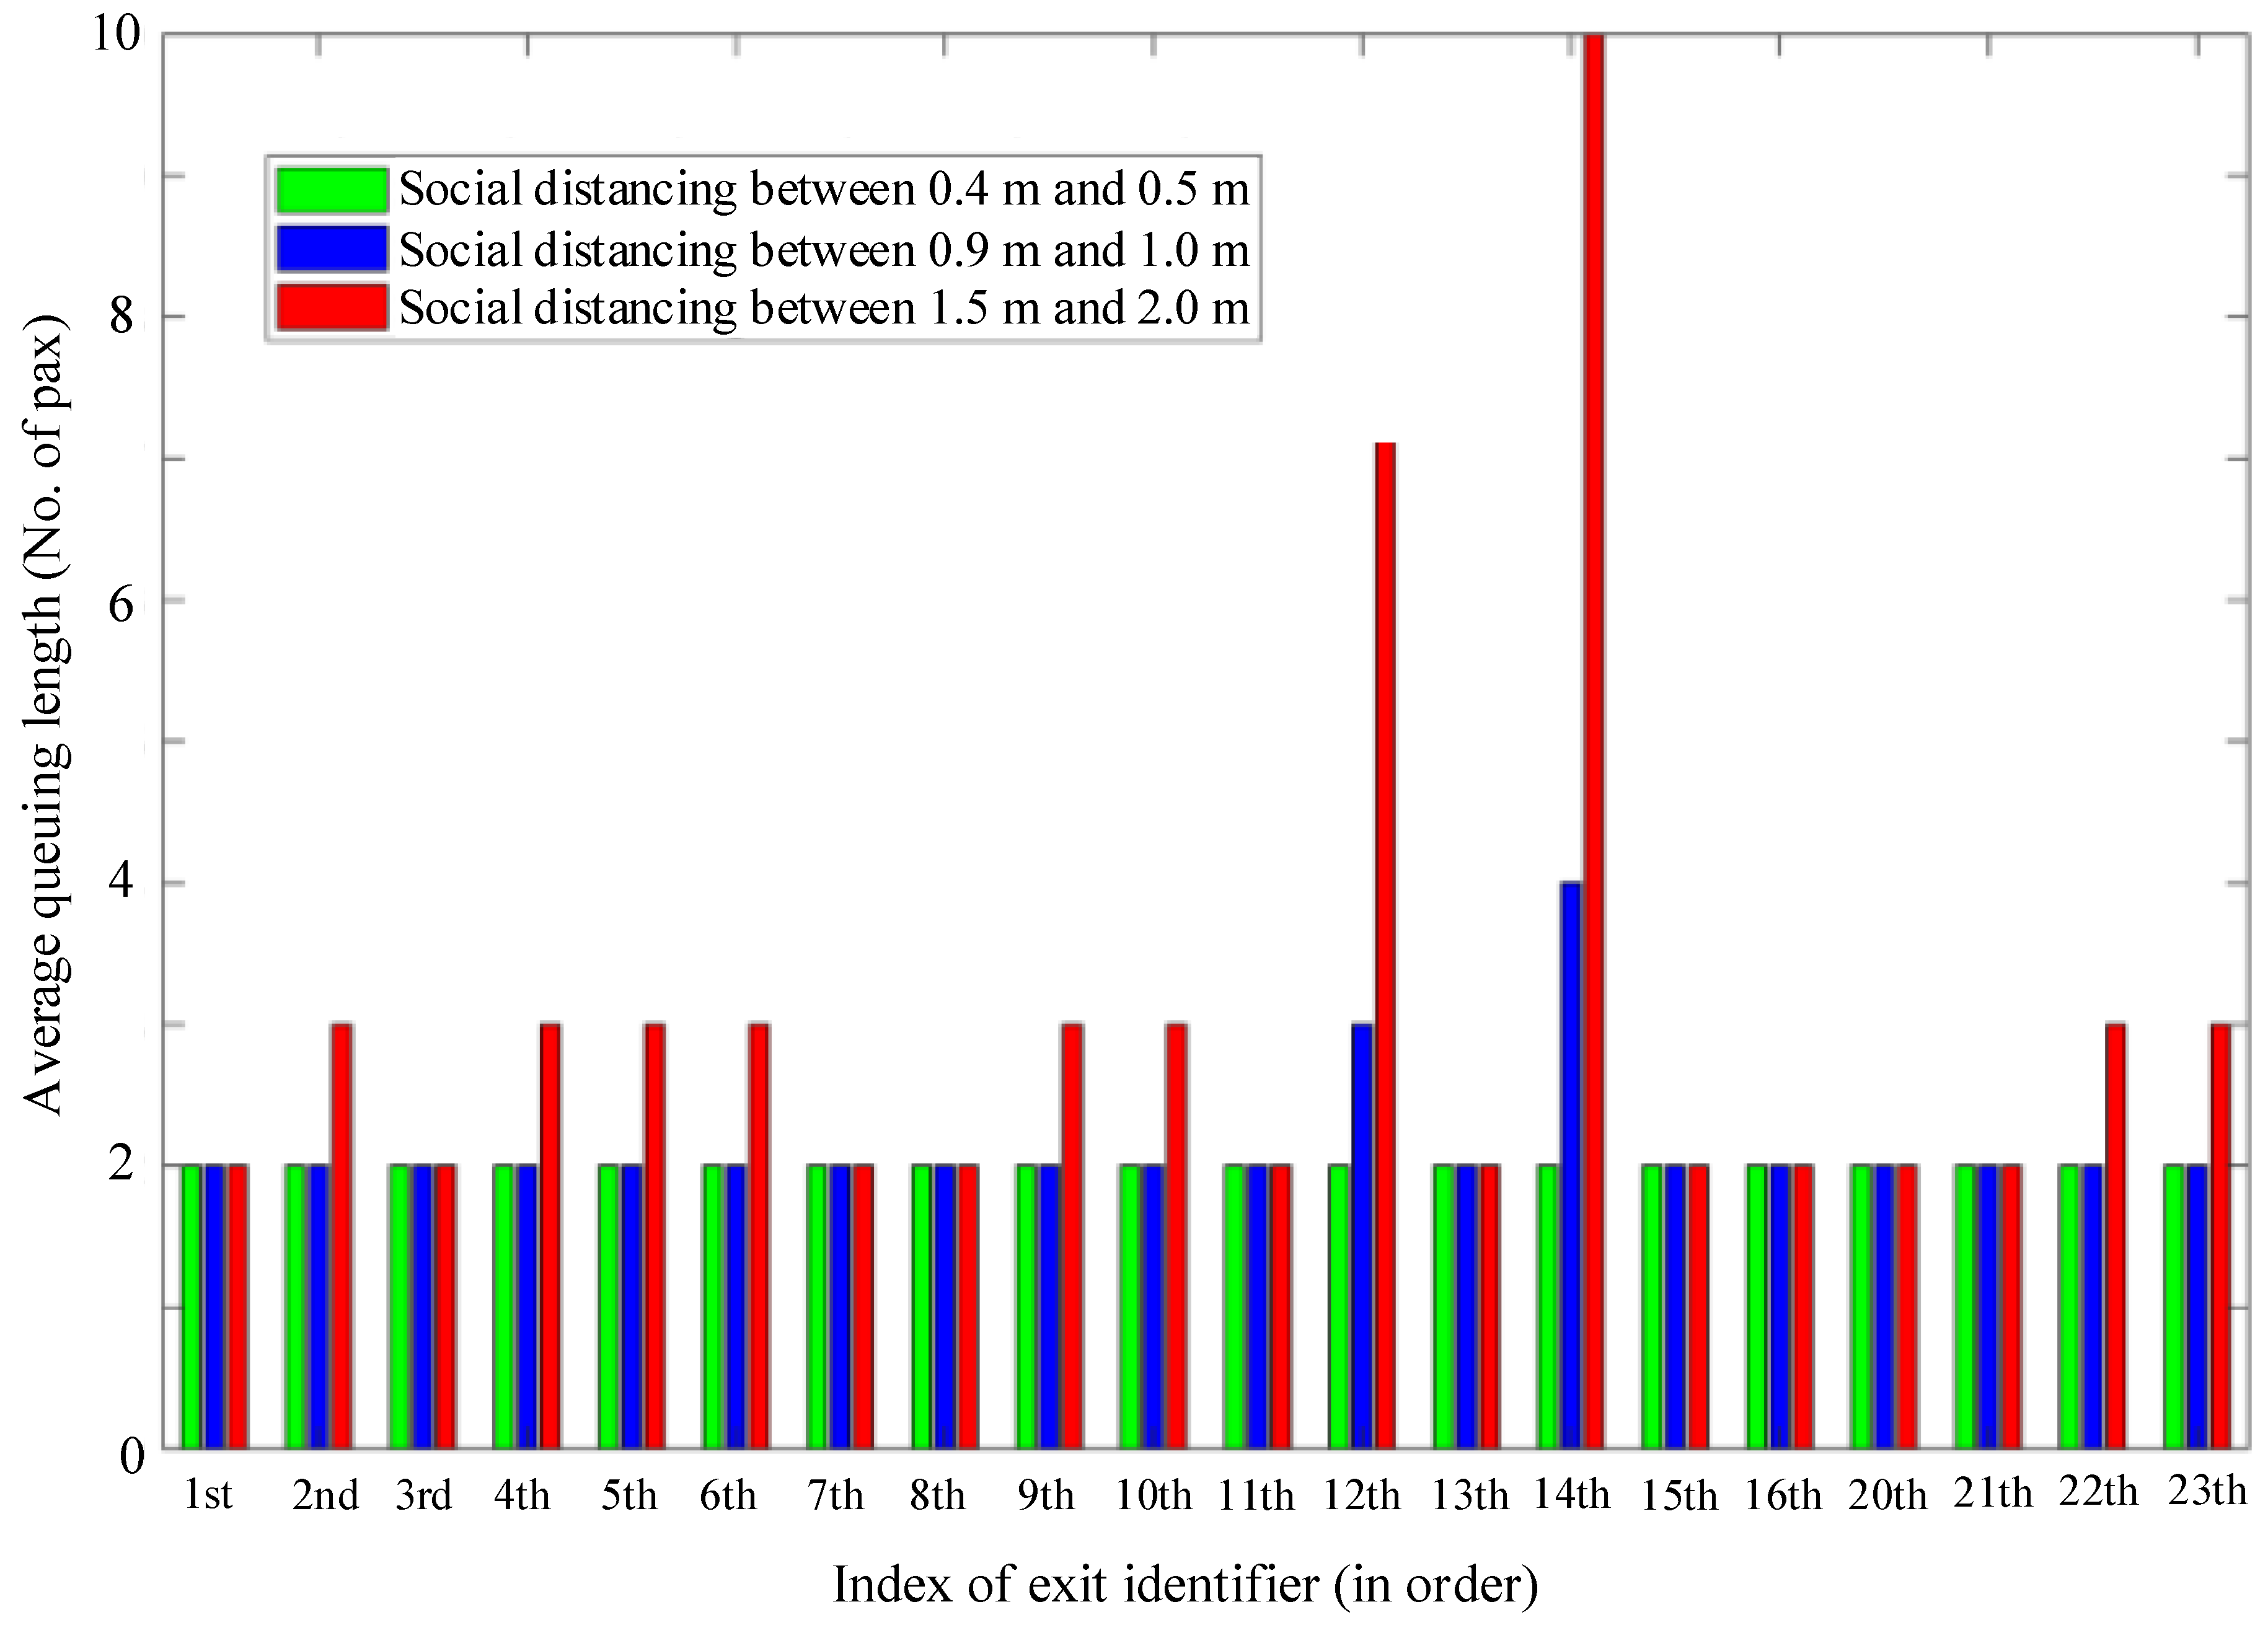
Simulation observing queuing length
Figure 12 illustrates different queuing lengths at individual exits of Xinjiekou Station using different simulation distancing. The corresponding data are referenced in
Appendix B. Passenger data are derived from
Table 2. Evidently, the minimum average queuing length is reached under social distancing between 0.4 m and 0.5 m, including the relevant degree of deviation. In detail,
Figure 12 shows that the social distancing queuing length between 0.9 m and 1.0 m increased by 4.17%, in comparison with the social distancing of about 0.5 m. We observe that 0.5 m is assumed as the ordinary distance without the COVID-19 effect. Hereby, based on queuing theory, the queuing length is defined as the queue of users waiting for the exit service, which discharges people at the rate of 2.6 sec/person [
39] in an ordinary case without the virus’s restrictions. In other words, the queuing length is the number of people in the queue using different social distancing. However, longer distancing, from 1.5 m to 2.0 m, leads to an increase in queuing length up to more than 3 pax (an average increase of 21.22% from the ordinary case). Indeed, this scenario demonstrates worsening service performance through an augmented queue length. This is particularly observed with a considerable delay in the 12th and 14th exits, with a 77.78% and 80.00% increase of complaints about inconvenience. In addition, while
Figure 12 shows minor differences between the cases of 0.4–0.5 m and 0.9–1.0 m (green and blue), the latter results in more space, allowing for more movement flexibility. Generally speaking, the scenario of compromise distancing (about 1.0 m) indicates a somewhat superior tradeoff outcome for the contagion-prevention distance and queuing length (restricted movement efficiency) than the other two scenarios.
- (2)
Simulation observing queuing behaviors and complete boarding times
According to the observation of
individual space in
Section 3.3.2 and restricted movement efficiency of
Figure 9–11, we specify the similar queuing phenomena using different social distancing based on the simulation experiments. The experiments are inspired by Zhou et al. [
40]. Snapshots of the pedestrians’ queuing for alighting and boarding are shown in
Figure 13. The simulation time points are discrete. Case (a) is from 10 s to 50 s, and shows every 10 s, i.e., the queuing situation after 10 s, after 20 s, and after 50 s. Cases (b) and (c) represent five snapshots, with the same number of waiting passengers to case (a), respectively. The entrance to the train is only in the middle, and passengers form a queue on the sides, each with a blue-colored circle, to allow disembarking passengers, with a green-colored circle, to leave the train. From the outset, pedestrians kept the regulated social distancing for queuing until the last passenger alighted. Finally, the two queues overlapped for boarding and still maintained the fixed social distancing. As a result, the greater the social distancing, the further the delay accumulated in the boarding process. This can be observed in
Figure 13a–c.
Figure 13 tests a simulation performance, in which ten passengers are waiting for boarding, and only one passenger is about to alight. Case (a) is the ordinary case without restrictions. In cases (b) and (c), we define the delay time as the extra needed time to complete boarding, in comparison with case (a). The average delay is the mean delay value of the five snapshots of
Figure 13. The total increased delay and average increased delay per passenger of cases (b) and (c) are shown in
Appendix C. Referring to [
22], the average alighting and boarding times are 1.23 s and 1.18 s. Overall, the average increased delays per passenger for completing boarding are 14.1 s and 22.5 s for cases (b) and (c), respectively.
Figure 14 illustrates the total increased delay time for the 10 pax, in comparison with case (a) for each of the five snapshots in
Figure 13, with a total of 921 and 1005 s required for their waiting, or 92.1 s and 100.5 s average per passenger waiting time, for cases (b) and (c), respectively. Consequently, for case (b), with social distancing of 0.9–1.0 m, and case (c), with social distancing of 1.5–2.0 m, the percent of increased delay in the total waiting time, is 15.29% and 22.39% per passenger, respectively.
- (3)
Simulation summary
We observed pedestrian exiting behaviors. The peak value of the simulation is reached once the train arrives, and passengers begin to evacuate based on the multipath choice decisions. We find out that the ladder, turnstile, and corner are prone to congestion. While updating passengers’ exiting process, congestion makes it possible to anticipate its gradual elimination, based on the iteration of the simulation. Indeed, this is consistent with the empirical survey of pedestrian exiting behaviors, indicating that the SFM-based simulation is able to precisely verify the dynamic performance of the in-station passengers.
This lends further validation to the simulation results from the different pedestrian distancing. The greater the pedestrian distancing, the lower the congestion level of the station turns out to be. Moreover, the insufficient utilization rate on the platform has a negative impact on the pedestrians’ exiting and entering efficiency. In order to observe the queuing of pedestrian flow, we check the service efficiency at a given turnstile from the 3D perspective. Given the service efficiency of the fixed turnstile, we observe that the greater the pedestrian distancing, the fewer people can pass the turnstile. Accordingly, it is not easy to generate congestion in front of the turnstile.
5. Analysis
Pedestrian congestion varying in social distancing is primarily derived from different physical surroundings: (i) infrastructures, (ii) control policy and (iii) loading and unloading from trains, which regulate their behaviors and social interactions. To examine the management effectiveness at the distancing between 0.9 m and 1.0 m, we develop a three-phase parameter-based scenario for further analyzing environmental impacts.
5.1. Passenger Management Analysis
Given Xinjiekou Station is the largest transfer station in Asia and is located in the center of the city, the large passenger flow occurs unpredictably. The necessary passenger management is usually implemented. For example, operators can restrict the number of people entering the URT during peak hours. Furthermore, some operators provide real-time passenger control actions to guide the optimal passenger paths to reduce the bottleneck crowding.
To facilitate a direct policy of preventing person-to-person transmission of COVID-19, we investigate the effectiveness of lowering the number of passengers allowed into the URT. The number of passengers exiting from Xinjiekou Station is decreased from 1000 to 600 pax. As shown in
Figure 15, we find that the efficiency of pedestrian-restricted movement is better than the
ordinary situation without any control. A long queue should still occur at escalators, turnstiles, and other infrastructure mechanisms. The term ‘
ordinary situation’ describes normal pedestrian movements (freely in the post-epidemic era) without any distancing rules.
5.2. Bottleneck Congestion Analysis
Our search identified the main infrastructure mechanism, including turnstiles, escalators, and stairs. Considering the infeasibility/difficulty of resetting the location and width of facilities in the real world, it is possible to switch the direction of the escalator as soon as passenger congestion rises. In this case, a typical feature of the bottleneck effect is a long queue in front of the escalator. By means of changing/adding one corridor of a restricted movement path (escalator), efficiency is improved. Complementarily, as the number of passengers queuing in front of the escalator gradually increases, the operators can further guide passengers to the stairs and other paths to evacuate.
5.3. Service Frequency Adjustment
The service frequency in the previous simulation is set to 100 s. This means that the passengers from trains belonging to both Line 1 and Line 2 arrive at the same time at 100 s of simulation. Here, we set the service frequency for another direction of both Line 1 and Line 2 to 300 s.
Figure 16 illustrates the density graphic of the platform, in which the reduced frequency of service and the correlating arrival time on the other side of the train allows sufficient restricted movement time for the accumulated passenger flow, which considerably alleviates the degree of passenger congestion on the platform.
6. Conclusions
It appears that some of the prior management policies at URT to protect public safety rest on the question of how to attain a tradeoff between restricted movement efficiency and social distancing. Note that the single strategy of limiting the number of passengers to enter URT is unable to lower the risk of transmission of COVID-19 without maintaining person-to-person distancing, especially taking certain dramatically congested, bottleneck facilities into account.
This paper focuses on an optimal public management problem between safety distancing and walk efficiency. It is expected to develop and substantiate comprehensive policies concerning the COVID-19 epidemic or other public health events. In the study, we investigated crowd behaviors at multiple service infrastructures, as per testing the different distancing.
We combine pedestrian psychology, pedestrian interaction force, self-driving force and other aspects to calibrate the parameters of SFM. They are utilized as the simulation parameter input and the simulation surroundings. Based on data collection from an online questionnaire survey, conducted in January–May in 2020, we simulate the experimental scenario of Nanjing Xinjiekou Station. By comparing different pedestrian distancing for public management policy in preventing COVID-19 spread, we investigated passengers’ behaviors. In particular, we referred to the increased congestion phenomena at escalators and turnstiles. Furthermore, we developed optimal public management schemes as an auxiliary guide-based policy.
The queuing length with social distancing between 0.9 m and 1.0 m (case (b)), and between 1.5 m to 2.0 m (case (c)) are increased by 4.2% and 22.2%, respectively, in comparison with ordinary social distancing of about 0.5 m (case (a)). The average delays per passenger for completing boarding are 14.1 s and 22.5 s for cases (b) and (c), which leads to 15.29% and 22.39% increases, compared to case (a), for each passenger, respectively.
This study’s methodology and results can, to some extent, be applied to other URT stations because of the similarities in facing a high-density environment. Further recommended will be to consider: (i) including human’s perception, URT station design, topology, and more; and (ii) a comparison of different procedures used worldwide to decide on social distancing during a pandemic.
Author Contributions
Conceptualization, Z.C., A.C., Z.W., S.Z. and Y.W.; methodology, Z.C., A.C., Z.W., S.Z. and Y.W.; software, Z.W., Z.C. and A.C.; validation, Z.C., A.C., Z.W., S.Z. and Y.W.; formal analysis, Z.C., A.C., Z.W., S.Z. and Y.W.; investigation, Z.C., A.C., Z.W., S.Z. and Y.W.; resources, Z.W.; data curation, Z.W.; writing—original draft preparation, Z.C., A.C., Z.W., S.Z. and Y.W.; writing—review and editing, Z.C., A.C., Z.W., S.Z. and Y.W.; visualization, Z.C., A.C., Z.W., S.Z. and Y.W.; supervision, Z.C., A.C., Z.W., S.Z. and Y.W.; project administration, Z.C. and S.Z.; funding acquisition, Z.C. and S.Z. All authors have read and agreed to the published version of the manuscript.
Funding
This study was supported by the National Natural Science Foundation of China (72101126), the Transportation Operation Subsidy Project of Guangxi Key Laboratory of International Join for China-ASEAN Comprehensive Transportation (No. 21-220-21), the National Natural Science Foundation of China (72101127), the Jiaxing Key Laboratory of Smart Transportations Open Project Funding (ZHJT202303), and the Technology and Equipment of Rail Transit Operation and Maintenance (2022YW004).
Data Availability Statement
Data are contained within the article.
Conflicts of Interest
The authors declare no conflicts of interest.
Appendix A. Survey-Extracted Statistical Results for Pedestrians Who Used the Exit Doors of Xinjiekou URT Station
Table A1.
1st Question. About gender (Single choice).
Table A2.
2nd Question. About age (Single choice).
Table A3.
3rd Question. Which exit do you usually use to leave Xinjiekou? (Single choice).
Table A3.
3rd Question. Which exit do you usually use to leave Xinjiekou? (Single choice).
| Exit | Replies | Percentage |
|---|
| 1st exit (Nandayang Mall, Nanjing, China) | 23 | ![Systems 12 00151 i041]() 4.56% 4.56% |
| 2nd exit (Nandayang Mall, Nanjing, China) | 30 | ![Systems 12 00151 i042]() 5.95% 5.95% |
| 3rd exit (Dongfang Mall, Nanjing, China) | 25 | ![Systems 12 00151 i043]() 4.96% 4.96% |
| 4th exit (Intersection Between Hanzhong Road and Hanzhong North Road, Nanjing, China) | 12 | ![Systems 12 00151 i044]() 2.38% 2.38% |
| 5th exit (Nanjing International Finance Center and China Merchants Bank, Nanjing, China) | 33 | ![Systems 12 00151 i045]() 6.55% 6.55% |
| 6th exit (West of Zhongshan Road and North of Hanzhong Road, Nanjing, China) | 8 | ![Systems 12 00151 i046]() 1.59% 1.59% |
| 7th exit (Deji plaza, ICBC, and Bank of China, Nanjing, China) | 28 | ![Systems 12 00151 i047]() 5.56% 5.56% |
| 8th exit (Nanjing Xinjiekou Department Store Co., Ltd., Nanjing, China ) | 26 | ![Systems 12 00151 i048]() 5.16% 5.16% |
| 9th exit (Nanjing Xinjiekou Department Store Co., Ltd., Nanjing, China) | 13 | ![Systems 12 00151 i049]() 2.58% 2.58% |
| 10th exit (Nanjing Xinjiekou Department Store Co., Ltd., Nanjing, China) | 17 | ![Systems 12 00151 i050]() 3.37% 3.37% |
| 11th exit (Zhenghong Street Underground Commercial Street, Nanjing, China) | 24 | ![Systems 12 00151 i051]() 4.76% 4.76% |
| 12th exit (Pedestrian Mall, and East of Zhongshan South Road, Nanjing, China) | 41 | ![Systems 12 00151 i052]() 8.13% 8.13% |
| 13th exit (Suning Tesco Xinjiekou Flagship Store and Dahua Theater, Nanjing, China) | 22 | ![Systems 12 00151 i053]() 4.37% 4.37% |
| 14th exit (Central Mall, Nanjing, China) | 54 | ![Systems 12 00151 i054]() 10.71% 10.71% |
| 15th exit (Dayang Mall, Nanjing, China) | 28 | ![Systems 12 00151 i055]() 5.56% 5.56% |
| 16th exit (Dongfang Mall, Nanjing, China) | 23 | ![Systems 12 00151 i056]() 4.56% 4.56% |
| 20th exit (Jinying Guoji Mall, Nanjing, China) | 28 | ![Systems 12 00151 i057]() 5.56% 5.56% |
| 21st exit (Underground Passage of Jinying Guoji Mall, Nanjing, China) | 23 | ![Systems 12 00151 i058]() 4.56% 4.56% |
| 22nd exit (Nanjing Xinjiekou Department Store Co., Ltd., Nanjing, China) | 30 | ![Systems 12 00151 i059]() 5.95% 5.95% |
| 23rd exit (Xinhua Bookstore, Nanjing, China) | 16 | ![Systems 12 00151 i060]() 3.17% 3.17% |
| Total valid answers | 504 | ![Systems 12 00151 i061]() 100.00% 100.00% |
Table A4.
4th Question. What is your trip purpose? (Single choice).
Table A5.
5th Question. Did you feel crowded at the exit? (Single choice).
Table A6.
6th Question. Are you a Nanjing native? (Single choice).
Appendix B. Queuing Lengths at Individual Exits under Different Simulated Social Distancing (SD), in Pax
| Exit | SD between
0.4 m and 0.5 m
(pax) | DD
(%) | SD between
0.9 m and 1.0 m
(pax) | DD
(%) | SD between
1.5 m and 2.0 m
(pax) | DD
(%) |
|---|
| 1st exit | 2 | 0 | 2 | 0 | 2 | 0.00% |
| 2nd exit | 2 | 0 | 2 | 0 | 3 | 33.33% |
| 3rd exit | 2 | 0 | 2 | 0 | 2 | 0.00% |
| 4th exit | 2 | 0 | 2 | 0 | 3 | 33.33% |
| 5th exit | 2 | 0 | 2 | 0 | 3 | 33.33% |
| 6th exit | 2 | 0 | 2 | 0 | 3 | 33.33% |
| 7th exit | 2 | 0 | 2 | 0 | 2 | 0.00% |
| 8th exit | 2 | 0 | 2 | 0 | 2 | 0.00% |
| 9th exit | 2 | 0 | 2 | 0 | 3 | 33.33% |
| 10th exit | 2 | 0 | 2 | 0 | 3 | 33.33% |
| 11th exit | 2 | 0 | 2 | 0 | 2 | 0.00% |
| 12th exit | 2 | 0 | 3 | 33.33% | 9 | 77.78% |
| 13th exit | 2 | 0 | 2 | 0 | 2 | 0.00% |
| 14th exit | 2 | 0 | 4 | 50.00% | 10 | 80.00% |
| 15th exit | 2 | 0 | 2 | 0 | 2 | 0.00% |
| 16th exit | 2 | 0 | 2 | 0 | 2 | 0.00% |
| 20th exit | 2 | 0 | 2 | 0 | 2 | 0.00% |
| 21st exit | 2 | 0 | 2 | 0 | 2 | 0.00% |
| 22nd exit | 2 | 0 | 2 | 0 | 3 | 33.33% |
| 23rd exit | 2 | 0 | 2 | 0 | 3 | 33.33% |
| Average | 2 | 0 | 2.15 ≈ 2 | 4.17% | 3.15 ≈ 3 | 21.22% |
Appendix C. Delay Times and Its Increased Percentage for the Three Cases Examined, in Comparison with the Base Case (a)
| Subject | Boarding Time-Point, Corresponding to the Base Case (a) | Average Delay per Passenger (s) |
|---|
| Base Case (a) | 10 s | 20 s | 30 s | 40 s | 50 s | -- |
| Case (b) | 10 s | 23 s | 36 s | 50 s | 63 s | -- |
| Increased delay (s) per passenger | 0 | 3 | 6 | 10 | 13 | 7.25 |
| Total delay of pax (s) | 0 | 27 | 48 | 40 | 26 | 14.10 |
| Case (c) | 10 s | 25 s | 40 s | 55 s | 70 s | -- |
| Increased delay (s) per passenger | 0 | 5 | 10 | 15 | 20 | 12.50 |
| Total delay of pax (s) | 0 | 45 | 80 | 60 | 40 | 22.50 |
References
- Chu, D.K.; Akl, E.A.; Duda, S.; Solo, K.; Yaacoub, S.; Schünemann, H.J.; El-Harakeh, A.; Bognanni, A.; Lotfi, T.; Loeb, M.; et al. Physical distancing, face masks, and eye protection to prevent person-to-person transmission of SARS-CoV-2 and COVID-19: A systematic review and meta-analysis. Lancet 2020, 395, 1973–1987. [Google Scholar] [CrossRef] [PubMed]
- Helbing, D.; Keltsch, J.; Molnar, P. Modelling the evolution of human trail systems. Nature 1997, 388, 47–50. [Google Scholar] [CrossRef] [PubMed]
- Yuan, F.; Sun, H.; Kang, L.; Wu, J. Passenger flow control strategies for urban rail transit networks. Appl. Math. Model. 2020, 82, 168–188. [Google Scholar] [CrossRef]
- Jiang, Z.; Fan, W.; Liu, W.; Zhu, B.; Gu, J. Reinforcement learning approach for coordinated passenger inflow control of urban rail transit in peak hours. Transp. Res. Part C Emerg. Technol. 2018, 88, 1–16. [Google Scholar] [CrossRef]
- Li, Y.; Wang, X.; Sun, S.; Ma, X.; Lu, G. Forecasting short-term subway passenger flow under special events scenarios using multiscale radial basis function networks. Transp. Res. Part C Emerg. Technol. 2017, 77, 306–328. [Google Scholar] [CrossRef]
- Dubroca-Voisin, M.; Kabalan, B.; Leurent, F. On pedestrian traffic management in railway stations: Simulation needs and model assessment. Transp. Res. Procedia 2019, 37, 3–10. [Google Scholar] [CrossRef]
- Burdzik, R.; Chema, W.; Celiński, I. A study on passenger flow model and simulation in aspect of COVID-19 spreading on public transport bus stops. J. Public Transp. 2023, 25, 100063. [Google Scholar] [CrossRef]
- Yao, X.; Han, B.; Yu, D.; Ren, H. Simulation-Based Dynamic Passenger Flow Assignment Modelling for a Schedule-Based Transit Network. Discret. Dyn. Nat. Soc. 2017, 2017, 2890814. [Google Scholar] [CrossRef]
- Zhao, Z.; Liang, D. Pedestrian Flow Characteristic of Metro Station along with the Mall. Procedia Eng. 2016, 135, 602–606. [Google Scholar] [CrossRef]
- Jin, C.; Jiang, R.; Wong, S.C.; Xie, S.; Li, D.; Guo, N.; Wang, W. Observational characteristics of pedestrian flows under high-density conditions based on controlled experiments. Transp. Res. Part C Emerg. Technol. 2019, 109, 137–154. [Google Scholar] [CrossRef]
- Shang, P.; Li, R.; Guo, J.; Xian, K.; Zhou, X. Integrating Lagrangian and Eulerian observations for passenger flow state estimation in an urban rail transit network: A space-time-state hyper network-based assignment approach. Transp. Res. Part B Methodol. 2019, 121, 135–167. [Google Scholar] [CrossRef]
- Li, C.; Ma, J.; Tom HLuan Zhou, X.; Xiong, L. An incentive-based optimizing strategy of service frequency for an urban rail transit system. Transp. Res. Part E Logist. Transp. Rev. 2018, 118, 106–122. [Google Scholar] [CrossRef]
- Wang, Y.; Tang, T.; Ning, B.; Van Den Boom, T.J.; De Schutter, B. Passenger-demands-oriented train scheduling for an urban rail transit network. Transp. Res. Part C Emerg. Technol. 2015, 60, 1–23. [Google Scholar] [CrossRef]
- Wang, Y.; D’Ariano, A.; Yin, J.; Meng, L.; Tang, T.; Ning, B. Passenger demand oriented train scheduling and rolling stock circulation planning for an urban rail transit line. Transp. Res. Part B Methodol. 2018, 118, 193–227. [Google Scholar] [CrossRef]
- Yin, J.; Yang, L.; Tang, T.; Gao, Z.; Ran, B. Dynamic passenger demand oriented metro train scheduling with energy-efficiency and waiting time minimization: Mixed-integer linear programming approaches. Transp. Res. Part B Methodol. 2017, 97, 182–213. [Google Scholar]
- Hoogendoorn, S.P.; Bovy, P.H. Pedestrian route-choice and activity scheduling theory and models. Transp. Res. Part B Methodol. 2004, 38, 169–190. [Google Scholar] [CrossRef]
- Tong, W.; Cheng, L. Simulation of Pedestrian Flow Based on Multi-Agent. Procedia-Soc. Behav. Sci. 2013, 96, 17–24. [Google Scholar] [CrossRef]
- Weng, J.; Zheng, Y.; Qu, X.; Yan, X. Development of a maximum likelihood regression tree-based model for predicting subway incident delay. Transp. Res. Part C Emerg. Technol. 2015, 57, 30–41. [Google Scholar] [CrossRef]
- Xiao, Y.; Gao, Z.; Qu, Y.; Li, X. A pedestrian flow model considering the impact of local density: Voronoi diagram based heuristics approach. Transp. Res. Part C Emerg. Technol. 2016, 68, 566–580. [Google Scholar] [CrossRef]
- Helbing, D.; Molnar, P. Social force model for pedestrian dynamics. Phys. Rev. E 1995, 51, 4282. [Google Scholar]
- Zheng, X.; Li, H.; Meng, L.; Xu, X.; Chen, X. Improved social force model based on exit selection for microscopic pedestrian simulation in subway station. J. Cent. South Univ. 2015, 22, 4490–4497. [Google Scholar] [CrossRef]
- Li, Z.; Lo, S.M.; Ma, J.; Luo, X.W. A study on passengers’ alighting and boarding process at metro platform by computer simulation. Transp. Res. Part A Policy Pract. 2020, 132, 840–854. [Google Scholar] [CrossRef]
- Xu, X.; Liu, J.; Li, H.; Hu, J. Analysis of subway station capacity with the use of queueing theory. Transp. Res. Part C Emerg. Technol. 2014, 38, 28–43. [Google Scholar] [CrossRef]
- Jiang, Y.; Chen, B.; Li, X.; Ding, Z. Dynamic navigation field in the social force model for pedestrian evacuation. Appl. Math. Model. 2020, 80, 815–826. [Google Scholar] [CrossRef]
- Xu, X.Y.; Liu, J.; Li, H.Y.; Jiang, M. Capacity-oriented passenger flow control under uncertain demand: Algorithm development and real-world case study. Transp. Res. Part E Logist. Transp. Rev. 2016, 87, 130–148. [Google Scholar] [CrossRef]
- Stubenschrott, M.; Kogler, C.; Matyus, T.; Seer, S. A dynamic pedestrian route choice model validated in a high density subway station. Transp. Res. Procedia 2014, 2, 376–384. [Google Scholar] [CrossRef]
- Chen, X.; Li, H.; Miao, J.; Jiang, S.; Jiang, X. A multiagent-based model for pedestrian simulation in subway stations. Simul. Model. Pract. Theory 2017, 71, 134–148. [Google Scholar] [CrossRef]
- Zhang, Q.; Han, B.; Li, D. Modeling and simulation of passenger alighting and boarding movement in Beijing metro stations. Transp. Res. Part C Emerg. Technol. 2008, 16, 635–649. [Google Scholar] [CrossRef]
- Feng, S.; Xin, M.; Lv, T.; Hu, B. A novel evolving model of urban rail transit networks based on the local-world theory. Physica A 2019, 535, 122227. [Google Scholar] [CrossRef]
- Zheng, L.; Peng, X.; Wang, L.; Sun, D. Simulation of pedestrian evacuation considering emergency spread and pedestrian panic. Physica A 2019, 522, 167–181. [Google Scholar] [CrossRef]
- AnyLogic. Commercial Simulation Software Including AI for Transportation and Pedestrians. 2018. Available online: https://www.anylogic.com/resources/educational-videos/simulating-a-pedestrian-crossing/ (accessed on 5 March 2018).
- Zuo, J.; Shi, J.; Li, C.; Mu, T.; Zeng, Y.; Dong, J. Simulation and optimization of pedestrian evacuation in high-density urban areas for effectiveness improvement. Environ. Impact Assess. Rev. 2021, 87, 106521. [Google Scholar] [CrossRef]
- Liu, L.; Chen, H. Microscopic Simulation-Based Pedestrian Distribution Service Network in Urban Rail Station. Transp. Res. Interdiscip. Perspect. 2021, 9, 100313. [Google Scholar] [CrossRef]
- Zhang, L.; Li, M.; Wang, Y. Research on Design Optimization of Subway Station Transfer Entrance Based on AnyLogic. Procedia Comput. Sci. 2022, 208, 310–318. [Google Scholar] [CrossRef]
- Helbing, D.; Buzna, L.; Johansson, A.; Werner, T. Self-organized pedestrian crowd dynamics: Experiments, simulations, and design solutions. Transp. Sci. 2005, 39, 1–24. [Google Scholar] [CrossRef]
- Zhang, Q.; Han, B. Simulation model of pedestrian interactive behavior. Phys. A Stat. Mech. Its Appl. 2011, 390, 636–646. [Google Scholar] [CrossRef]
- Chandra, S.; Bharti, A.K. Speed distribution curves for pedestrians during walking and crossing. Procedia-Soc. Behav. Sci. 2013, 104, 660–667. [Google Scholar] [CrossRef]
- Fruin, J.J. Pedestrian Planning and Design; Metropolitan Association of Urban Designers & Environmental Planners: New York, NY, USA, 1971. [Google Scholar]
- Chang, D. Quantified Study of Microscopic Pedestrian Behavior Parameters in Subway. Ph.D. Thesis, Beijing Jiaotong University, Beijing, China, 2010. [Google Scholar]
- Zhou, M.; Dong, H.; Wang, F.Y.; Zhao, Y.; Gao, S.; Ning, B. Field observations and modeling of waiting pedestrian at subway platform. Inf. Sci. 2019, 504, 136–160. [Google Scholar] [CrossRef]
Figure 1.
Framework of the proposed simulation-based methodology.
Figure 1.
Framework of the proposed simulation-based methodology.
Figure 2.
Pedestrian Library simulation modeling description.
Figure 2.
Pedestrian Library simulation modeling description.
Figure 3.
Xinjiekou Station simulation structure.
Figure 3.
Xinjiekou Station simulation structure.
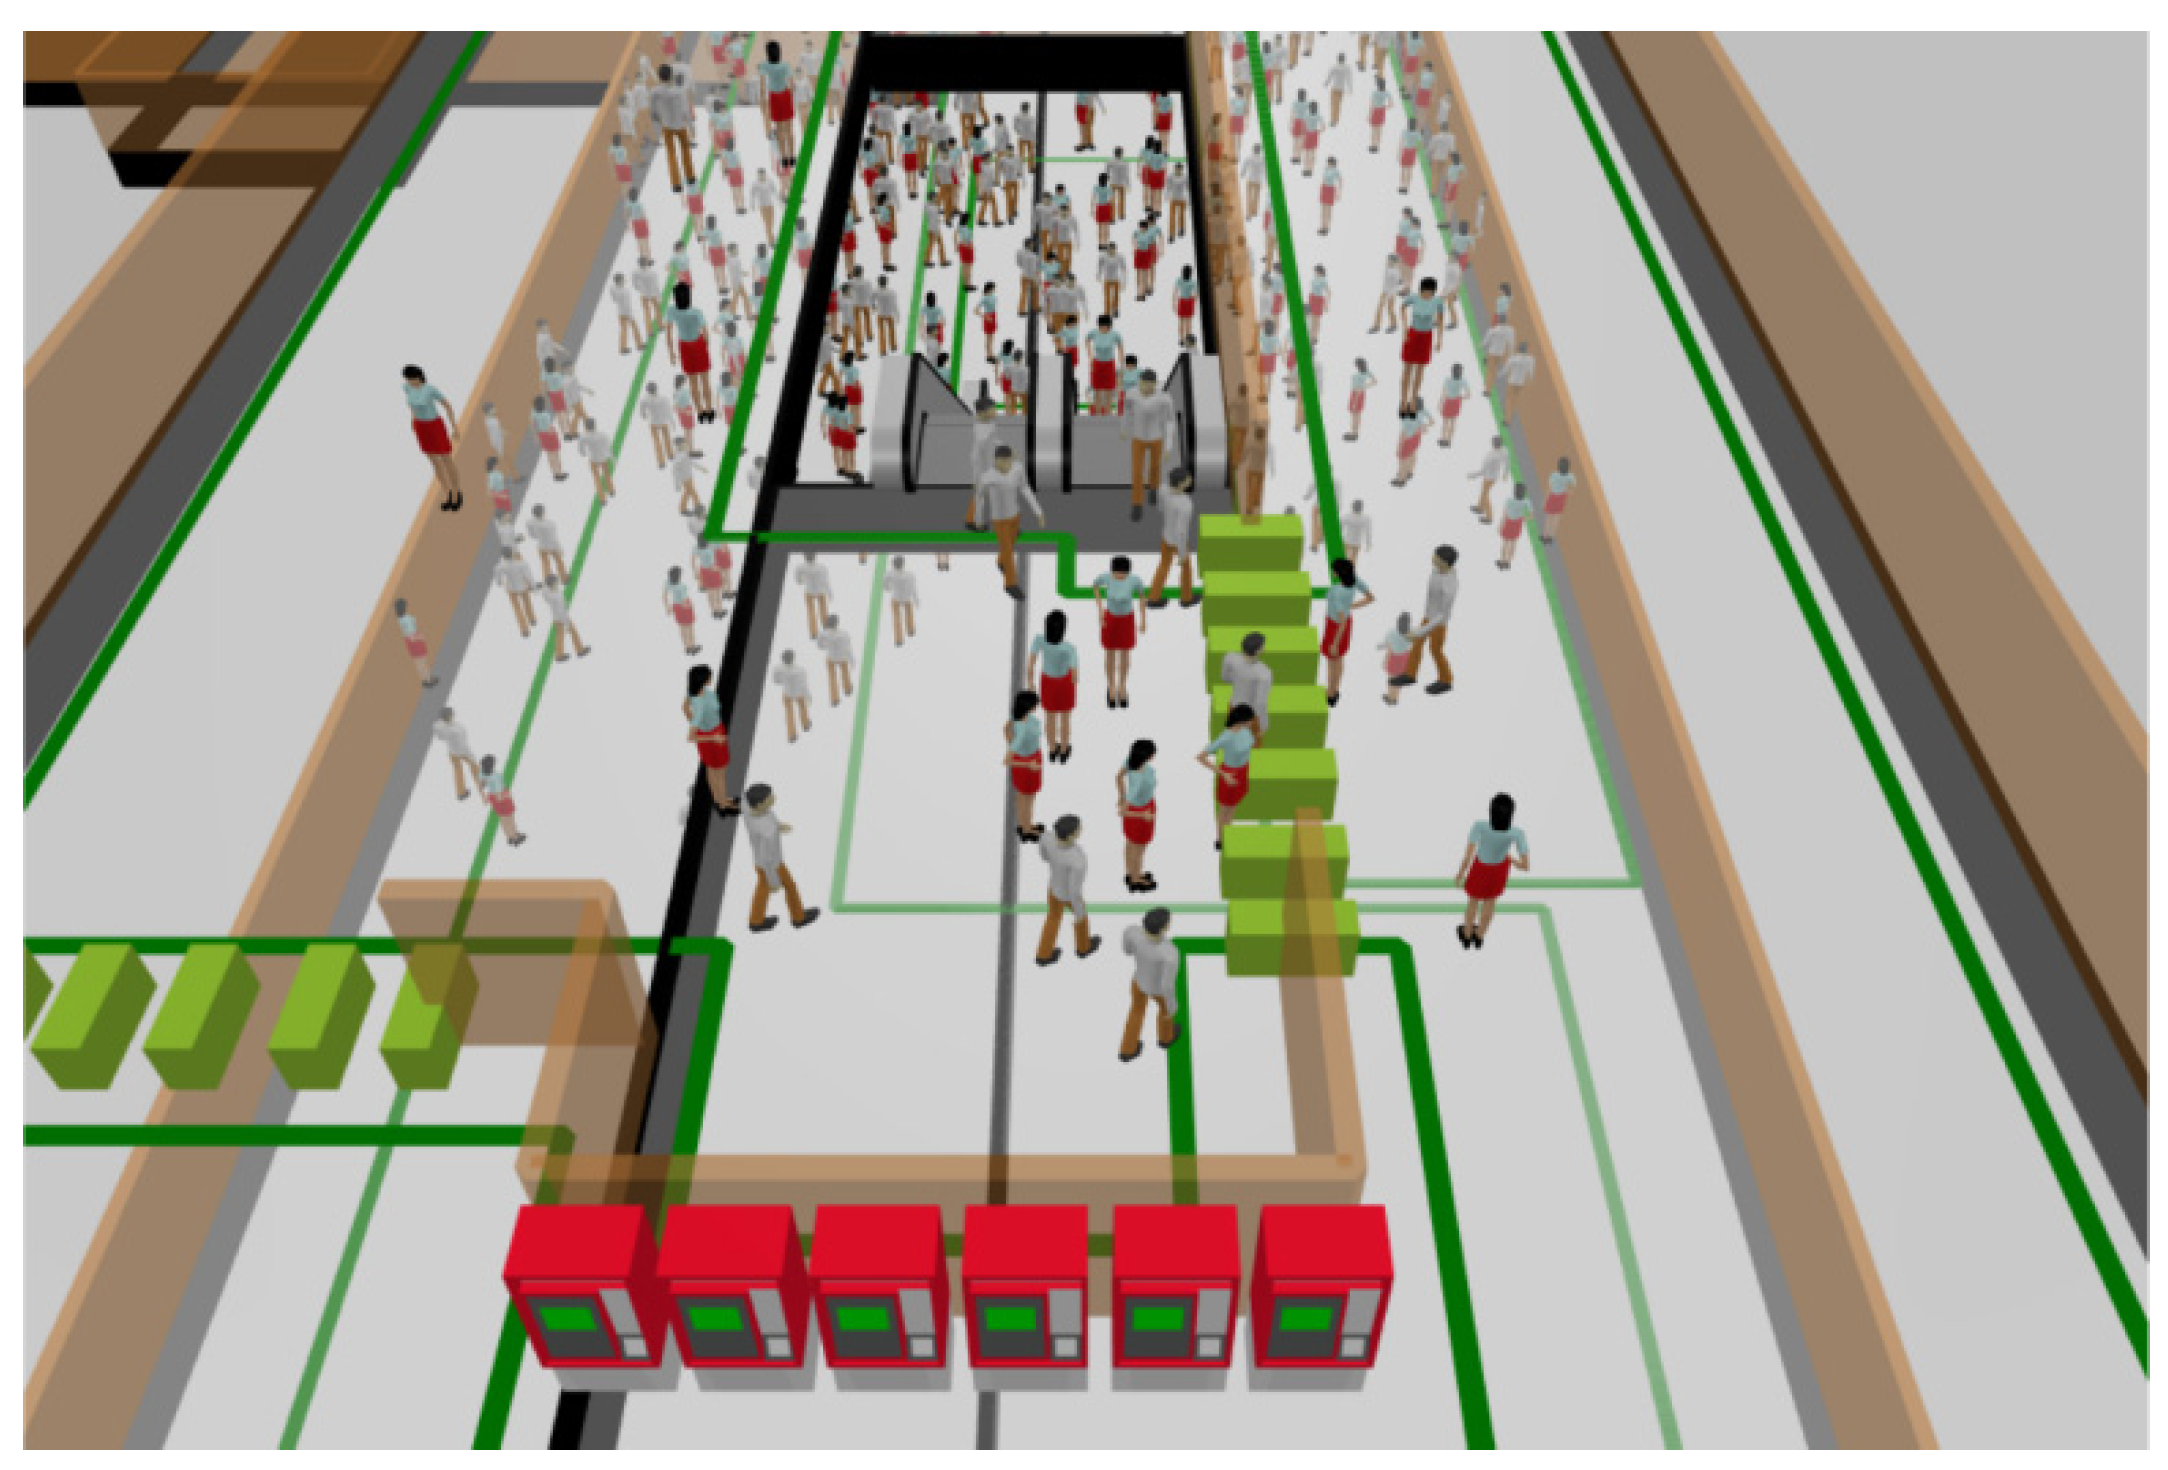
Figure 4.
3D view of modelling Xinjiekou Station.
Figure 4.
3D view of modelling Xinjiekou Station.
Figure 5.
Flowchart of passengers’ exiting process.
Figure 5.
Flowchart of passengers’ exiting process.
Figure 6.
Queue condition of turnstile when distancing is 0.4–0.5 m.
Figure 6.
Queue condition of turnstile when distancing is 0.4–0.5 m.
Figure 7.
Queue condition of turnstile when distancing is 0.9–1.0 m.
Figure 7.
Queue condition of turnstile when distancing is 0.9–1.0 m.
Figure 8.
Queue condition of turnstile when distancing is 1.5–2.0 m.
Figure 8.
Queue condition of turnstile when distancing is 1.5–2.0 m.
Figure 9.
Simulation density diagram observing distancing between 0.4 m and 0.5 m at 200 s.
Figure 9.
Simulation density diagram observing distancing between 0.4 m and 0.5 m at 200 s.
Figure 10.
Simulation density diagram with observing distancing between 0.9 m and 1.0 m at 200 s.
Figure 10.
Simulation density diagram with observing distancing between 0.9 m and 1.0 m at 200 s.
Figure 11.
Simulation density diagram for observing distancing between 1.5 m and 2.0 m at 200 s.
Figure 11.
Simulation density diagram for observing distancing between 1.5 m and 2.0 m at 200 s.
Figure 12.
Distribution of queuing lengths at individual exits obeying different social distances.
Figure 12.
Distribution of queuing lengths at individual exits obeying different social distances.
Figure 13.
Snapshots of simulated passenger queuing and boarding process based on different degrees of social distancing. (a) Queuing situation for social distancing between 0.4 m and 0.5 m. (b) Queuing situation for social distancing between 0.9 m and 1.0 m. (c) Queuing situation for social distancing between 1.5 m and 2.0 m.
Figure 14.
Comparison between increased pax delays of cases (b) and (c).
Figure 14.
Comparison between increased pax delays of cases (b) and (c).
Figure 15.
Restricted movement sketch of 600 people onto a platform, based on a consideration of 200 s.
Figure 15.
Restricted movement sketch of 600 people onto a platform, based on a consideration of 200 s.
Figure 16.
Density diagram of station platform after resetting arrival time.
Figure 16.
Density diagram of station platform after resetting arrival time.
Table 1.
Gender ratio of passengers at the Nanjing Xinjiekou Station.
Table 2.
Passenger exit selection at Nanjing Xinjiekou Station.
Table 3.
Data parameter setup table.
Table 3.
Data parameter setup table.
| Pedestrian Parameters | Gender | Male | Female |
|---|
| Speed | 1.31 m/s | 1.16 m/s |
|---|
| Escalator group parameters | Width | 1.4 m |
| Length | 10 m |
| Speed | 0.65 m/s |
| Stair parameters | Width | 3 m |
| Length | 10 m |
Table 4.
Color bar of pedestrians’ density and space, as per the underlying criterion (referring to Fruin [
38]).
| Disclaimer/Publisher’s Note: The statements, opinions and data contained in all publications are solely those of the individual author(s) and contributor(s) and not of MDPI and/or the editor(s). MDPI and/or the editor(s) disclaim responsibility for any injury to people or property resulting from any ideas, methods, instructions or products referred to in the content. |
© 2024 by the authors. Licensee MDPI, Basel, Switzerland. This article is an open access article distributed under the terms and conditions of the Creative Commons Attribution (CC BY) license (https://creativecommons.org/licenses/by/4.0/).


 52.58%
 47.42%
 100.00%
 17.06%
 34.72%
 29.76%
 14.09%
 4.37%
4.37% 0%
0% 100.00%
 4.56%
4.56% 5.95%
5.95% 4.96%
4.96% 2.38%
2.38% 6.55%
6.55% 1.59%
1.59% 5.56%
5.56% 5.16%
5.16% 2.58%
2.58% 3.37%
3.37% 4.76%
4.76% 8.13%
8.13% 4.37%
4.37% 10.71%
 5.56%
5.56% 4.56%
4.56% 5.56%
5.56% 4.56%
4.56% 5.95%
5.95% 3.17%
3.17% 100.00%
 25.6%
25.6% 12.7%
12.7% 46.03%
 15.67%
 100.00%
 93.65%
 6.35%
6.35% 100.00%
 95.83%
 4.17%
4.17% 100.00%


 52.58%
 47.42%
 100%
100% 4.56%
4.56% 5.95%
5.95% 4.96%
4.96% 2.38%
2.38% 6.55%
6.55% 1.59%
1.59% 5.56%
5.56% 5.16%
5.16% 2.58%
2.58% 3.37%
3.37% 4.76%
4.76% 8.13%
8.13% 4.37%
4.37% 10.71%
 5.56%
5.56% 4.56%
4.56% 5.56%
5.56% 4.56%
4.56% 5.95%
5.95% 3.17%
3.17% 100%
100%


