
A Subsidization Scheme for Maximizing Social Welfare in Mobile Communications Markets

 ,
,  , , and
Abstract
:1. Introduction
- 1.
- A novel system model is proposed, in which:
- (a)
- Subsidization, pricing, data consumption, and benefit factors are used to define and describe the interactions of the system model’s agents within the declared setting.
- (b)
- The payoff functions of the agents that intervene in the system model are declared using subsidization schemes based on a three-stage dynamic game. Because the CP decides the subsidization factor to influence the other agents’ decisions, the MNO maximizes its profit and obtains a tax rate reduction, while the MDUs maximize their payoff and consume additional data.
- (c)
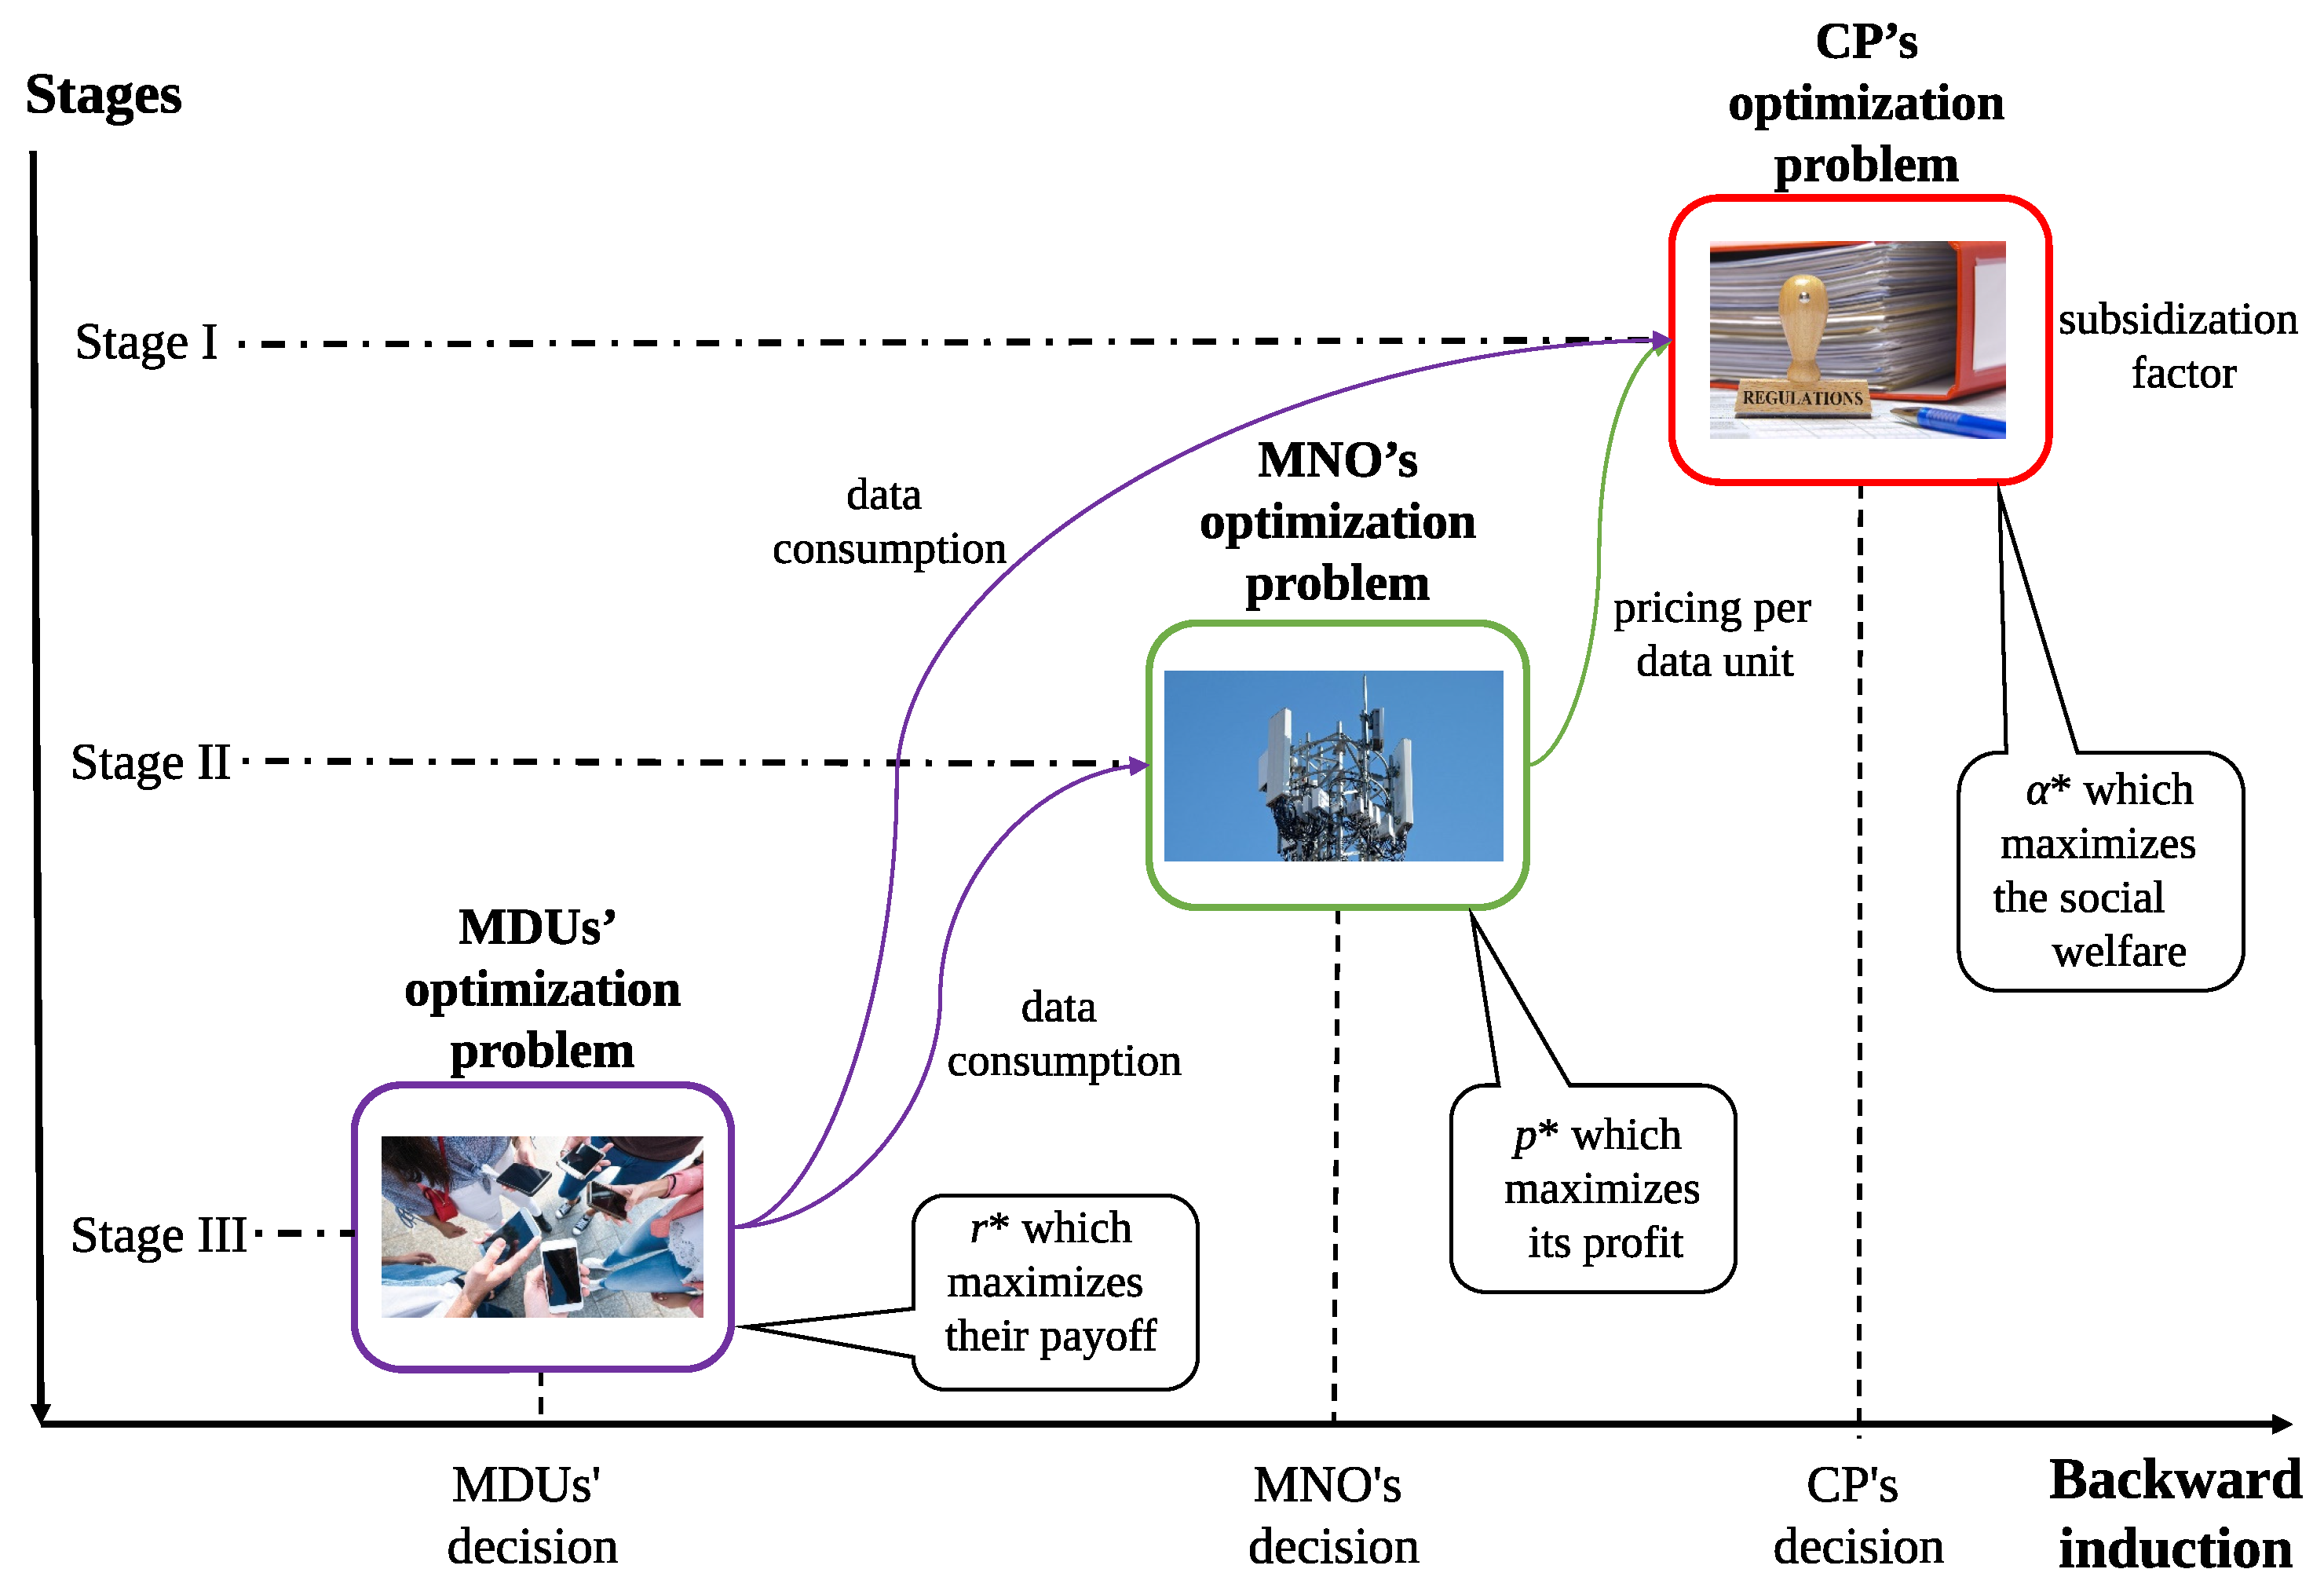
- The backward induction method is used to derive a unique Nash equilibrium in the system model stages based on modeling an approach through constrained optimization problems, achieving subgame perfect equilibrium and maximizing the social welfare of the system.
- 2.
- The numerical assessments demonstrate that the definition of a subsidization factor maximizes the social welfare of the system. In particular, the maximization of social welfare under the conditions and constraints of the proposed setting establishes that the CP is an agent that does not take sides with any of the other agents but instead seeks to socially influence the welfare of the system using regulation as a mechanism to enact the defined subsidization factor. Then, the numerical evidence shows that the individual outcomes of both the MNO’s profit and the MDUs’ payoff do not necessarily reach their maximum value after the adoption of the optimal subsidization factor.
2. Setting
2.1. General Framework
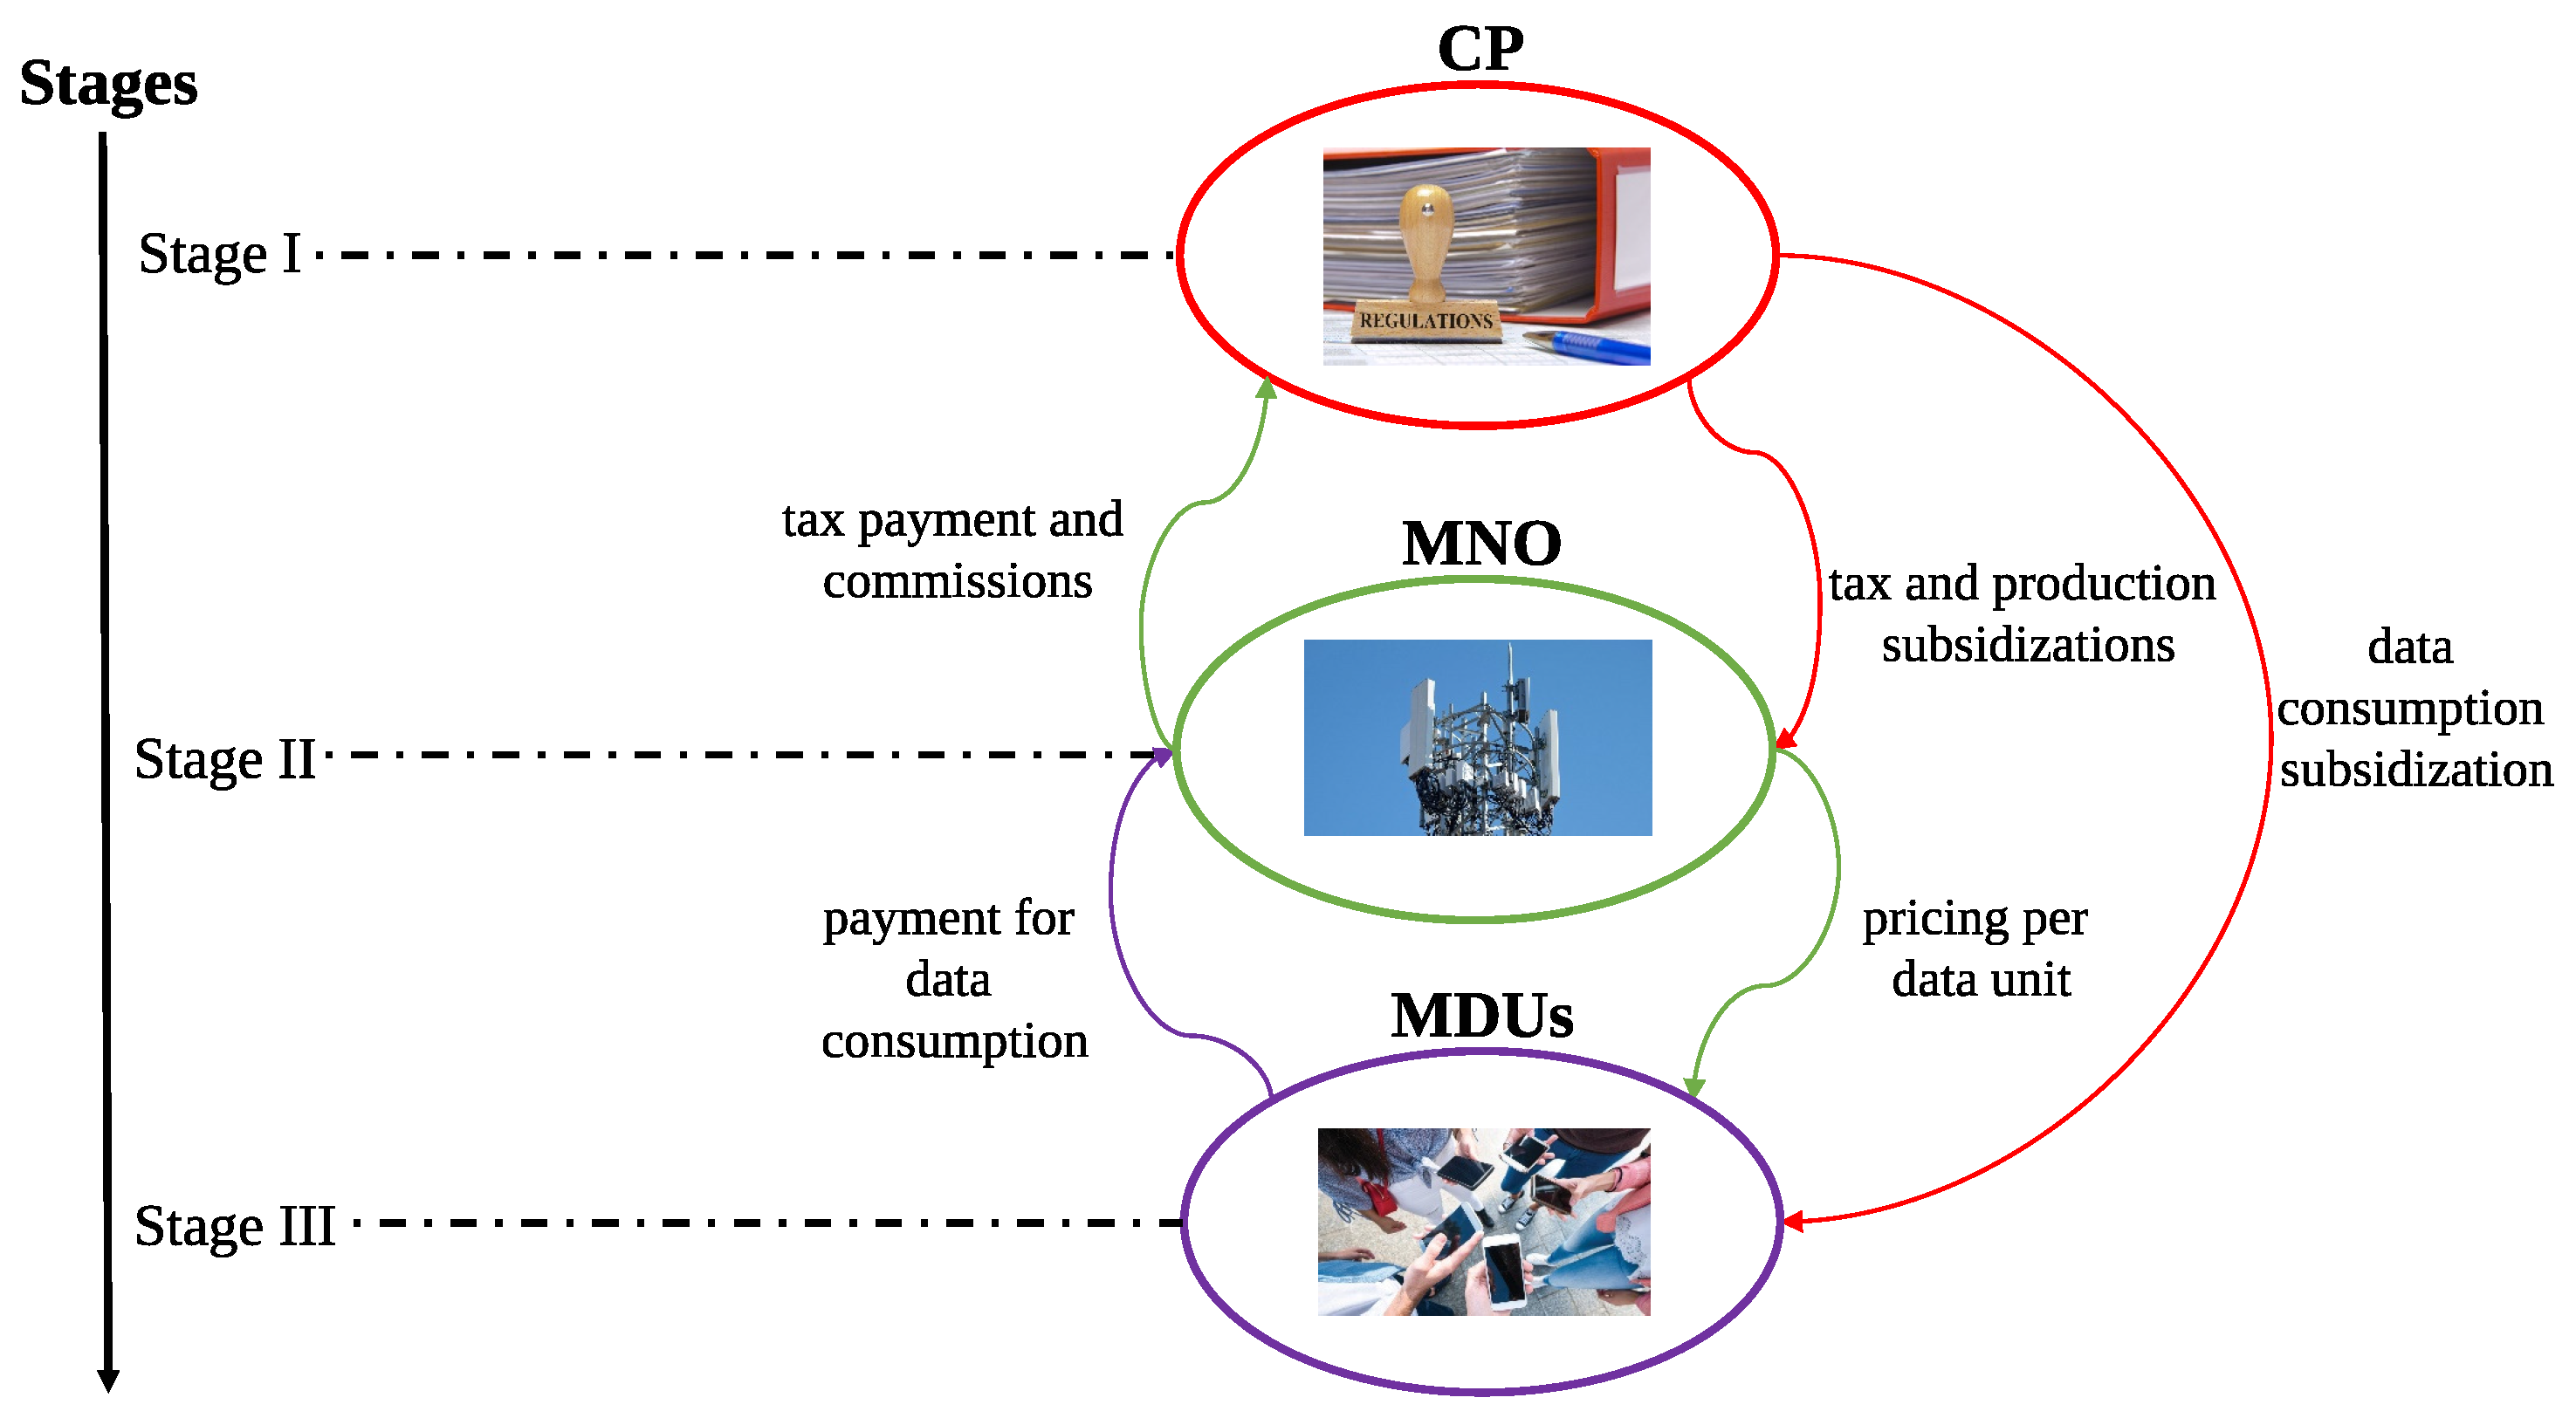
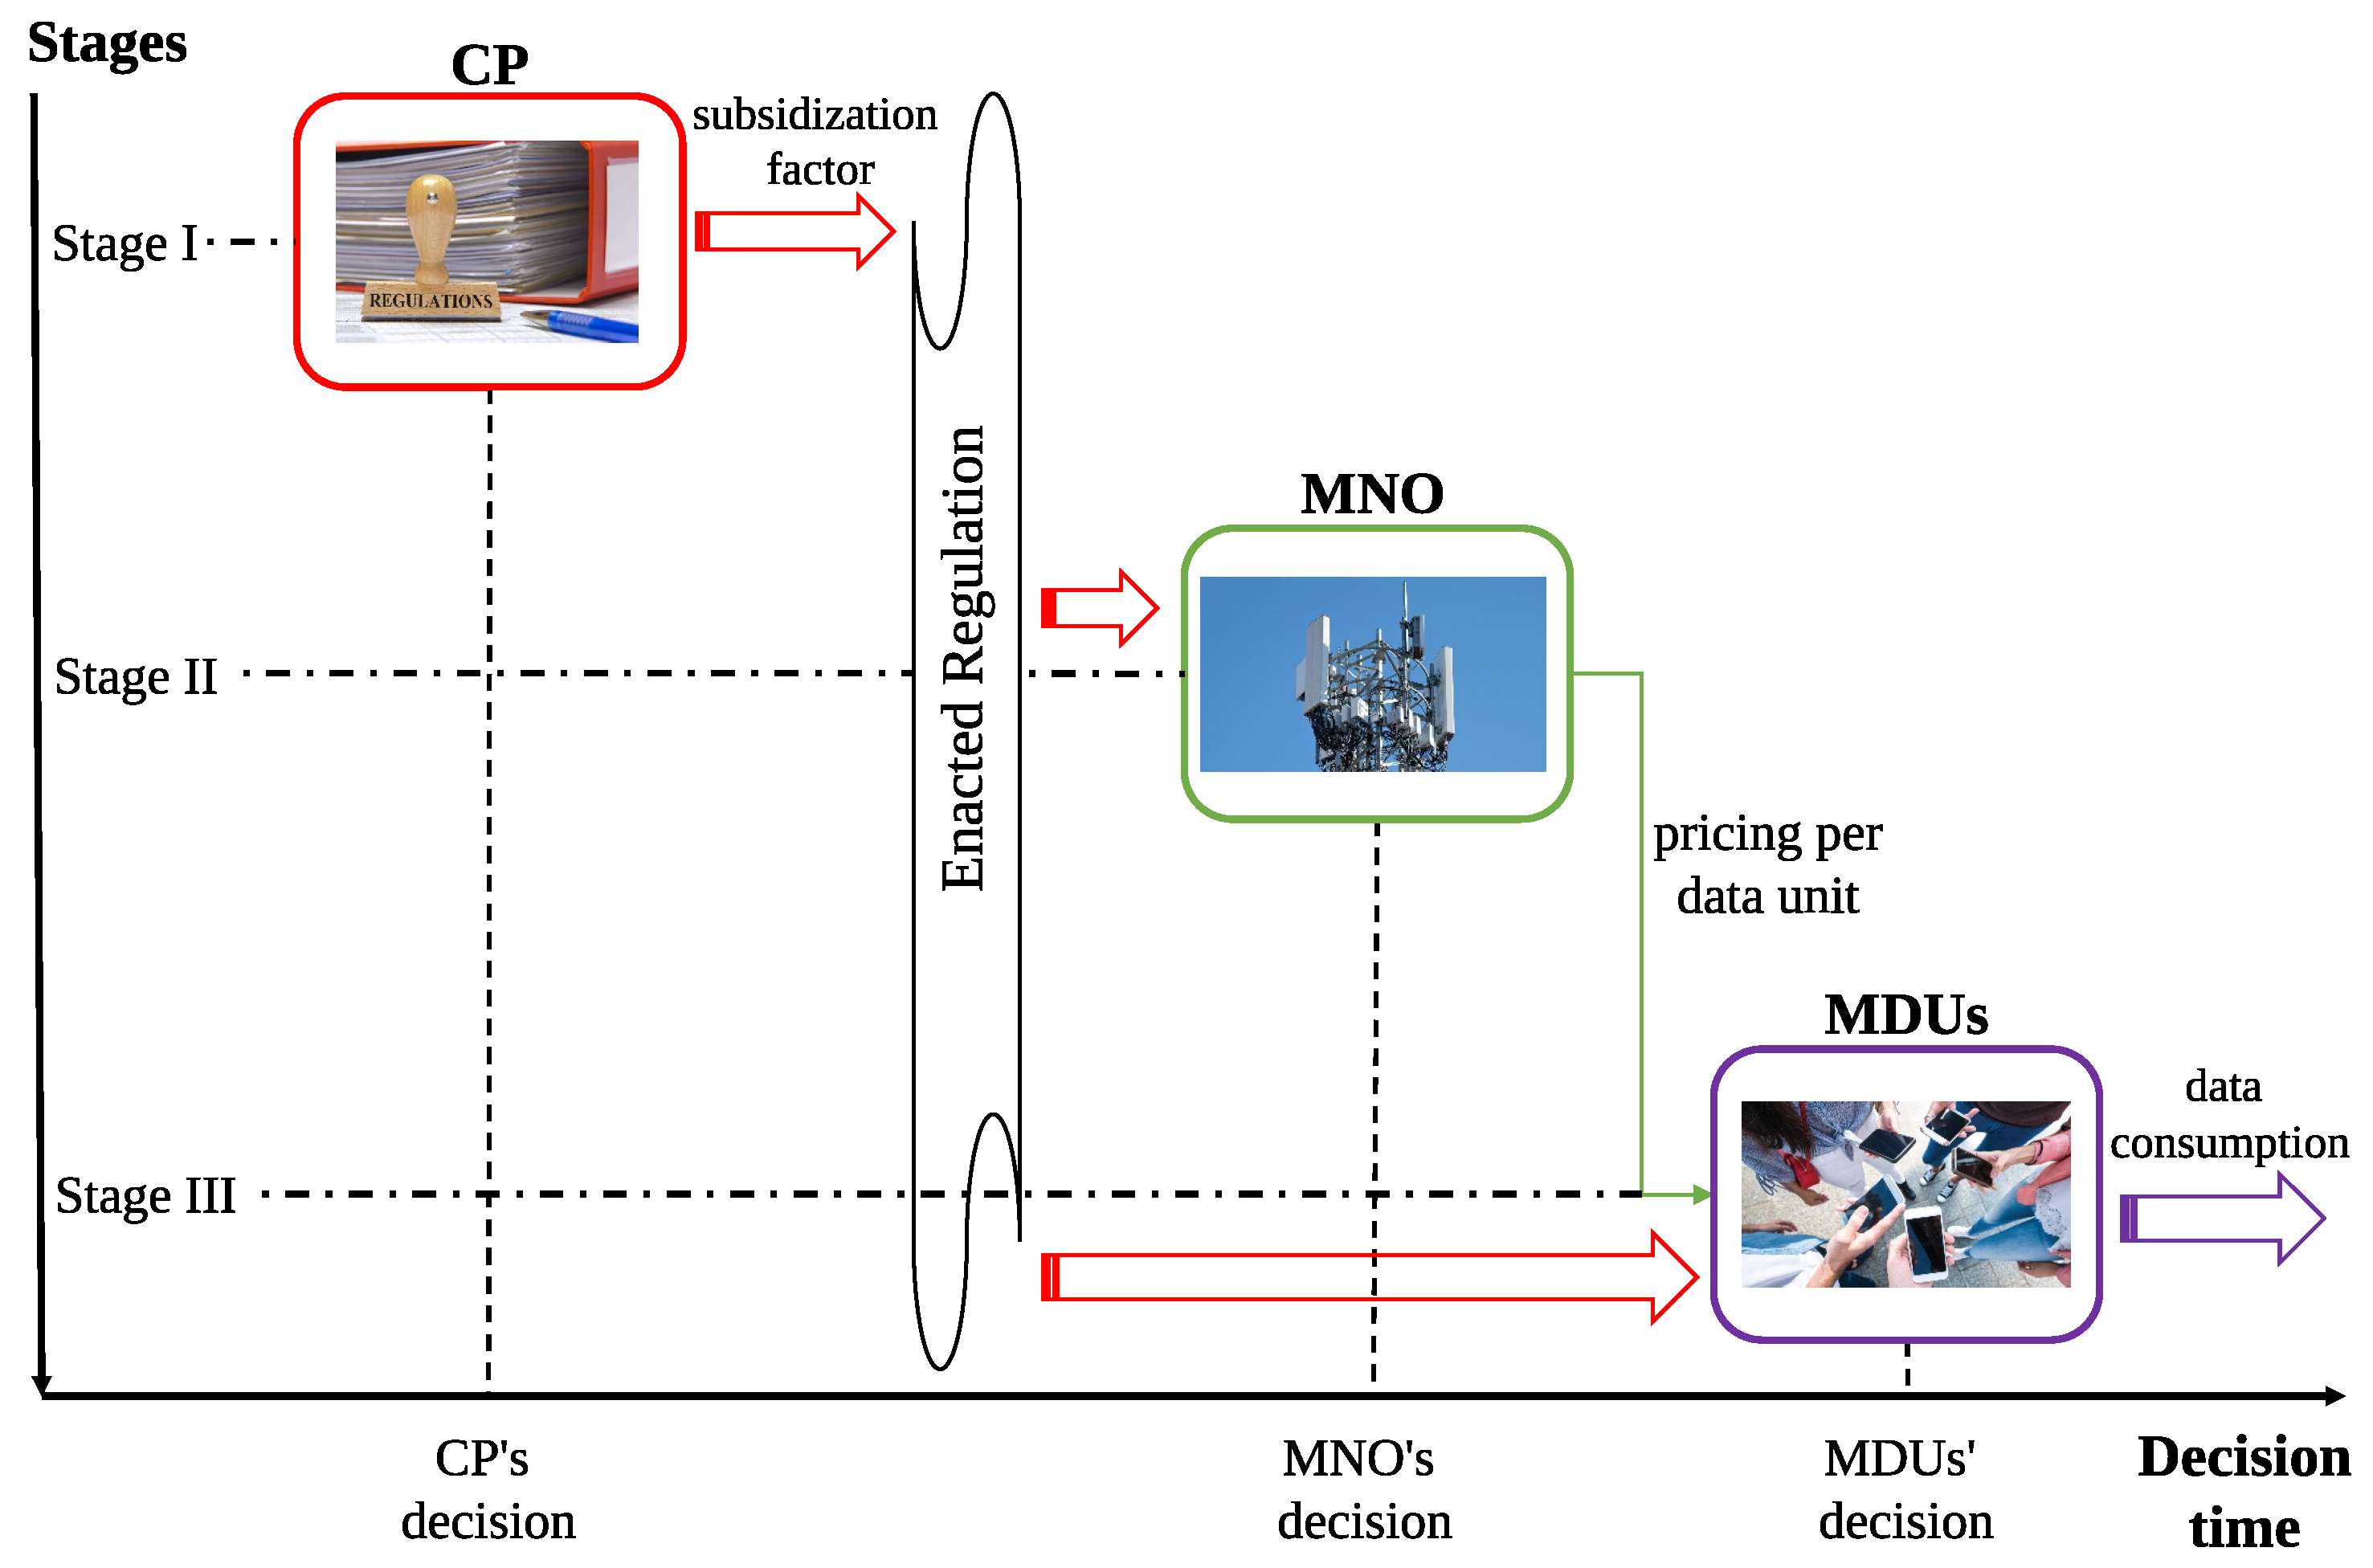
- 1.
- The agent who first makes the decision is the CP since it has all the resources for this purpose. Once the CP makes the decision, it can announce it through the regulation so that the other agents can access this information.
- 2.
- The MNO makes the second-order decision. It studies the resolution established with its work team so that, based on the announced subsidization factor and other considerations regarding profit and utility functions, it can design the pricing that it offers to the MDUs.
- 3.
- In the end, the MDUs decide whether or not to purchase a data plan based on their knowledge and the pricing that the MNO has offered.
2.2. Benefit Factors
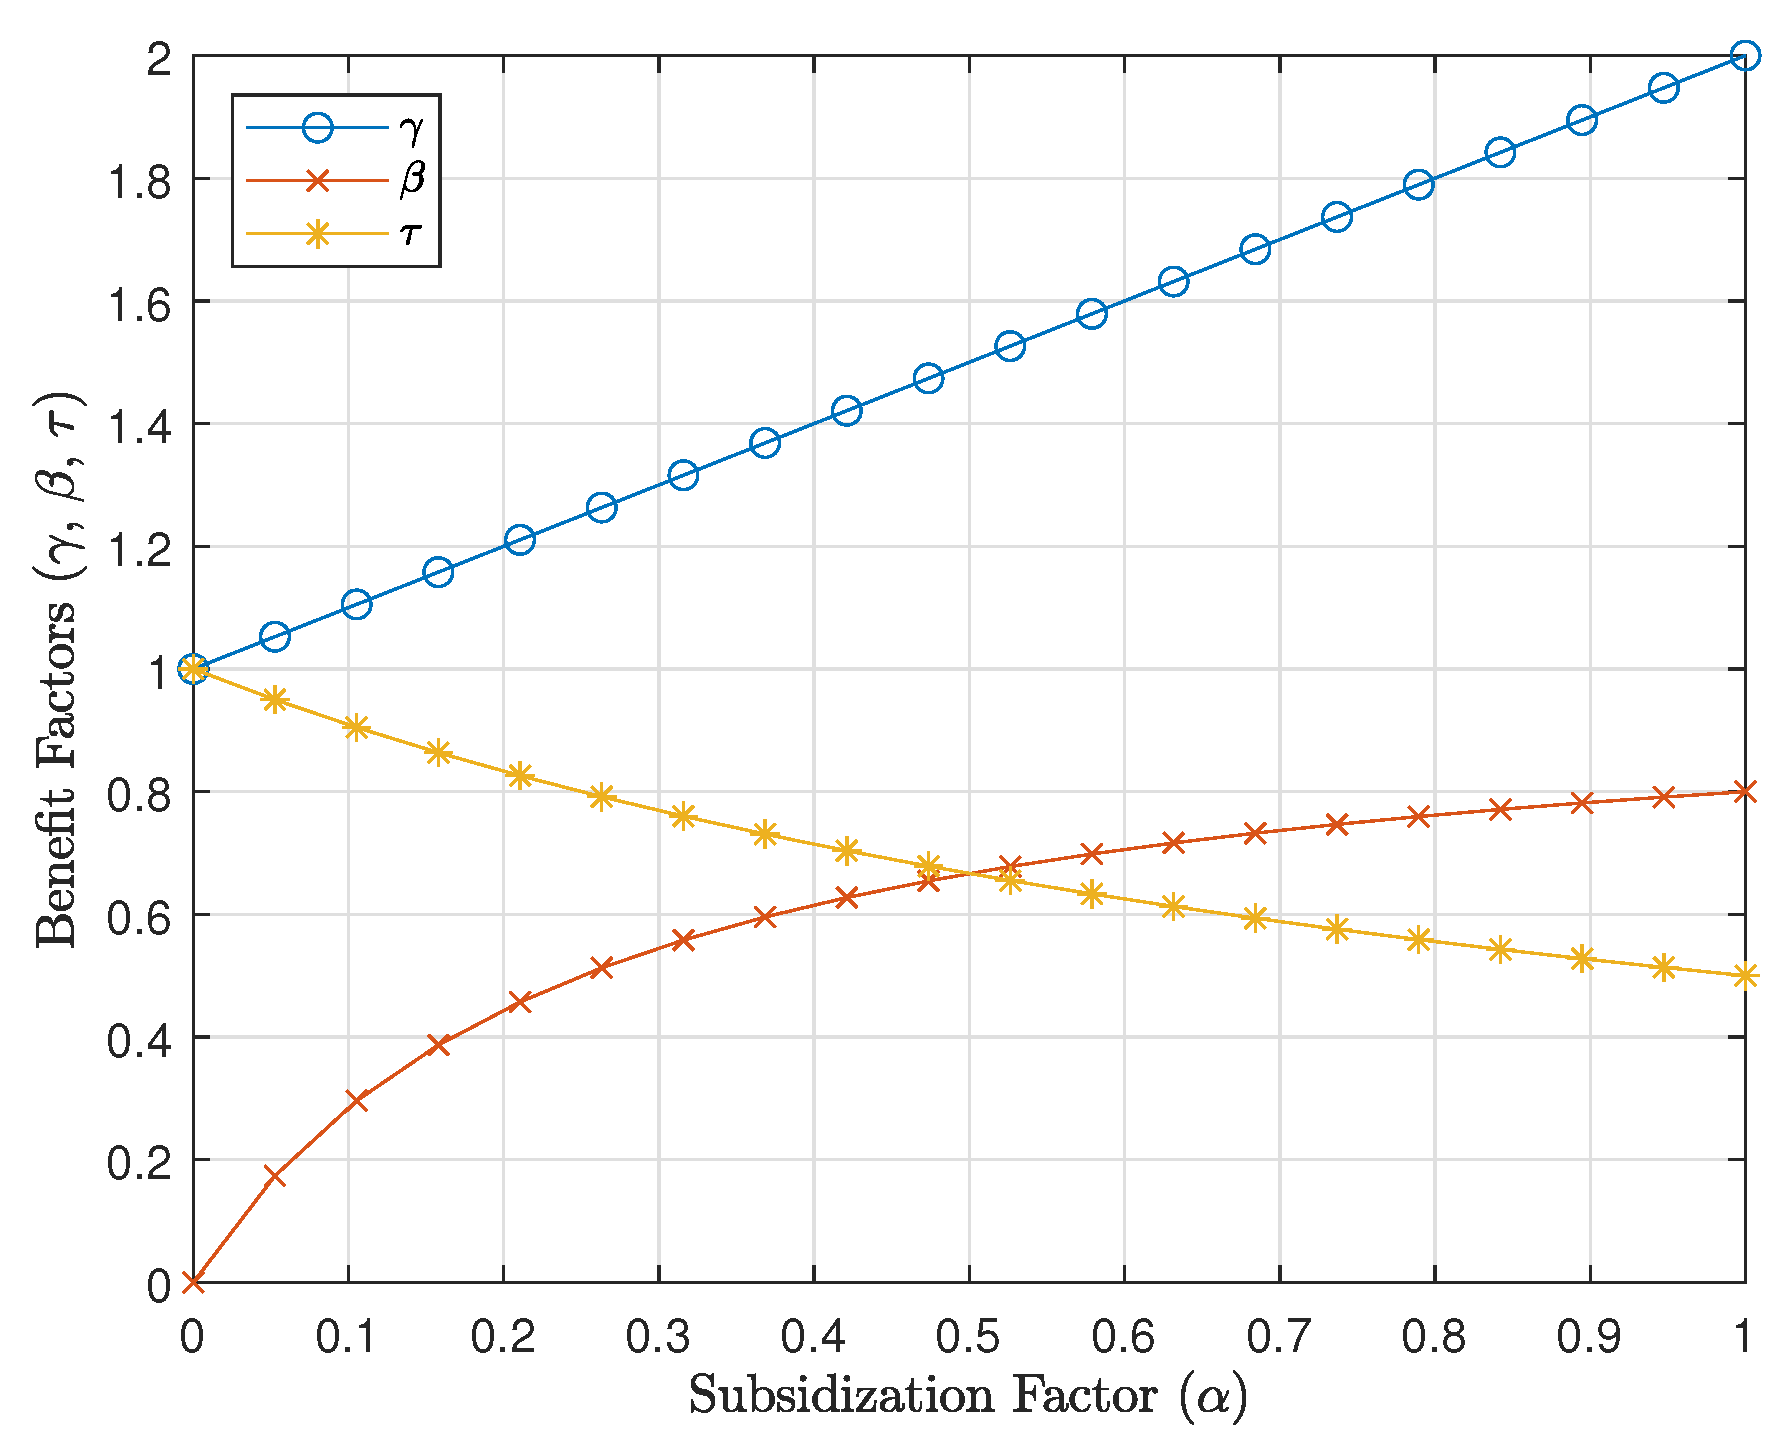
- Let be the factor that adjusts to the data consumption preferences of MDUs, encompassing both contracted and subsidized data. When and , it indicates that MDUs are entitled to consume 30.00% more data than their contracted amount with the MNO.
- Let be the factor corresponding to the MNO’s declared cost for producing the data consumed by MDUs in a subsidized manner. Under ideal conditions, the MNO is recognized for up to 80.00% of the declared cost. With and , it means that the MNO receives recognition for 55.00% of the cost for producing the subsidized data to be consumed by MDUs.
- Let be the factor adjusting the income tax payable by the MNO. In the best-case scenario, the MNO covers up to 50.00% of the income tax rate. When and , it implies that the MNO receives a 23.00% tax discount and pays 77.00% of the total taxes owed.
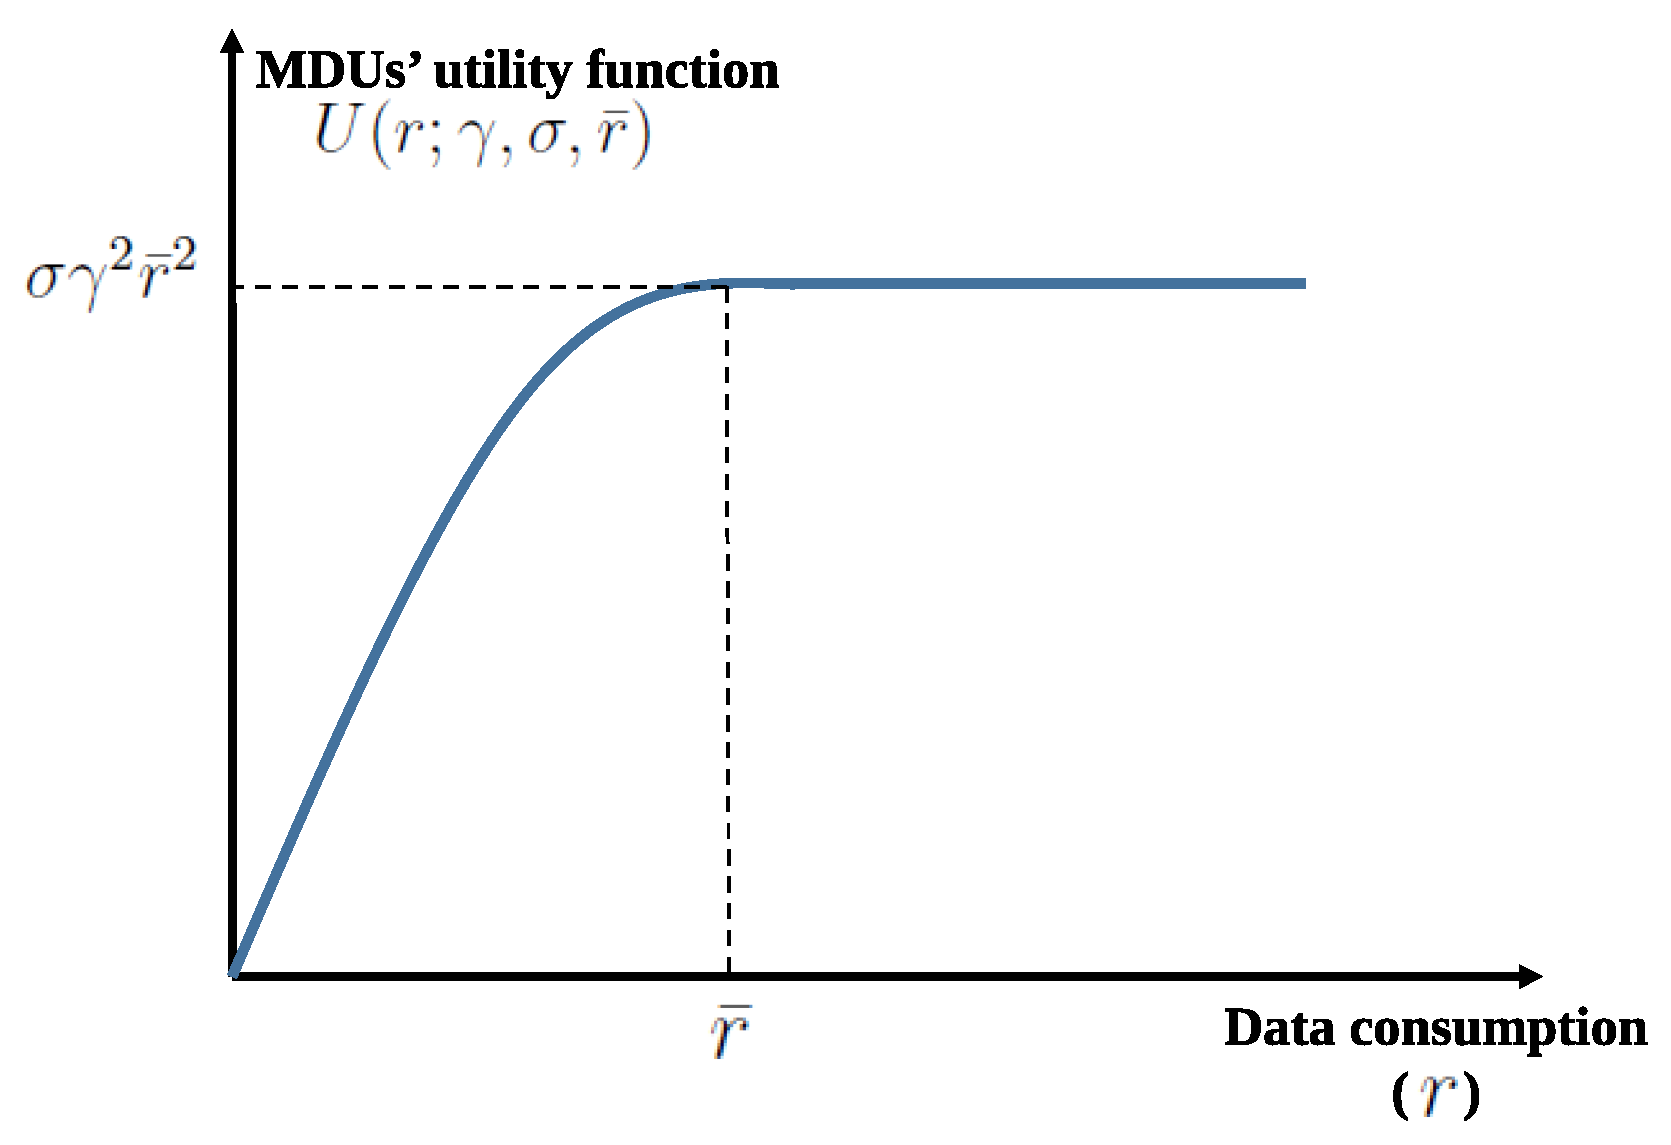
2.3. Mobile Data Users Description
2.4. Mobile Network Operator Description
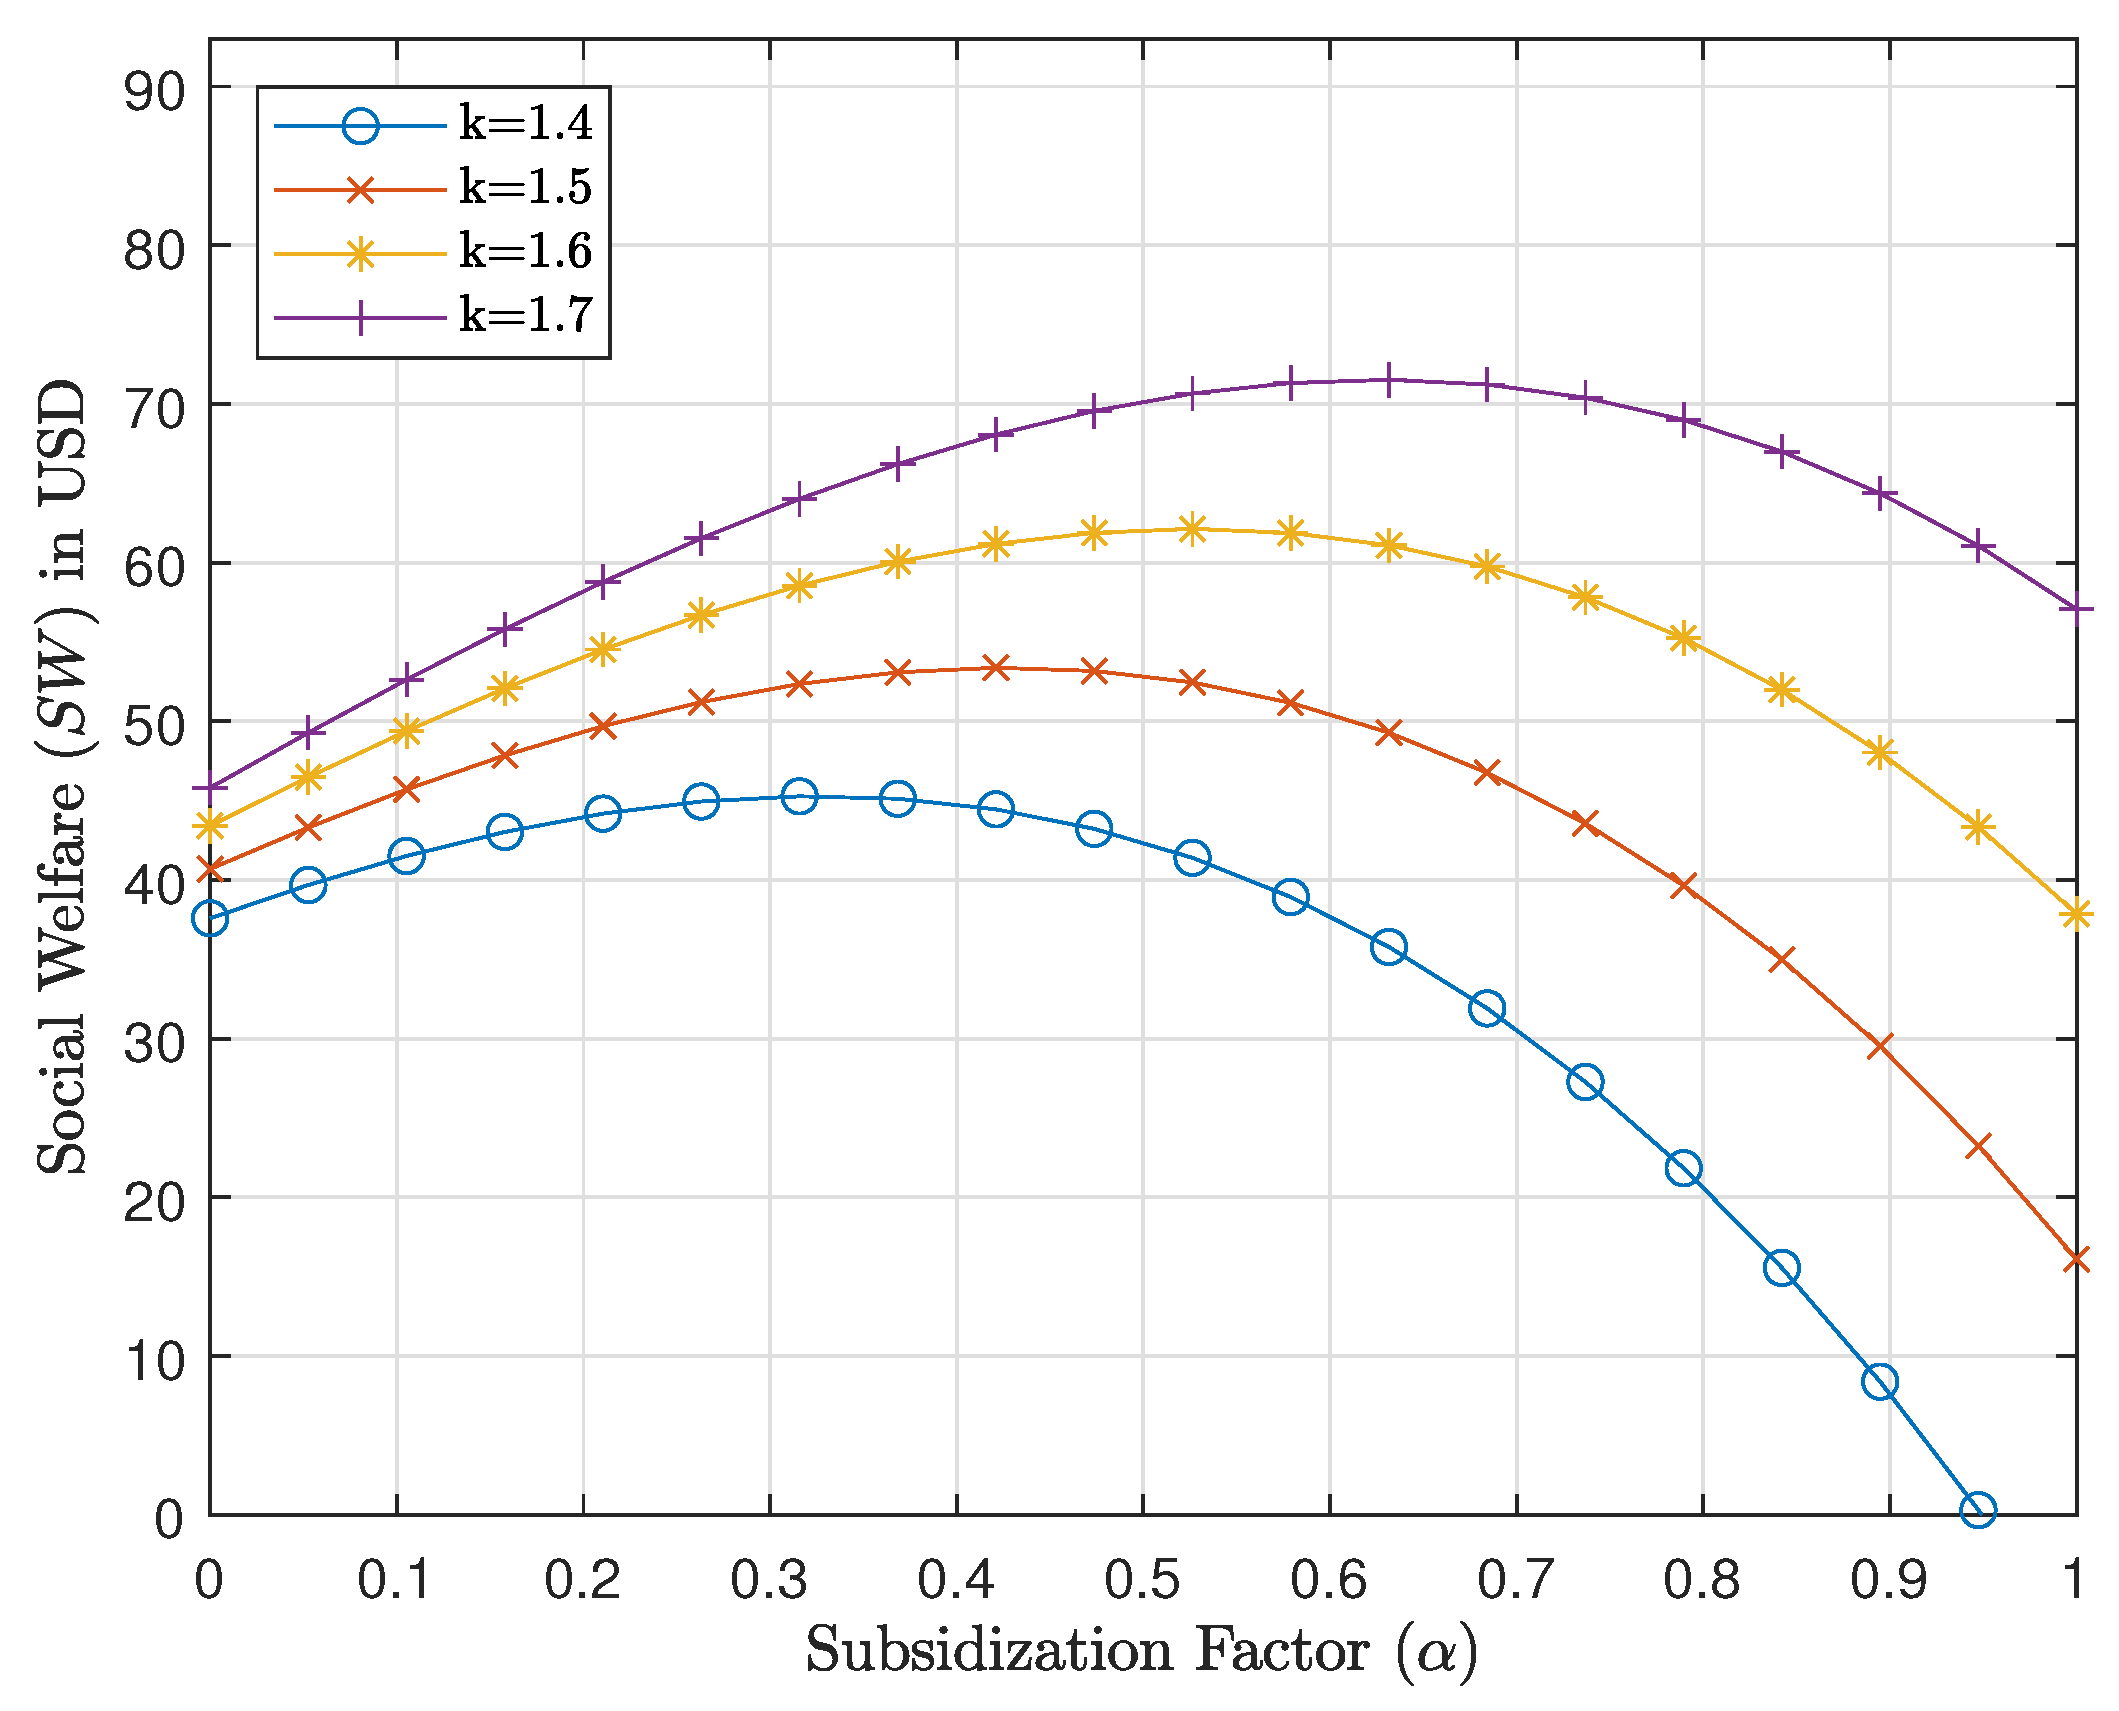
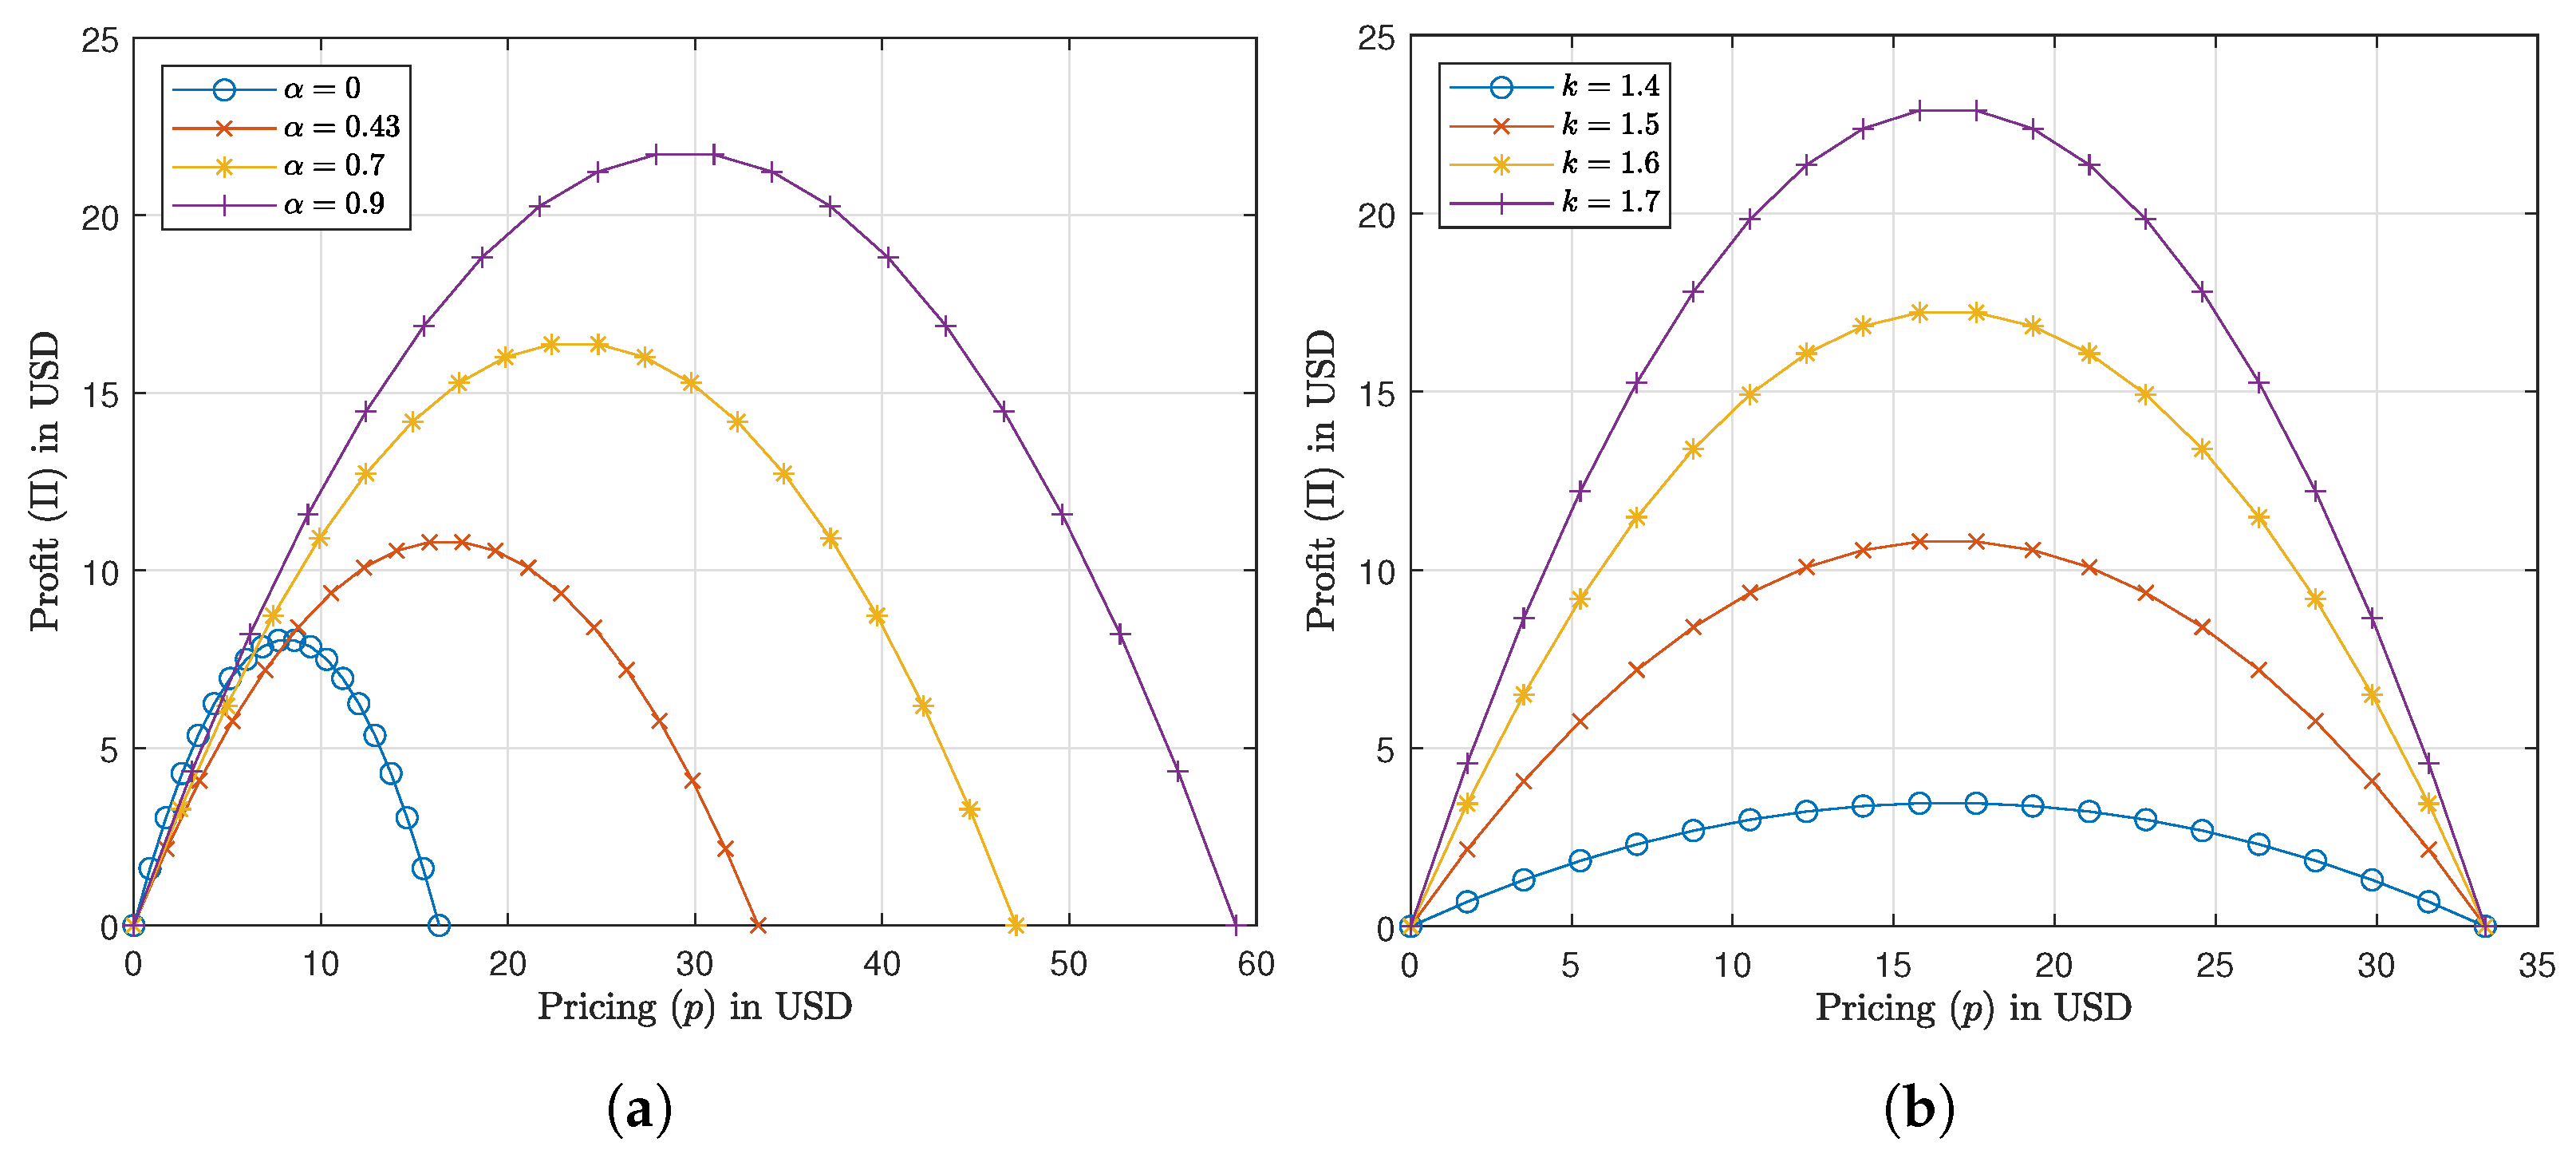
- Let k be the profit factor that represents the MNO’s profit over its production costs for selling data to the MDUs. It is a quantity greater than 1. For example, if , it then means that the MNO obtains a profit equal to 20% over its production costs.
- Let be the data production factor that represents the cost factor of producing data to provide to the MDUs. It is the inverse of k.
2.5. Central Planner Description
3. Problem Statement
3.1. Central Planer Model in Stage I
3.2. Mobile Network Operator Model in Stage II
3.3. Mobile Data Users Model in Stage III
3.4. Hierarchical Problem by Stages
4. Best Responses and Subgame Perfect Equilibrium
4.1. Formulation and Methodology of the Proposed Game
4.2. Subgame in Stage III
4.3. Subgame in Stage II
4.4. Subgame in Stage I
4.5. Subgame Perfect Equilibrium
5. Case Study, Results, and Discussion
5.1. Case Study Description
5.2. Results and Discussion
6. Conclusions
Author Contributions
Funding
Data Availability Statement
Acknowledgments
Conflicts of Interest
Abbreviations
| 4G | 4th Generation Mobile Networks |
| 5G | 5th Generation Mobile Networks |
| CP | Central Planner |
| CRC | Agency of Communications Regulation |
| EPEC | Equilibrium Problems with Equilibrium Constraints |
| GB | Giga Bytes |
| GDP | Gross Domestic Product |
| ICT | Information and Communication Technology |
| LTE | Long-Term Evolution |
| MCNMs | Mobile Communications Network Markets |
| MDUs | Mobile Data Users |
| MNO | Mobile Network Operator |
| MinTIC | Ministry of Information and Communication Technologies |
| MVNOs | Mobile Virtual Network Operators |
| DANE | National Administrative Department of Statistics |
| QoE | Quality of Experience |
| QoS | Quality of Service |
| RHS | Right-Hand Side |
| USD | United State Dollar |
| r | Data consumption in GB |
| p | Pricing in USD |
| Maximum pricing in USD | |
| Subsidization factor (No units) | |
| Marginality of the MDUs’ utility in USD/GB | |
| Maximum data consumption of the MDUs in GB | |
| Data benefit (No units) | |
| Cost benefit (No units) | |
| Tax benefit (No units) | |
| Production factor (No units) | |
| Income tax rate (No units) | |
| k | Profit factor (No units) |
| MDUs’ Utility in USD | |
| MDUs’ Cost in USD | |
| MDUs’ Payoff in USD | |
| MNO’s Profit in USD | |
| MNO’s Revenue in USD | |
| Production cost of the MNO in USD | |
| Taxes cost of the MNO in USD | |
| Social Welfare of the system in USD |
Appendix A. Proof of the Lemma 1
- If , then is a positive value and less that .
- If , then and less that .
- If , then is a negative value and less that .
- Since , then is positive and .
Appendix B. Proof of the Theorem 1
- 1.
- It can be verified that the objective function of Equation (15) is concave through:Then given thatAs and are always positive values, then it is true that . Therefore, is a strictly concave function.
- 2.
- Based on the result obtained in 1. and Lemma 1, it can be established that the solution of Equation (15) has a global maximum in the operating range of the variable r, i.e., .
- 3.
- Since the variable r can have a value within the interval , the constraint in Equation (15) is considered a compact and convex subset of .
- 4.
- Since Equation (15) is a constrained optimization problem whose objective function is nonlinear, then its solution can be found by means of the Karush–Kuhn–Tucker conditions. Therefore:And, through the first-order conditions, yield toThen, solving the system of Equation (A4) to find the feasible values of and r, it is obtained that and
- 5.
- Since the variable r can take values in the interval , the values that p can take, yield to
- , then and Therefore,
- , then and Therefore,
Appendix C. Proof of the Theorem 2
- 1.
- Substituting the optimal policy of Equation (15) into the objective function of Equation (19), the profit function is established as:Then, it can be verified that the objective function of Equation (A8) is concave through:Then given Equation (A8)Then, to guarantee the concavity ofThis is:Substituting Equations (2) and (3) into Equation (A9) given , then Equation (A10) is the condition to guarantee the concavity of the objective function of Equation (19)Therefore, if condition Equation (A10) is fulfilled, then can be considered to be a strictly concave function.
- 2.
- Based on the results obtained in 1. and Theorem 1, it can be established that the solution of Equation (19) has a global maximum in the operating range of the variable p, i.e., .
- 3.
- Since the variable p can have a value within the interval , the constraint in (19), subject to the variable p, is considered a compact and convex subset of .
- 4.
- Since Equation (19) is a constrained optimization problem whose objective function is nonlinear, then its solution can be found by means of the Karush–Kuhn–Tucker conditions. Therefore:And, through the first-order conditions, yield toThen, solving the system of Equation (A13) to find the feasible values of and p, it is obtained that and
Appendix D. Proof of the Theorem 3
- 1.
- Substituting the optimal policies of Equations (15) and (19) into the objective function of Equation (22), the social welfare function is established as:Then, it can be verified that the objective function of Equation (A15) is concave through:Then given Equation (A15)Then, to guarantee the concavity ofThen Equation (A17) is the condition to guarantee the concavity of the objective function of Equation (22)Therefore, if condition Equation (A17) is fulfilled, then can be considered to be a strictly concave function.
- 2.
- Based on the results obtained in 1., Theorem 1, and Theorem 2, it can be established that the solution of Equation (22) has a global maximum in the operating range of the variable , i.e., .
- 3.
- Since the variable can have a value within the interval , the constraint in Equation (22), subject to the variable , is considered a compact and convex subset of .
- 4.
- Since Equation (22) is a constrained optimization problem whose objective function is nonlinear, then its solution can be found by means of the Karush–Kuhn–Tucker conditions. Therefore:And, through the first-order conditions, yield toThen, solving the system of Equation (A20) to find the feasible values of and , it is obtained that and
References
- Bahia, K.; Castells, P. The impact of spectrum assignment policies on consumer welfare. Telecommun. Policy 2021, 46, 102228. [Google Scholar] [CrossRef]
- Chen, Y.T.; Sun, E.W.; Lin, Y.B. Merging anomalous data usage in wireless mobile telecommunications: Business analytics with a strategy-focused data-driven approach for sustainability. Eur. J. Oper. Res. 2020, 281, 687–705. [Google Scholar] [CrossRef]
- Matinmikko, M.; Latva-aho, M.; Ahokangas, P.; Seppänen, V. On regulations for 5G: Micro licensing for locally operated networks. Telecommun. Policy 2018, 42, 622–635. [Google Scholar] [CrossRef]
- Czech, P.; Turoń, K.; Urbańczyk, R. Bike-Sharing as an Element of Integrated Urban Transport System. In Advanced Solutions of Transport Systems for Growing Mobility; Sierpiński, G., Ed.; Springer: Cham, Switzerland, 2018; pp. 103–111. [Google Scholar] [CrossRef]
- Guevara, L.; Auat Cheein, F. The Role of 5G Technologies: Challenges in Smart Cities and Intelligent Transportation Systems. Sustainability 2020, 12, 6469. [Google Scholar] [CrossRef]
- Rizopoulos, D.; Laskari, M.; Kouloumbis, G.; Fergadiotou, I.; Durkin, P.; Kaare, K.K.; Alam, M.M. 5G as an Enabler of Connected-and-Automated Mobility in European Cross-Border Corridors—A Market Assessment. Sustainability 2022, 14, 14411. [Google Scholar] [CrossRef]
- Lashgari, M.; Tonini, F.; Capacchione, M.; Wosinska, L.; Rigamonti, G.; Monti, P. Techno-economics of fiber versus microwave for mobile transport network deployments (Invited). J. Opt. Commun. Netw. 2023, 15, C74–C87. [Google Scholar] [CrossRef]
- Narahari, Y.; Garg, D.; Narayanam, R.; Prakash, H. Game Theoretic Problems in Network Economics and Mechanism Design Solutions; Springer: London, UK, 2009. [Google Scholar] [CrossRef]
- Ghasemi, M.; Matta, I.; Esposito, F. The effect of (non-)competing brokers on the quality and price of differentiated internet services. Comput. Netw. 2019, 160, 144–164. [Google Scholar] [CrossRef]
- Kim, S. Game Theory Applications in Network Design; Advances in Wireless Technologies and Telecommunication; IGI Global: Hershey, PA, USA, 2014; pp. 1–500. [Google Scholar] [CrossRef]
- Brozynski, M.T.; Leibowicz, B.D. A multi-level optimization model of infrastructure-dependent technology adoption: Overcoming the chicken-and-egg problem. Eur. J. Oper. Res. 2022, 300, 755–770. [Google Scholar] [CrossRef]
- Darmann, A.; Schauer, J. Maximizing Nash product social welfare in allocating indivisible goods. Eur. J. Oper. Res. 2015, 247, 548–559. [Google Scholar] [CrossRef]
- Lin, D.; Gao, L.; Min, W. A Social Welfare Theory-Based Energy-Efficient Cluster Head Election Scheme for WSNs. IEEE Syst. J. 2021, 15, 4492–4502. [Google Scholar] [CrossRef]
- Bernheim, B.D. Behavioral Welfare Economics; Working Paper 14622; National Bureau of Economic Research: Cambridge, MA, USA, 2008. [Google Scholar] [CrossRef]
- Castellacci, F. Innovation and social welfare: A new research agenda. J. Econ. Surv. 2023, 37, 1156–1191. [Google Scholar] [CrossRef]
- Jung, S.Y.; Yu, S.M.; Kim, S.L. Optimization of Spectrum Allocation and Subsidization in Mobile Communication Services. IEEE Trans. Veh. Technol. 2016, 65, 8432–8443. [Google Scholar] [CrossRef]
- Xiong, Z.; Zhao, J.; Niyato, D.; Deng, R.; Zhang, J. Reward Optimization for Content Providers with Mobile Data Subsidization: A Hierarchical Game Approach. IEEE Trans. Netw. Sci. Eng. 2020, 4697, 3016963. [Google Scholar] [CrossRef]
- Fakhry, R.; Hassini, E.; Ezzeldin, M.; El-Dakhakhni, W. Tri-level mixed-binary linear programming: Solution approaches and application in defending critical infrastructure. Eur. J. Oper. Res. 2022, 298, 1114–1131. [Google Scholar] [CrossRef]
- Akkarajitsakul, K.; Hossain, E.; Niyato, D.; Kim, D.I. Game Theoretic Approaches for Multiple Access in Wireless Networks: A Survey. IEEE Commun. Surv. Tutorials 2011, 13, 372–395. [Google Scholar] [CrossRef]
- Trestian, R.; Ormond, O.; Muntean, G.M. Game Theory-Based Network Selection: Solutions and Challenges. IEEE Commun. Surv. Tutorials 2012, 14, 1212–1231. [Google Scholar] [CrossRef]
- Chen, C.; Berry, R.A.; Honig, M.L.; Subramanian, V.G. Competitive Resource Allocation in HetNets: The Impact of Small-Cell Spectrum Constraints and Investment Costs. IEEE Trans. Cogn. Commun. Netw. 2017, 3, 478–490. [Google Scholar] [CrossRef]
- Wang, C.; Li, M.; Feng, H.; Feng, N. Sponsored Data: Cooperative Pricing and Subsidizing Strategies of Mobile Telecom Carriers and Internet Content Providers. IEEE Trans. Eng. Manag. 2023, 1–15. [Google Scholar] [CrossRef]
- Capponi, G.; Corrocher, N.; Zirulia, L. Personalized pricing for customer retention: Theory and evidence from mobile communication. Telecommun. Policy 2021, 45, 102069. [Google Scholar] [CrossRef]
- Shah-Mansouri, H.; Wong, V.W.; Huang, J. An Incentive Framework for Mobile Data Offloading Market under Price Competition. IEEE Trans. Mob. Comput. 2017, 16, 2983–2999. [Google Scholar] [CrossRef]
- Xiong, Z.; Feng, S.; Niyato, D.; Wang, P.; Zhang, Y.; Lin, B. A Stackelberg Game Approach for Sponsored Content Management in Mobile Data Market with Network Effects. IEEE Internet Things J. 2020, 7, 5184–5201. [Google Scholar] [CrossRef]
- Yu, H.; Wei, E.; Berry, R.A. Monetizing Mobile Data via Data Rewards. IEEE J. Sel. Areas Commun. 2020, 38, 782–792. [Google Scholar] [CrossRef]
- Li, C.; Li, J.; Li, Y.; Han, Z. Pricing Game with Complete or Incomplete Information about Spectrum Inventories for Mobile Virtual Network Operators. IEEE Trans. Veh. Technol. 2019, 68, 11118–11131. [Google Scholar] [CrossRef]
- Wang, W.; Xiong, Z.; Niyato, D.; Wang, P.; Han, Z. A Hierarchical Game with Strategy Evolution for Mobile Sponsored Content and Service Markets. IEEE Trans. Commun. 2019, 67, 472–488. [Google Scholar] [CrossRef]
- Xiong, Z.; Kang, J.; Niyato, D.; Wang, P.; Poor, H.V.; Xie, S. A Multi-Dimensional Contract Approach for Data Rewarding in Mobile Networks. IEEE Trans. Wirel. Commun. 2020, 19, 5779–5793. [Google Scholar] [CrossRef]
- Yu, J.; Cheung, M.H.; Huang, J. Economics of Mobile Data Trading Market. IEEE Trans. Mob. Comput. 2022, 21, 2385–2397. [Google Scholar] [CrossRef]
- Fortetsanakis, G.; Dimitriou, I.; Papadopouli, M. A Game-Theoretical Analysis of Wireless Markets Using Network Aggregation. IEEE Trans. Mob. Comput. 2017, 16, 602–616. [Google Scholar] [CrossRef]
- Chen, C.; Berry, R.A.; Honig, M.L.; Subramanian, V.G. Pricing, Bandwidth Allocation, and Service Competition in Heterogeneous Wireless Networks. IEEE/ACM Trans. Netw. 2020, 28, 2299–2308. [Google Scholar] [CrossRef]
- Xiong, Z.; Niyato, D.; Wang, P.; Han, Z.; Zhang, Y. Dynamic Pricing for Revenue Maximization in Mobile Social Data Market with Network Effects. IEEE Trans. Wirel. Commun. 2020, 19, 1722–1737. [Google Scholar] [CrossRef]
- Fleissner, P.K. Welfare and Warfare: Contrasting Scenarios of Mobile Communication. SSRN 2004, 2004, 635243. [Google Scholar] [CrossRef]
- Chakraborty, A.; Ganguly, N. Online Social Networks to Foster Long-Term Welfare. GetMobile Mob. Comp. Comm. 2019, 23, 5–8. [Google Scholar] [CrossRef]
- Li, M.; Hou, L. Welfare effects of network neutrality in mobile Internet market. Enterp. Inf. Syst. 2020, 14, 352–367. [Google Scholar] [CrossRef]
- Shivendu, S.; Zhang, R.A. The Impact of Digitization on Content Markets: Prices, Profit, and Social Welfare. MIS Quarterly 2020, 44, 1905–1956. [Google Scholar] [CrossRef]
- Hwang, Y.M.; Sim, I.; Sun, Y.G.; Lee, H.J.; Kim, J.Y. Game-Theory Modeling for Social Welfare Maximization in Smart Grids. Energies 2018, 11, 2315. [Google Scholar] [CrossRef]
- Chen, Z.; Ivan Su, S.I. Social welfare maximization with the least subsidy: Photovoltaic supply chain equilibrium and coordination with fairness concern. Renew. Energy 2019, 132, 1332–1347. [Google Scholar] [CrossRef]
- Lohan, P.; Seo, J.B.; De, S. Social Welfare Maximization in Two-Tier Heterogeneous Cellular Networks. IEEE Commun. Lett. 2019, 23, 1826–1830. [Google Scholar] [CrossRef]
- Lasaulce, S.; Tembine, H. Game Theory and Learning for Wireless Networks; Elsevier: Amsterdam, The Netherlands, 2011. [Google Scholar] [CrossRef]
- Serna, N.; Álvaro, J.; Riascos; Martin, J.D. Welfare effects of switching barriers through permanence clauses: Evidence from the mobiles market in Colombia. Telecommun. Policy 2019, 43, 310–323. [Google Scholar] [CrossRef]
- Vuelvas, J.; Ruiz, F.; Gruosso, G. Limiting gaming opportunities on incentive-based demand response programs. Appl. Energy 2018, 225, 668–681. [Google Scholar] [CrossRef]
- Vuelvas, J.; Ruiz, F. Rational consumer decisions in a peak time rebate program. Electr. Power Syst. Res. 2017, 143, 533–543. [Google Scholar] [CrossRef]
- Gabriel, S.A.; Conejo, A.J.; Fuller, J.D.; Hobbs, B.F.; Ruiz, C. Complementarity Modeling in Energy Markets; Springer Science & Business Media: New York, NY, USA, 2012; Volume 180. [Google Scholar] [CrossRef]
- Maille, P.; Tuffin, B. Telecommunication Network Economics: From Theory to Applications; Cambridge University Press: Cambridge, UK, 2014; p. 300. [Google Scholar]
- Welcome to Deloitte International Tax Source. Available online: https://www.dits.deloitte.com/ (accessed on 30 December 2023).


| MNO | Data Consumption Plan | Pricing Plan |
|---|---|---|
| Operator 1 | 8.00 GB | 16.47 USD |
| Operator 2 | 8.00 GB | 15.94 USD |
| Operator 3 | 8.00 GB | 16.45 USD |
| Operator for the case study | 8.00 GB | 16.29 USD |
| Work | Network Economics or Game Theory Approach | Agents or Players | Mathematical Framework | Optimized Decision Variables | Social Welfare Maximization Based on a Subsidization | Numerical Assessments Based on a Case Study | Application Sector |
|---|---|---|---|---|---|---|---|
| [32] | Network economics and a sequential game | The mobile and fixed users, and the services providers | A two-stage sequential optimization procedure | The pricing and the bandwidth allocation | – | X | Heterogeneous wireless networks |
| [38] | Stackelberg game-based evolutionary game | The generators and the energy users | A bi-level optimization problem | The electricity price, the generation power, and the demand power | – | X | Smart grids |
| [39] | Four basic game-theoretical model types | The government, the module supplier, and the photovoltaic system assembler | A two-stage optimization problem | The price of a module, the price of a photovoltaic system, and the government’s subsidy factor | X | – | Photovoltaic industry |
| [40] | Network economics | The users and the service provider | An optimization problem | The bandwidth fraction | – | – | Heterogeneous cellular networks |
| This paper | Network economics and a dynamic game | The central planner, the mobile network operator, and the mobile data users | A three-stage constrained optimization problem | The subsidization factor, the pricing, and the data consumption | X | X | Mobile communication markets |
| Player’s Payoff Function | = 0.43 | |||||
|---|---|---|---|---|---|---|
| The CP’s | 40.69 USD | 52.05 USD | 53.37 USD | 50.48 USD | 33.22 USD | 16.10 USD |
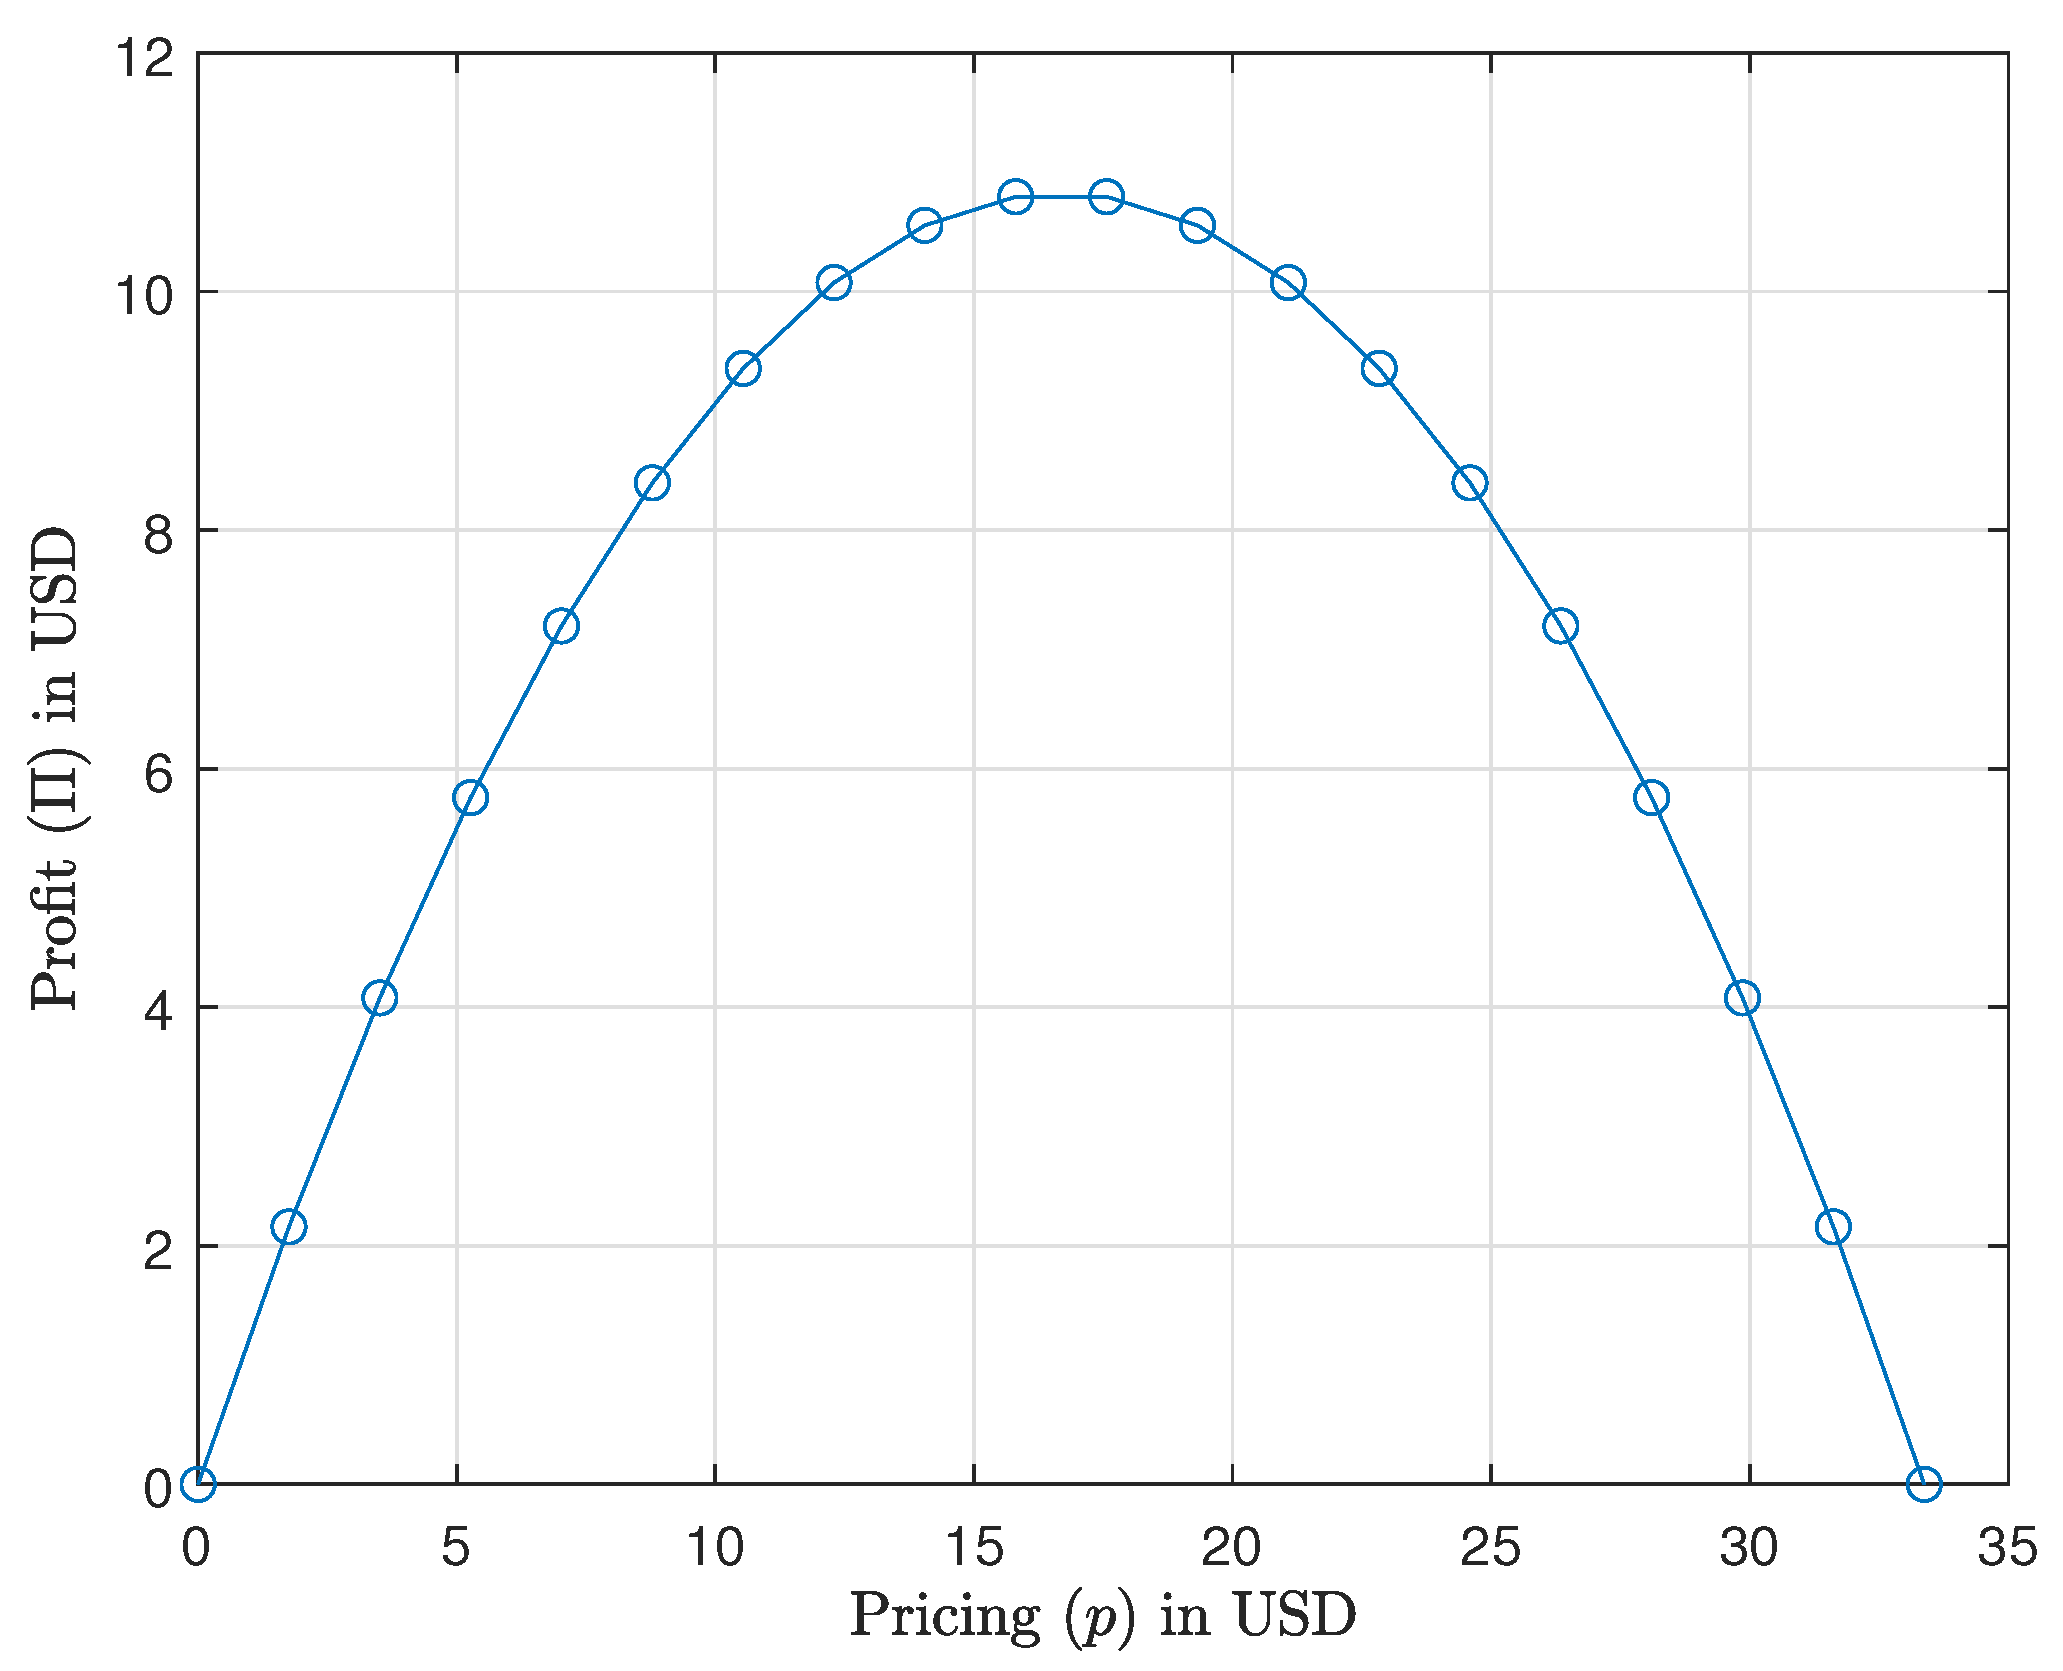
| The MNO’s ∏ | 8.05 USD | 8.92 USD | 10.82 USD | 14.11 USD | 20.61 USD | 24.81 USD |
| The MDUs’ G | 32.64 USD | 55.16 USD | 66.72 USD | 83.55 USD | 112.92 USD | 130.56 USD |
| Player’s Payoff Function | = 0.43 | Percentage Increase | |
|---|---|---|---|
| The CP’s | 40.69 USD | 53.37 USD | 31.16% |
| The MNO’s ∏ | 8.05 USD | 10.82 USD | 34.41% |
| The MDUs’ G | 32.64 USD | 66.72 USD | 104.41% |
Disclaimer/Publisher’s Note: The statements, opinions and data contained in all publications are solely those of the individual author(s) and contributor(s) and not of MDPI and/or the editor(s). MDPI and/or the editor(s) disclaim responsibility for any injury to people or property resulting from any ideas, methods, instructions or products referred to in the content. |
© 2024 by the authors. Licensee MDPI, Basel, Switzerland. This article is an open access article distributed under the terms and conditions of the Creative Commons Attribution (CC BY) license (https://creativecommons.org/licenses/by/4.0/).
Share and Cite
Agualimpia-Arriaga, C.; Vuelvas, J.; Páez-Rueda, C.-I.; Correa-Flórez, C.A.; Fajardo, A. A Subsidization Scheme for Maximizing Social Welfare in Mobile Communications Markets. Systems 2024, 12, 104. https://doi.org/10.3390/systems12030104
Agualimpia-Arriaga C, Vuelvas J, Páez-Rueda C-I, Correa-Flórez CA, Fajardo A. A Subsidization Scheme for Maximizing Social Welfare in Mobile Communications Markets. Systems. 2024; 12(3):104. https://doi.org/10.3390/systems12030104
Chicago/Turabian StyleAgualimpia-Arriaga, Carlos, José Vuelvas, Carlos-Iván Páez-Rueda, Carlos Adrián Correa-Flórez, and Arturo Fajardo. 2024. "A Subsidization Scheme for Maximizing Social Welfare in Mobile Communications Markets" Systems 12, no. 3: 104. https://doi.org/10.3390/systems12030104