
A Method for Inspiring Radical Innovative Design Based on Cross-Domain Knowledge Mining

Abstract
:1. Introduction
2. Related Research
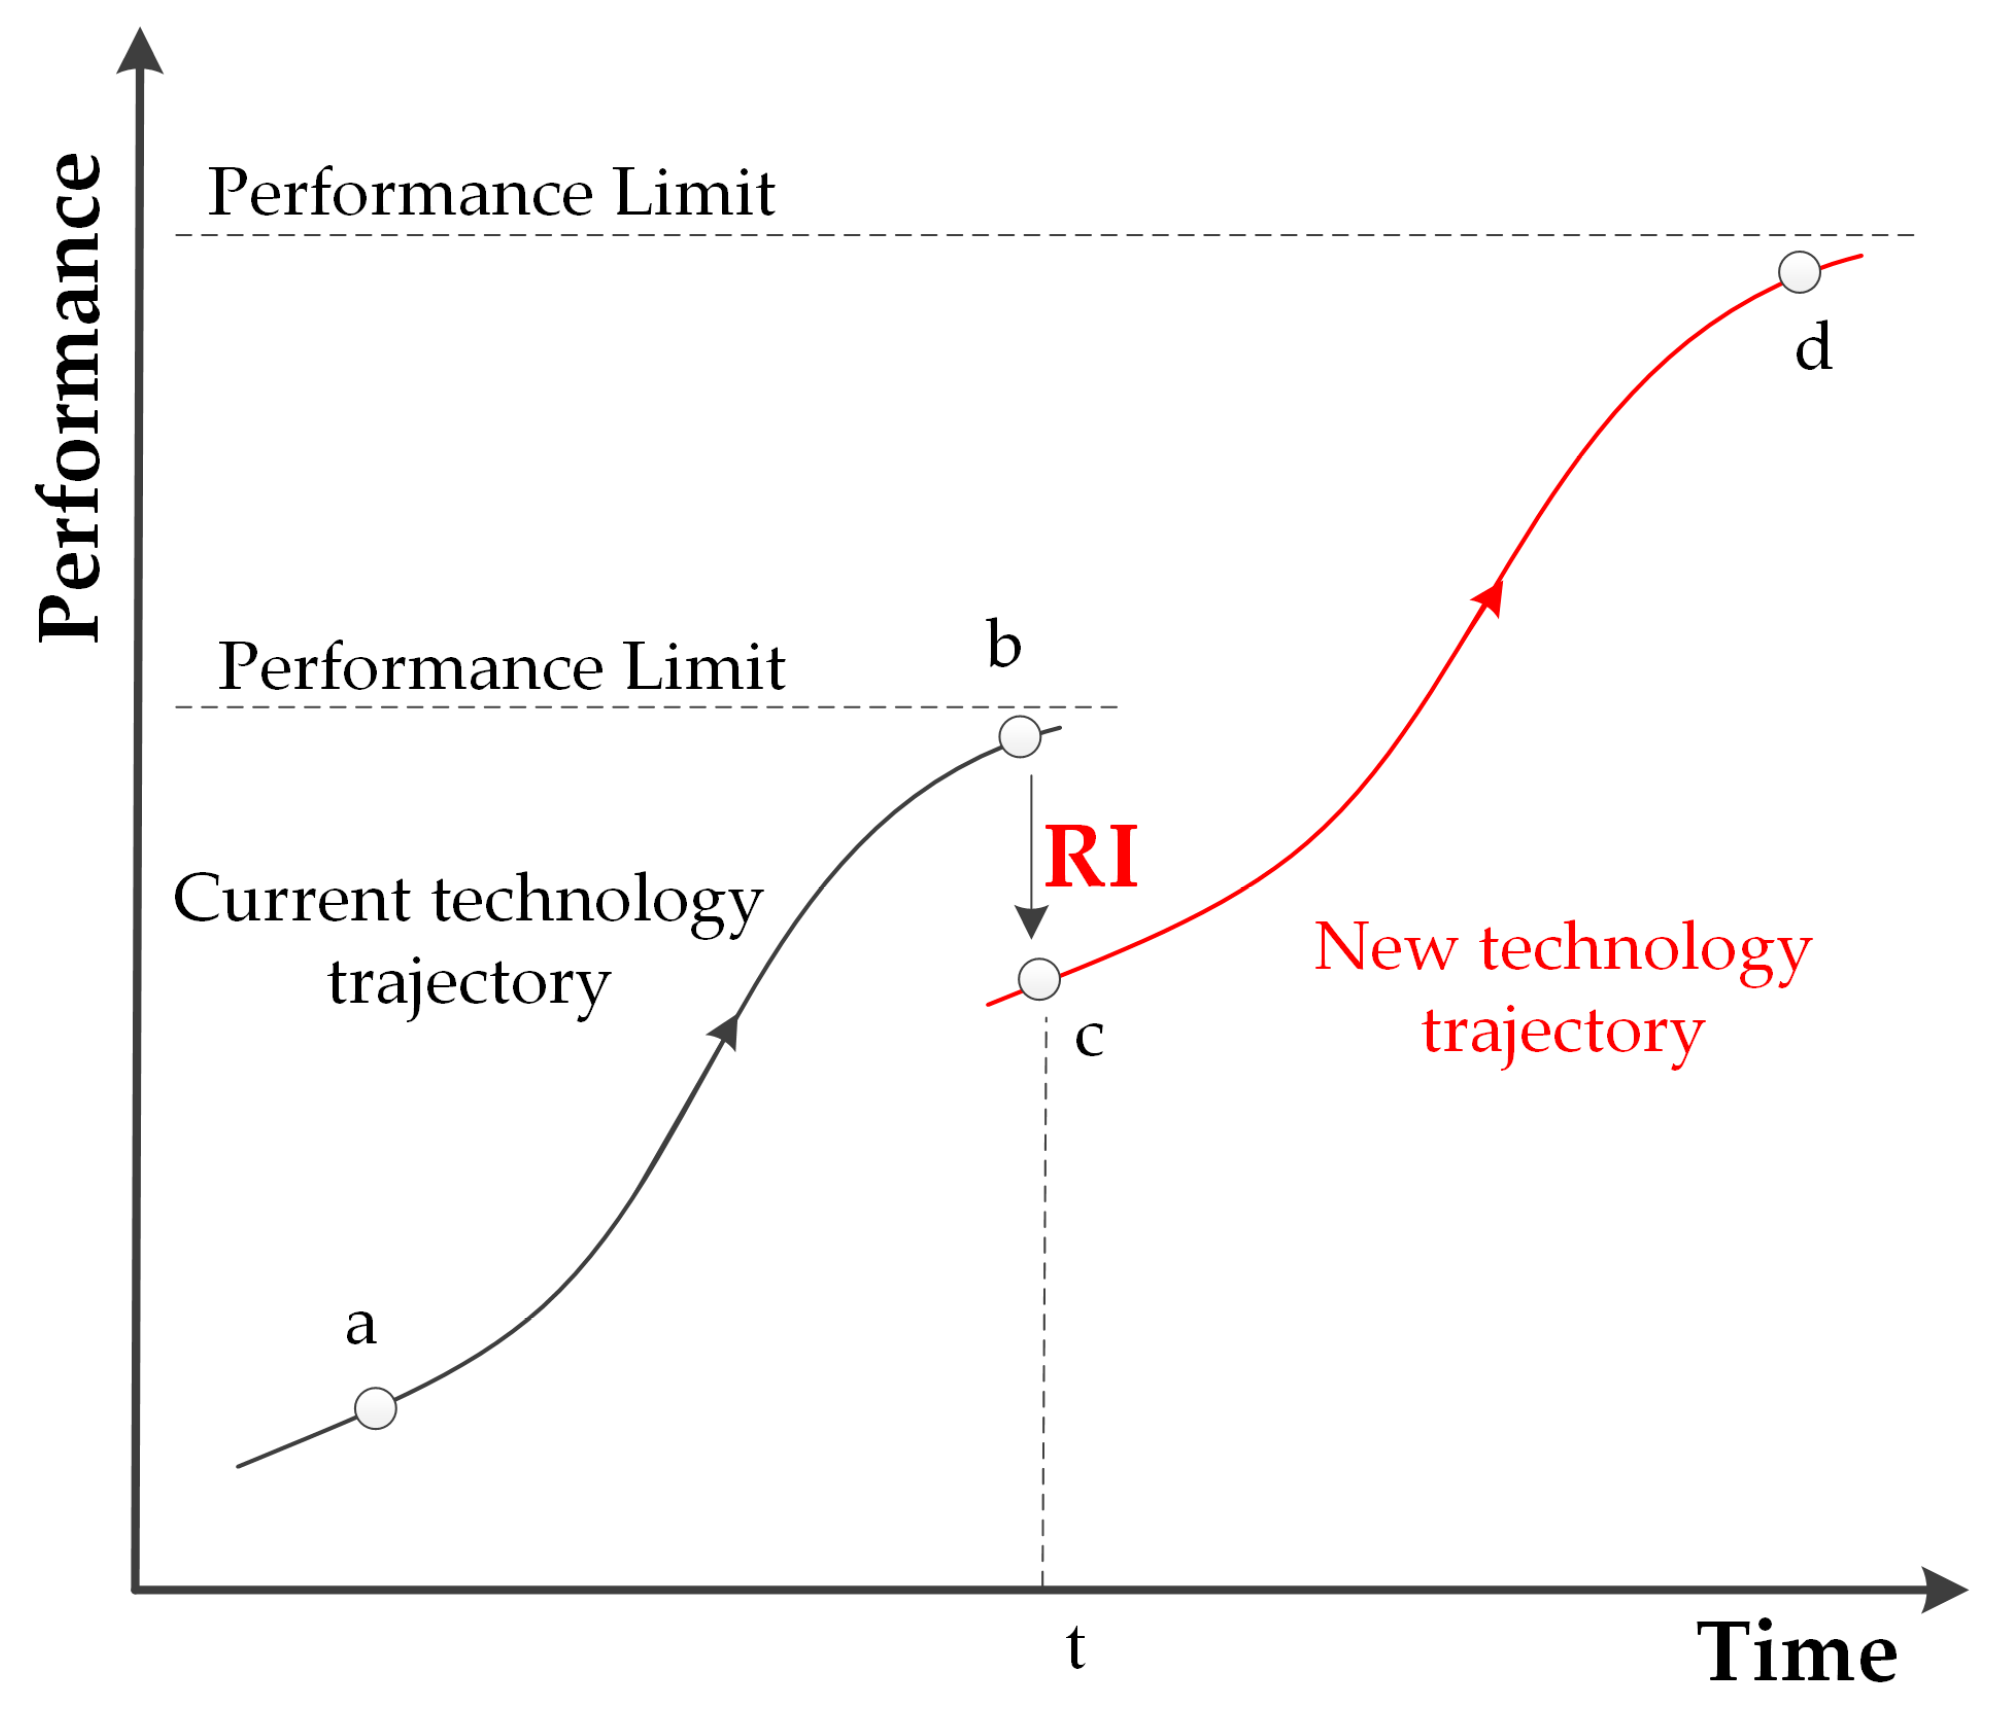
2.1. Definition and Features of RI
- (1)
- Focus on the antecedents of RI, including the novelty of the technology and scientific knowledge;
- (2)
- Focus on the cost, performance, function, and other significant changes in the product itself or entirely new features;
- (3)
- Focus on the macro impact on the industry and market, including the market layout, business model, and improving customer benefits.
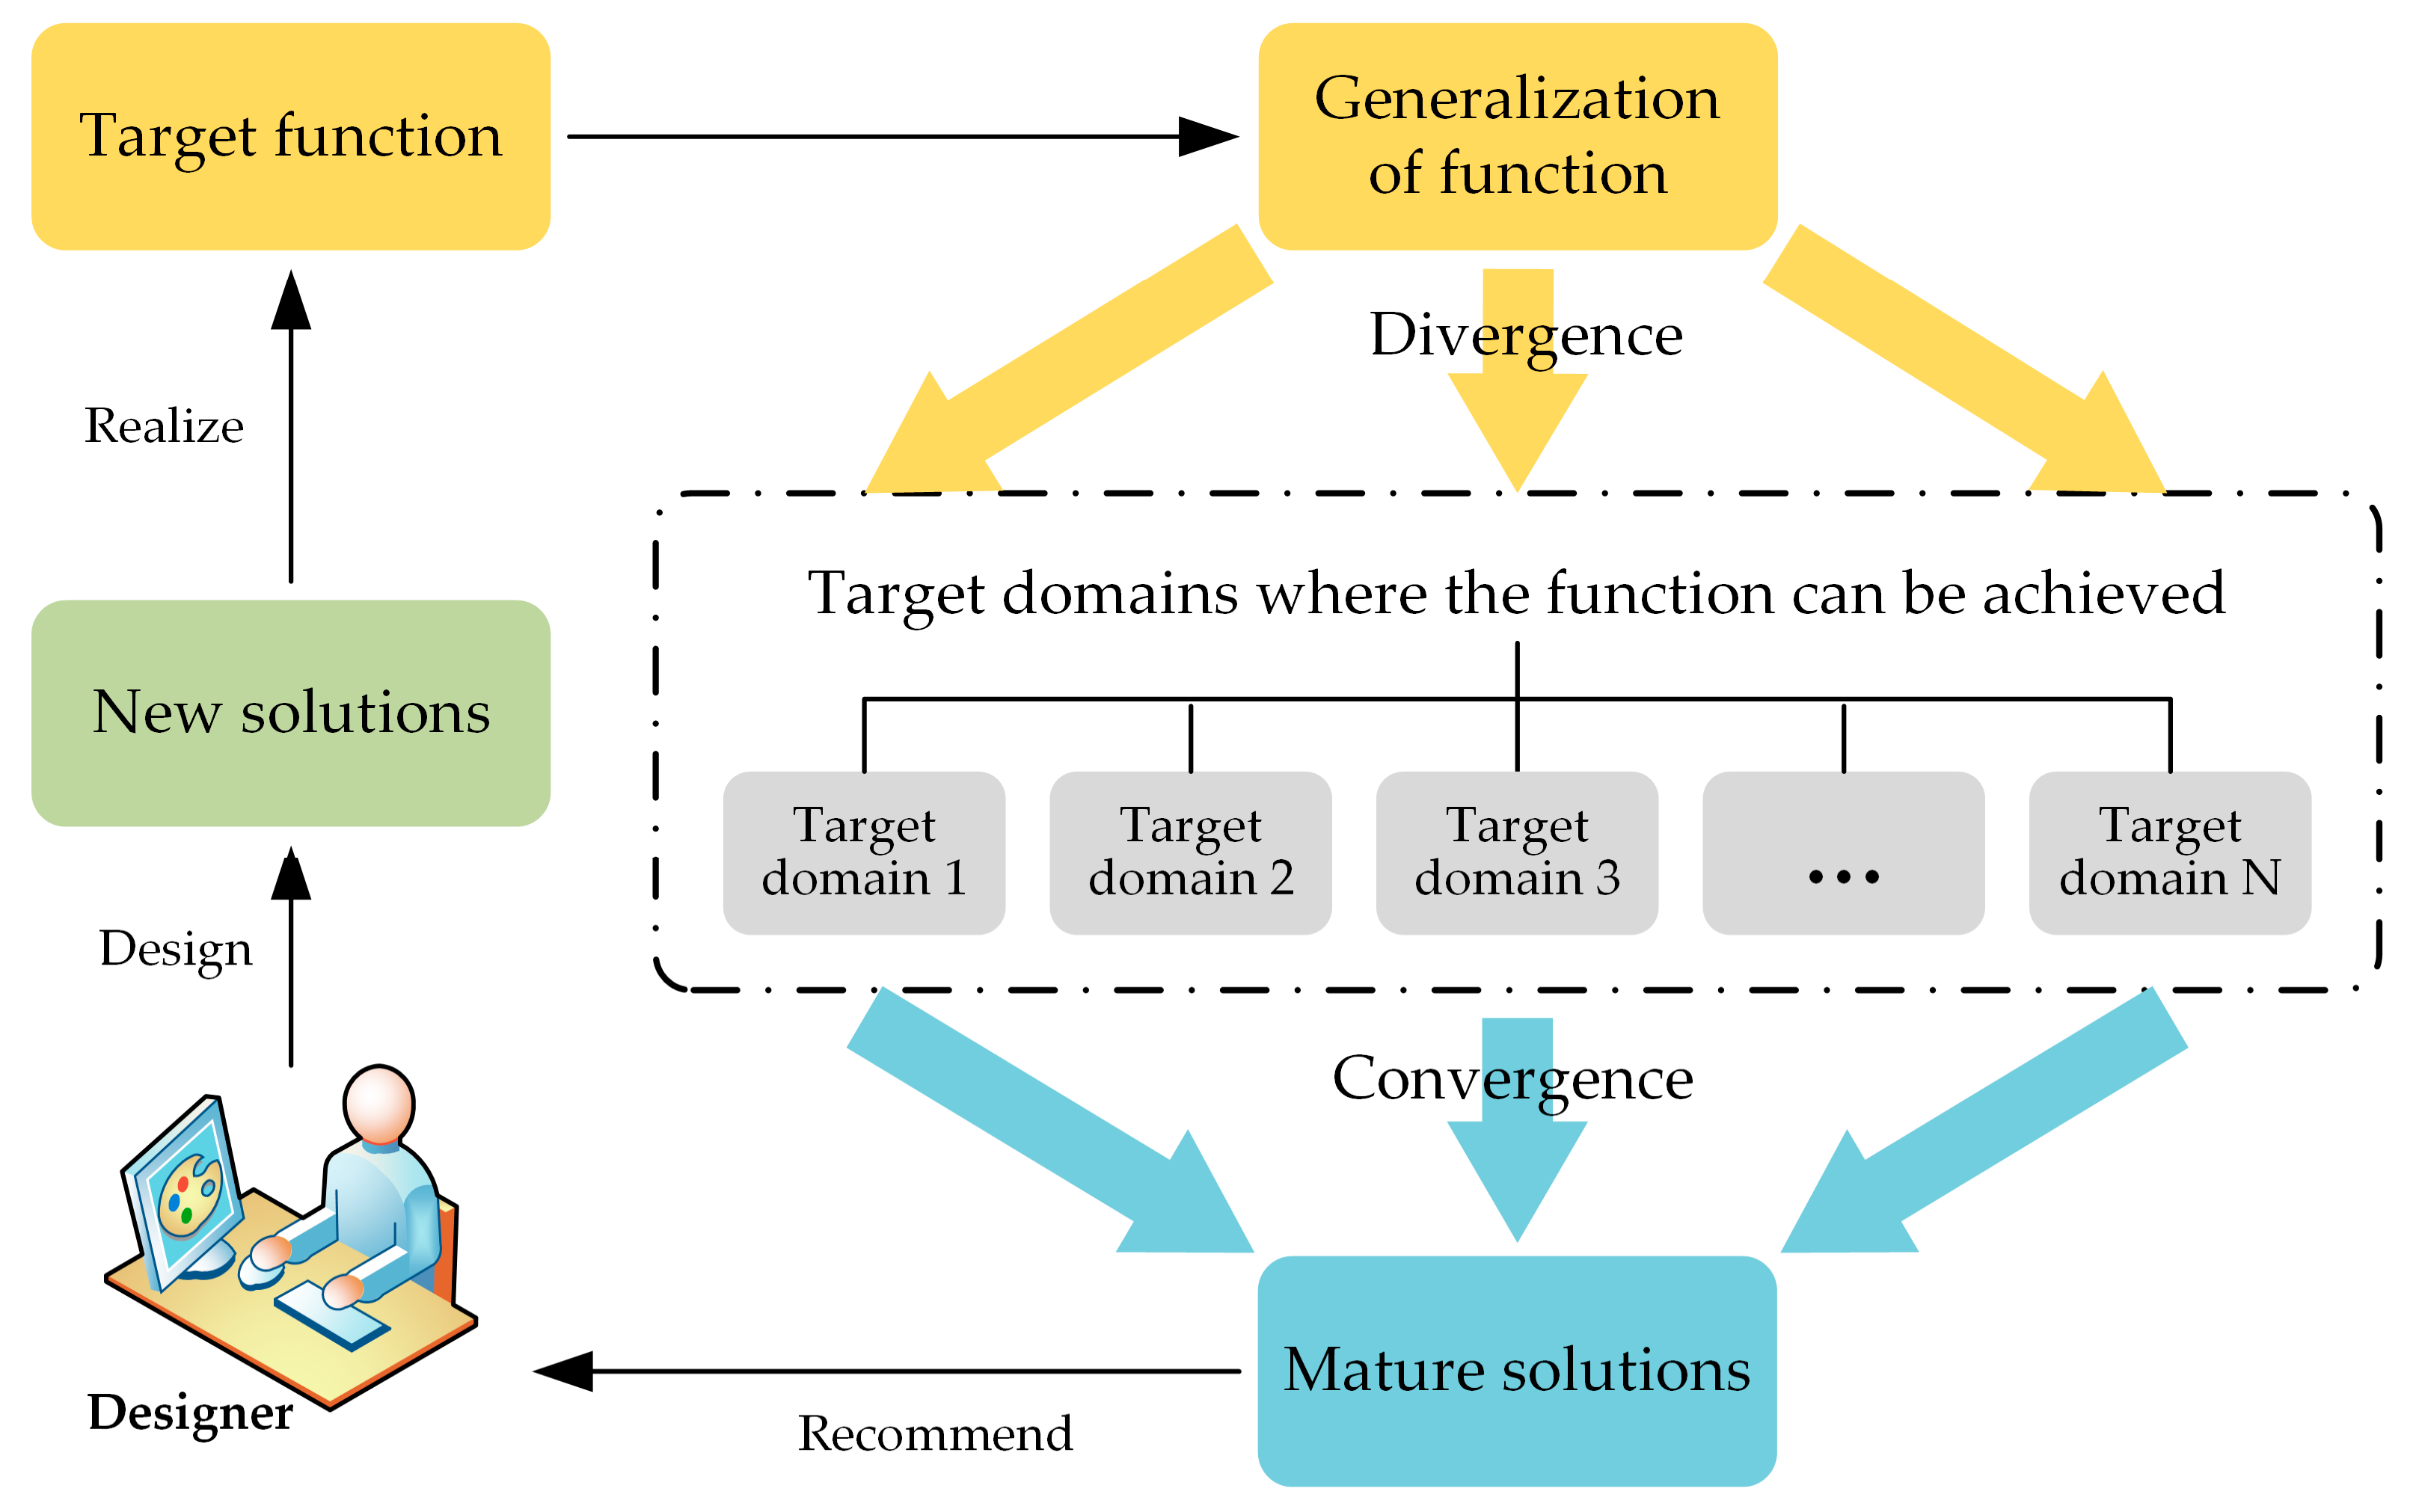
2.2. Applications of FOS
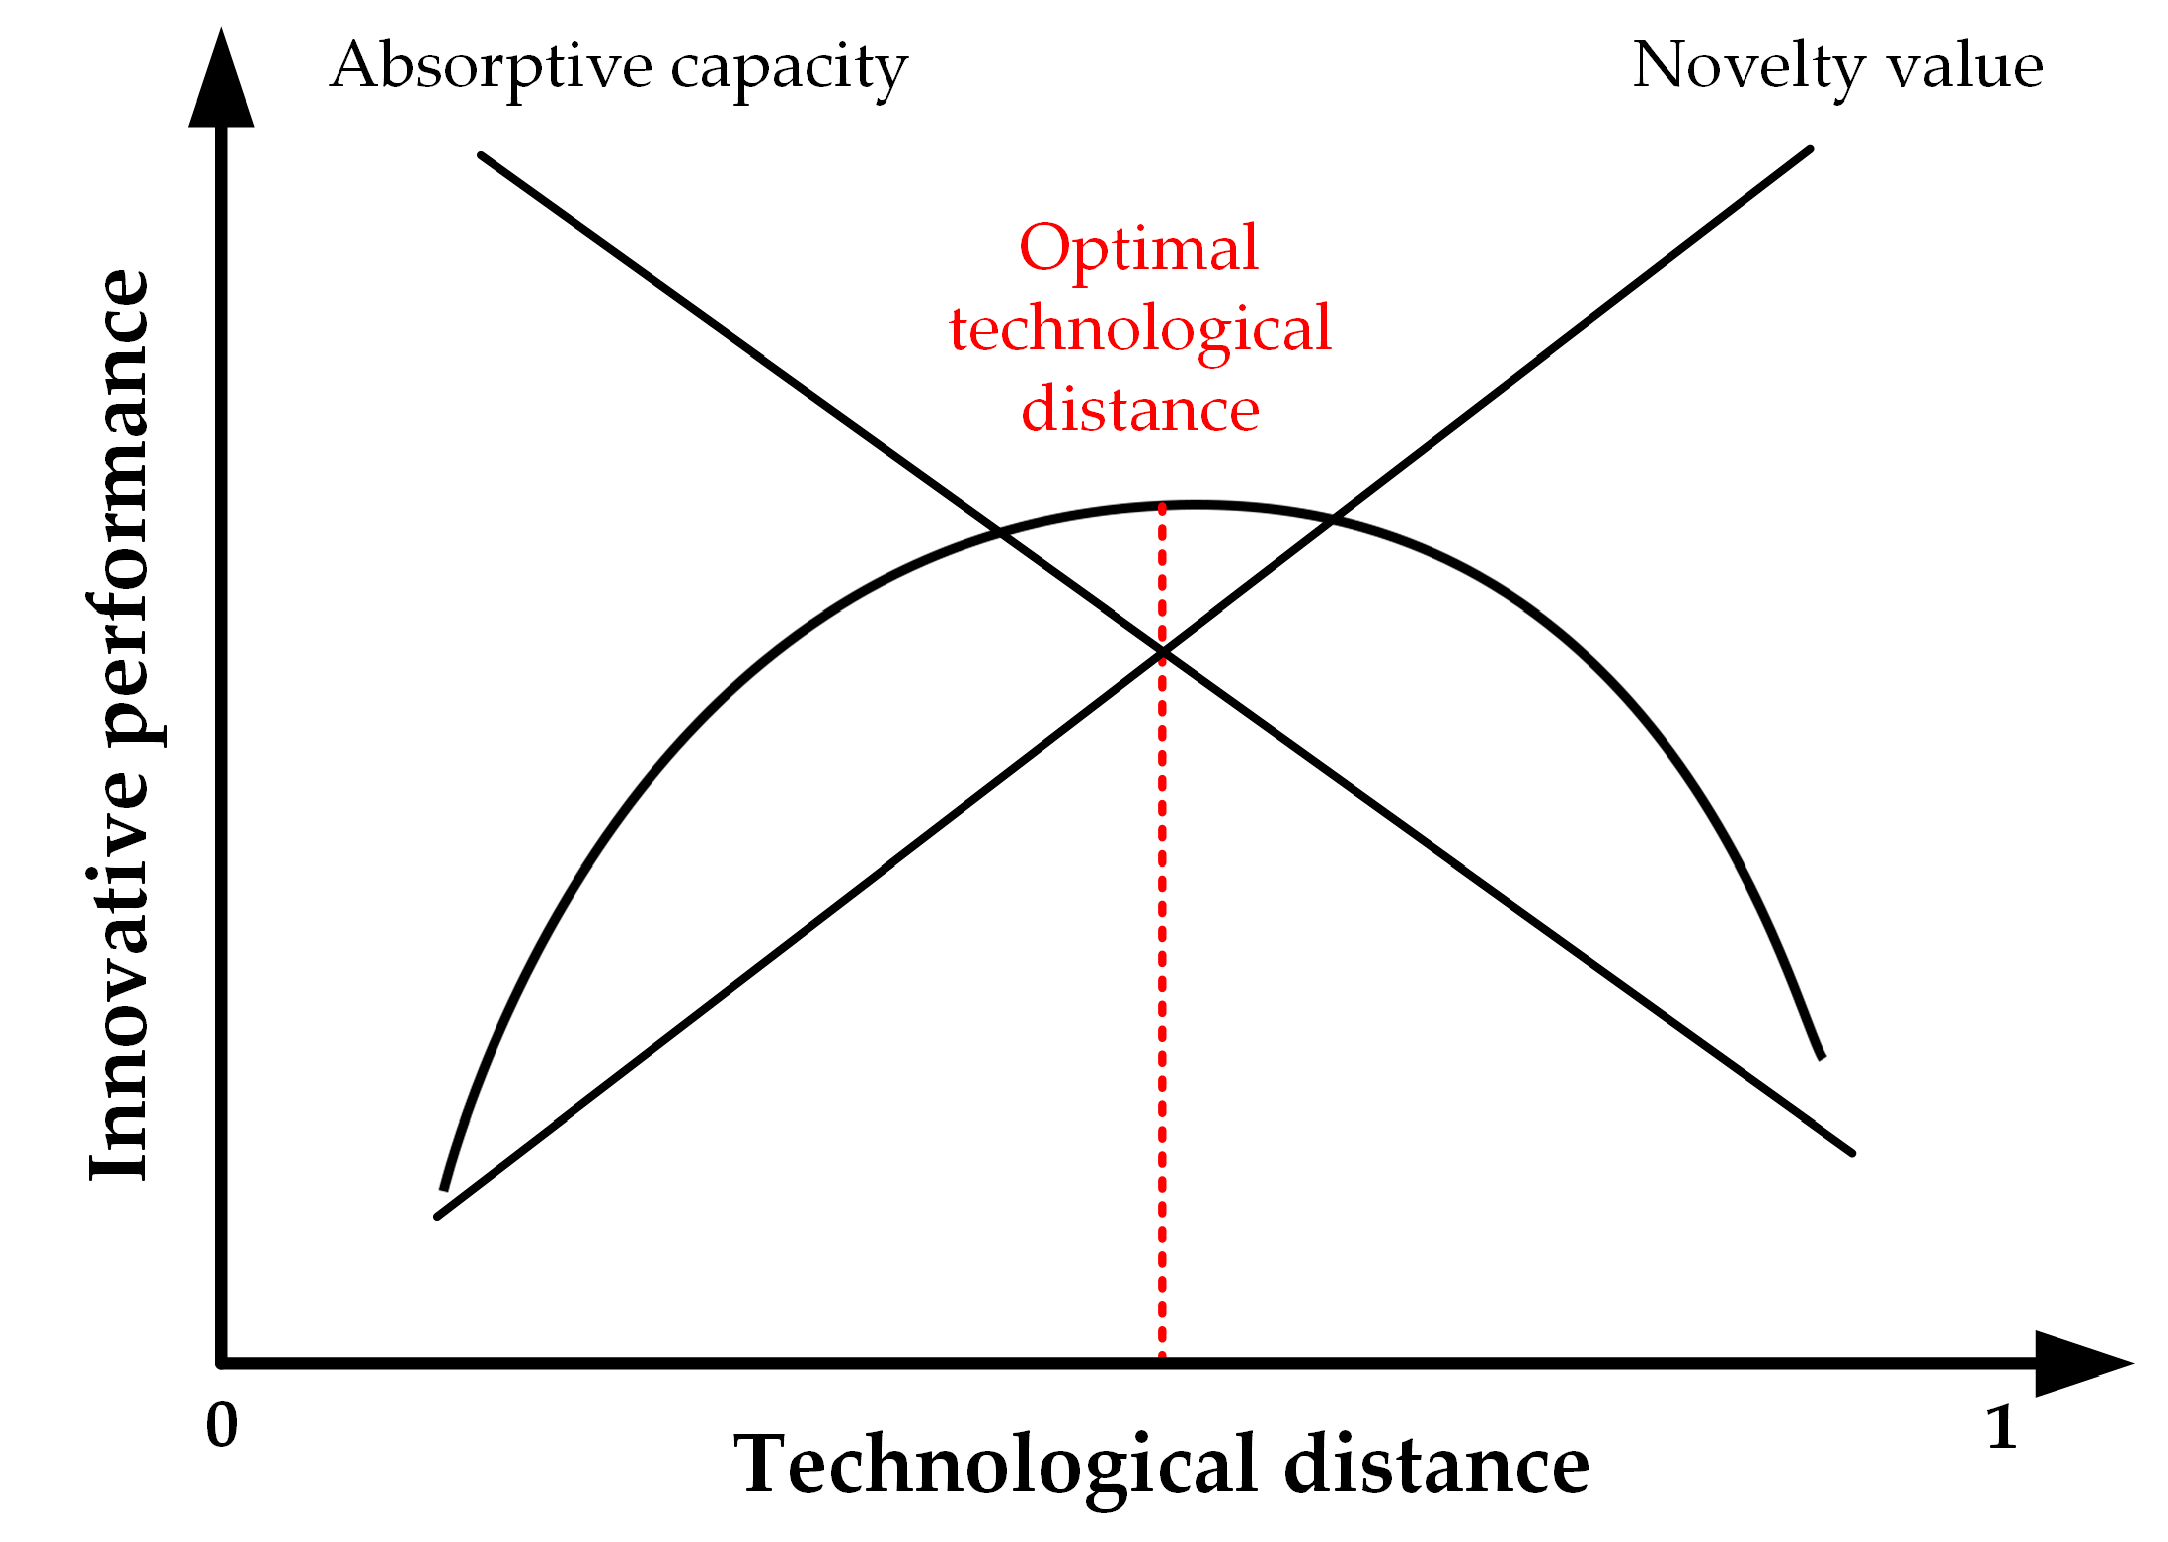
2.3. The Measurement of TD
2.4. Summary
- (1)
- Cross-domain knowledge is crucial for inspiring radical innovative design, but how to accurately search for the most appropriate cross-domain knowledge is the current problem.
- (2)
- There is a complementary relationship between FOS and the measurement of TD, which can provide a new way for firms to achieve RI. This is reflected in the fact that using FOS can obtain the patent sets of the problem domain and the target domains, which can be used to replace the patent set of firms and transfer the comparison of technology distribution from firms to products or knowledge domains, to solve the problem of lack of generalizability in the measurement of TD. In addition, selecting the most appropriate source of knowledge by measuring the TD between the problem domain and target domains can improve the completeness of the FOS.
- (3)
- To improve the accuracy of measuring TD, the first and second levels of the IPC system can be used to indicate the patent vectors, combined with the min-complement distance, to calculate the TD.
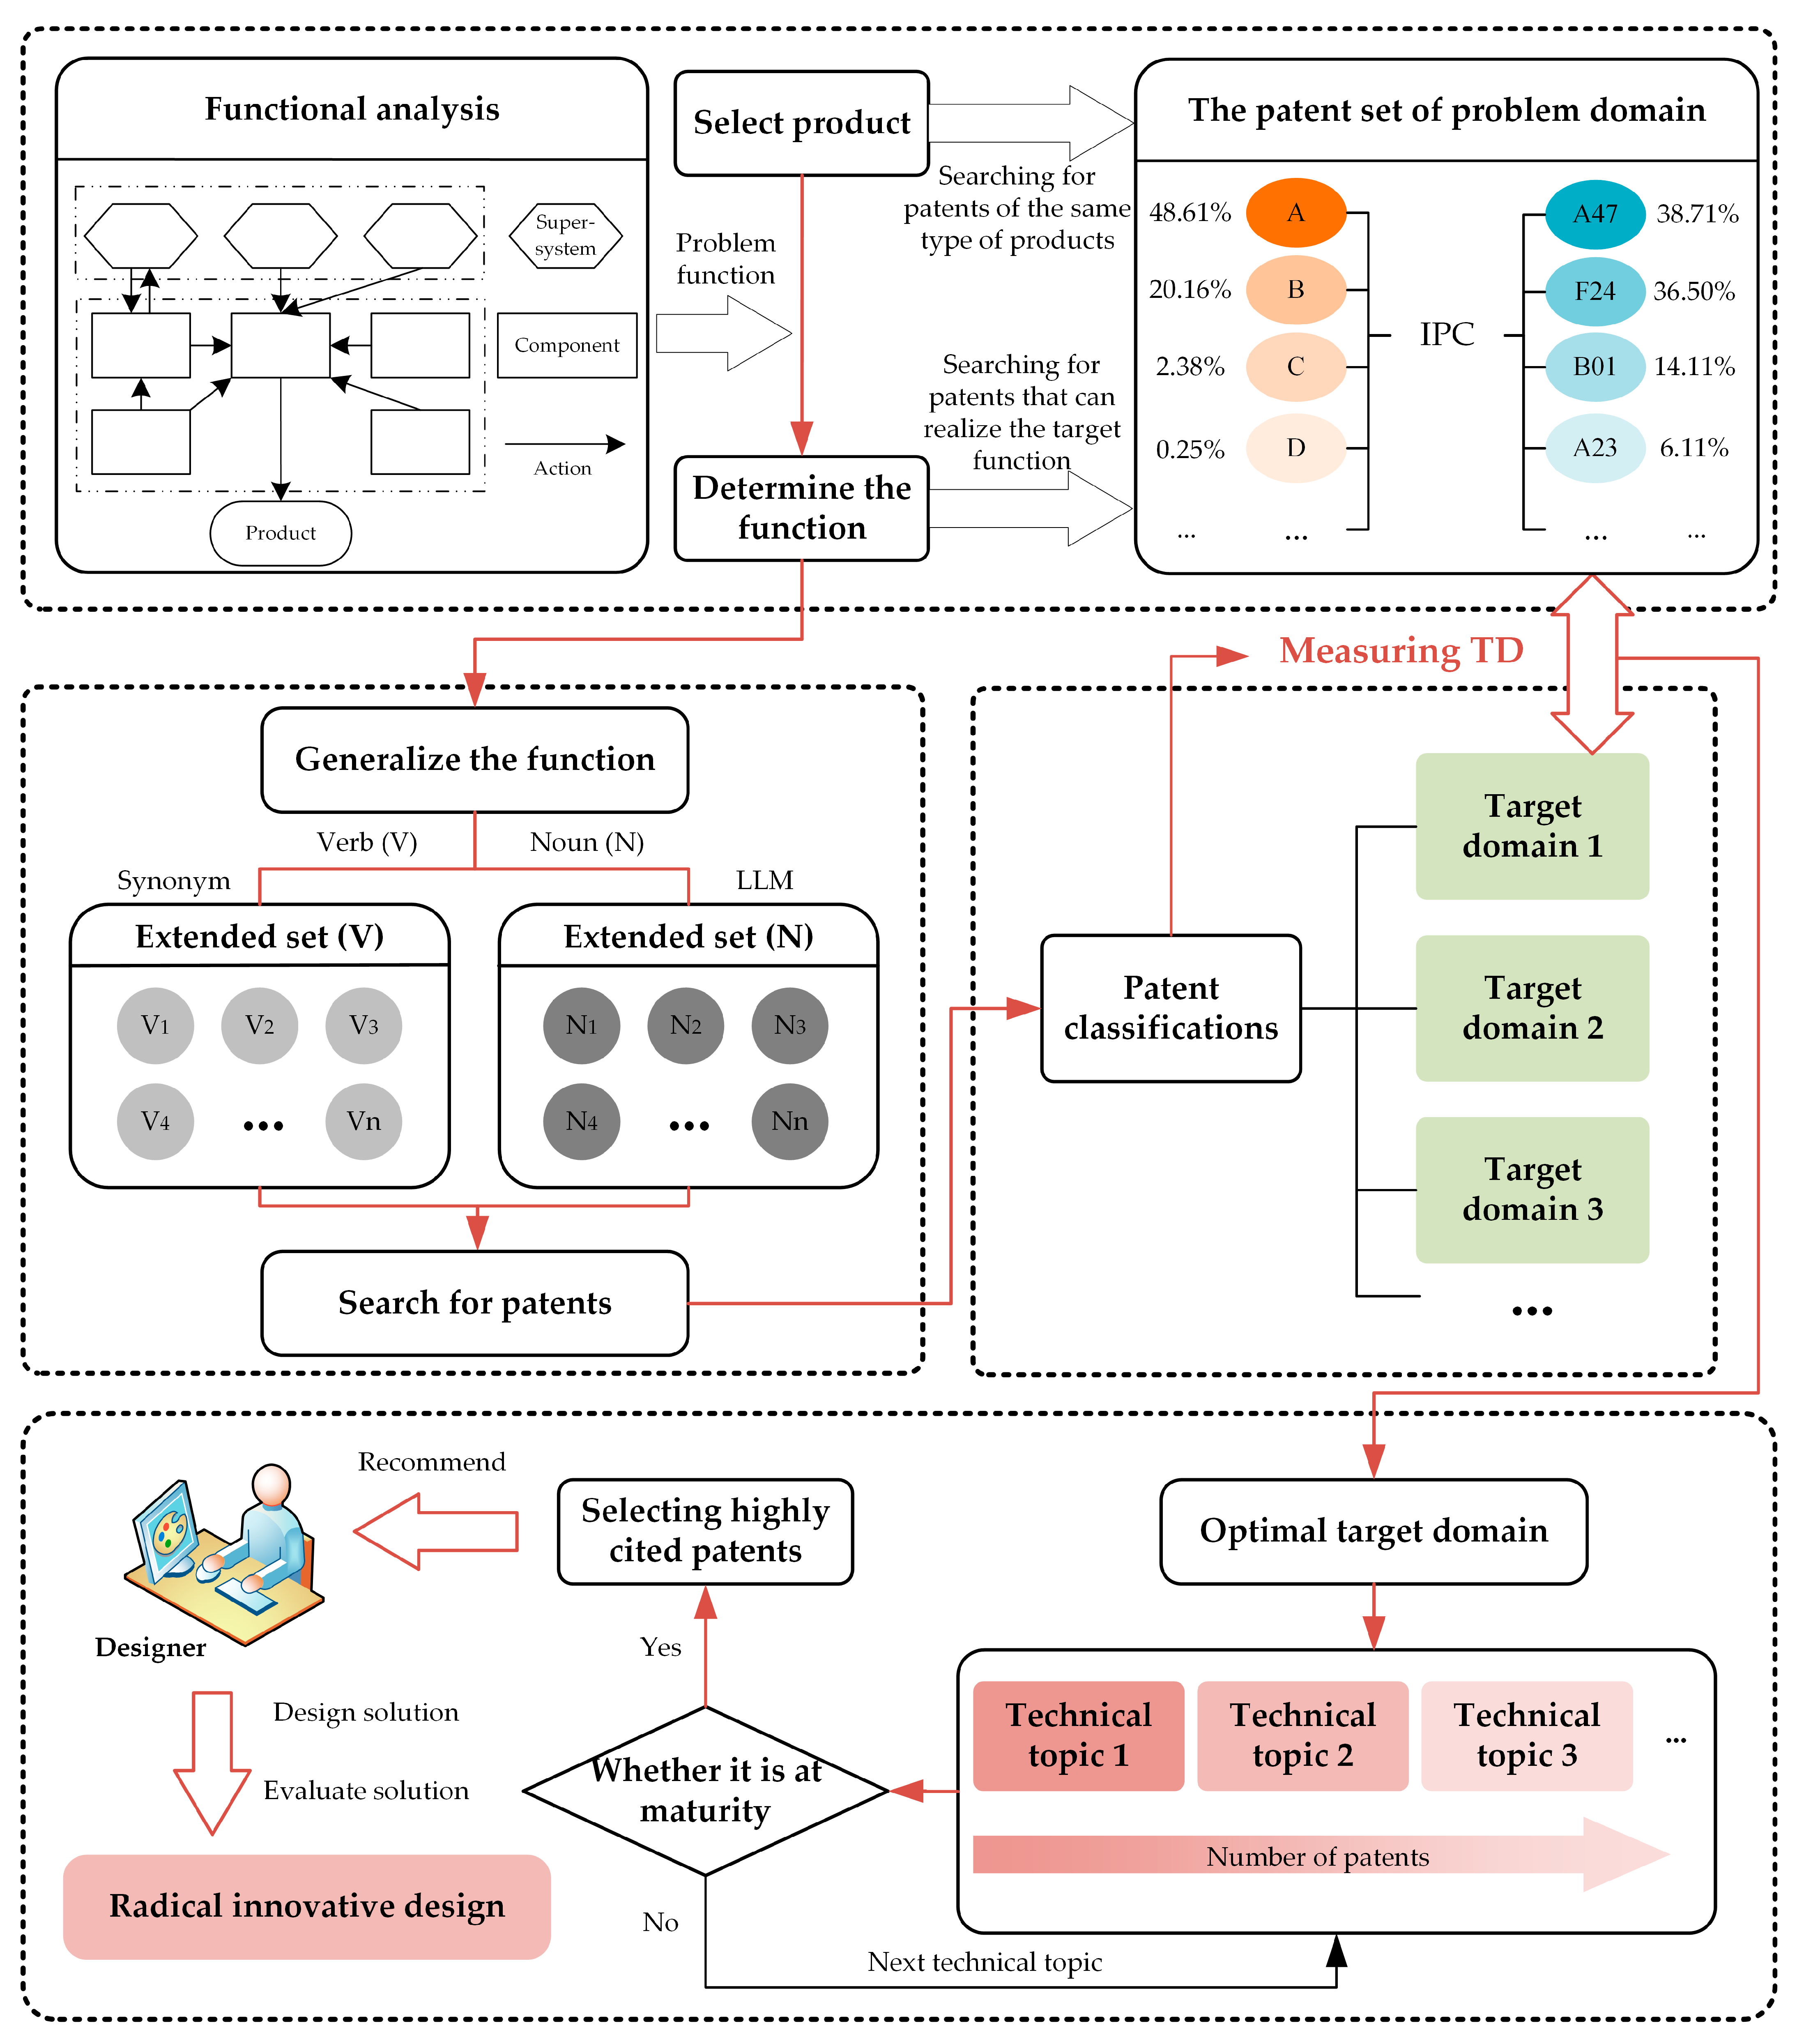
3. Proposed Method
- (1)
- After identifying the product and function, construct the patent set of the problem domain;
- (2)
- Generalize the target function to search relevant patents;
- (3)
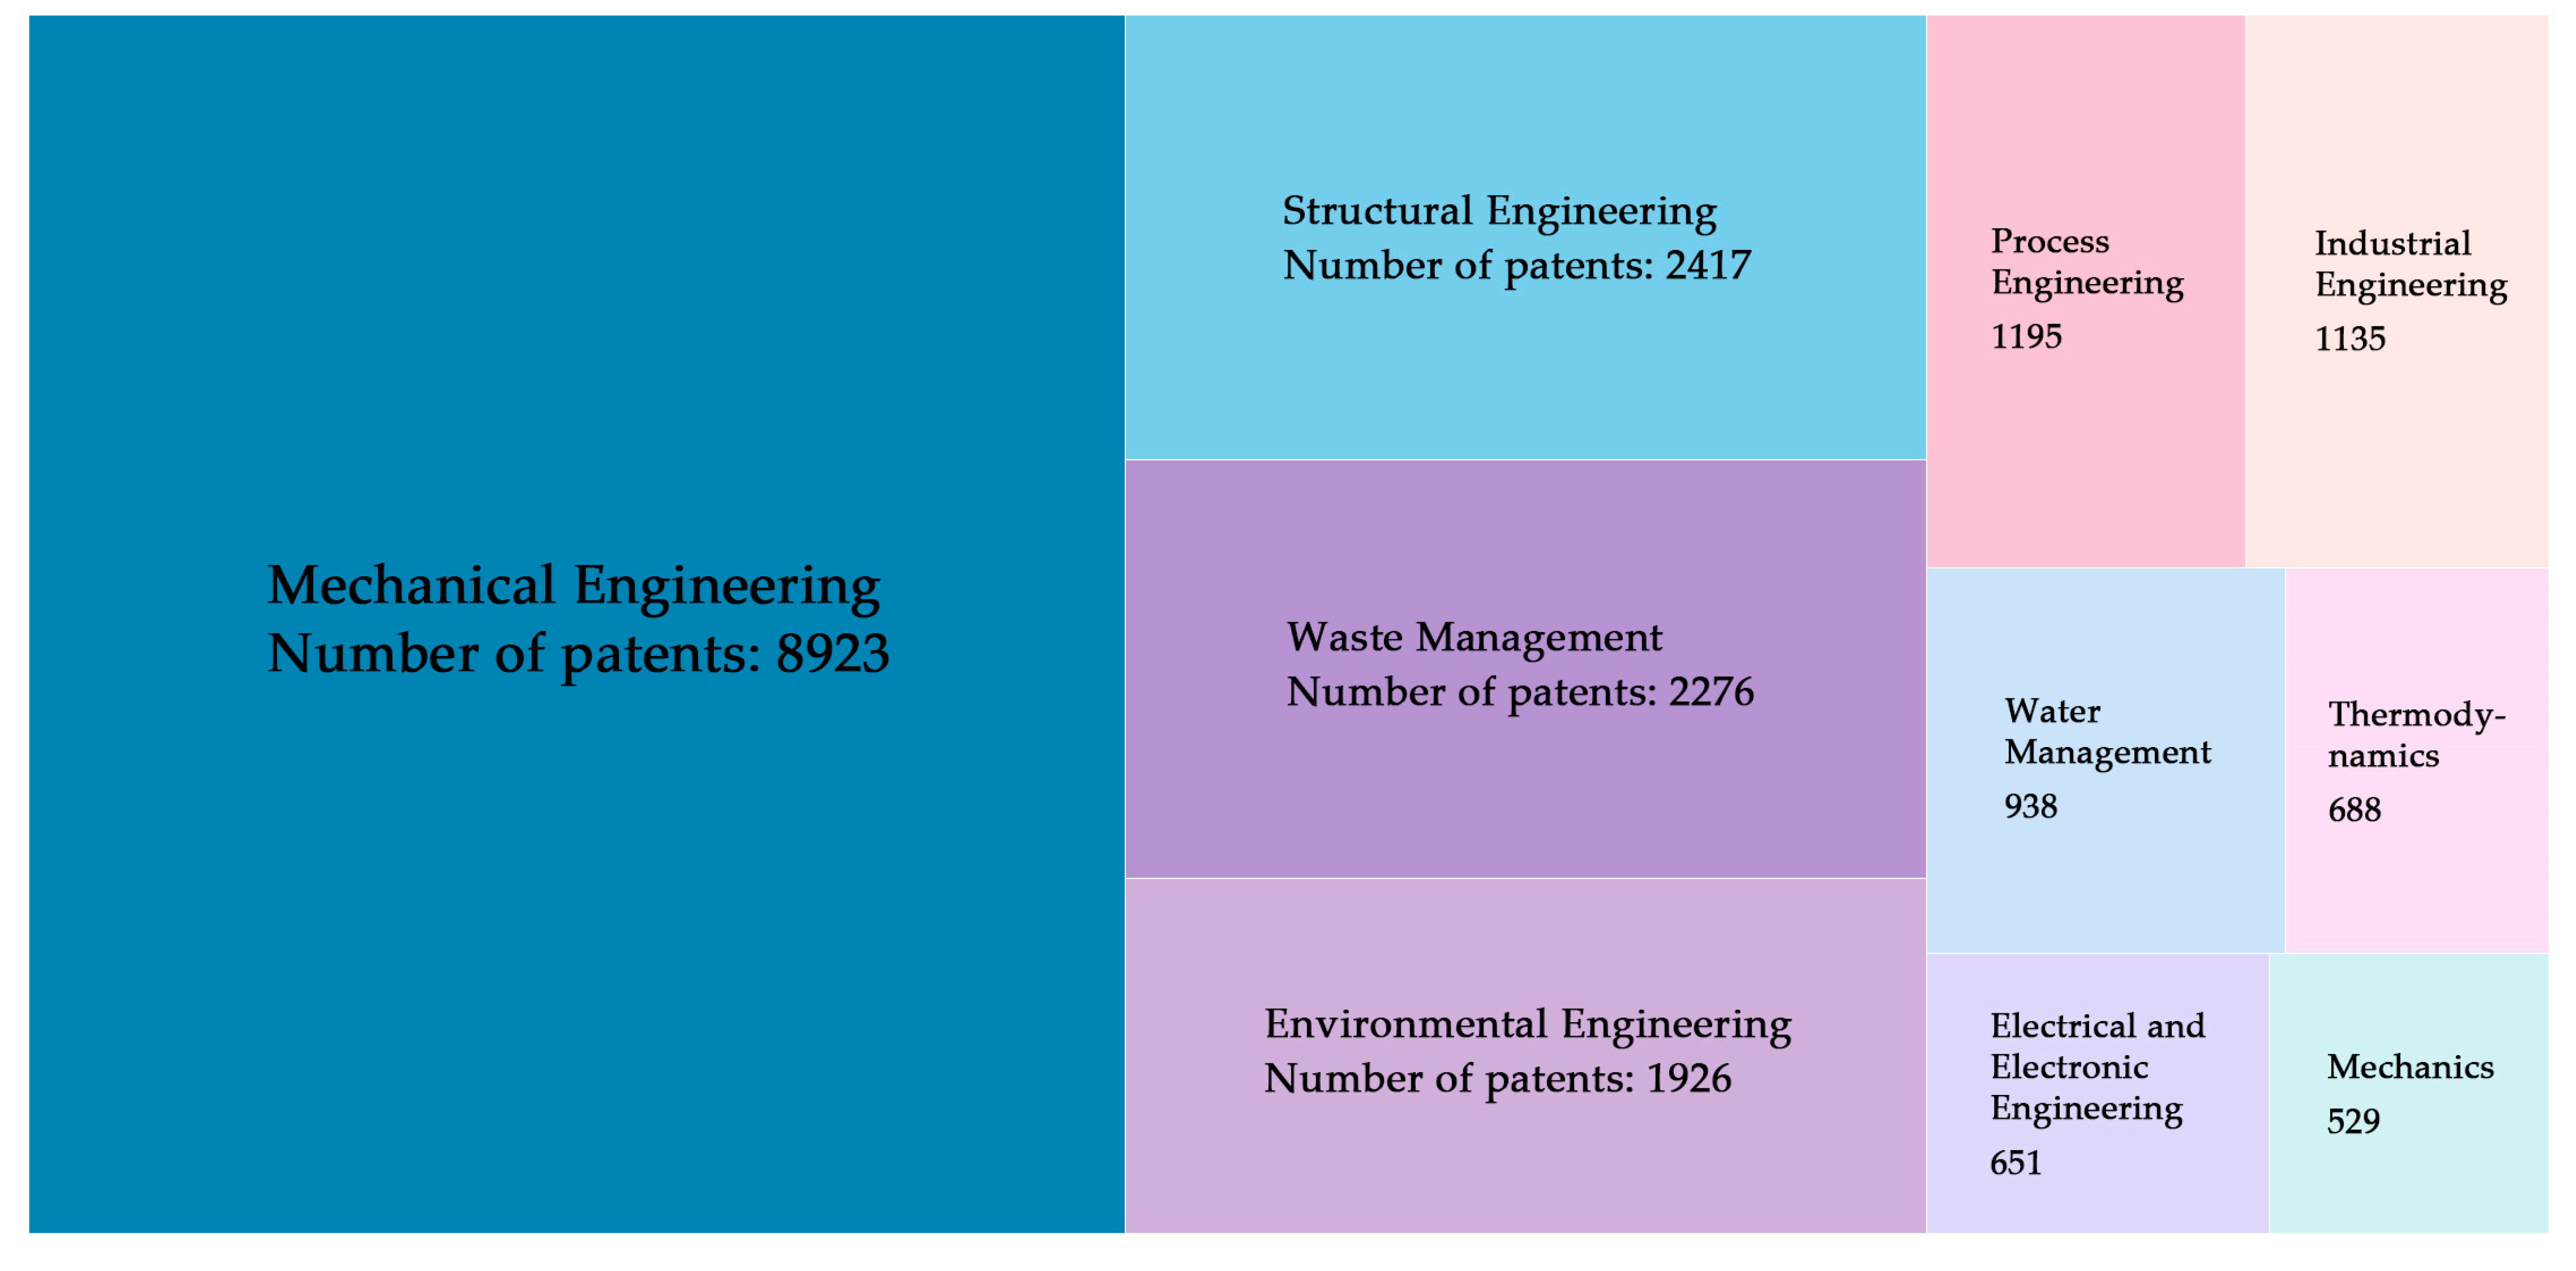
- Categorize the searched patents and construct the set of patents in the target domain;
- (4)
- Measure the TD between the problem domain and the target domains;
- (5)
- Determine the best target domain;
- (6)
- Recommend the patent schemes to the designer;
- (7)
- Design and evaluate the new solution.
3.1. The Construction of Patent Sets Based on FOS
3.1.1. The Patent Set of Problem Domain
3.1.2. The Patent Set of Target Domains
3.2. The Optimization of TD Measurement
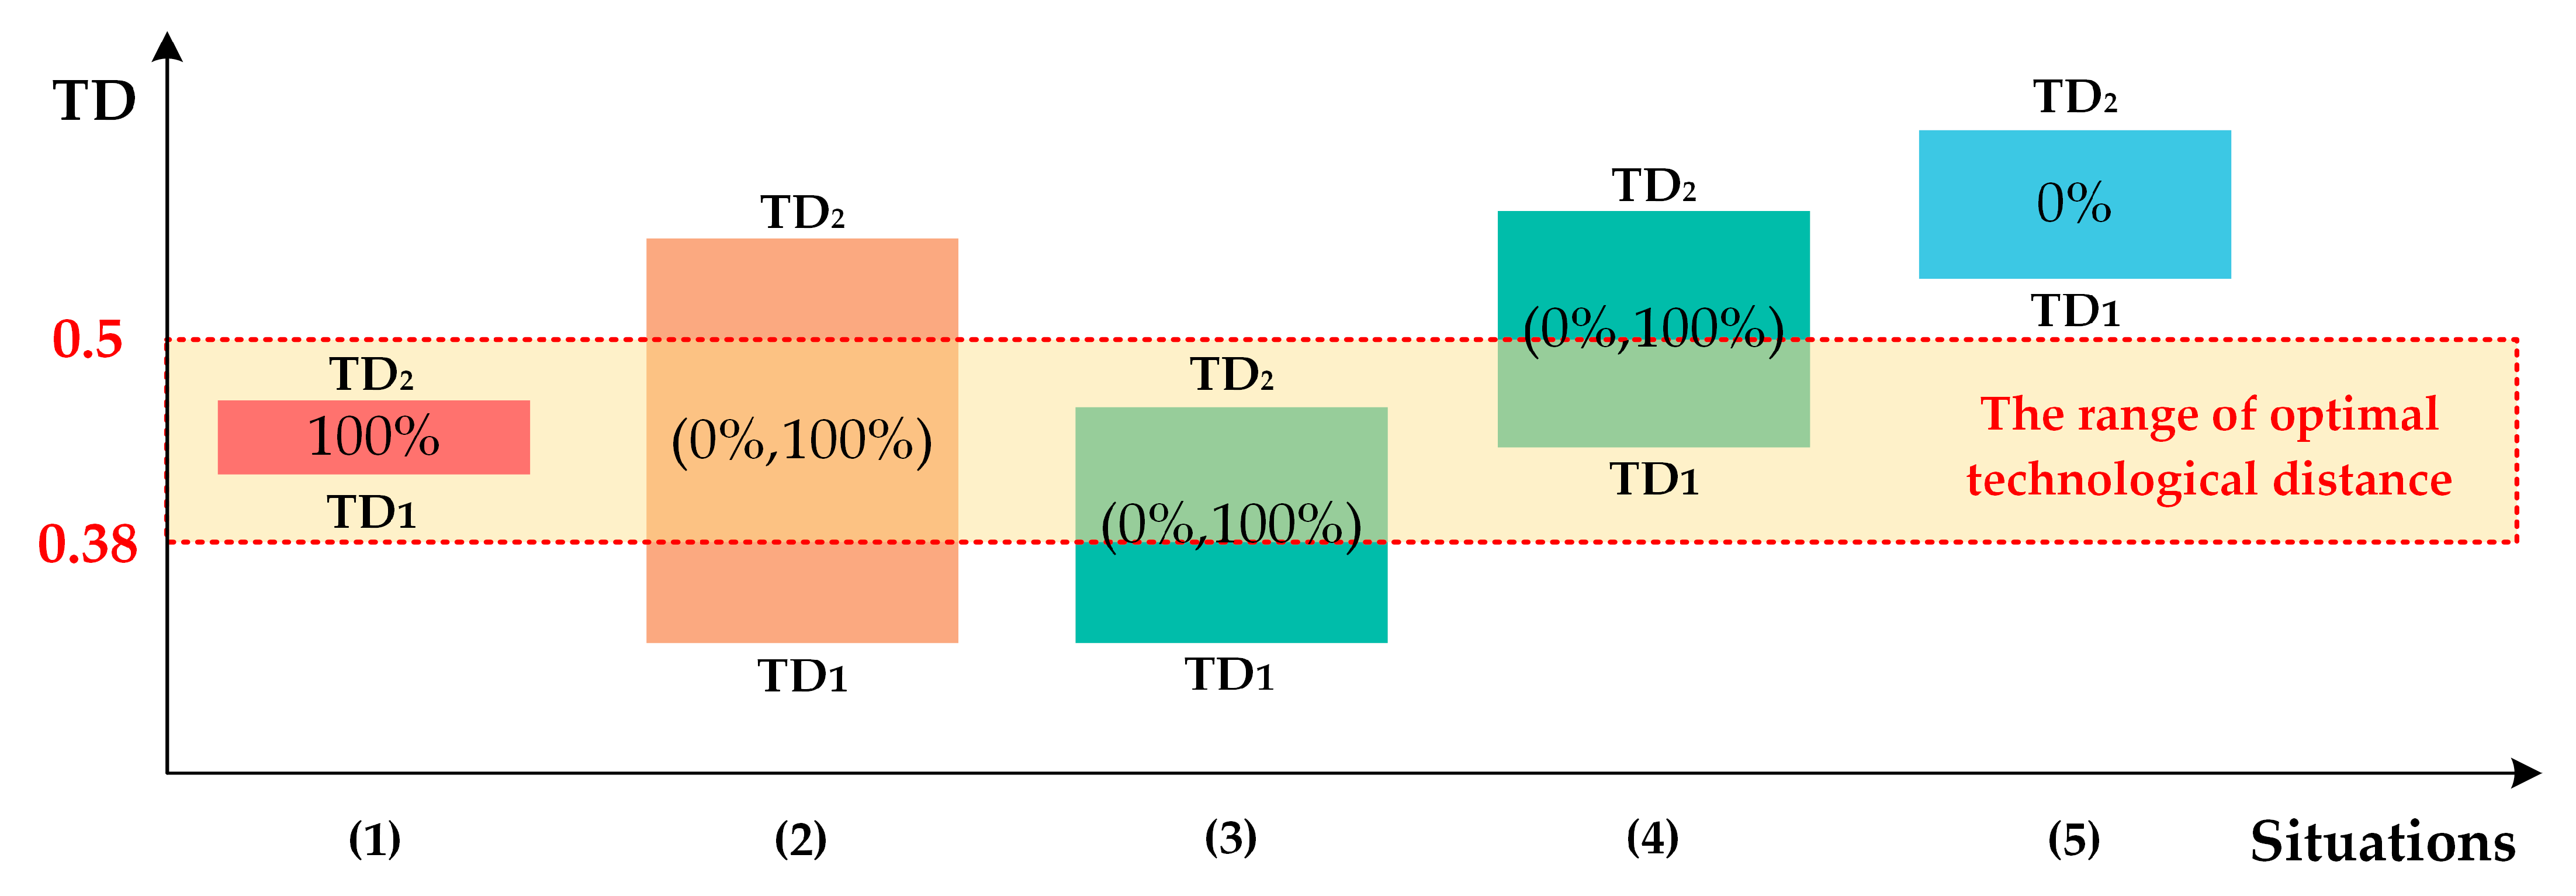
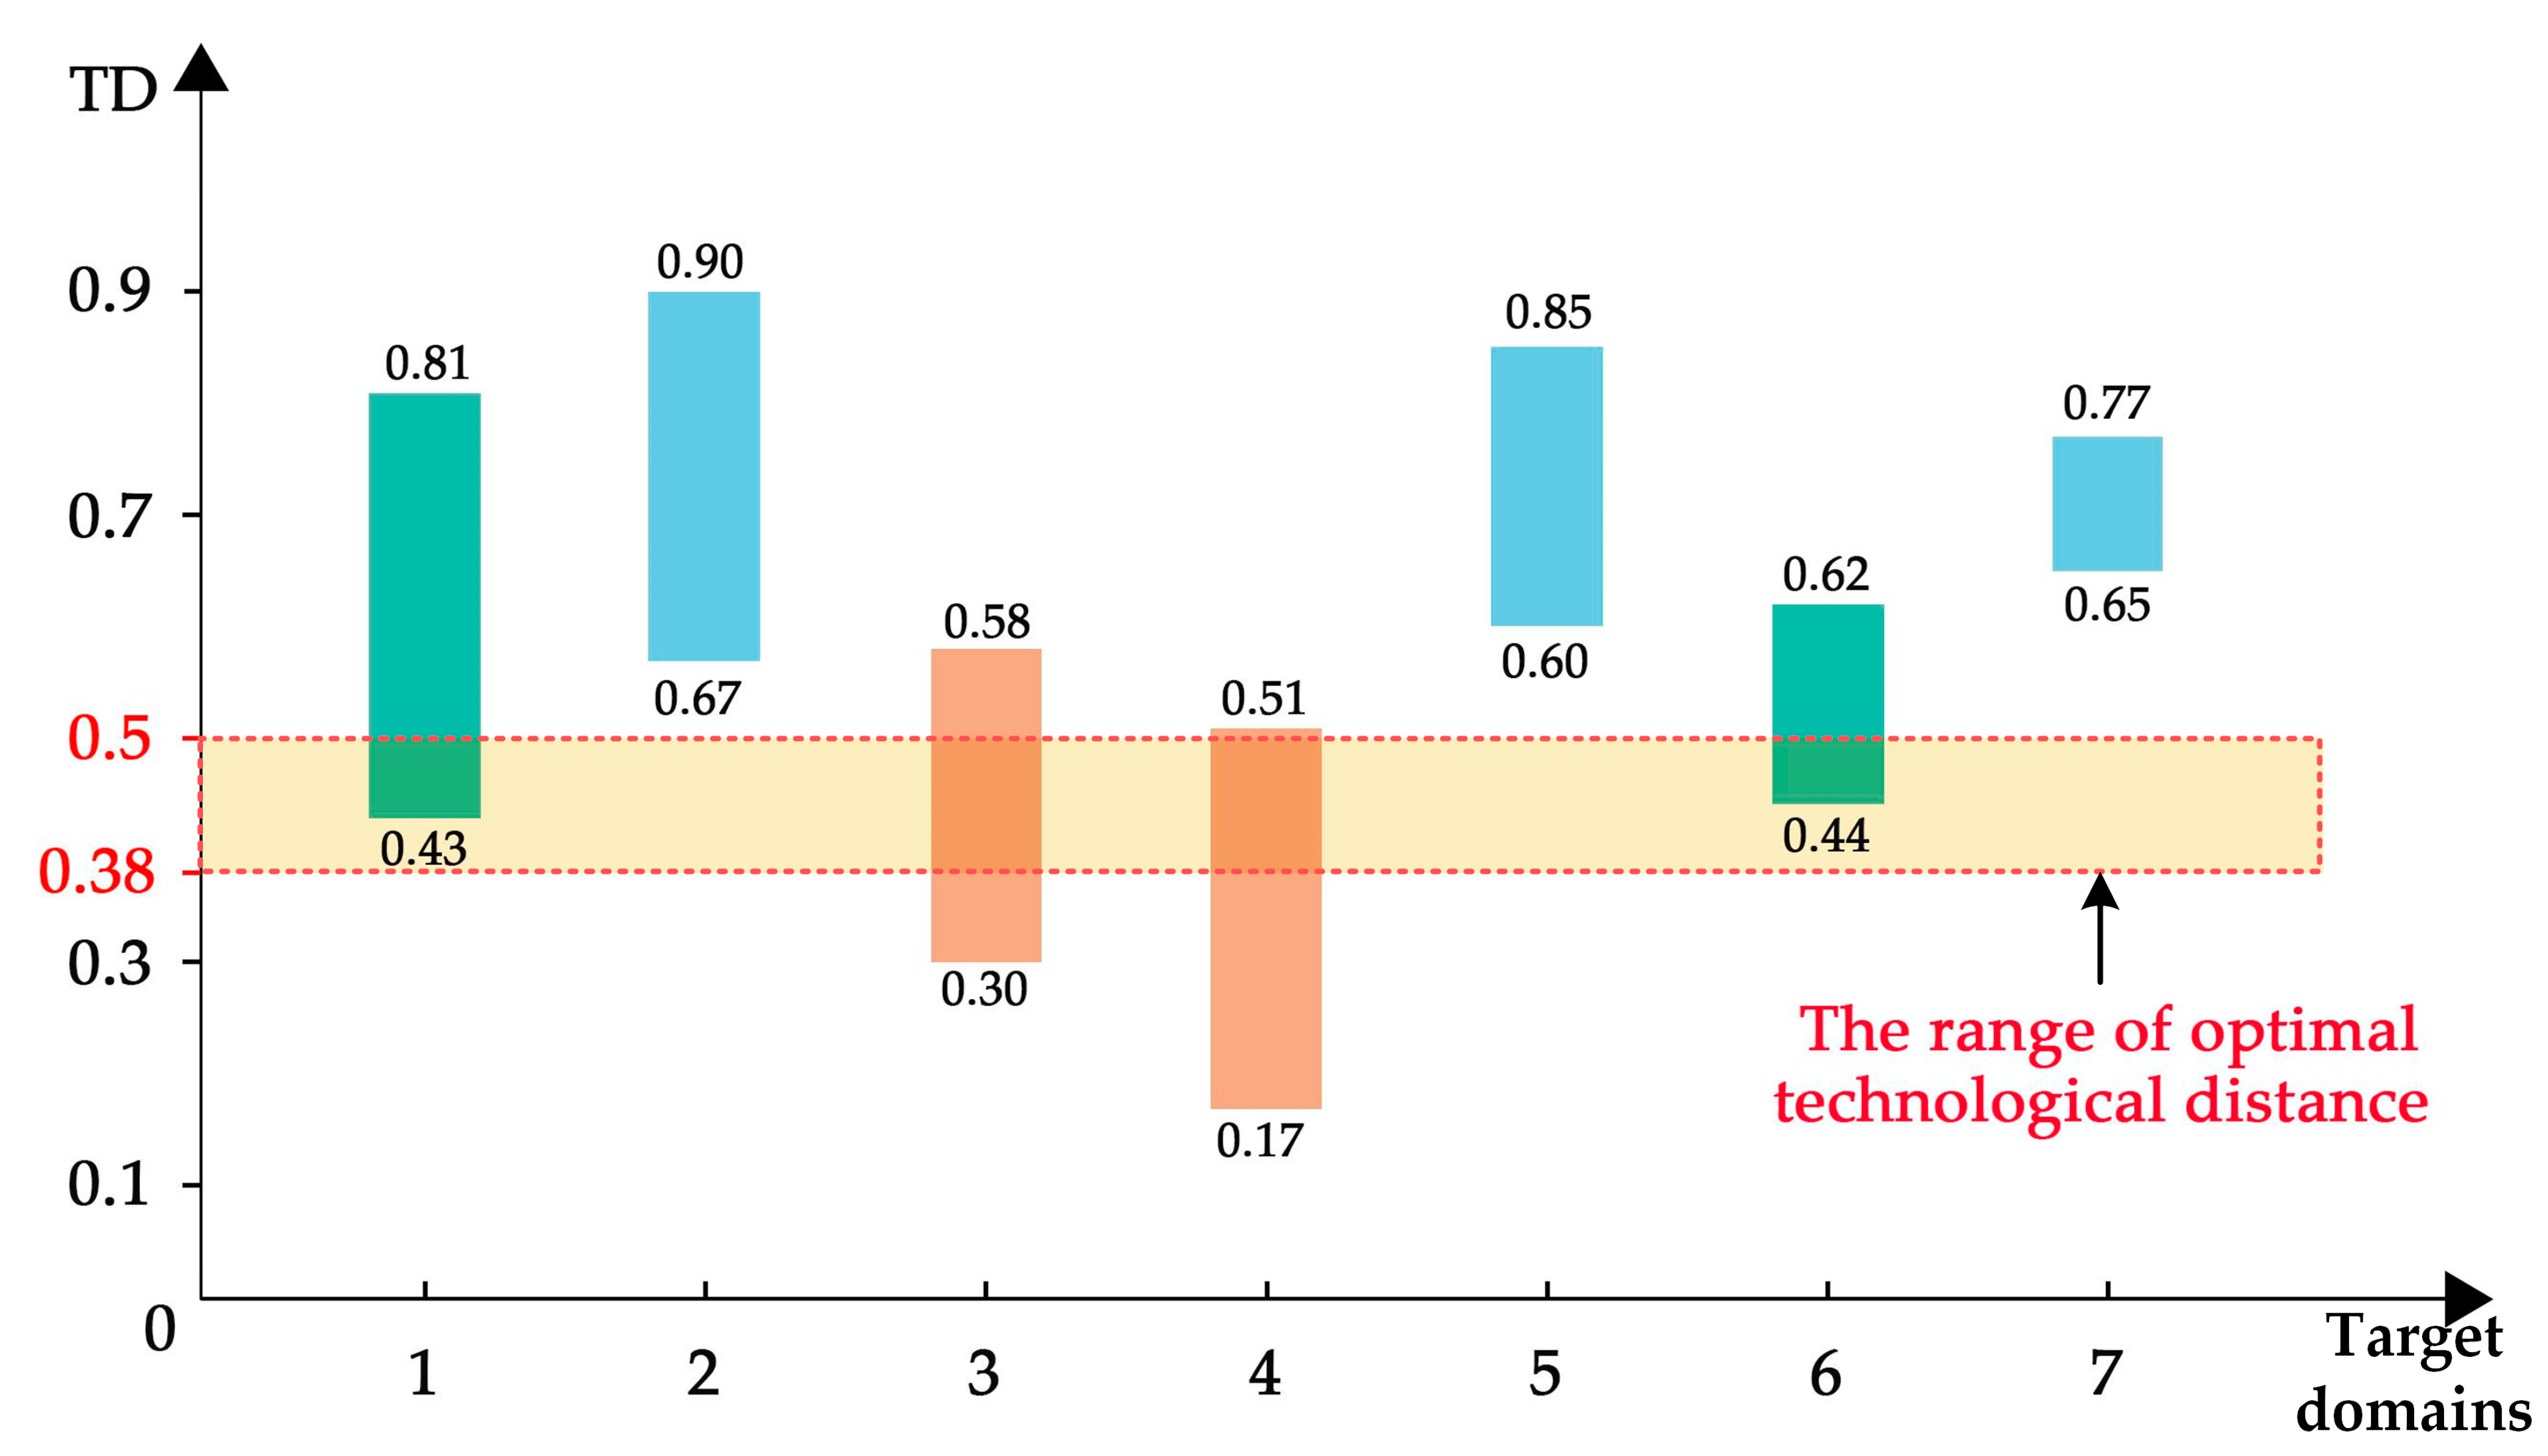
3.3. The Determination of Optimal Target Domain
- TD1 ∈ [0.38, 0.5] and TD2 ∈ [0.38, 0.5], the overlap between this range of TD and the range of optimal TD is 100%;
- TD1 ∈ [0, 0.38] and TD2 ∈ [0.5, 1], the overlap between this range of TD and the range of optimal TD is calculated as shown in Equation (3);
- 3.
- TD1 ∈ [0, 0.38] and TD2 ∈ [0.38, 0.5], the overlap between this range of TD and the range of optimal TD is calculated as shown in Equation (4);
- 4.
- TD1 ∈ [0.38, 0.5] and TD2 ∈ [0.5, 1], the overlap between this range of TD and the range of optimal TD is calculated as shown in Equation (5);
- 5.
- TD1 and TD2 ∈ [0.5, 1] or TD1 and TD2 ∈ [0, 0.38], the overlap between this range of TD and the range of optimal TD is 0%.
3.4. The Recommendation of Patent Schemes
3.5. The Evaluation of New Solution
4. Case Study
4.1. Establishing the Patent Set of Problem Domain
4.2. Establishing the Patent Set of Target Domains
4.3. Identifying Optimal Target Domain based on the Measurement of TD
4.4. Recommending Patent Schemes to Designers
4.5. Design and Evaluate New Solution
5. Discussion and Conclusions
5.1. Contributions
5.2. Limitations and Future Study Opportunities
Author Contributions
Funding
Institutional Review Board Statement
Informed Consent Statement
Data Availability Statement
Conflicts of Interest
Appendix A

| Class | Basic | Synonyms |
|---|---|---|
| Branch | Separate | Switch, Divide, Release, Detach, Disconnect, Disassemble, Subtract, Cut, Polish, Sand, Drill, Lathe |
| Refine | Purify, Strain, Filter, Percolate, Clear | |
| Distribute | Diverge, Scatter, Disperse, Diffuse, Empty, Absorb, Dampen, Dispel, Resist, Dissipate | |
| Channel | Import | Input, Receive, Allow, Form Entrance, Capture |
| Export | Discharge, Eject, Dispose, Remove | |
| Transfer | Lift, Move, Conduct, Convey | |
| Guide | Direct, Straighten, Steer, Turn, Spin, Constrain, Unlock | |
| Connect | Couple | Join, Assemble, Attach |
| Mix | Combine, Blend, Add, Pack, Coalesce | |
| Control Magnitude | Actuate | Start, Initiate |
| Regulate | Control, Allow, Prevent, Enable/Disable, Limit, Interrupt, Valve | |
| Change | Increase, Decrease, Amplify, Reduce, Magnify, Normalize, Multiply, Scale, Rectify, Adjust, Compact, Crush, Shape, Compress, Pierce | |
| Convert | Convert | Transform, Liquefy, Solidify, Evaporate, Condense, Integrate, Differentiate, Process |
| Provision | Store | Contain, Collect, Reserve, Capture |
| Supply | Fill, Provide, Replenish, Expose | |
| Extract | ||
| Signal | Sense | Perceive, Recognize, Discern, Check, Locate |
| Indicate | Mark | |
| Display | ||
| Measure | Calculate | |
| Support | Stop | Insulate, Protect, Prevent, Shield, Inhibit |
| Stabilize | Steady | |
| Secure | Attach, Mount, Lock, Fasten, Hold | |
| Position | Orient, Align, Locate |
References
- Domínguez-Escrig, E.; Broch, F.F.M.; Lapiedra, R.; Chiva, R. Promoting Radical Innovation through End-User Computing Satisfaction. Ind. Manag. Data Syst. 2018, 118, 1629–1646. [Google Scholar] [CrossRef]
- McDermott, C.M.; O’Connor, G.C. Managing Radical Innovation: An Overview of Emergent Strategy Issues. J. Prod. Innov. Manag. 2002, 19, 424–438. [Google Scholar] [CrossRef]
- Büschgens, T.; Bausch, A.; Balkin, D.B. Organizing for Radical Innovation—A Multi-Level Behavioral Approach. J. High Technol. Manag. Res. 2013, 24, 138–152. [Google Scholar] [CrossRef]
- Lin, M.; Patel, P.C. Distant Search, Technological Diversity, and Branding Focus: Incremental and Radical Innovation in Small- and Medium-Sized Consignees. IEEE Trans. Eng. Manag. 2019, 66, 170–179. [Google Scholar] [CrossRef]
- Shahrubudin, N.; Lee, T.C.; Ramlan, R. An Overview on 3D Printing Technology: Technological, Materials, and Applications. Procedia Manuf. 2019, 35, 1286–1296. [Google Scholar] [CrossRef]
- Lecossier, A.; Pallot, M.; Crubleau, P.; Richir, S. Towards Radical Innovations in a Mature Company: An Empirical Study on the UX-FFE Model. AI EDAM 2019, 33, 172–187. [Google Scholar] [CrossRef]
- Zhang, L.; Tan, R.; Peng, Q.; Yang, W.; Zhang, J.; Wang, K. A Holistic Method for Radical Concept Generation Based on Technological Evolution: A Case Application of DC Charging Pile. Comput. Ind. Eng. 2023, 179, 109213. [Google Scholar] [CrossRef]
- Tiwari, V.; Jain, P.K.; Tandon, P. Product Design Concept Evaluation Using Rough Sets and VIKOR Method. Adv. Eng. Inform. 2016, 30, 16–25. [Google Scholar] [CrossRef]
- Zhang, Z.; Gong, L.; Jin, Y.; Xie, J.; Hao, J. A Quantitative Approach to Design Alternative Evaluation Based on Data-Driven Performance Prediction. Adv. Eng. Inform. 2017, 32, 52–65. [Google Scholar] [CrossRef]
- Liu, W.; Tan, R.; Cao, G.; Zhang, Z.; Huang, S.; Liu, L. A Proposed Radicality Evaluation Method for Design Ideas at Conceptual Design Stage. Comput. Ind. Eng. 2019, 132, 141–152. [Google Scholar] [CrossRef]
- Datta, A.; Jessup, L.M. Looking beyond the Focal Industry and Existing Technologies for Radical Innovations. Technovation 2013, 33, 355–367. [Google Scholar] [CrossRef]
- Gassmann, O.; Zeschky, M.; Wolff, T.; Stahl, M. Crossing the Industry-Line: Breakthrough Innovation through Cross-Industry Alliances with ‘Non-Suppliers’. Long Range Plann. 2010, 43, 639–654. [Google Scholar] [CrossRef]
- Cheng, C.C.J.; Yang, C.; Sheu, C. Effects of Open Innovation and Knowledge-Based Dynamic Capabilities on Radical Innovation: An Empirical Study. J. Eng. Technol. Manag. 2016, 41, 79–91. [Google Scholar] [CrossRef]
- Yu, F.; Fu, J.; Guo, J.; Tan, R.; Yang, B. An Approach for Radical Innovative Design Based on Cross-Domain Technology Mining in Patents. Int. J. Prod. Res. 2023, 61, 7502–7523. [Google Scholar] [CrossRef]
- Litvin, S. New TRIZ-based tool—function-oriented search (FOS). In Proceedings of the TRIZ Future Conference, Florence, Italy, 3–5 November 2004. [Google Scholar]
- Zhang, J.; Tan, R. Radical Concept Generation Inspired by Cross-Domain Knowledge. Appl. Sci. 2022, 12, 4929. [Google Scholar] [CrossRef]
- Danneels, E.; Kleinschmidtb, E.J. Product Innovativeness from the Firm’s Perspective: Its Dimensions and Their Relation with Project Selection and Performance. J. Prod. Innov. Manag. 2001, 18, 357–373. [Google Scholar] [CrossRef]
- Ehrnberg, E. On the Definition and Measurement of Technological Discontinuities. Technovation 1995, 15, 437–452. [Google Scholar] [CrossRef]
- Castaldi, C.; Frenken, K.; Los, B. Related Variety, Unrelated Variety and Technological Breakthroughs: An Analysis of US State-Level Patenting. Reg. Stud. 2015, 49, 767–781. [Google Scholar] [CrossRef]
- Herrmann, T.; Binz, H.; Roth, D. Necessary Extension of Conventional Idea Processes by Means of a Method for the Identification of Radical Product Ideas. In Proceedings of the 21st International Conference on Engineering Design (ICED 17) Human Behaviour in Design, Vancouver, BC, Canada, 21–25 August 2017; pp. 79–88. [Google Scholar]
- Capponi, G.; Martinelli, A.; Nuvolari, A. Breakthrough Innovations and Where to Find Them. Res. Policy 2022, 51, 104376. [Google Scholar] [CrossRef]
- Chandy, R.K.; Tellis, G.J. Organizing for Radical Product Innovation: The Overlooked Role of Willingness to Cannibalize. J. Mark. Res. 1998, 35, 474–487. [Google Scholar] [CrossRef]
- Govindarajan, V.; Kopalle, P.K.; Danneels, E. The Effects of Mainstream and Emerging Customer Orientations on Radical and Disruptive Innovations. J. Prod. Innov. Manag. 2011, 28, 121–132. [Google Scholar] [CrossRef]
- Shaikh, I.A.; Colarelli O’Connor, G. Understanding the Motivations of Technology Managers in Radical Innovation Decisions in the Mature R&D Firm Context: An Agency Theory Perspective. J. Eng. Technol. Manag. 2020, 55, 101553. [Google Scholar] [CrossRef]
- O’Connor, G.C.; Rice, M.P. A Comprehensive Model of Uncertainty Associated with Radical Innovation. J. Prod. Innov. Manag. 2013, 30, 2–18. [Google Scholar] [CrossRef]
- Brondoni, S.M. Innovation and Imitation: Corporate Strategies for Global Competition. Symphonya Emerg. Issues Manag. 2012, 1, 10–24. [Google Scholar] [CrossRef]
- Tan, R. C-TRIZ and Its Application Theory of Inventive Process Solving; Higher Education Press: Beijing, China, 2020. [Google Scholar]
- Savelli, S.; Abramov, O.Y. Nature as a Source of Function-Leading Areas for FOS-Derived Solutions. TRIZ Rev. J. Int. TRIZ Assoc. MATRIZ 2019, 1, 86–98. [Google Scholar]
- Wang, K.; Tan, R.; Peng, Q.; Sun, Y.; Li, H.; Sun, J. Radical Innovation of Product Design Using an Effect Solving Method. Comput. Ind. Eng. 2021, 151, 106970. [Google Scholar] [CrossRef]
- Chiu, I.; Shu, L.H. Biomimetic Design through Natural Language Analysis to Facilitate Cross-Domain Information Retrieval. AI EDAM 2007, 21, 45–59. [Google Scholar] [CrossRef]
- Lee, C.; Kang, B.; Shin, J. Novelty-Focused Patent Mapping for Technology Opportunity Analysis. Technol. Forecast. Soc. Change 2015, 90, 355–365. [Google Scholar] [CrossRef]
- Song, K.; Kim, K.S.; Lee, S. Discovering New Technology Opportunities Based on Patents: Text-Mining and F-Term Analysis. Technovation 2017, 60, 1–14. [Google Scholar] [CrossRef]
- Choi, S.; Kang, D.; Lim, J.; Kim, K. A Fact-Oriented Ontological Approach to SAO-Based Function Modeling of Patents for Implementing Function-Based Technology Database. Expert Syst. Appl. 2012, 39, 9129–9140. [Google Scholar] [CrossRef]
- Fantoni, G.; Apreda, R.; Dell’Orletta, F.; Monge, M. Automatic Extraction of Function–Behaviour–State Information from Patents. Adv. Eng. Inform. 2013, 27, 317–334. [Google Scholar] [CrossRef]
- Tiberius, V.; Schwarzer, H.; Roig-Dobón, S. Radical Innovations: Between Established Knowledge and Future Research Opportunities. J. Innov. Knowl. 2021, 6, 145–153. [Google Scholar] [CrossRef]
- Tödtling, F.; Lehner, P.; Kaufmann, A. Do Different Types of Innovation Rely on Specific Kinds of Knowledge Interactions? Technovation 2009, 29, 59–71. [Google Scholar] [CrossRef]
- Jaffe, A.B. Technological Opportunity and Spillovers of R&D: Evidence from Firms’ Patents, Profits and Market Value. Natl. Bur. Econ. Res. 1986, 76, 985–1001. [Google Scholar]
- Jaffe, A.B. Characterizing the “Technological Position” of Firms, with Application to Quantifying Technological Opportunity and Research Spillovers. Res. Policy 1989, 18, 87–97. [Google Scholar] [CrossRef]
- Nooteboom, B.; Van Haverbeke, W.; Duysters, G.; Gilsing, V.; van den Oord, A. Optimal Cognitive Distance and Absorptive Capacity. Res. Policy 2007, 36, 1016–1034. [Google Scholar] [CrossRef]
- Gilsing, V.; Nooteboom, B.; Vanhaverbeke, W.; Duysters, G.; van den Oord, A. Network Embeddedness and the Exploration of Novel Technologies: Technological Distance, Betweenness Centrality and Density. Res. Policy 2008, 37, 1717–1731. [Google Scholar] [CrossRef]
- Angue, K.; Ayerbe, C.; Mitkova, L. A Method Using Two Dimensions of the Patent Classification for Measuring the Technological Proximity: An Application in Identifying a Potential R&D Partner in Biotechnology. J. Technol. Transf. 2014, 39, 716–747. [Google Scholar] [CrossRef]
- Bar, T.; Leiponen, A. A Measure of Technological Distance. Econ. Lett. 2012, 116, 457–459. [Google Scholar] [CrossRef]
- Vom Stein, N.; Sick, N.; Leker, J. How to Measure Technological Distance in Collaborations—The Case of Electric Mobility. Technol. Forecast. Soc. Change 2015, 97, 154–167. [Google Scholar] [CrossRef]
- Zhang, L.; Tan, R.; Peng, Q.; Miao, R.; Liu, L. Product Innovation Based on the Host Gene and Target Gene Recombination under the Technological Parasitism Framework. Adv. Eng. Inform. 2024, 59, 102341. [Google Scholar] [CrossRef]
- Stone, R.B.; Wood, K.L. Development of a Functional Basis for Design. J. Mech. Des. 2000, 122, 359–370. [Google Scholar] [CrossRef]
- Wuyts, S.; Colombo, M.G.; Dutta, S.; Nooteboom, B. Empirical Tests of Optimal Cognitive Distance. J. Econ. Behav. Organ. 2005, 58, 277–302. [Google Scholar] [CrossRef]
- Gao, T. International R&D Alliances, Technology Distance and Radical Innovation of Enterprises. Contemp. Econ. Manag. 2020, 42, 21–26. [Google Scholar]
- Seno Wulung, R.B.; Takahashi, K.; Morikawa, K. A Model for Selecting Appropriate Technology for Incubator-University Collaboration by Considering the Technology Transfer Mechanism. Int. J. Prod. Res. 2018, 56, 2309–2321. [Google Scholar] [CrossRef]
- Nolte, W.L. Did I Ever Tell You about the Whale? Or Measuring Technology Maturity; Information Age Publishing Inc. (IAP): Charlotte, NC, USA, 2008. [Google Scholar]
- Yang, M.; Chen, X. A Comparative Analysis of Patent Information of Domestic Enterprises, Universities and Research Institutions. Inf. Sci. 2010, 28, 1029–1032. [Google Scholar]
- Zhuang, Z.; Jia, H.; Xiao, C. Research advances for radical innovation. Econ. Perspect. 2020, 145–160. [Google Scholar]
- Yu, F.; Liu, J.; Fu, J.; Zhang, P. Construction of Identification Model of Radical Ideas Based on Similarity Matching. Comput. Integr. Manuf. Syst. 2022, 28, 2534–2544. [Google Scholar] [CrossRef]
- Chen, Z.; Zhang, J. Types of Patents and Driving Forces behind the Patent Growth in China. Econ. Model. 2019, 80, 294–302. [Google Scholar] [CrossRef]
- Patsnap. Available online: https://analytics.zhihuiya.com (accessed on 1 January 2024).
- Fontana, R.; Nuvolari, A.; Shimizu, H.; Vezzulli, A. Reassessing Patent Propensity: Evidence from a Dataset of R&D Awards, 1977–2004. Res. Policy 2013, 42, 1780–1792. [Google Scholar] [CrossRef]
- Sharma, P.; Tripathi, R.C. Patent Citation: A Technique for Measuring the Knowledge Flow of Information and Innovation. World Pat. Inf. 2017, 51, 31–42. [Google Scholar] [CrossRef]


| Perspective | Opinion |
|---|---|
| (1), (3) | RI not only introduces new technologies but also establishes new business models [19]. |
| (1), (3) | RI is a change in an existing service from forming a new technology or product architecture [20]. |
| (1), (3) | RI plays an important role in transforming existing markets, creating new ones, and promoting technological advances [21]. |
| (1) | RI as a new product, not only its core technology and the industry’s existing product technology in the nature of the difference but also to provide customers with a higher level of benefits [22]. |
| (1), (3) | RI is a kind of innovation in which new technology replaces the original technology and opens up a new market [23]. |
| (2) | RI has one of the following characteristics: (a) New to the world performance features, (b) Significant (e.g., 5–10x) improvement in known features, or (c) Significant (e.g., 30–50%) reduction in cost [24]. |
| (2) | RI as a product or service process that either has unprecedented performance characteristics or is a significant change from its original function or cost [25]. |
| (3) | RI defines new demand and competition relationships, enabling enterprises to gain first-mover advantage and higher market share [26]. |
| No. | Indicators | Criteria for Assignment (Comparison with Mainstream Products in Market) | ||
|---|---|---|---|---|
| 1 | Key technology | 0.0834 | Whether the key technology to realize the main function has changed. * | Yes:1; No:0 |
| 2 | Production process | 0.0871 | Whether the production process of the new solution has changed. | Yes:1; No:0 |
| 3 | Input system | 0.1029 | Whether the input system of the new solution has changed. | Yes:1; No:0 |
| 4 | Main function | 0.0813 | Whether the new solution results in a new main function. | Yes:1; No:0 |
| 5 | Consumers | 0.0862 | Whether the new solution develops new consumers. | Yes:1; No:0 |
| 6 | Key supplier | 0.1275 | Whether the supplier of key technology has changed. | Yes:1; No:0 |
| No. | Categories | Nouns |
|---|---|---|
| 1 | Attached organisms on the hull surface | Marine attached organisms, Barnacles, Oysters |
| 2 | Metal oxide | Metal oxides, Rust |
| 3 | Dirt from daily life | Sweat, Dirt, Oxides |
| 4 | Mineral scale | Scale, Slag |
| 5 | Attachments on road surface | Snow, Ice, Mud, Slush |
| 6 | Fine particles in the air | Particulate matter, Dust, Pollen |
| 7 | Coatings and other adhesives | Glue, Paint, Pigment, Tape |
| Domain No. | All | A | B | C | D | E | F | G | H |
|---|---|---|---|---|---|---|---|---|---|
| 1 | 663 | 168 | 320 | 192 | 7 | 85 | 24 | 45 | 22 |
| 2 | 16,116 | 182 | 13,246 | 2875 | 31 | 692 | 889 | 298 | 245 |
| 3 | 15,003 | 3422 | 7582 | 1871 | 517 | 1329 | 2836 | 821 | 581 |
| 4 | 4511 | 607 | 1589 | 1091 | 93 | 252 | 2002 | 173 | 96 |
| 5 | 17,401 | 1036 | 4252 | 664 | 13 | 13,001 | 998 | 1352 | 756 |
| 6 | 82,668 | 8071 | 55,282 | 1426 | 2567 | 5947 | 15,109 | 11,426 | 14,953 |
| 7 | 3578 | 120 | 2729 | 372 | 67 | 324 | 114 | 118 | 207 |
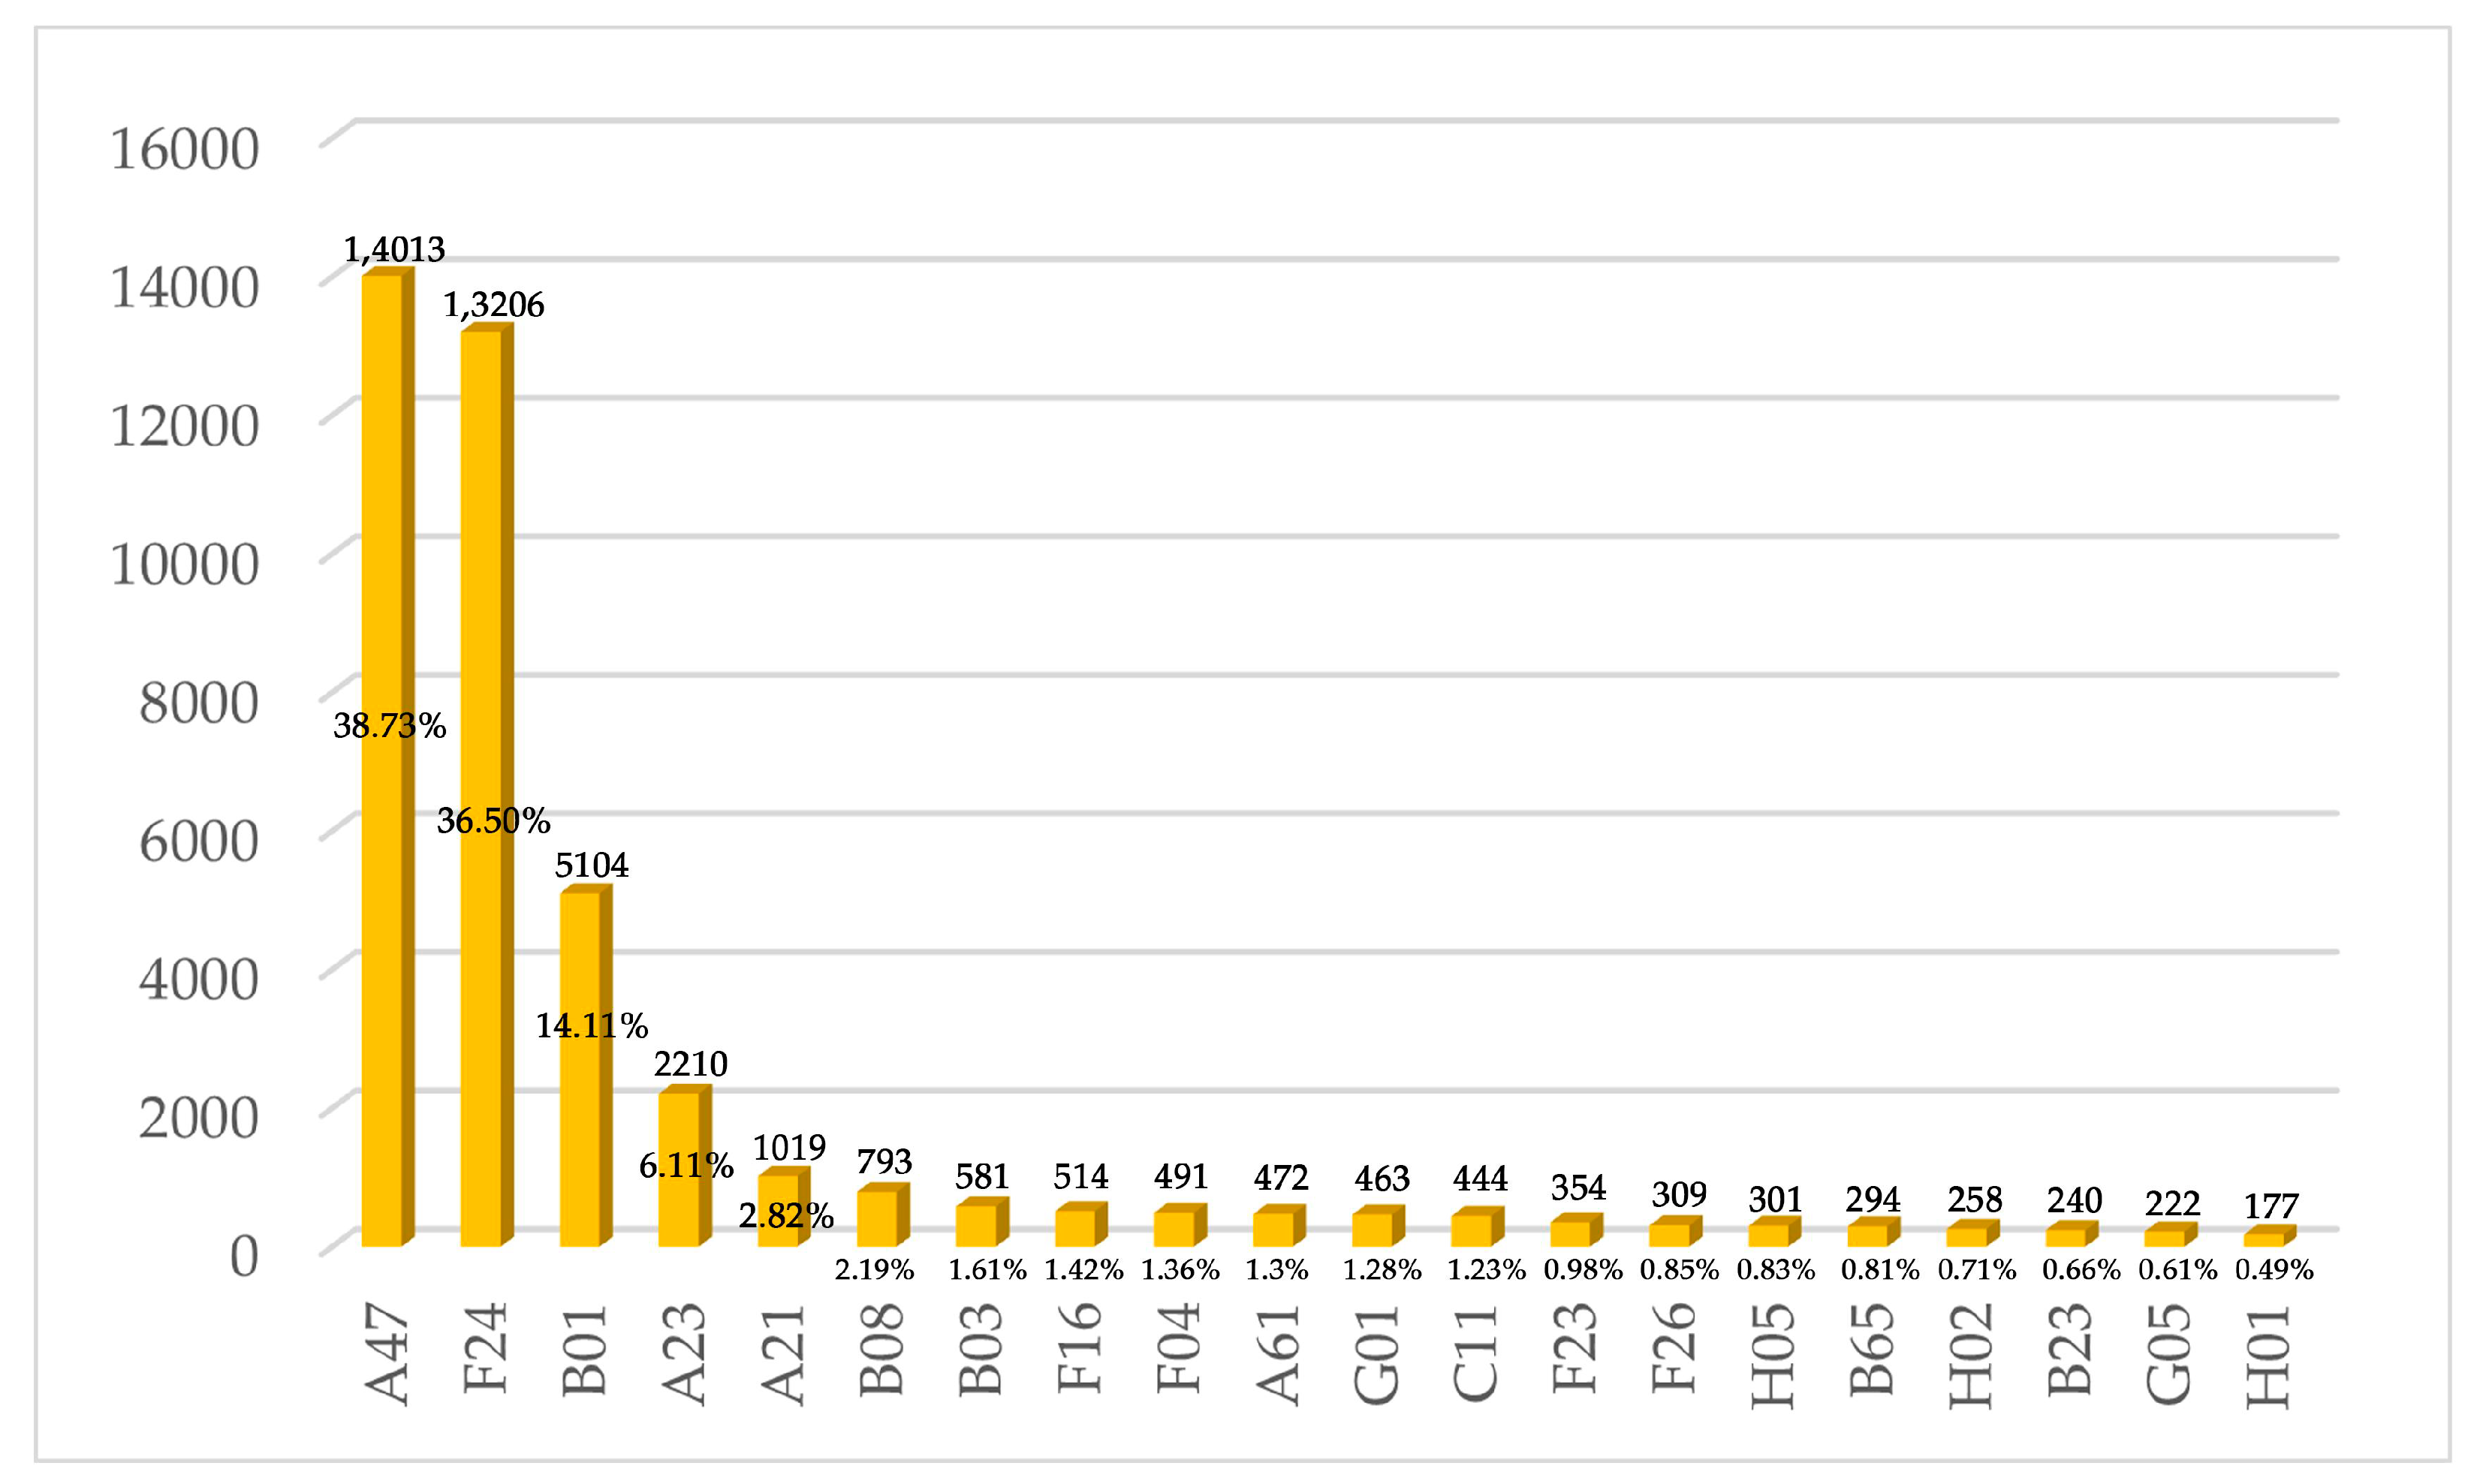
| Domain No. | All | A47 | F24 | B01 | A23 | A21 | … | B23 | G05 |
|---|---|---|---|---|---|---|---|---|---|
| 1 | 663 | 0 * | 32 | 0 * | 32 | 34 | … | 0 * | 0 * |
| 2 | 16,116 | 0 * | 0 * | 0 * | 0 * | 462 | … | 911 | 0 * |
| 3 | 15,003 | 1427 | 198 | 1427 | 198 | 2035 | … | 137 | 0 * |
| 4 | 4511 | 358 | 82 | 358 | 82 | 488 | … | 0 * | 0 * |
| 5 | 17,401 | 412 | 0 * | 412 | 0 * | 1145 | … | 0 * | 193 |
| 6 | 82,668 | 4742 | 428 | 4742 | 428 | 16,614 | … | 2279 | 0 * |
| 7 | 3578 | 32 | 0 * | 32 | 0 * | 757 | … | 65 | 0 * |
| Domains | A | B | C | D | E | F | G | H | TD1 |
|---|---|---|---|---|---|---|---|---|---|
| Problem domain | 0.486 | 0.201 | 0.024 | 0.002 | 0.005 | 0.411 | 0.027 | 0.022 | --- |
| Target domain 1 | 0.253 | 0.483 | 0.290 | 0.011 | 0.128 | 0.036 | 0.068 | 0.033 | 0.43 |
| Target domain 2 | 0.011 | 0.822 | 0.178 | 0.002 | 0.043 | 0.055 | 0.018 | 0.015 | 0.67 |
| Target domain 3 | 0.228 | 0.505 | 0.125 | 0.034 | 0.089 | 0.189 | 0.055 | 0.039 | 0.30 |
| Target domain 4 | 0.135 | 0.352 | 0.242 | 0.021 | 0.056 | 0.444 | 0.038 | 0.021 | 0.17 |
| Target domain 5 | 0.060 | 0.244 | 0.038 | 0.001 | 0.747 | 0.057 | 0.078 | 0.043 | 0.60 |
| Target domain 6 | 0.098 | 0.669 | 0.017 | 0.031 | 0.072 | 0.183 | 0.138 | 0.181 | 0.44 |
| Target domain 7 | 0.486 | 0.201 | 0.024 | 0.002 | 0.005 | 0.411 | 0.027 | 0.022 | 0.65 |
| Domains | A47 | F24 | B01 | A23 | A21 | … | B23 | G05 | TD2 |
|---|---|---|---|---|---|---|---|---|---|
| Problem domain | 0.387 | 0.365 | 0.141 | 0.060 | 0.028 | … | 0.007 | 0.006 | --- |
| Target domain 1 | 0 | 0 | 0.051 | 0.048 | 0 | … | 0 | 0 | 0.81 |
| Target domain 2 | 0 | 0 | 0.029 | 0 | 0 | … | 0.057 | 0 | 0.90 |
| Target domain 3 | 0.095 | 0.042 | 0.136 | 0.013 | 0 | … | 0.009 | 0 | 0.58 |
| Target domain 4 | 0.079 | 0.180 | 0.107 | 0.018 | 0 | … | 0 | 0 | 0.51 |
| Target domain 5 | 0.024 | 0 | 0.066 | 0 | 0 | … | 0 | 0.011 | 0.85 |
| Target domain 6 | 0.057 | 0.046 | 0.201 | 0.005 | 0 | … | 0.028 | 0 | 0.62 |
| Target domain 7 | 0.009 | 0 | 0.212 | 0 | 0 | … | 0.018 | 0 | 0.77 |
| Domain No. | TD1 | TD2 | Overlap | Prioritization |
|---|---|---|---|---|
| 1 | 0.43 | 0.81 | 18.42% | 4th |
| 2 | 0.67 | 0.90 | 0 | 5th |
| 3 | 0.30 | 0.58 | 42.86% | 1st |
| 4 | 0.17 | 0.51 | 35.29% | 2nd |
| 5 | 0.60 | 0.85 | 0 | 5th |
| 6 | 0.44 | 0.62 | 33.33% | 3rd |
| 7 | 0.65 | 0.77 | 0 | 5th |
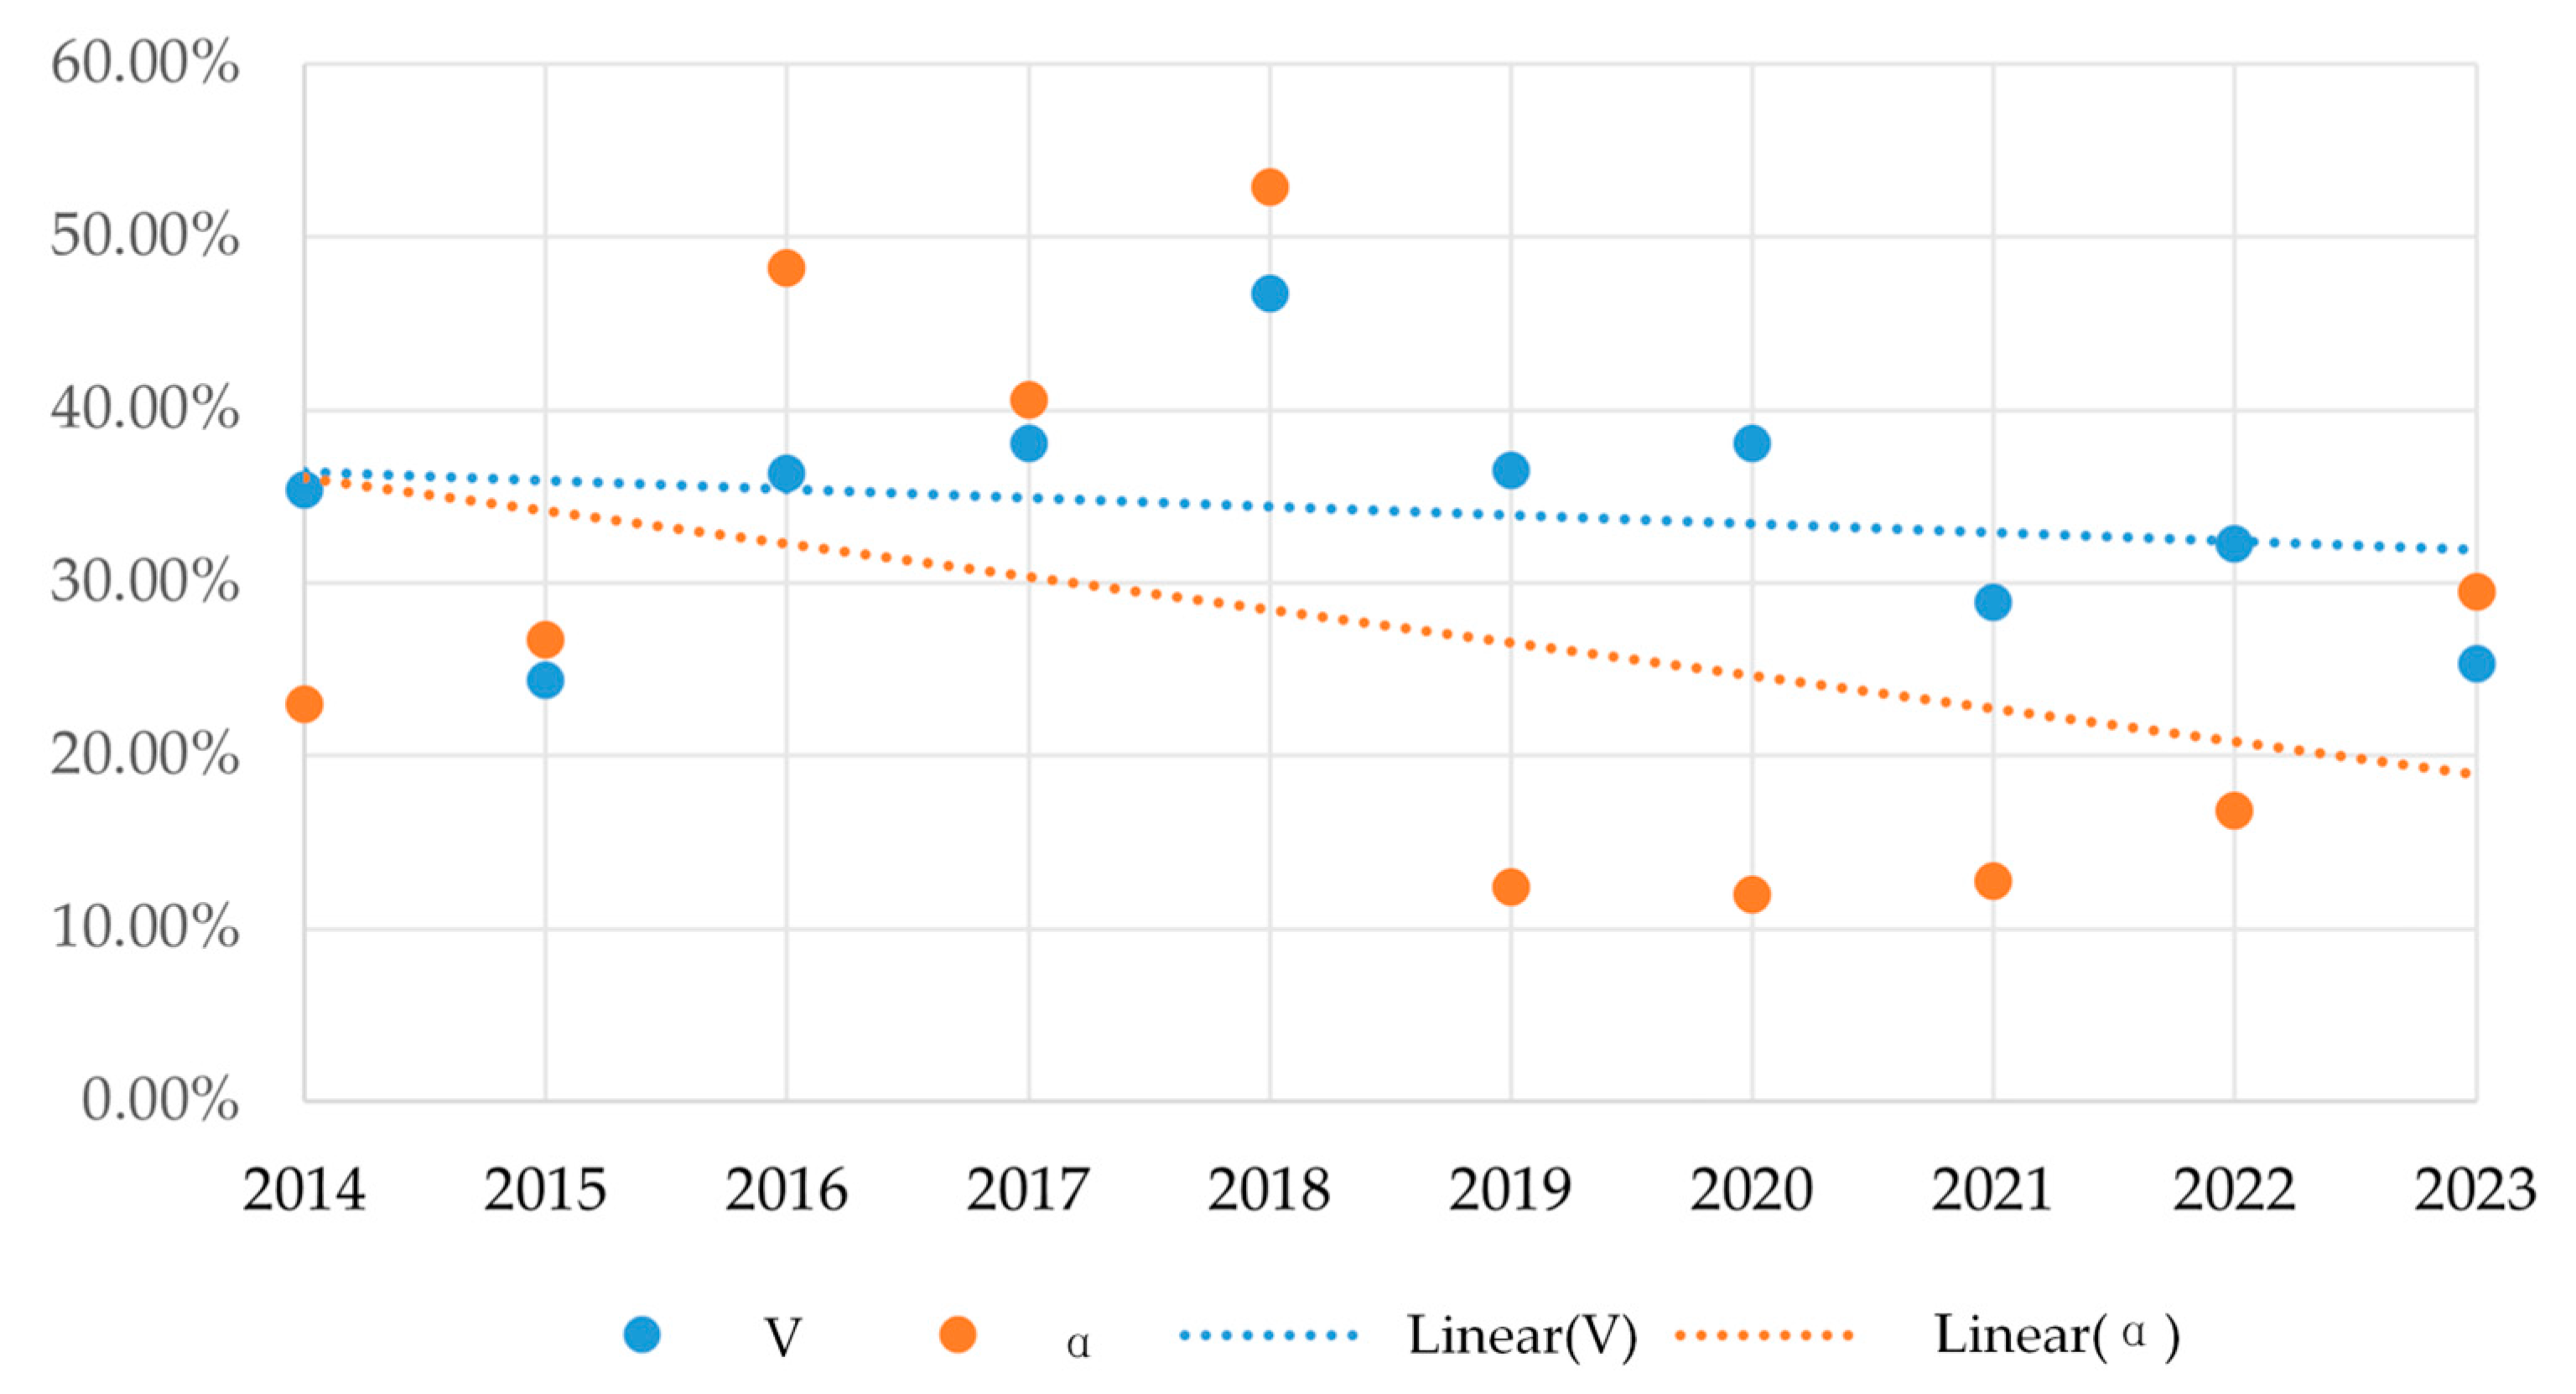
| Data | 2014 | 2015 | 2016 | 2017 | 2018 | 2019 | 2020 | 2021 | 2022 | 2023 |
|---|---|---|---|---|---|---|---|---|---|---|
| a | 23 | 20 | 41 | 62 | 128 | 144 | 230 | 229 | 348 | 322 |
| b | 77 | 55 | 44 | 91 | 114 | 1014 | 1692 | 1563 | 1721 | 772 |
| A | 65 | 82 | 113 | 163 | 274 | 395 | 605 | 793 | 1079 | 1273 |
| V | 35.38% | 24.39% | 36.28% | 38.04% | 46.72% | 36.46% | 38.02% | 28.88% | 32.25% | 25.29% |
| α | 23% | 26.67% | 48.24% | 40.52% | 52.89% | 12.44% | 11.97% | 12.78% | 16.82% | 29.43% |
| PAPN | Title | Citations |
|---|---|---|
| CN205146813U | A pipeline cleaning device | 30 |
| CN203923705U | A washing machine capable of automatically cleaning the inner tube’s outer wall dirt | 20 |
| CN206430627U | Rubber ball automatic dirt removal and cold-water unit cleaning device | 17 |
| CN210788470U | A pipeline dredging device for municipal environmental protection | 14 |
| CN203801738U | Electric arc ignition atomizer and electronic cigarette | 12 |
| CN205732110U | An automatic cleaning device for plastic bottle flakes | 11 |
| CN106000953A | The outdoor LED screen automated cleaning robot | 11 |
| CN204448731U | The conveying pipeline medium-driven dirt removal machine | 10 |
| CN204340382U | An automatic cleaning device for printing machine rubber rollers | 10 |
| CN206104486U | A large-scale pipeline cleaning device | 10 |
| CN210922326U | A condenser fouling removal device | 10 |
| CN211070976U | A cleaning device for AG glass production | 10 |
| CN211340688U | A water gate cleaning device for hydraulic engineering projects | 10 |
| Methods and Equations | Indicators | Assignment | Explanation | Results |
|---|---|---|---|---|
| Equation (8) proposed by Liu et al. [10] | WE | 10 | Physical principle is changed (centrifugal separation principle) | Z = 113.584 and Radicality = 1. |
| CE | 3 | Implementation is changed (linear reciprocating motion device to the rotary device) | ||
| EE | 1 | Details are changed | ||
| Equation (9) proposed by Yu et al. [10] | I1 | 1 | Key technology to realize the main function has changed | 0.648 |
| I2 | 1 | Production process of the new solution has changed. | ||
| I3 | 1 | The input system of the new solution has changed | ||
| I4 | 0 | The new solution does not result in a new main function | ||
| I5 | 0 | The new solution does not develop new consumers. | ||
| I6 | 1 | The supplier of key technology has changed |
Disclaimer/Publisher’s Note: The statements, opinions and data contained in all publications are solely those of the individual author(s) and contributor(s) and not of MDPI and/or the editor(s). MDPI and/or the editor(s) disclaim responsibility for any injury to people or property resulting from any ideas, methods, instructions or products referred to in the content. |
© 2024 by the authors. Licensee MDPI, Basel, Switzerland. This article is an open access article distributed under the terms and conditions of the Creative Commons Attribution (CC BY) license (https://creativecommons.org/licenses/by/4.0/).
Share and Cite
Yu, F.; Jia, X.; Zhao, X.; Li, J. A Method for Inspiring Radical Innovative Design Based on Cross-Domain Knowledge Mining. Systems 2024, 12, 102. https://doi.org/10.3390/systems12030102
Yu F, Jia X, Zhao X, Li J. A Method for Inspiring Radical Innovative Design Based on Cross-Domain Knowledge Mining. Systems. 2024; 12(3):102. https://doi.org/10.3390/systems12030102
Chicago/Turabian StyleYu, Fei, Xiuchuan Jia, Xiaowei Zhao, and Jing Li. 2024. "A Method for Inspiring Radical Innovative Design Based on Cross-Domain Knowledge Mining" Systems 12, no. 3: 102. https://doi.org/10.3390/systems12030102