Article

Customer Attitude toward Digital Wallet Services

by
Galina Ilieva
1,*,
Tania Yankova
1,
Yulia Dzhabarova
2,
Margarita Ruseva
1,
Delian Angelov
3 and
Stanislava Klisarova-Belcheva
1
1
Department of Management and Quantitative Methods in Economics, University of Plovdiv Paisii Hilendarski, 4000 Plovdiv, Bulgaria
2
Department of Marketing and International Economic Relations, University of Plovdiv Paisii Hilendarski, 4000 Plovdiv, Bulgaria
3
Department of Economic Sciences, University of Plovdiv Paisii Hilendarski, 4000 Plovdiv, Bulgaria
*
Author to whom correspondence should be addressed.
Systems 2023, 11(4), 185; https://doi.org/10.3390/systems11040185
Submission received: 8 March 2023 / Revised: 1 April 2023 / Accepted: 4 April 2023 / Published: 6 April 2023
(This article belongs to the Special Issue Business Intelligence as a Tool for Business Competitiveness)

Abstract

:
The goal of this study is to examine and identify the factors influencing customer attitude toward and intention to use digital wallets (electronic wallets, e-wallets) during and after the COVID-19 pandemic. A total of 257 correctly fulfilled questionnaires from an online survey were summarized. The main features of e-wallet payment systems were classified with a focus on consumer satisfaction via the integration of classic and modern data analysis methods. Structural Equation Modeling (SEM) was preferred to reveal the dependencies between the variables from e-wallets users’ perspective. The designed model can discover and explain the underlying relationships that determine the e-wallets’ adoption mechanism. The obtained results lead to specific recommendations to stakeholders in the value chain of payment processing. Financial regulatory authorities could employ the presented results in planning the development of payment systems. E-commerce marketers could utilize the proposed methodology to assess, compare and select an alternative way for order payment. E-wallet service providers could establish a reliable multi-criteria system for the evaluation of digital wallet adoption. Being aware of the most important components of e-wallets value, managers can more effectively run and control payment platforms, enhance customer experience, and thus improve the company’s competitiveness. As the perceived value of customer satisfaction is subjective and dynamic, measurements and data analysis should be conducted periodically.

1. Introduction

The digitization of business processes does not only optimize their execution, but also opens up many new possibilities for adding value. Ubiquitous electronic transformations have increased the number of consumers shopping and paying for goods and services online [1]. The COVID-19 pandemic and imposed social distancing measures have further raised the number of shoppers using digital channels, including customers who previously rarely or never used electronic payments [2].
Electronic payments (e-payments) arose in the early 1990s during the transition from traditional to cashless payments. These are financial services allowing consumers to make payments to multiple vendors in an electronic environment instantly [3,4]. In the last two decades, many financial technology (fintech) providers have offered a new, advanced option—digital wallets (electronic wallets, e-wallets). A digital wallet is a financial management application (online payment software or mobile application) for storing funds, making transactions and tracking payment history via a computer or mobile device [4]. An e-wallet is a prepaid payment instrument because before a financial transaction can take place, the wallet must be linked to the user’s bank account or funds must be deposited into it. In addition to financial transactions, a digital wallet can store personally identifiable data such as a driver’s license, health card and other identity data about its owner, loyalty cards, as well as a variety of discount or cashback options. Thus, it can authenticate the owner [5].
Before the pandemic, e-payments, including those by e-wallets, already took up a significant part of e-commerce transactions. For example, in the last two years before the coronavirus outbreak, 2018 and 2019, e-wallets contributed to the increase of online payment in e-commerce from 36% to 42% worldwide. The governments’ measures to prevent physical contact during the COVID-19 health crisis forced consumers to use digital sales channels which, as a result, boosted e-wallet payments. The analysis released by Appriss Retail [6] indicated an increase in the number of these payments during that period in many sectors, with some differences existing between certain regions or countries due to their specific restrictions.
China continues to lead in digital wallet use worldwide with 71% of e-commerce spending, while adoption is increasing in many other countries. The share of e-wallet payments in online shopping expenditure is 32%, 25% and 24% in India, Germany and the US, respectively [7]. Statistical forecasts also support the claim that the worldwide penetration of e-wallets has a persistent positive trend as the share of these payment applications has been steadily increasing. There is a consistent rise in the number and volume of payments with digital wallets [7,8].
However, there is no unified methodology for researching the features of this fintech instrument. Studying factors that affect e-wallet adoption and predicting their impact on e-wallet use is a complex issue for the following three main reasons:
  • The increased dynamic, uncertainty and complexity of the economic situation affect consumers’ requirements, preferences and payment habits. According to the results obtained from a recent global study of Juniper Research [8], more than five billion people (60% of world population) will be using digital wallets by 2026 and “super applications” drive the adoption of e-payments in many countries.
  • The latest developments in modern technologies, such as blockchain and artificial intelligence, have the potential to enhance the methods and channels for digital payments [9] and e-wallets as payment tools.
  • The available set of methods for customer satisfaction research has been enriched by big data, sentiment analysis, fuzzy logic, regression analysis, neural networks or their combinations [10,11,12], and it now enables the discovery of new dependencies.
The above-mentioned issues motivate us to investigate e-wallet adoption challenges via both classical statistical and modern Machine Learning (ML) methods.
The goal of this study is to establish and examine a new structural model for the adoption of e-wallets involving customers’ attitude and perception toward their usefulness, ease of use, social influence, facilitating conditions, lifestyle compatibility and trust. The model should also include some socioeconomic and demographic factors such as monthly income, age, residence, education level, etc.
The main tasks of the research are as follows:
  • Propose a theoretical framework that facilitates the systematic analysis of customer data and can reveal hidden relationships.
  • Collect and systemize customer dataset about their experience and preferences in online payments (age, residential area, monthly income per household member, attitudes, characteristics of customers’ payments, specific problems).
  • Identify the key factors affecting customer intention to use e-wallets and offer methods for their determination according to the review of previous similar research.
  • Create and validate a model based on factors from the literature and assess their influence on customer attitude to e-wallets.
This paper investigates customer adoption of e-wallets, dividing satisfaction factors into six main groups and using the corresponding mathematical models for forecasting. The obtained factors’ weights can be defined in assessment systems for e-wallets comparison. The main contribution of this paper is the development of a structural model for the evaluation, comparison and prediction of customer attitude toward e-wallets based on traditional and ML methods for data analysis.
The remainder of this paper is organized as follows: Section 2 presents the main characteristics of the most widely used e-wallet platforms as tools for financial services. Section 3 introduces related research on customer satisfaction in electronic wallets. Section 4 describes the problems that need to be solved, putting the measurement indicators forward and comparing them to those from previous similar research. Section 5 analyzes the collected dataset, establishing a mathematical model and verifying it. The obtained results are compared with those from existing studies. In the last section, the paper is concluded and research plans are outlined.

2. State of the Art Review of Digital Wallet Platforms

Digital wallets offer customers a convenient way to pay for goods, services and utility bills via cashless transactions. Furthermore, e-wallets are also useful for merchants by transforming the way they deliver additional value and enhance consumer experience even across borders. However, often the managers of offline stores and e-commerce sites and other financial stakeholders are not familiar with the capabilities of these innovative financial applications for payment automation and do not meet customers’ evolving needs.
In this section, the main characteristics of electronic wallets are briefly described, and then the features of the most widely used e-wallets are compared.

2.1. Key Features of Electronic Wallets

Using e-wallets, users can perform everyday financial operations such as paying for goods and services, transferring funds between accounts and storing money electronically. Additionally, software wallets can exchange currency and grant loans with a relatively small commission (as compared with the “Buy Now, Pay Later” type of financing, for example). Electronic wallets also offer different rewards and discounts, similar to those of classic payment systems with bank cards. These loyalty programs can convert occasional e-wallet users into regular users. Other important features of e-wallet applications are as follows:
  • Near Field Communication (NFC) and Quick Response (QR) code functionality—These in-store features improve customer experience in retail shops.
  • The dashboard—The control panel informs users about upcoming bills or how the user spent their money. In addition, some digital wallets have a budget management and expense-tracking module in their applications.
  • Chatbot functionality—For e-wallet owners, this can be a valuable supplement to existing communication channels. For e-wallet providers, chatbots can help improve their customer service by offering 24/7 support.
Compared to bank cards, electronic wallets are a more convenient option when making transactions in physical as well as online stores and when paying household bills, since they do not require entering card data. In e-commerce, these systems have a critical role in finalizing customer’s purchases and reducing abandoned shop carts.
Starting from the late 1990s, many financial service companies were trying to keep up with technology changes and provide online alternatives to classical payment instruments.

2.2. Digital Wallet Software Products and Their Feature Comparison

In this section, we present and compare some of the most widely used electronic wallet software. Existing systems differ in functionality, convenience, level of customer data protection, type of currency, payment limits, transaction fees, target group of the merchant, etc.
PayPal (PayPal Holdings, San Jose, CA, USA, 1998, paypal.com, accessed on 5 April 2023) is a payment aggregator that allows individuals and firms to make and receive payments securely without sharing sensitive financial data. Users can also buy, sell and store cryptocurrencies as well as split their payments into several installments. Customers can also transfer cryptocurrencies from their PayPal accounts to external wallets and exchanges [13].
Alipay (Ant Group, Pudong, Shanghai, China, 2004, alipay.com, accessed on 5 April 2023) is a third-party mobile and online payments platform for the two largest e-commerce platforms (Alibaba’s Tmall and Taobao) in China. When shopping via social channels, China’s online buyers prefer to purchase an item in a one-tap transaction, so the platform provides a fast and convenient payment service. Alipay is also a “super application”, i.e., it also has many additional features (such as social media, ridesharing, gaming, etc.) [14].
Amazon Pay (Amazon, Seattle, WA, USA, 2007, pay.amazon.com, accessed on 5 April 2023) lets Amazon customers make a purchase with fewer clicks, offering a quick checkout experience which increases conversions. The company issues credit cards for regular customers with no monthly commission.
Venmo (PayPal Holdings, San Jose, CA, USA, 2009, venmo.com, accessed on 5 April 2023) is a social payments platform that allows users to broadcast transactions to a private social activity stream and a fully public transaction feed. Venmo is a P2P mobile application for sending and receiving money instantly. Venmo can also be used to make purchases at a physical or online store. Venmo is used by some small businesses to accept payments [15,16].
Dwolla (Dwolla, Des Moines, IW, USA, 2010, dwolla.com, accessed on 5 April 2023) is a virtual wallet for sending, storing and receiving funds. Dwolla cooperates with major American banks, including Bank of America and Silicon Valley Bank. The system only supports ACH payments, so it is not possible to make SEPA and SWIFT transfers.
WeChat Pay (Tencent, Shenzhen, Guangdong, China, 2011, pay.weixin.qq.com/index.php/public/wechatpay, accessed on 5 April 2023) is the second largest payment platform in China and the default payment method on WeChat, the most popular instant messaging application in China [17,18].
Google Wallet (Google, Mountain View, CA, USA, 2011, wallet.google, accessed on 5 April 2023) is a digital wallet service that allows users to make payments using their Android devices. Google Wallet stores credit and debit card details [19,20] The company issues its own debit cards. Their owners have the opportunity to withdraw cash from ATMs and pay for purchases in stores. No commission is charged for its maintenance and issuance.
Apple Pay (Apple, Cupertino, CA, USA, 2014, apple.com/apple-pay, accessed on 5 April 2023) is a mobile payment service for contactless or online payments for Apple devices. Apple Pay accounts can also be used to pay for various goods and services through bank terminals equipped with NFC technology, as well as in online stores or in applications [21].
Samsung Wallet (Samsung Electronics, Seoul, South Korea and Burlington, MS, USA, 2015, samsung.com/global/galaxy/samsung-pay/, accessed on 5 April 2023) replaced Samsung Pay and Samsung Pass. The new application is a hub for payments, digital IDs, digital keys, and loyalty programs on Galaxy phones. For security, Samsung Wallet relies on a security and management system pre-installed on most Galaxy devices.
Cash App (Block, no headquarter locations, 2013, cash.app, accessed on 5 April 2023) is a mobile payment service that allows users to transfer money to one another using a mobile phone application. Cash App can also be used in stores or online. After signing up, the user can choose whether to link their bank card to the account. They can sign up for a free Cash Card—a virtual debit card that can be used for in-store or online purchases. Cash App can also provide a physical card for offline shopping.
Shop Pay (Shopify, Ottawa, ON, Canada, 2017, cash.app, accessed on 5 April 2023) is an online checkout service offered by Shopify. It allows customers to store credit card, email, shipping and billing information. Because Shop Pay automatically remembers and applies their payment details, returning customers may be less likely to abandon their shopping carts before checkout.
Meta Pay (Meta, Menlo Park, CA, USA, 2019, pay.facebook.com, accessed on 5 April 2023) can be used for payments and purchases within the Meta ecosystem, including on Facebook, Instagram, Messenger, and other Meta-owned platforms and in participating online stores. The user should enter their payment card or account data and then use Meta Pay to make purchases, send money or donate.
Paytm (Paytm, Noida, Uttar Pradesh, India, 2010, paytm.com, accessed on 5 April 2023) is the largest online payment platform in India. It offers a range of services, including mobile recharges, bill payments and online shopping. In addition to its digital wallet, Paytm also offers a payments bank, which allows users to open a savings account and earn interest on their deposits [22].
PhonePe (Walmart, Bengaluru, Karnataka, India, 2015, phonepe.com, accessed on 5 April 2023) is the second largest payment platform in India. PhonePe allows users to make payments, send money and recharge mobile phones among other services [20]. It is integrated with several popular applications and services, including Flipkart, Ola and Swiggy.
YooMoney (Sberbank, Moscow, Russia, 2002, yoomoney.ru, accessed on 5 April 2023) is the most widely used digital wallet by individuals and companies in Russia and supports payments in several currencies. It offers a range of services, including online payments, money transfers and mobile payments.
Table 1 summarizes the main characteristics (supported platforms, payment services, payment sources and in-store technologies) of the above-mentioned electronic wallets. These features can be integrated in assessment systems for choosing the most appropriate e-wallet software and its components.
Depending on their main features, the digital wallet systems described in Table 1 can be classified based on several criteria such as supported platforms, interoperability, integration capabilities, type of currency and functionalities.
Supported Platforms: Digital wallets can be categorized based on the platform they operate on into desktop wallets, Web wallets (PayPal, AliPay, Amazon Pay, Venmo, etc.) and mobile wallets (Apple Pay, Samsung Wallet).
Interoperability: Some e-wallets systems are merchant independent (open wallets), while others are merchant specific (closed wallets). Amazon Pay, Venmo, Google Wallet, Cash App, Shop Pay, Meta Pay, PayTM, PhonePe and YooMoney are examples of open wallets. Open wallets are designed to be more flexible and can be used on a variety of devices and platforms. For example, Cash App works on both Android and iOS operating systems, and Shop Pay can be used on any website that supports it, regardless of the device used. AliPay, WeChat Pay, Apple Pay and Samsung Wallet are examples of closed (proprietary) wallets, which means that they only work with their respective platform (i.e., Apple devices for Apple Pay and Samsung devices for Samsung Wallet).
Online integration: Digital wallets can be integrated in e-commerce platforms and payment gateways, allowing customers to use their preferred payment method to make purchases online. For example, PayPal offers a range of options for merchants to accept payments on their e-commerce sites, including an embedded checkout solution. Similarly, Amazon Pay provides a widget that can be added to an e-commerce site’s checkout page, allowing customers to use their Amazon account to complete their purchase. Other digital wallets, such as AliPay and WeChat Pay, are popular in specific regions; and integrations in e-commerce sites target those markets.
Type of currency: Digital wallets can be divided based on the type of currency they facilitate. Most e-wallets on the market support multiple fiat currencies, while Pay Pal and Cash App (Bitcoin-only) are crypto wallets, too. YooMoney, on the other hand, does not directly enable crypto transactions; instead, it provides a feature that lets users buy and sell cryptocurrencies via a third-party exchange.
Security: Each digital wallet employs a variety of security technologies to protect user information and prevent fraudulent activities. For example, Meta Pay, Samsung Wallet, Shop Pay, Apple Pay, Alipay and Cash Pay apply biometric authentication (fingerprint, voiceprint, face recognition or iris scanning) to verify the identity of users when making transactions or accessing their account. Dwolla, WeChatPay, Venmo and Alipay use various fraud detection techniques including real-time transaction monitoring, risk scoring and rule-based alerts.
Risk avoidance: Many digital wallets providers have policies and procedures to freeze or restrict accounts in certain circumstances. PayPal, Alipay and WeChatPay can freeze user accounts for various reasons, such as suspected fraudulent activity, which can be inconvenient and disruptive for users. Account freezes or restrictions are typically done as a security measure to protect both the digital wallet provider and its users from fraud and other illicit activities. In most cases, affected users can collaborate with the provider to resolve any issues and have their accounts reinstated.

3. Related Work

3.1. Customer Satisfaction with Digital Wallet Services and Its Measurement

Over the past two decades, customer attitude toward digital wallets has become an increasingly important topic of interest for both academic researchers and sales practitioners. In the fast-paced and rapidly evolving digital payment landscape, customer satisfaction is a critical factor for the success of digital wallets. In general, customer satisfaction with e-wallets measures how well financial services meet or exceed consumer expectations [23]. User experience determines whether users will continue to use a digital wallet or switch to a competitor offering. Digital wallet providers must strive to understand their customers’ needs and preferences to guarantee e-wallet success.
In order to determine the intention of customers in Brazil to adopt mobile payment technology, de Sena Abrahão et al. have employed the Unified Theory of Acceptance and Use of Technology (UTAUT) approach [24]. The authors have examined the relationship between five key constructs—Performance expectancy (Perceived usefulness), Effort expectancy (Perceived ease of use), Social influence, Perceived risk and Perceived cost—and customers’ intention of adopting a mobile payment service. The study finds that Performance expectancy, Effort expectancy, Social influence and Perceived risk have a positive impact, while Perceived cost does not have a significant effect on adoption intention.
Lin, Wang and Chen have clarified the relevance of seven factors that influence consumer adoption of mobile payment technology, specifically focusing on the adoption of digital payment services in Taiwan. The proposed conceptual model incorporates Performance expectancy, Effort expectancy, Facilitating conditions, Social influence, Hedonic motivation (Subjective norm), Price value and Security. It uses Structural Equation Modeling (SEM) to test the model with survey data. The study discovered that Perceived usefulness, Hedonic motivation and Security have a significant positive impact on consumers’ intention to adopt e-wallet services [25].
Malik, Suresh and Sharma have studied the factors that influence consumers’ attitudes toward the adoption of digital wallet software by conducting an empirical study in the context of India. The authors have developed a conceptual model that includes seven key constructs—Performance expectancy, Ease of use, Social influence, Enjoyment, Incentives, Aesthetics and Trust—and test the model using regression analysis with survey data. The analysis indicates that Performance expectancy, Incentives and Trust have a significant positive impact on consumers’ attitudes toward the adoption of digital wallets [26].
Phan, Ho and Le-Hoang [27] have proposed and verified factors that affect the behavioral intention and behavior of using e-wallets among youths in Vietnam. The conceptual model includes five key constructs—four inputs (Effort expectancy, Performance expectancy, Social influence and Security and privacy) and one outcome construct (Behavioral intention). The obtained results show that the impact of two input constructs on the output variable are statistically significant—those are Performance expectancy and Social influence.
Yang et al. have developed a research model to determine the impact of several factors on both the intention to use and the adoption of an e-wallet in Indonesia by using the UTAUT. A conceptual model was defined, consisting of 31 input variables categorized into six constructs (Perceived usefulness, Perceived ease of use, Social influence, Facilitating conditions, Lifestyle compatibility and Perceived trust). The analysis of the obtained results has confirmed the research hypotheses that Intention to use e-wallet and Adoption of e-wallet in the Indonesian market directly depends on five of the six given constructs. Furthermore, the findings indicate that there is no variation in the intention to use e-wallets based on education level. However, differences exist in terms of Gender and Age [28].
Shane et al. have examined the important factors affecting Intention of adopting e-wallet services in Malaysia during the COVID-19 pandemic period [29]. This research shows that Performance expectancy has the maximum impact on e-wallets adoption followed by the Facilitating conditions option. However, the impact of Effort expectancy, Social influence, Promotional benefits and Perceived trust is not statistically significant related to the Intention to adopt e-wallet services.
Wardana et al. have studied the effect of Convenience and Perceived ease of use toward Intention to adopt e-wallets of generation Z in the Indonesian e-payment industry. The results of this study indicate that both constructs have positive and significant effects on digital wallets adoption, in which Perceived ease of use has a higher effect [30].
Kınış and Tanova have explored four influencing factors (Consumer knowledge on e-wallets, Perceived usefulness, Perceived ease of use and Trust) and two output constructs (Attitude and Behavioral intention to use the e-wallet) using a SEM model. The results reveal that Perceived usefulness, Perceived ease of use and Trust have a direct and significant positive relationship with Behavioral intention to use e-wallets [31].
Raninda at al. have investigated the impact of Perceived usefulness, Perceived ease of use, Perceived security and Cashback promotion on the Behavioral intention to use the DANA e-wallet in Indonesia. The study uses the Technology Acceptance Model (TAM) and regression analysis to analyze survey data. The results indicate that four factors have a significant and positive influence on behavioral intention to use the DANA e-wallet [32].
Naysary surveyed unsupervised ML (KDD method) as a data mining technique to determine existing data segments. Then, the author used AHP analysis to assess the relative importance of the clusters and find the optimal framework for choosing an e-wallet provider. According to the results, Usefulness is the most crucial factor for users while considering the e-wallet, followed by Risk, Ease of use, Customer service, User interface, Trust, Promotional reward, Associated costs, Interoperability and Security [10].

3.2. Comparison of Existing Models for Customer Satisfaction toward Digital Wallets

The studies summarized in the previous subsection draw on factors derived from seminal works in the field of TAM and UTAUT, including Davis [33], Venkatesh and Davis [34], Venkatesh et al. [35] and Venkatesh and Bala [36]. The majority of the studies have employed Partial Least Squares (PLS) SEM, while two models have been built using multiple linear regression [26,32]. One study has also employed a Business Intelligence technique (clustering) and soft computing method (Analytical Hierarchy Process—AHP) [10]. The salient features of the e-wallets adoption models described above are summarized in Table 2.
The distribution of constructs in the above-mentioned models is as follows: Perceived usefulness (10/10), Perceived ease of use (10/10), Social Influence (6/10), Facilitating conditions (3/10), Lifestyle compatibility (1/10) and Perceived trust, security or risk (9/10). The effectiveness of the models proposed in the literature varied from 30.0% [26] to 76.2% [24], with the number of latent variables ranging from 2 to 7. The number of statistical significant factors fluctuates between 2 and 5.
Despite the extensive research exploring the determinants of customer satisfaction within e-wallets, universally accepted metrics for evaluating this innovative service remain elusive. Furthermore, current research on the dimensions of online purchases in the European Union e-commerce context is limited in scope and fails to account for the dynamic shifts in consumer preferences, behavior and habits. Thus, the identification of novel approaches and conducting empirical investigations in this domain can address the existing gaps and provide insights both for firms and policymakers.

3.3. Main Factors Affecting Consumer Intention to Adopt e-Wallet Payments

According to the literature review, the main factors influencing the adoption of electronic wallets can be reflected in a theoretical model with six constructs, as follows: Perceived usefulness, Perceived ease of use, Social influence, Facilitating conditions, Lifestyle compatibility and Perceived Trust. The proposed combination integrates both internal (Perceived usefulness, Perceived ease of use and Perceived Trust) and external (Social influence, Facilitating condition and Lifestyle compatibility) factors intensifying consumers’ intention. Next, we provide a detailed presentation of the preferred model’s factors.
1.
Perceived usefulness
Perceived usefulness, defined by Davis [33], refers to the degree to which an individual believes that using a particular technology will enhance their performance and productivity. When it comes to digital wallets, the usefulness of the service is a measure and a criterion for user’s choice. The study of Sarmah et al. on e-wallet use has stated that its perceived usefulness has a positive influence on the intention to use e-wallets [37]. Perceived usefulness also determines whether users will continue to use digital wallets [27].
2.
Perceived ease of use
Perceived ease of use is defined as the degree to which individuals perceive how easy it is to use the technology [33]. Users are more likely to adopt a new technology if they believe it will be easy to use and integrate into their daily lives. Results show that perceived usefulness, perceived ease of use and attitude significantly influence use behavior [38].
3.
Social influence
In TAM theory, social influence refers to the impact of other people’s opinions, recommendations, and perceived norms on an individual’s decision to adopt or use a technology. Subjective norm, reference groups, social identity and image are important social factors, since they influence how consumers interpret data and make purchasing decisions [34]. Several studies indicate that the majority of consumers favor receiving marketing information through their social network group instead of by phone calls. This approach facilitates faster, more accessible, and more convenient communication between companies and their customers [39]. By leveraging social factors, companies can establish a more robust emotional connection with consumers, leading to greater ease in converting them into loyal customers.
4.
Facilitating conditions
Facilitating conditions refer to the perceived resources and support that are available to an individual to facilitate the use of a technology [35]. The availability of facilitating conditions such as technical support, training and access to the necessary hardware and software can increase the likelihood that an individual will adopt and use a technology, and can also enhance the impact of other determinants such as perceived usefulness and ease of use [28].
5.
Lifestyle compatibility
Lifestyle compatibility is a key determinant of digital wallet adoption, as it reflects the degree to which the product or service aligns with the user’s lifestyle and habits [40]. Yang et al. have revealed that Lifestyle compatibility and Perceived trust exhibited a significant effect on the intention to use an e-wallet [28]. Furthermore, compatibility with the user’s social circle and perceived societal norms regarding the use of digital wallets can boost adoption rates.
6.
Perceived Trust
Perceived trust was included as one of the four key constructs that determine user acceptance and usage of technology in UTAUT [35]. The term refers to the extent to which a user believes that a particular technology is reliable, secure and trustworthy. Authentication, privacy details and encryption mechanisms are factors with significant influence on customer satisfaction with digital wallet services [41]. According to Oliveira et al., the digital payment system’s security and performance directly affect customer loyalty [42].
The factors identified above are indicative of the multifaceted nature of consumer attitude toward electronic wallets. In the next section, through the adoption of a holistic approach, this study examines factors’ strength to drive customer intention to embrace e-wallets. The extent to which these factors influence customer behavior is also a function of some external parameters, including the impact of the business environment. E-wallet service providers can leverage these factors to ensure consistent and positive customer experience, thereby fostering long-term loyalty.

4. Research Methodology

As the main objective of our research methodology is to identify and describe customer perceptions of e-wallets and forecast their changes in the future, we plan to collect a primary dataset. In order to systematically analyze the collected customer data and reveal its hidden relationships, we apply descriptive (statistical) and predictive (Data Mining) analytic techniques as well as a multi-criteria decision-making approach. To detect common issues that users may be experiencing with their e-wallet service, we use a sentiment analysis of users’ opinions. The results can provide insights into the way customers perceive and interact with e-wallet services, helping vendors to adequately address customer concerns or adjust their marketing activities.

4.1. Questionnaire Design and Data Collection

The survey method was preferred as a research tool for studying, as it enables the collection of a large amount of data and analyzing it in order to gain insights into customer behavior and choices of digital wallets. The online survey was considered as one of the most suitable methods for studying because it offers a wide reach, convenience, faster response, cost-effectiveness and ease of design. An online questionnaire has been designed to gather data on customer attitudes toward e-wallets adoption. It was based on previous research on customer intentions to adopt digital wallets [24,26,27,32], and it follows the format proposed by Yang et al. [28]. The questionnaire consists of five main parts: introduction, demographics, experience with e-payments, attitude toward e-wallets and future intentions. Five indicators each for Question #9 (Perceived usefulness), Question #11 (Social influence) and Question #13 (Lifestyle compatibility) were adopted from Lwoga and Lwoga [43], while six items for Question #10 (Perceived ease of use) and Question #14 (Perceived trust) were retrieved from Chwala and Joshi [44]. Question #12, which measures facilitating conditions, utilized five items obtained from Pandey and Chawla [45]. Six items each for Question #15 (Intention to use an e-wallet) and two indicators for Question #16 (Adoption of e-wallet) were adapted from Karjaluoto et al. [46]. To account for changes in customer behavior resulting from the COVID-19 pandemic, some questions were added based on suggestions offered by business managers [47]. The details regarding the research and questionnaire link have been spread through partners’ organizations using online and social media communications.

4.2. Questionnaire Measurements and Scales

Approximately 44% of the survey questionnaire (8 out of 18) is composed of “multiple choice grid” questions that implement a five-point Likert scale, ranging from “Strongly disagree” to “Strongly agree”. A further 39% of the questionnaire (7 out of 18) comprises “multiple choice” questions. Two questions require open-ended text responses to be entered into text fields marked as “short answer” and “paragraph” type in Google Forms. Finally, one question is formulated using checkboxes.

4.3. Data Analysis Methods

The data analysis methods for the adoption of e-wallets can be broadly classified into three categories: classical statistical methods, intelligent statistical methods and hybrid methods that combine techniques from the previous two groups.
The first category includes methods that measure object properties, summarize and visualize the main characteristics of the data and test relationships between items and groups of items. The analysis utilizes techniques such as correlation analysis, Student’s t-test, factor analysis, analysis of variance (ANOVA), chi-squared test and regression analysis.
Business intelligence methods such as SEM, cluster analysis and sentiment analysis are employed to uncover hidden relationships between variables. SEM is a widely used methodology for studying systems in which parameters cannot be directly evaluated. It is a set of statistical techniques that can be used to test research hypotheses and measure and analyze the relationships between observed and latent variables [48]. Cluster analysis is another Data Mining technique that can be used to group similar observations together, while sentiment analysis can be employed to extract and analyze subjective information from text data. By utilizing intelligent ML methods, researchers can uncover hidden patterns and relationships between variables that may not be apparent using traditional statistical methods.
In this research, we employ PLS-SEM to model the complex relationships between latent and observed variables. Here are some advantages of PLS-SEM for designing a structural regression model:
  • The model is robust to data non-normality.
  • The method is appropriate for a relatively small sample size.
  • The generated models can be easily interpreted because complex relationships between variables can be visualized in an intuitive way.
  • The method is efficient and scalable. PLS-SEM can be used for large models with many indicators and latent variables.
  • PLS-SEM can handle formative constructs [49].
PLS-SEM provides a flexible, robust and scalable approach to designing a structural regression model that is appropriate for small sample sizes and accommodates formative constructs. Additionally, the predictive modeling capabilities of SEM can be particularly useful for understanding the complex relationships between variables in marketing research and other areas of research in social sciences.

5. Data Analysis

The proposed methodology (Section 4) has been applied to address the research tasks.

5.1. Customers’ Data Collection

We shared a link to the online survey through our institutional websites, social media (Facebook groups) and emails. The survey targeted Bulgarian online customers and was completed on a voluntary basis. Created using Google Forms, the survey consists of 18 questions designed to measure customers’ perceptions of the variables used in the study [47]. The data on customers’ attitudes toward e-wallets was collected from 21 November 2022 to 6 December 2022. A total of 257 respondents completed the questionnaire, and 70 of them indicated that they do not pay online (Question #8). A duplicate check was performed, and there were no identical values found in the dataset rows. However, the model constructs data (Question #9 to Question #17) showed that there were 15 duplicates of eight dataset rows as follows: (#70, #103), (#35, #135), (#9, #39, #88, #116), (#187, #235, #252), (#52, #55, #60, #203, #204), (#207, #230), (#47, #96, #249), (#129, #130) (see Figure 1).
Figure 1 illustrates the degree of similarity between the respondents’ answers, with closer distances indicating smaller differences. The degree of similarity is represented by different colors, ranging from full coincidence (0—orange color) to maximum difference (15—purple color). Since the dataset does not contain completely identical records, all observations will be included in the analysis. To generate the dissimilarity matrix, we utilized the fviz_dist() function in R programming language.

5.2. Data Storage

The questionnaire and participants’ responses are available online [47].
Data encoding
The rules for coding and coded data are also available online. Out of all 18 responses, 16 have been coded [47]. The two open-text answers (municipality and opinions) have been additionally processed.
Data preprocessing
The preprocessing was made and the dataset quality was examined for accuracy and consistency.
Statistical analysis
To clarify the profile of the participants in the survey, a classical statistical analysis (percentage distribution of responses, descriptive statistics and correlation analysis) has been performed.
Main Characteristics of Respondents in the Sample
Table 3 illustrates the demographics of the survey participants. A significant majority of the respondents are female, accounting for 74% of the total number of participants (Question #1). Nearly two-thirds of the respondents are under the age of 40 (Question #2). The sample is dominated by individuals with at least a university degree, comprising 61.4% of the participants (Question #6). Moreover, the survey was primarily conducted in urban areas, with 94.5% of the respondents residing in such locations (Question #3).
The geographic distribution of the participants shows that the majority of respondents are from the Plovdiv district, accounting for 69.3% of the total survey participants. The next highest proportion of respondents comes from the Pazardzhik district, comprising 10.1% of the total respondents, followed by the Haskovo district, which comprises 7.0% of the respondents. The survey was primarily conducted in the South Central region, which accounts for 89.1% of the participants, followed by the Southwestern region (6.6%) (Question #4).
For 65% of the participants, online payment is the preferred payment method. Almost 55% of the respondents pay using bank software (Question #8). This percentage is much lower compared to the digital payment penetration in developed countries such as the US, with 89% share of e-payments in 2022 [50].
Feature selection
To visualize the various attitudes toward e-wallets, we utilized the heat map technique for hierarchical clustering to measure the similarities between observations (Figure 2) and their attributes (Figure 3). The heat map’s color depth denotes the standardized values, with the minimum value of about −2.50 represented by a light orange color and the maximum value of about 1.63 depicted in a crimson color. The hierarchical structure illustrated at the top of Figure 2 displays the grouping of respondents and their corresponding attitudes’ similarities. Additionally, the dendrogram of variables (Figure 3, right) showcases their similarities. According to the heat maps depicted in Figure 2 and Figure 3, there are clusters of data points (observations and variables) that share similar characteristics. Any unusual or unexpected patterns are not available. To generate the heat maps, we applied Orange 3.22 software.
Clustering
In order to identify the groups of customers with similar characteristics and variables that have a comparable effect on customer attitude, we employ the multi-criteria decision-making approach and k-means method for cluster analysis. The number of clusters is determined using the Elbow and Silhouette methods and the results revealed that the optimal number of clusters is two. The two clusters consist of 119 and 38 respondents, respectively. Figure 4 shows that when k = 2, there is no overlap between clusters. This means that the k-means method offers a feasible solution to the problem of identifying clusters of customers with a similar attitude to e-wallets adoption.
The first cluster (Cluster #1) consists of 119 “satisfied” customers. These consumers have a more positive attitude to e-wallets adoption—with higher ratings in the Intention to use e-wallets (Question #15) and Adoption of e-wallets (Question #16) (Table 4). The indicators with the strongest influence on overall satisfaction are Perceived usefulness (Question #9), Perceived ease of use (Question #10), Facilitating conditions (Question #12) and Lifestyle compatibility (Question #13). In contrast, the consumers from the second cluster demonstrate some dissatisfaction with digital wallets. Social influence (Question #11) and Perceived trust (Question #14) are the most significant factors for the negative attitude of the second group of users. In Table 4, the average values of the indicators for the two clusters, as well as the differences between these estimates, are also depicted.
Sentiment Analysis
The open-ended question has received 144 text replies. After preprocessing and filtering, 86 answers about respondents’ attitude toward e-wallets usage remained. The calculated scores for responses’ sentiment about user attitude are as follows: positive—62, average value 0.698; neutral—7, average value 0.534; and negative—17 (actually 14, because three of the negative opinions have a score of less than 0.010), average value 0.194. The effect of the pandemic has been discussed in 67 answers: positive—17, average value 0.700; neutral—7, average value 0.549; and negative—43 (actually 34, because nine of the negative opinions have a score of less than 0.010), average value 0.233. These results show that the respondents support digital wallets as a convenient way to make payments and some of the advantages of e-wallets are pointed out. The respondents who expressed a negative attitude mainly complain about Internet connection quality, security issues and payment processing fees. Neutral opinions support e-wallets usage but indicate some weaknesses in online payments. The Azure Machine Learning add-in in MS Excel was applied to conduct the sentiment analysis.

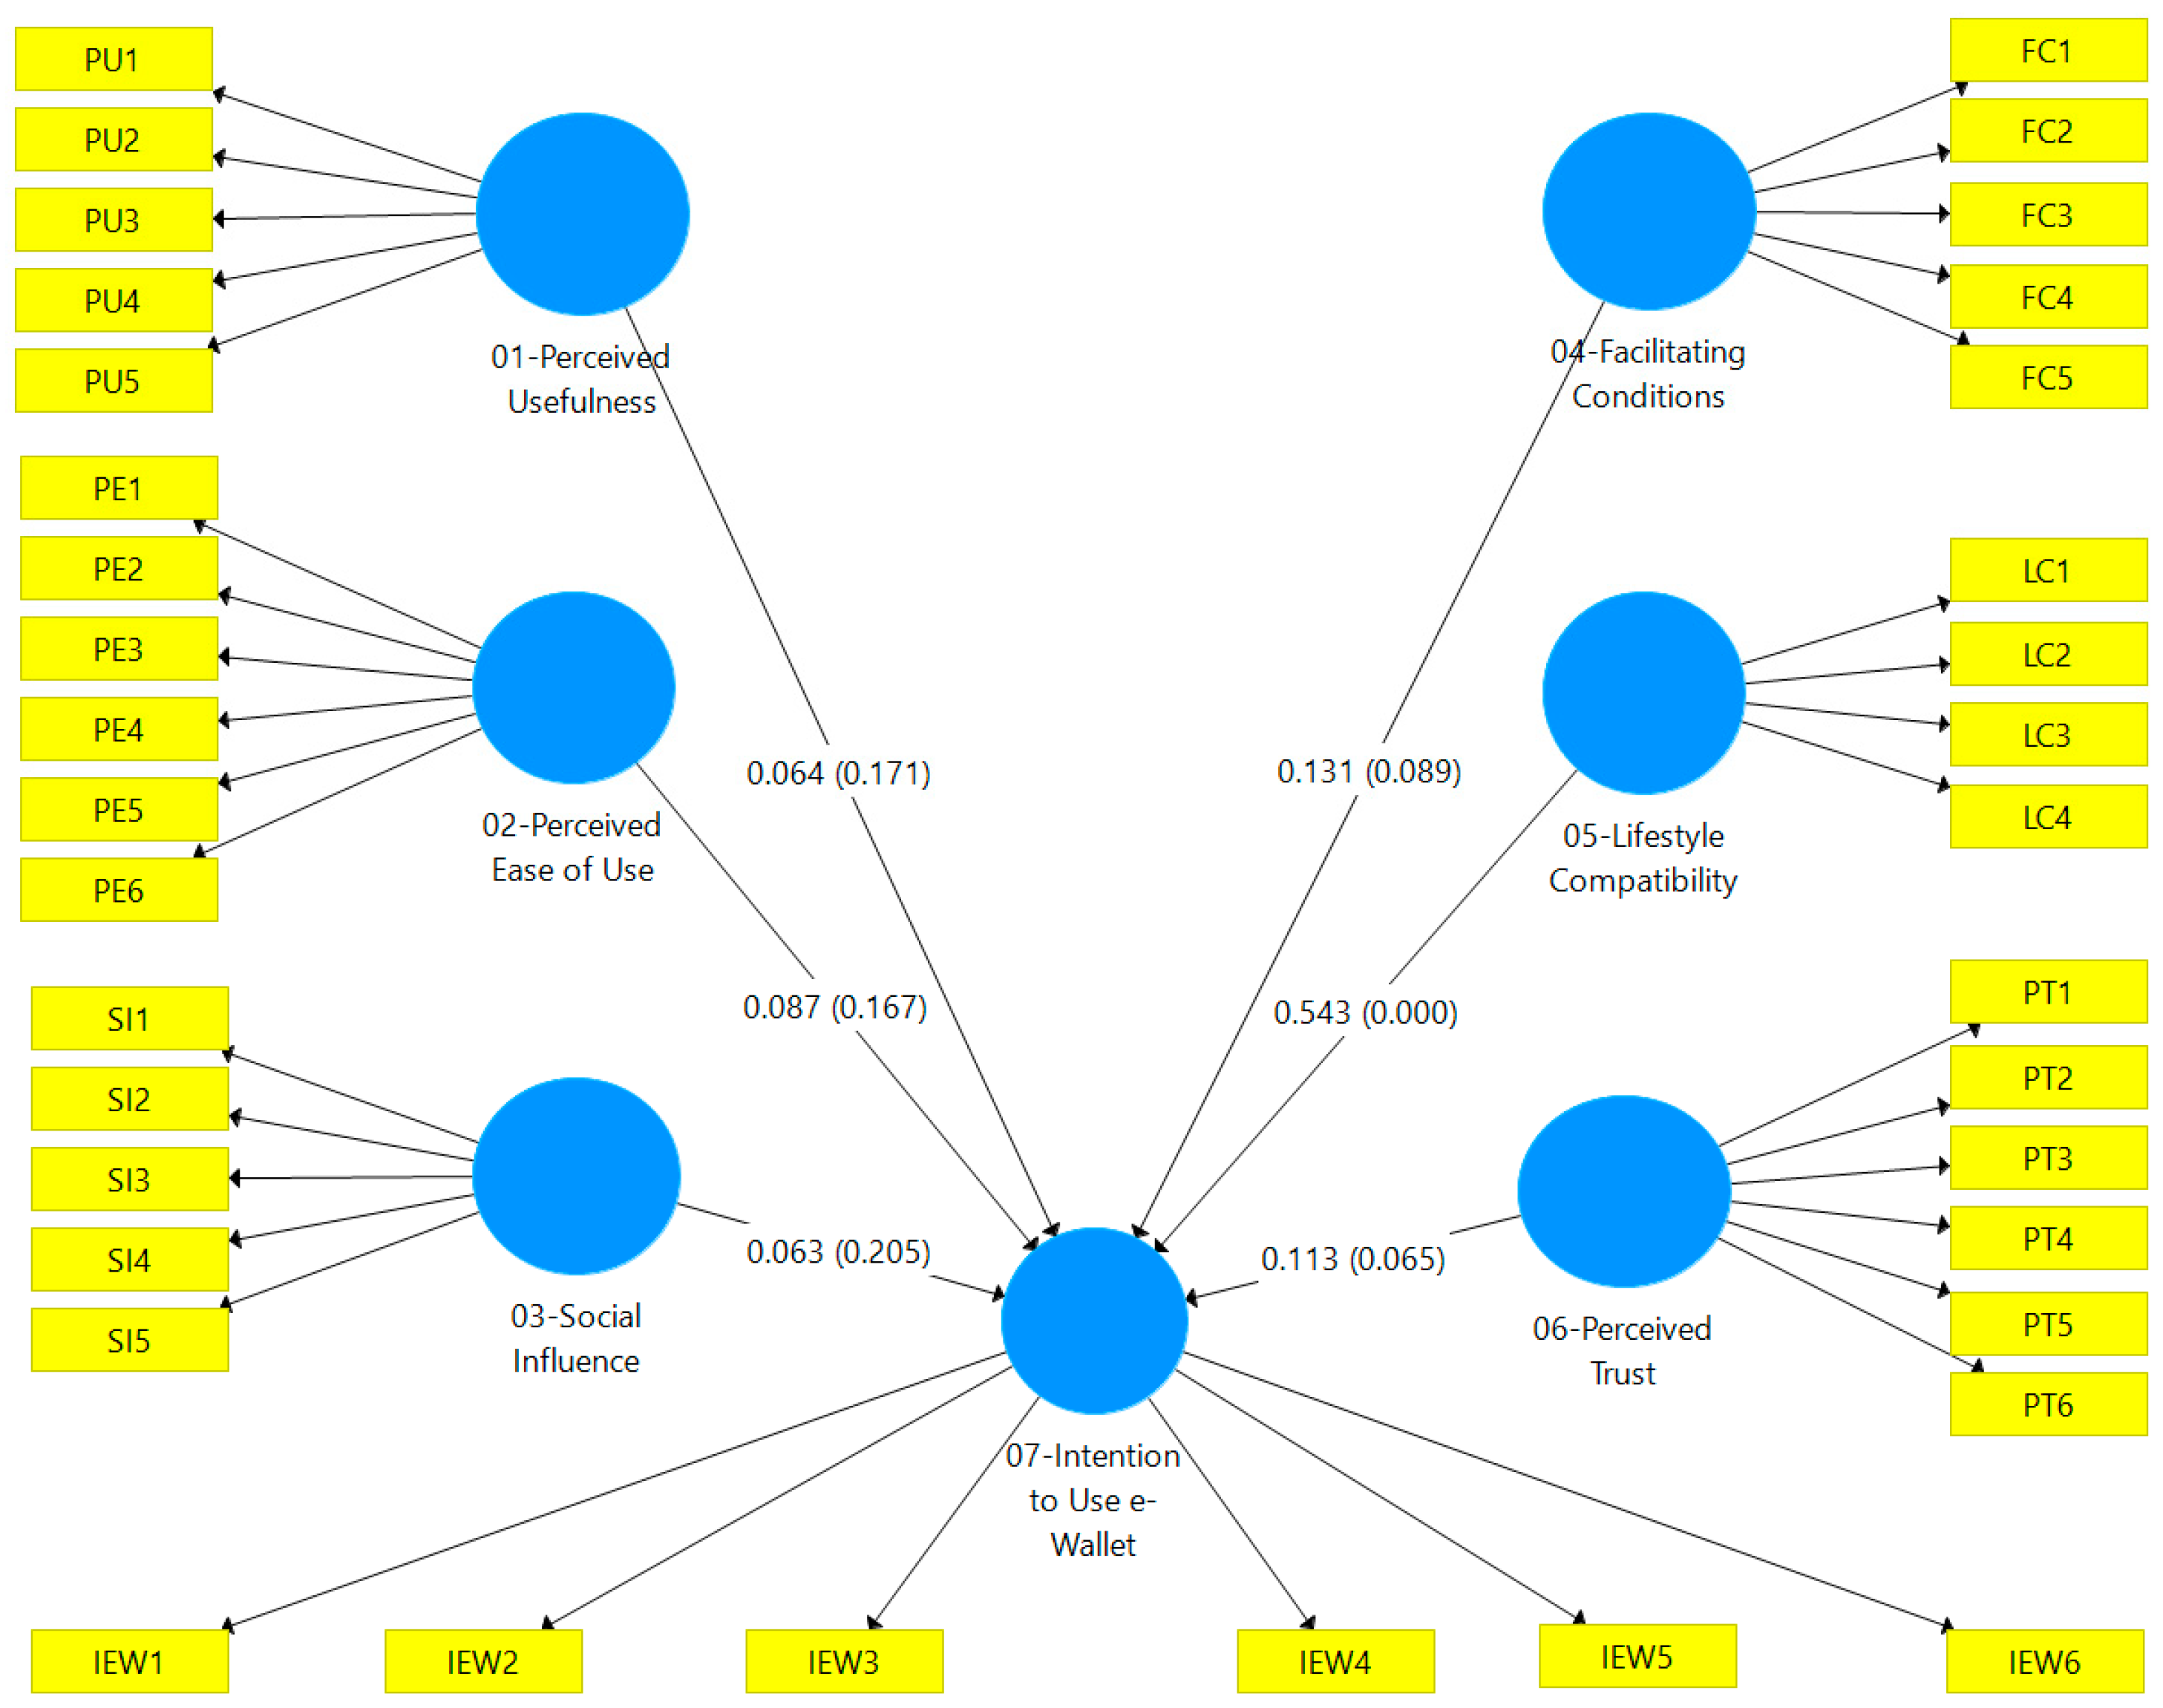
5.3. SEM Model of Customer Attitude to e-Wallets

According to the review of previous research (Section 3), there is no consensus on what should be considered as inputs and outputs when evaluating consumer attitudes toward e-wallets adoption. In order to solve this problem, we iteratively employ the PLS-SEM method in SmartPLS software [51].
The algorithm for structural regression modeling consists of the following steps:
  • Formulate hypotheses about latent variables and their relationships.
  • Determine indicators for latent variables.
  • Perform numerical modeling and assess the quality of the model.
  • Evaluate the model fit. If the model fits the data, proceed to Step 5. Otherwise, return to Step 3 and improve the model.
  • Interpret the obtained results.
Step 1. Formulate hypotheses about latent variables and their relationships.
Based on the synthesis and comparison of existing models for customer attitude to e-wallets (Table 1), the research hypotheses in this study are as follows [28]:
H1. 
There is a significant impact of Perceived usefulness on Intention to use e-wallets.
H2. 
There is a significant impact of Perceived ease of use on Intention to use e-wallets.
H3. 
There is a significant impact of Social influence on Intention to use e-wallets.
H4. 
There is a significant impact of Facilitating conditions on Intention to use e-wallets.
H5. 
There is a significant impact of Lifestyle compatibility on Intention to use e-wallets.
H6. 
There is a significant impact of Perceived trust on Intention to use e-wallets.
H7. 
Demographic characteristics have a statistically significant impact on customer satisfaction.
Note: The demographic characteristics include Gender, Age, Education level and Residence.
Step 2. Determine indicators for latent variables.
Indicators of latent variables are available in the survey questionnaire—eight constructs with 42 indicator variables [47]. The measurement model consists of 31 input indicators: PU1, PU2, PU3, PU4 and PU5 from latent variable Perceived Usefulness (PU); PE1, PE2, PE3, PE4, PE5 and PE6 from Perceived Ease of use (PE); SI1, SI2, SI3, SI4 and SI5 from latent variable Social influence (SI); FC1, FC2, FC3, FC4 and FC5 from latent variable Facilitating conditions (FC); LC1, LC2, LC3 and LC4 from latent variable Lifestyle compatibility (LC); and PT1, PT2, PT3, PT4, PT5 and PT6 from latent variable Perceived Trust (PT) and six output indicators IEW1, IEW2, IEW3, IEW4, IEW5 and IEW6 from output latent variable Intention to use e-wallet (IEW), represented in Figure 5.
Step 3. Perform numerical modeling and assess the quality of the model.
The PLS algorithm has been employed and model parameters have been obtained.
Step 4. Evaluate the model suitability. If the model fits the data, proceed to Step 5. Otherwise, return to Step 3 and improve the model.
According to the assessment of path coefficients, the model does not fit the data well. This is because the p-values of Perceived usefulness, Perceived ease of use and Social influence, which are 0.171, 0.167 and 0.205, respectively, are outside the acceptable limit (Figure 5). As a result, the process needs to go back to Step 3 and change the model settings by removing some model factors. As the p-values of the path coefficients for the new model are acceptable, the model examination continues by establishing the construct reliability and validity (Step 4).
Validity and Reliability
The initial step in the validity check process involves evaluating the measurement model and structural model. The purpose of the measurement model is to determine the validity and reliability of the construct, and its assessment involves evaluating the construct reliability, indicator reliability, convergent validity and discriminant validity of the constructs. The structural model, on the other hand, is responsible for the significance of the hypothesized relationships.
Factor Loadings
Factor loadings demonstrate the degree to which each item in the correlation matrix is associated with the given principal component. These loadings can vary between −1.0 and +1.0, with higher absolute values indicating a stronger correlation between the item and the underlying factor, as explained in Pett et al. [52]. In this study, all items had factor loadings higher than the recommended value of 0.5, according to Hair et al. [53]. Figure 6 and Table 5 depict the factor loadings.
Indicator Multicollinearity
In order to determine the multicollinearity between indicators, the Variance Inflation Factor (VIF) statistic is employed. If the VIF value is below five, then multicollinearity is considered acceptable. Table 6 displays the VIF values showing that each indicator has a VIF below the recommended threshold [54].
Reliability Analysis
There are two primary methods used to establish construct reliability (i.e., repeatability), which are Dillon-Goldstein’s rho (DG rho, rho_A in SmartPLS) and composite reliability (CR). For adequate reliability, both the DG rho and CR values should exceed 0.7 [54]. The DG rho ranged from 0.884 to 0.953, while CR ranged from 0.931 to 0.970 (Table 6); therefore, the DG rho and CR values for all constructs in the model are acceptable. All constructs have adequate reliability coefficients.
Construct Validity
Next, two types of validity check—convergent validity and discriminant validity—are required for construct validity.
Convergent Validity
Convergent validity refers to the level of consistency among multiple measures of the same concept. To assess the convergent validity of the construct, the average variance extracted (AVE) was calculated, with a minimum threshold of 0.5 [54]. The AVE scores for all constructs were found to be significant, indicating the strong convergent validity of the model (Table 6).
Discriminant Validity
Discriminant validity refers to the extent to which measures of distinct concepts can be differentiated from each other.
Fornell and Larker Criterion
Fornell and Larcker’s criterion states that discriminant validity is confirmed when the square root of the construct average variance extracted (AVE) exceeds its correlation with all other constructs. The results obtained in this study indicate that the square root of the AVE (in italic) for each construct is greater than its correlation with the other constructs (as presented in Table 7). Therefore, strong evidence exists to support the establishment of discriminant validity.
Cross Loadings
The assessment of cross-loadings enables the evaluation of whether an item, which belongs to a particular construct, exhibits a stronger loading onto its parent construct rather than other constructs in the model. The findings from this study (as presented in Table 8) indicate that all item factor loadings exhibit greater strength on the underlying construct to which they belong (shown in italics), as opposed to other constructs. Thus, based on the evaluation of cross-loadings, discriminant validity can be established.
Heterotrait-Monotrait Ratio (HTMT)
The HTMT (Heterotrait-Monotrait) ratio estimates the correlation between constructs to establish discriminant validity. The threshold for HTMT varies in the literature, ranging from 0.85 to 0.9. The results from this study, presented in Table 9, indicate that the HTMT ratios for the constructs are below the required threshold of 0.9, and they are statistically significant.
Path Coefficients and evaluation of the structural model—hypotheses testing
The p-values of the constructs indicate a significant impact on customer adoption of e-wallets, with values below 5% for Perceived ease of use and Lifestyle compatibility, and below 1% for Social influence, Facilitating conditions and Perceived trust (as shown in Figure 7 and Table 10). These findings align with our hypotheses and previous similar research. The regression coefficients for all predictor variables are positive.
Regarding the structural model, the pathways PE → IEW, SI → AEW, FC → AEW and PT → IEW express a weak effect, whereas the LC → AEW relationship demonstrates a moderate influence. The Q2 indicates a good predictive performance of the model, with a value above zero.
Step 5. Interpret the obtained results.
After the elimination of the Perceived usefulness construct of the fitted model, Perceived ease of use (H2) indicated the positive relationship of greater weight (Figure 7, β = 0.191 and p < 0.001) with the intention of use of e-wallet services. For customers, digital wallets have made shopping much simpler. They are no longer required to input their bank card information and can enter their email and password or a code sent to their phone instead. For e-wallet providers, ease of use can significantly decrease the resources required to provide support to customers. When clients can easily use e-wallet application, there will be a reduced need for customer service, saving time and costs. This result is in line with research that showed this variable as one of the main determinants of the intention to use e-wallets [24,27,28,30,31,32].
The result of H3 testing, which is the effect of Social influence, shows that social influence measures of e-wallet can increase the user intention to adopt these new financial applications ( β = 0.097 and p <= 0.05). People often look to others for guidance and validation when making choices, especially when they are uncertain about a new service’s quality or value. E-wallet vendors can leverage social influence by implementing effective marketing strategies that incorporate social proofs, such as user reviews, testimonials, and endorsements, to influence consumer behavior and increase sales. Our result is in line with the results of previous studies of de Sena Abrahão et al., Phan et al., Yang et al. and Shane et al. [24,27,28].
Facilitating conditions encompass access to technological resources, along with the provision of technical support, to aid in the adoption of e-wallets. The effect of Facilitating conditions (H4) shows that available hardware, telecommunication services, software and user support can increase customer satisfaction ( β = 0.181 and p < 0.05). Prior studies also reported that facilitating conditions significantly predicted the behavioral intention to use new financial services [28,55,56].
Approximately one-third of the participants surveyed are representatives of generation Z. They grew up in a digital world, where technology and connectivity have changed the way they interact, work and live. As digital wallet services align with Generation Z’s lifestyle values, choices and expectations, there is no doubt that Lifestyle compatibility (H5) presented a positive relationship with the intention to use e-wallets ( β = 0.404 and p < 0.001). Lifestyle compatibility is the most important construct in our model because young users seek flexibility in their lives and prioritize their work-personal life balance. This finding is consistent with the significance of the same factor in Young et al.’s model [28].
According to the results of H6 testing, which is the impact of Perceived trust (β = 0.139 and p < 0.05), this factor can increase the adoption of digital wallets. During and after the pandemic situation, a vast number of individuals have been spending more time online for work, shopping and social interaction, which makes them more susceptible to cyber threats. Despite the significant number of cyber threats for financial services, such as phishing, man-in-the-middle attacks and payment card fraud, in e-payments, trust has a relatively low impact on customer attitude. This could be attributed to the implementation of multi-factor payment authorization and the relatively small number of credit card holders in Bulgaria, which minimize the safety risks of online payments. Our result confirms the results obtained by de Sena Abrahão et al., Malik et al., Yang et al. and Raninda et al. [24,26,28,32]
The R2 value is 0.837 (Table 10), indicating that approximately 84% of the variance in customer attitude toward payments via e-wallets can be accounted for by the predictor variables: Perceived ease of use, Social influence, Facilitating conditions, Lifestyle compatibility and Perceived trust. The remaining variance can be attributed to various other factors.
There are several limitations to our study, including: (1) The scope of the study is limited to electronic wallets, which are only a subset of electronic payment services; (2) the sample size is relatively small; and (3) The distribution of participants in age and gender categories is not well-balanced. Moreover, certain factors such as psychological characteristics and perceived costs were not included in our model. It is important to note that our research was solely conducted on the Bulgarian market and, therefore, its findings may not be generalizable to other countries. Furthermore, the data was collected by a third-party research university rather than directly by a financial authority organization.

6. Conclusions and Future Research

The strong competition between payment service providers has led to the emergence of a variety of innovative tools for online payments. The COVID-19 pandemic changed consumer behavior by creating customer habits for online purchases and further strengthened the role of customer satisfaction in e-wallet services.
In this study, we utilized a customer dataset to create and validate a new model that uncovers the interdependencies between consumer perception, attitude and behavior toward e-wallet payments. We have applied this model to examine the impact of several socio-economic factors on the adoption of online payments among Bulgarian consumers. Through this model, we were able to identify best practices and suggest measures for enhancing positive users’ experience in e-payments.
The obtained results could by summarized as follows:
  • An online survey was conducted to collect a dataset of customers’ opinions regarding their willingness to adopt e-wallet payments. Based on a demographic analysis of survey data, the majority of respondents (95%) reside in urban areas, with 29% being under 30 years old and 74% being female. Around one-third of respondents (30%) reported using the Internet for more than four hours per day. In terms of education, respondents were split roughly equally between high school, bachelor’s degree and master’s or doctoral studies. Analysis of customer sentiment revealed that a majority (72%) expressed a positive attitude toward e-wallets as a convenient tool for cashless transactions. Just a quarter (25%) of the respondents reported that their interest in e-wallets has risen due to the pandemic.
  • The customers were grouped into two statistically significant clusters. The first cluster consisted of respondents who reported higher levels of satisfaction in perceived usefulness, perceived ease of use, facilitating conditions and lifestyle compatibility. On the other hand, the second cluster included those who reported relatively low levels of satisfaction in social influence and perceived trust.
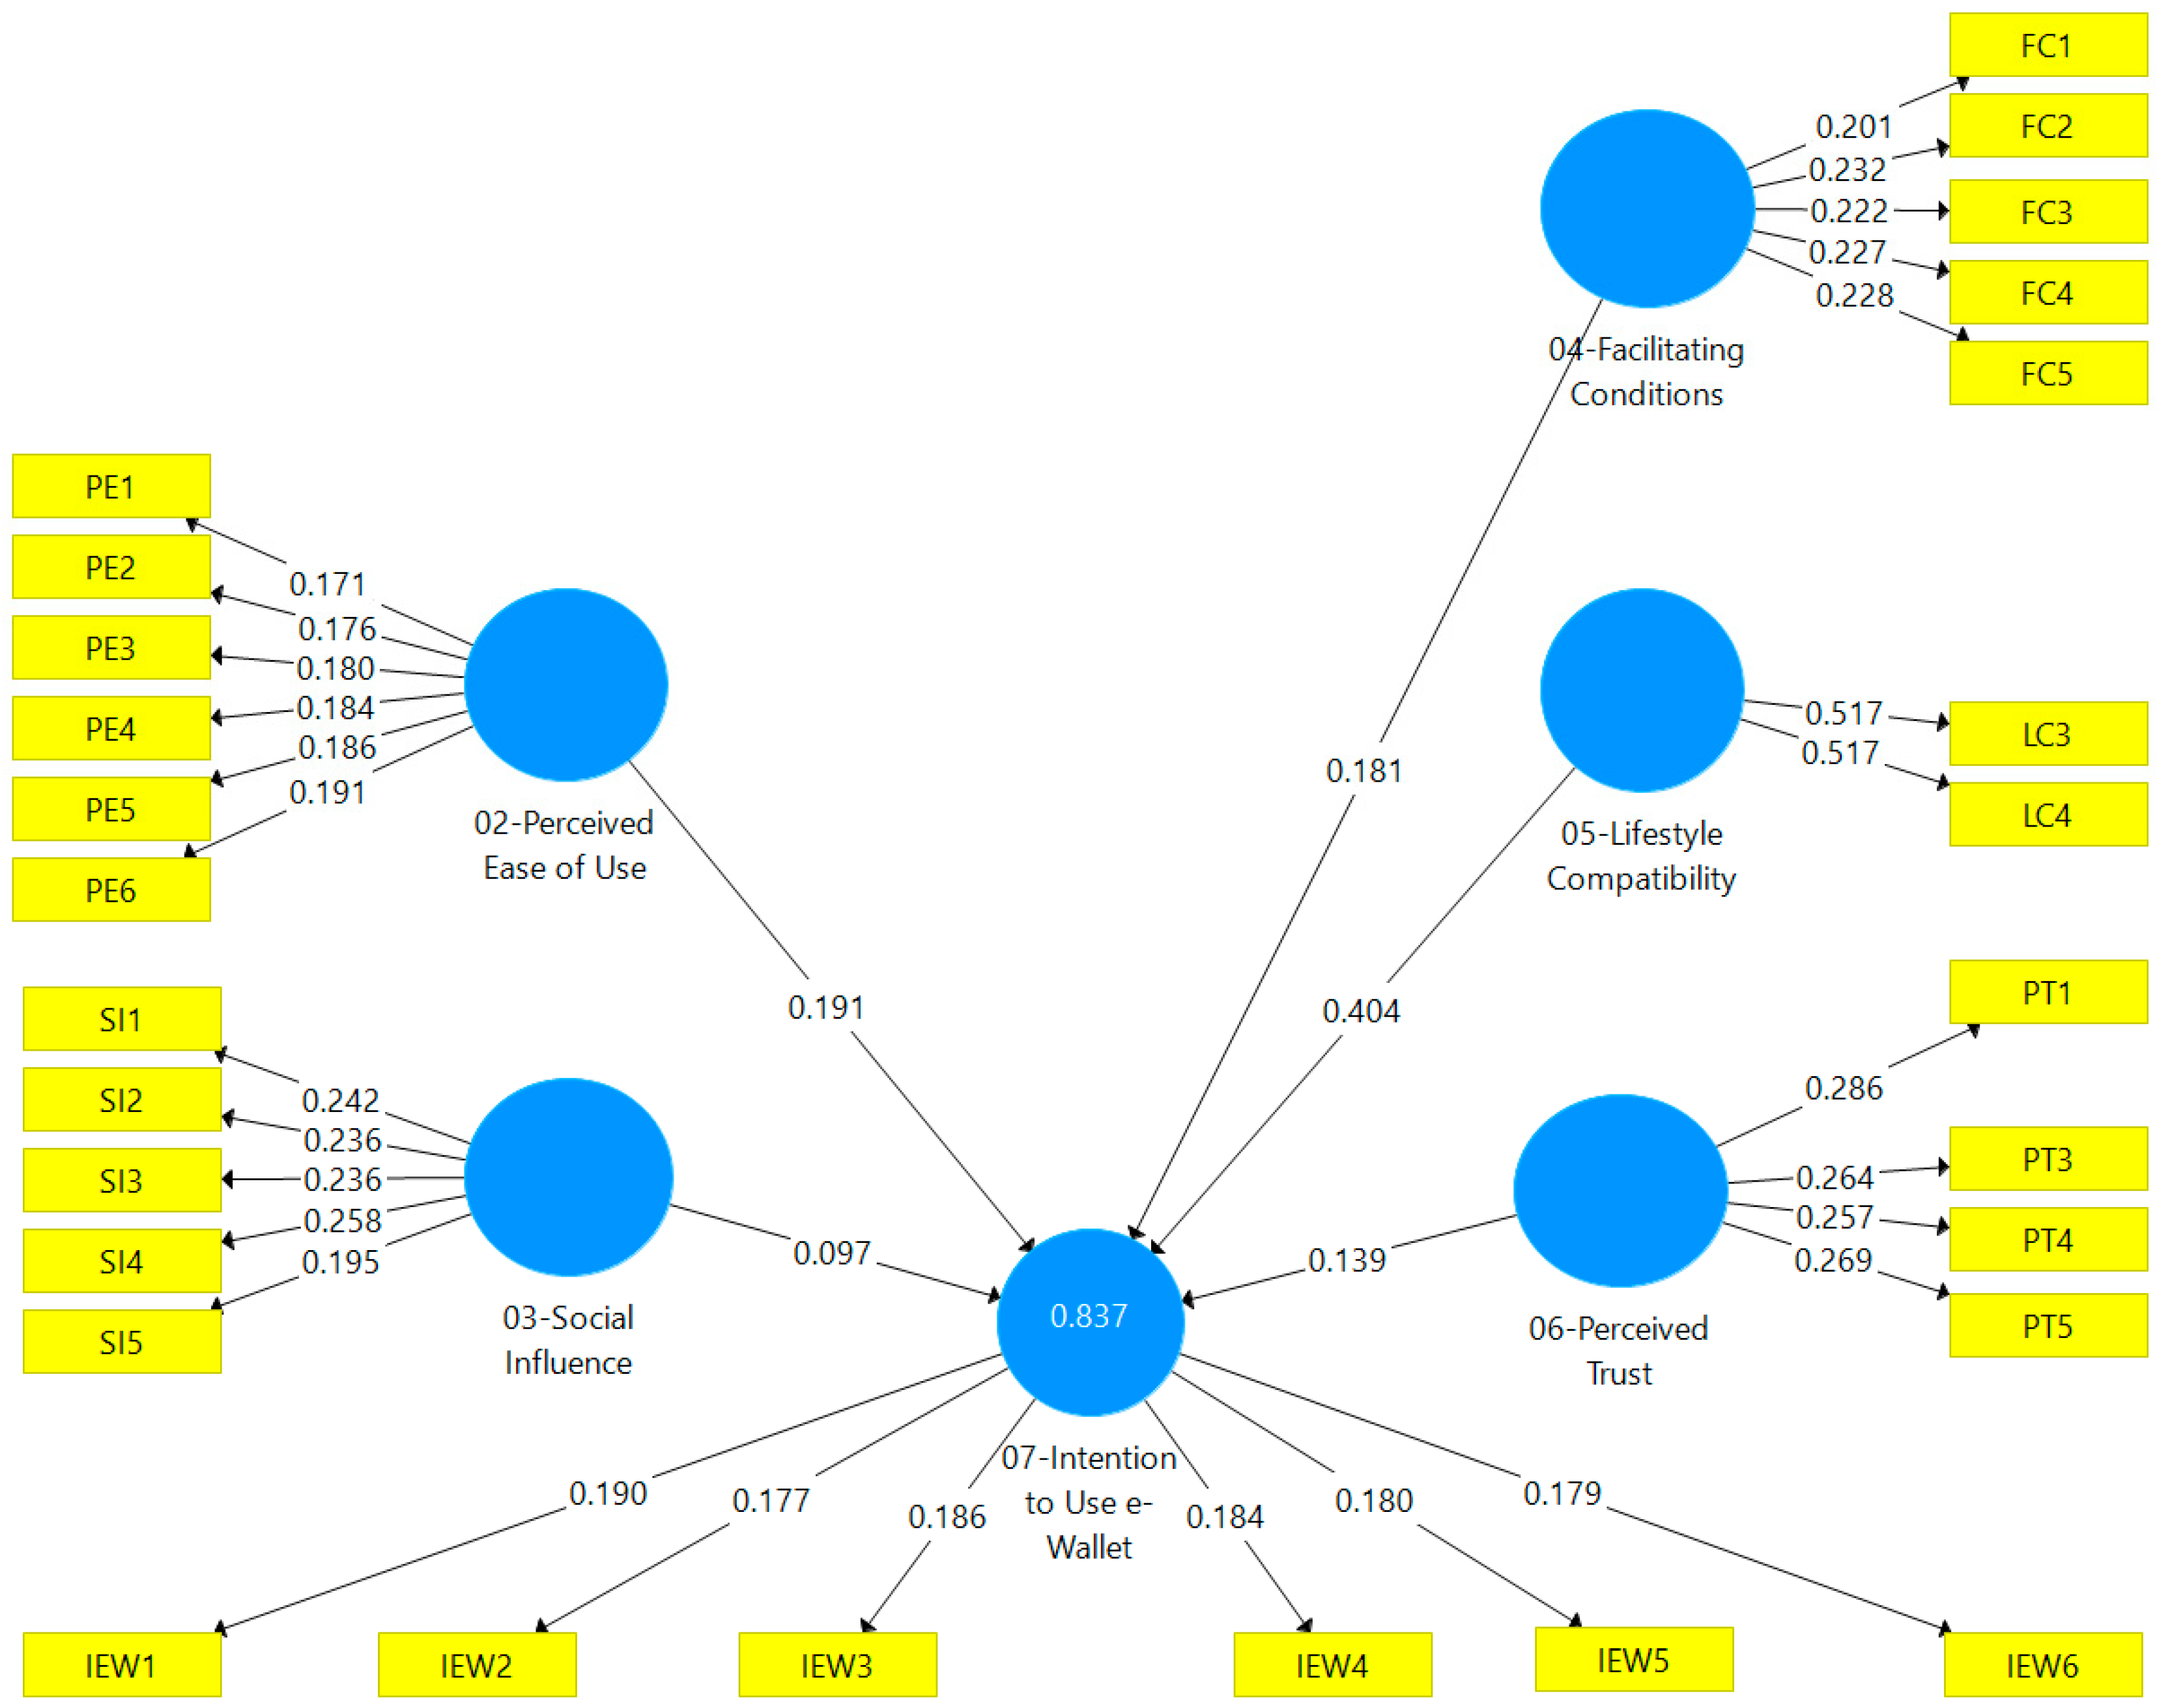
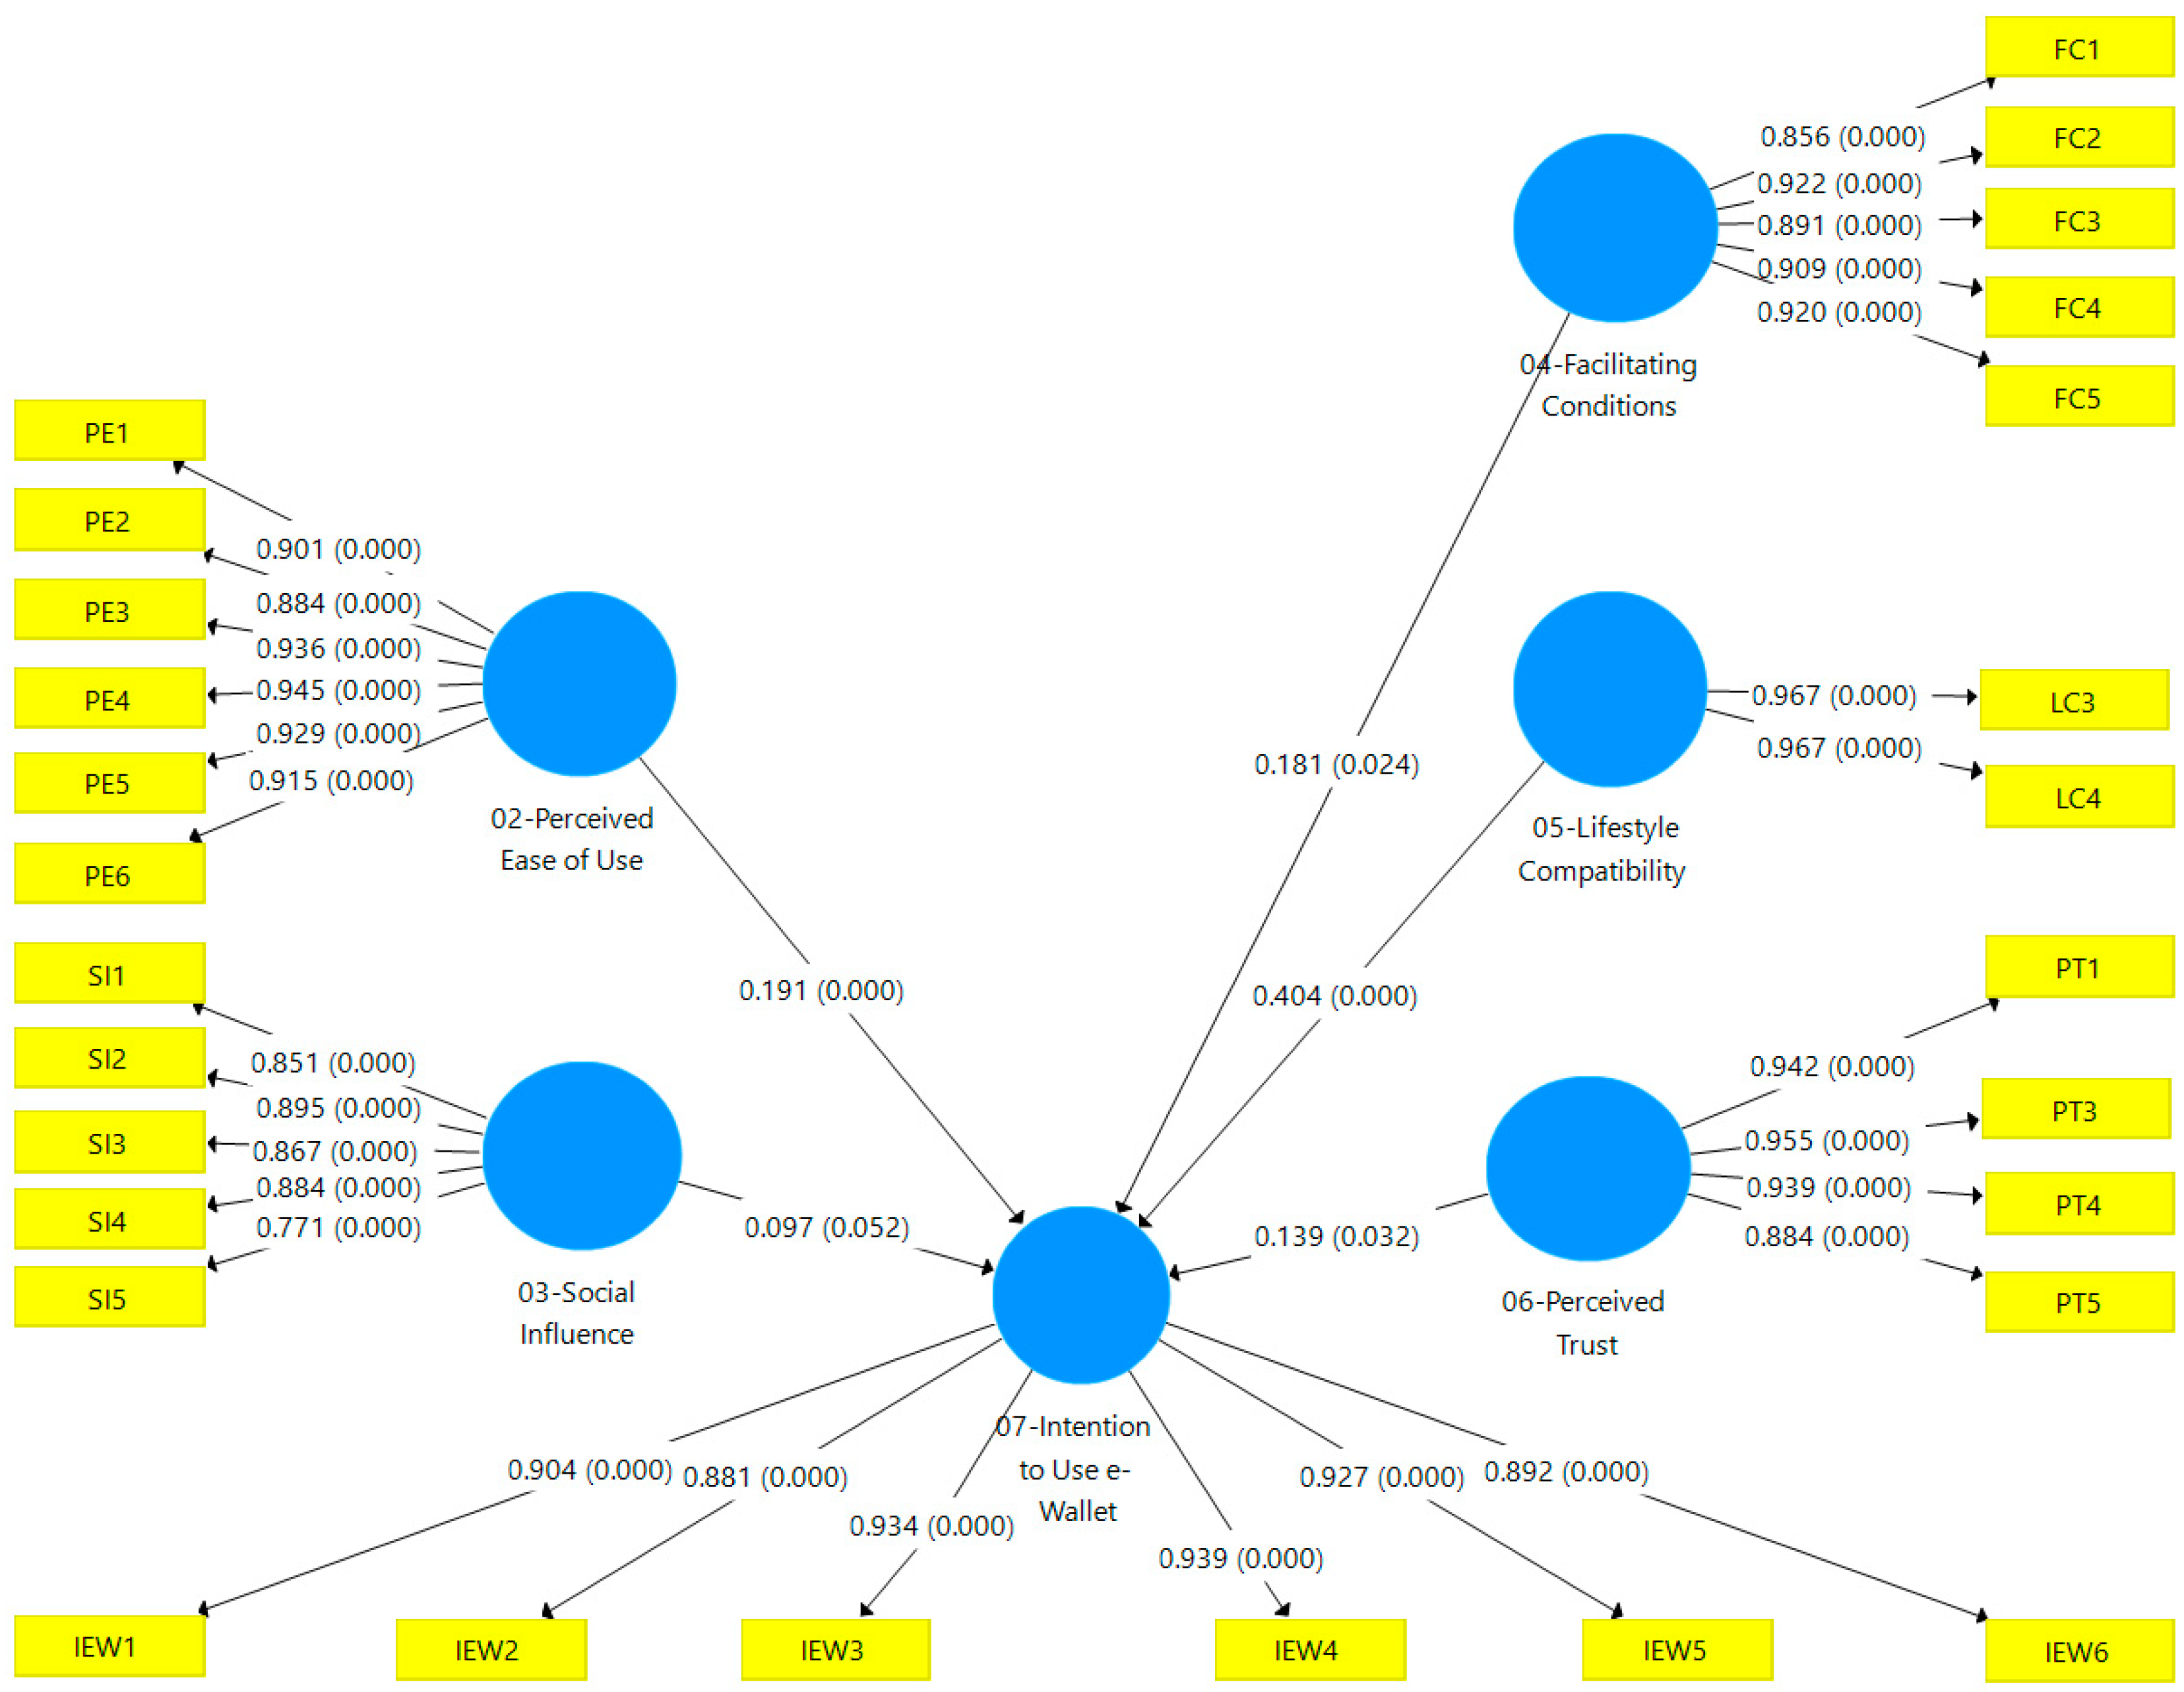
  • The developed theoretical causal (SEM) model has revealed that hypotheses H2, H3, H4, H5 and H6, which postulated a significant impact of perceived ease of use, social influence, facilitating conditions, lifestyle compatibility and perceived trust on customer adoption of e-wallets, were supported by our testing. Conversely, hypothesis H1, which suggested that perceived usefulness affects customer attitude, was rejected. Additionally, our analysis of hypothesis H7 indicated that customers’ intention to adopt e-wallets was not affected by socio-economic factors such as age, gender, education level, time spent online or area of residence. The only factor that was found to have a significant effect on customers’ attitude was their past experience with e-wallets.
The authors’ contribution to the area of digital wallet adoption is the identification of the key factors that drive consumers’ adoption of mobile payment technology, and the proposed model that can be used by practitioners to develop effective strategies for promoting the adoption of digital wallet services.
The analysis of users’ attitude toward electronic payment methods can yield valuable insights for decision-making purposes. These insights can be applied in various ways:
  • At a micro-level, electronic store owners can employ them to enhance and expand their payment systems.
  • At a national level, they can be utilized to ensure the efficient operation of national payment systems, including the timely issuance of public money in the form of cash and, potentially, digital currency in the future.
This approach can ensure that payment methods are accessible to users of all ages, incomes and locations, and that individuals have the freedom to choose how they wish to pay during the times of digital transformation.
Our plans for future research include: (1) expanding the number of participants in our survey on online payments; (2) comparing our results with similar studies from other countries, with a focus on the usage of e-wallets and the moderation effect of attributes such as age, academic degree and region; and (3) exploring the changes and evolution of e-payments in the post-COVID-19 era. Additionally, we aim to conduct further analysis by implementing fuzzy multi-criteria decision-making methods to determine the multi-attribute cause-and-effect relationships between factors that impact customer satisfaction in e-wallet services.

Author Contributions

Conceptualization, G.I., T.Y. and Y.D.; modeling, G.I., T.Y., M.R. and S.K.-B.; validation, G.I. and T.Y.; formal analysis, T.Y.; resources, G.I., T.Y., Y.D., M.R., D.A. and S.K.-B.; writing—original draft preparation, G.I.; writing—review and editing, G.I., Y.D., T.Y. and D.A.; visualization, T.Y. and S.K.-B.; supervision, G.I.; project administration, Y.D.; funding acquisition, G.I., T.Y., Y.D., M.R. and S.K.-B. All authors have read and agreed to the published version of the manuscript.

Funding

This research was funded by the National Research Program “Young Scientists and Post-Doctoral Researchers-2” (YSPDR-2), Grant No. YSPD-FESS-021, the Bulgarian National Science Fund, Grant No. KP-06 DK2-6 “Integrated model for prediction and prevention of negative social and economic effects from future epidemic crises” and the National Science Fund, co-founded by the European Regional Development Fund, Grant No. BG05M2OP001-1.002-0002 “Digitization of the Economy in Big Data Environment”.

Data Availability Statement

The data stored as csv and pdf files are publicly available at https://data.mendeley.com/datasets/yb262txrvn/2 (accessed on 8 March 2023).

Acknowledgments

The authors thank the academic editor and anonymous reviewers for their insightful comments and suggestions.

Conflicts of Interest

The authors declare no conflict of interest.

References

  1. Shaw, N.; Eschenbrenner, B.; Baier, D. Online Shopping Continuance after COVID-19: A Comparison of Canada, Germany and the United States. J. Retail. Consum. Serv. 2022, 69, 103100. [Google Scholar] [CrossRef]
  2. World Bank. The Global Findex Database 2021: Financial Inclusion, Digital Payments, and Resilience in the Age of COVID-19. Available online: https://www.worldbank.org/en/publication/globalfindex (accessed on 15 February 2023).
  3. Kabir, M.A.; Saidin, S.Z.; Ahmi, A. Adoption of E-payment Systems: A Review of Literature. In Proceedings of the International Conference on E-Commerce, Kuching, Malaysia, 20–22 October 2015; pp. 112–120. [Google Scholar]
  4. Traver, C.G.; Laudon, K.C. E-Commerce 2017: Business, Technology, Society, 13th ed.; Pearson: New York, NY, USA, 2018. [Google Scholar]
  5. Taghiloo, M.; Agheli, M.A.; Rezaeinezhad, M.R. Mobile Based Secure Digital Wallet for Peer to Peer Payment System. Int. J. UbiComp 2010, 1, 1–11. [Google Scholar] [CrossRef]
  6. Appriss Retail. The Rise in Contactless Payments during COVID-19. Available online: https://blog.apprissretail.com/blog/the-rise-in-contactless-payments-during-covid-19 (accessed on 15 February 2023).
  7. Worldpay. Global Payments Report (Published in 2020). Available online: https://worldpay.globalpaymentsreport.com/en (accessed on 15 February 2023).
  8. Juniper Research 2022. Digital Wallets: Market Forecasts, Key Opportunities and Vendor Analysis 2022–2026. Available online: https://www.juniperresearch.com/researchstore/fintech-payments/digital-wallet-research-report (accessed on 15 February 2023).
  9. Barroso, M.; Laborda, J. Digital Transformation and the Emergence of the Fintech Sector: Systematic Literature Review. Digit. Bus. 2022, 2, 100028. [Google Scholar] [CrossRef]
  10. Naysary, B. Big Data Analytics Application in Multi-Criteria Decision Making: The Case of eWallet Adoption. Available online: https://ssrn.com/abstract=4076471 (accessed on 5 April 2023).
  11. Senali, M.G.; Iranmanesh, M.; Ismail, F.N.; Rahim, N.F.A.; Khoshkam, M.; Mirzaei, M. Determinants of Intention to Use e-Wallet: Personal Innovativeness and Propensity to Trust as Moderators. Int. J. Hum.-Comput. Interact. 2022, 38, 1–13. [Google Scholar] [CrossRef]
  12. Abbasi, G.A.; Sandran, T.; Ganesan, Y.; Iranmanesh, M. Go cashless! Determinants of Continuance Intention to Use E-wallet Apps: A Hybrid Approach Using PLS-SEM and fsQCA. Technol. Soc. 2022, 68, 101937. [Google Scholar] [CrossRef]
  13. Tang, S.; Wu, Z.; Zhang, X.; Wang, G.; Ma, X.; Zheng, H.; Zhao, B.Y. Towards Understanding the Adoption and Social Experience of Digital Wallet Systems. In Proceedings of the Hawaii International Conference on System Sciences (HICSS), Maui, HI, USA, 8–11 January 2019. [Google Scholar]
  14. Ryan, F.; Pascoe, A. The role of WeChat Pay and Alipay in DC/EP. The Role of WeChat Pay and Alipay in DC/EP. In The Flipside of China’s Central Bank Digital Currency; Australian Strategic Policy Institute: Canberra, Australia, 2020; pp. 19–22. [Google Scholar]
  15. Drenten, J. Digital Payment,“Venmo Me” Culture, and Sociality. In The Routledge Handbook of Digital Consumption, 2nd ed.; Llamas, R., Belk, R., Eds.; Routledge: Abingdon, UK, 2022; pp. 98–110. [Google Scholar]
  16. Acker, A.; Murthy, D. What is Venmo? A Descriptive Analysis of Social Features in the Mobile Payment Platform. Telemat. Inform. 2020, 52, 101429. [Google Scholar] [CrossRef]
  17. Tang, Y.M.; Chau, K.Y.; Hong, L.; Ip, Y.K.; Yan, W. Financial Innovation in Digital Payment with WeChat towards Electronic Business Success. J. Theor. Appl. Electron. Commer. Res. 2021, 16, 1844–1861. [Google Scholar] [CrossRef]
  18. Jiang, X.N. Analysis of WeChat Pay Based on Technology Acceptance Model. In Proceedings of the 7th International Conference on Social Sciences and Economic Development (ICSSED 2022), Wuhan, China, 25–27 March 2022; pp. 668–675. [Google Scholar]
  19. Esther Krupa, M. A Study on Users Perception towards Selected E-wallets (Google Pay & Paytm) Among College Students. Gedrag Organ. 2022, 35, 318–327. [Google Scholar]
  20. Rahuman, M.A.; Khader, A.A. Comparative Study of Customer Satisfaction on Google Pay and Phonepe Mobile Apps. Int. J. Latest Res. Humanit. Soc. Sci. 2022, 5, 165–167. [Google Scholar]
  21. Liébana-Cabanillas, F.; García-Maroto, I.; Muñoz-Leiva, F.; Ramos-de-Luna, I. Mobile payment adoption in the age of digital transformation: The case of Apple Pay. Sustainability 2020, 12, 5443. [Google Scholar] [CrossRef]
  22. Manickam, T.; Vinayagamoorthi, G.; Gopalakrishnan, S.; Sudha, M.; Mathiraj, S.P. Customer Inclination on Mobile Wallets with Reference to Google-Pay and PayTM in Bengaluru City. Int. J. E-Bus. Res. 2022, 18, 1–16. [Google Scholar] [CrossRef]
  23. Gomachab, R.; Maseke, B.F. The Impact of Mobile Banking on Customer Satisfaction: Commercial Banks of Namibia (Keetmanshoop). J. Internet Bank. Commer. 2018, 23, 1–18. [Google Scholar]
  24. de Sena Abrahão, R.; Moriguchi, S.N.; Andrade, D.F. Intention of Adoption of Mobile Payment: An Analysis in the Light of the Unified Theory of Acceptance and Use of Technology (UTAUT). RAI Rev. Adm. E Inovação 2016, 13, 221–230. [Google Scholar] [CrossRef] [Green Version]
  25. Lin, H.Y.; Wang, M.H.; Chen, H.T. Determinants for Consumer Adoption of Mobile Payment Technology. Int. J. e-Educ. e-Bus. e-Manag. e-Learn. 2019, 9, 146–159. [Google Scholar] [CrossRef]
  26. Malik, A.; Suresh, S.; Sharma, S. An Empirical Study of Factors Influencing Consumers’ Attitude towards Adoption of Wallet Apps. Int. J. Manag. Pract. 2019, 12, 426–442. [Google Scholar] [CrossRef]
  27. Phan, T.N.; Ho, T.V.; Le-Hoang, P.V. Factors Affecting the Behavioral Intention and Behavior of Using E-wallets of Youth in Vietnam. J. Asian Financ. Econ. Bus. 2020, 7, 295–302. [Google Scholar] [CrossRef]
  28. Yang, M.; Mamun, A.A.; Mohiuddin, M.; Nawi, N.C.; Zainol, N.R. Cashless Transactions: A Study on Intention and Adoption of e-Wallets. Sustainability 2021, 13, 831. [Google Scholar] [CrossRef]
  29. Shane, J.M.S.S.; Chan, T.J.; Mohan, Y.M. Factors Affecting the Intention to Adopt E-Wallet Services during COVID-19 Pandemic. J. Arts Soc. Sci. 2022, 5, 28–40. [Google Scholar]
  30. Wardana, A.A.; Saputro, E.P.; Wahyuddin, M.; Abas, N.I. The Effect of Convenience, Perceived ease of use, and Perceived Usefulness on Intention to Use E-wallet: Empirical Study on Generation Z in Surakarta. In Proceedings of the International Conference on Economics and Business Studies (ICOEBS 2022), Sukarta, Indonesia, 5–6 December 2022; Volume 655, pp. 386–395. [Google Scholar]
  31. Kınış, F.; Tanova, C. Can I Trust My Phone to Replace My Wallet? The Determinants of E-Wallet Adoption in North Cyprus. J. Theor. Appl. Electron. 2022, 17, 1696–1715. [Google Scholar] [CrossRef]
  32. Raninda, R.; Wisnalmawati, W.; Oetomo, H. The Effect of Perceived Usefulness, Perceived Ease of Use, Perceived Security, and Cashback Promotion on Behavioral Intention to the DANA E-Wallet. J. Ilm. Manaj. Kesatuan 2022, 10, 63–72. [Google Scholar] [CrossRef]
  33. Davis, F.D. Perceived Usefulness, Perceived Ease of Use, and User Acceptance of Information Technology. MIS Q. 1989, 13, 319–340. [Google Scholar] [CrossRef] [Green Version]
  34. Venkatesh, V.; Davis, F.D. A Theoretical Extension of the Technology Acceptance Model: Four Longitudinal Field Studies. Manag. Sci. 2000, 46, 186–204. [Google Scholar] [CrossRef] [Green Version]
  35. Venkatesh, V.; Morris, M.G.; Davis, G.B.; Davis, F.D. User Acceptance of Information Technology: Toward a Unified View. MIS Q. 2003, 27, 425–478. [Google Scholar] [CrossRef] [Green Version]
  36. Venkatesh, V.; Bala, H. Technology Acceptance Model 3 and a Research Agenda on Interventions. Decis. Sci. J. 2008, 39, 273–315. [Google Scholar] [CrossRef] [Green Version]
  37. Sarmah, R.; Dhiman, N.; Kanojia, H. Understanding Intentions and Actual Use of Mobile Wallets by Millennial: An Extended TAM Model Perspective. J. Indian Bus. Res. 2021, 13, 361–381. [Google Scholar] [CrossRef]
  38. Tian, Y.; Chan, T.J.; Suki, N.M.; Kasim, M.A. Moderating Role of Perceived Trust and Perceived Service Quality on Consumers’ Use Behavior of Alipay e-wallet System: The Perspectives of Technology Acceptance Model and Theory of Planned Behavior. Hum. Behav. Emerg. Technol. 2023, 5276406, 14. [Google Scholar] [CrossRef]
  39. Teo, S.C.; Law, P.L.; Koo, A.C. Factors Affecting Adoption of E-wallets among Youths in Malaysia. J. Inf. Syst. Technol. Manag. 2020, 5, 39–50. [Google Scholar] [CrossRef]
  40. Shaw, N.; Sergueeva, K. The Non-monetary Benefits of Mobile Commerce: Extending UTAUT2 with Perceived Value. Int. J. Inf. Manag. 2019, 45, 44–55. [Google Scholar] [CrossRef]
  41. Muhtasim, D.A.; Tan, S.Y.; Hassan, M.A.; Pavel, M.I.; Susmit, S. Customer Satisfaction with Digital Wallet Services: An Analysis of Security Factors. Int. J. Adv. Comput. Sci. Appl. 2022, 13, 195–206. [Google Scholar] [CrossRef]
  42. Oliveira, T.; Thomas, M.; Baptista, G.; Campos, F. Mobile Payment: Understanding the Determinants of Customer Adoption and Intention to Recommend the Technology. Comput. Hum. Behav. 2016, 61, 404–414. [Google Scholar] [CrossRef]
  43. Lwoga, E.T.; Lwoga, N.B. User Acceptance of Mobile Payment: The Effects of User-Centric Security, System Characteristics and Gender. Electron. J. Inf. Syst. Dev. Ctries 2017, 81, 1–24. [Google Scholar] [CrossRef] [Green Version]
  44. Chawla, D.; Joshi, H. Role of Mediator in Examining the Influence of Antecedents of Mobile Wallet Adoption on Attitude and Intention. Glob. Bus. Rev. 2020. [Google Scholar] [CrossRef]
  45. Pandey, S.; Chawla, D. Engaging M-commerce Adopters in India: Exploring the Two Ends of the Adoption Continuum across Four M-commerce Categories. J. Enterp. Inf. Manag. 2019, 32, 191–210. [Google Scholar] [CrossRef]
  46. Karjaluoto, H.; Shaikh, A.A.; Leppäniemi, M.; Luomala, R. Examining Consumers’ Usage Intention of Contactless Payment Systems. Int. J. Bank Mark. 2019, 38, 332–351. [Google Scholar] [CrossRef]
  47. Ilieva, G.; Yankova, T.; Dzhabarova, Y.; Ruseva, M.; Angelov, D.; Klisarova-Belcheva, S. Impact of COVID-19 Pandemic on Cus-tomer Attitude toward E-wallet Payments. In Mendeley Data; Elsevier: Amsterdam, The Netherlands, 2023. [Google Scholar]
  48. Beran, T.N.; Violato, C. Structural Equation Modeling in Medical Research: A Primer. BMC Res. Notes 2010, 3, 267. [Google Scholar] [CrossRef] [PubMed] [Green Version]
  49. Shiau, W.L.; Sarstedt, M.; Hair, J.F. Internet Research Using Partial Least Squares Structural Equation Modeling (PLS-SEM). Internet Res. 2019, 29, 398–406. [Google Scholar] [CrossRef]
  50. McKinsey. Consumer Trends in Digital Payments. Available online: https://www.mckinsey.com/industries/financial-services/our-insights/banking-matters/consumer-trends-in-digital-payments (accessed on 15 February 2023).
  51. Ringle, C.M.; Wende, S.; Becker, J.-M. SmartPLS 3; SmartPLS GmbH: Bönningstedt, Germany, 2015. [Google Scholar]
  52. Pett, M.A.; Lackey, N.R.; Sullivan, J.J. Making Sense of Factor Analysis: The Use of Factor Analysis for Instrument Development In Health Care Research; Sage Publications: Thousand Oaks, CA, USA, 2003. [Google Scholar]
  53. Hair, J.F., Jr.; Black, W.C.; Babin, B.J.; Andreson, R.E. Multivariate Data Analysis, 7th ed.; Pearson: Edinburgh, UK, 2014. [Google Scholar]
  54. Fornell, C.; Bookstein, F.L. Two Structural Equation Models: LISREL and PLS Applied to Consumer Exit-voice Theory. J. Mark Res. 1982, 19, 440–452. [Google Scholar] [CrossRef] [Green Version]
  55. Rahi, S.; Ghani, M.; Alnaser, F.; Ngah, A. Investigating the Role of Unified Theory of Acceptance and Use of Technology (UTAUT) in Internet Banking Adoption Context. Manag. Sci. Lett. 2018, 8, 173–186. [Google Scholar] [CrossRef]
  56. Almazroa, M.; Gulliver, S. Understanding the Usage of Mobile Payment Systems—The Impact of Personality on the Continuance Usage. In Proceedings of the 4th International Conference on Information Management (ICIM), London, UK, 25–27 May 2018; pp. 188–194. [Google Scholar]
Figure 1. The matrix of distances (ordered dissimilarity matrix) between respondents’ answers.
Systems 11 00185 g001
Figure 2. Hierarchical group heat map by respondents.
Systems 11 00185 g002
Figure 3. Hierarchical group heat map by factors.
Systems 11 00185 g003
Figure 4. Customer clusters by k-means (k = 2, 3, 4, 5) using 31 input indicators.
Systems 11 00185 g004
Figure 5. Measurement model with six latent variables with their path coefficients and p-values.
Systems 11 00185 g005
Figure 6. SEM procedure result, the regression coefficient for each construct and coefficient of determination.
Systems 11 00185 g006
Figure 7. Path coefficients and p-values—inner and outer model.
Systems 11 00185 g007
Table 1. Comparison between the most widely used digital wallets.
Digital WalletSupported
Platforms
Payment ServicesPayment MethodsIn-Store
Technologies
PayPalWeb, iOS,
Android
Online and mobile payments, invoicing and checkoutBank cards, bank transfers, PayPal balanceNFC, QR codes
AlipayWeb, iOS,
Android
Online and mobile payments, invoicing and checkoutBank cards, bank transfers, AliPay balanceNFC, QR codes, facial recognition
Amazon PayWeb, iOS,
Android
Online and mobile payments, checkoutBank cards, bank transfers, Amazon Pay balanceQR codes
VenmoWeb, iOS,
Android
P2P transfers,
in-app purchases
Bank cards, bank transfers, Venmo balanceQR codes
DwollaWeb, iOS, AndroidOnline, mobile, invoicing and recurring paymentsBank transfer only
WeChat PayiOS,
Android
Online and mobile payments, P2P transfersBank cards,
WeChat Pay balance
NFC, QR codes, facial recognition
Google WalletWeb, iOS,
Android
Online and mobile payments, P2P transfersBank cards, bank transfers, Google Wallet balanceNFC, QR codes
Apple PayiOS, Apple WatchOnline and mobile payments, P2P transfersBank cards, bank transfers, Apple Pay balanceNFC
Samsung WalletAndroid, Samsung smart watchesOnline and mobile paymentsBank cards, bank transfers, Samsung Wallet balanceNFC, MST *
Cash AppiOS,
Android
P2P transfers,
Bitcoin purchases
Bank cards, bank transfers, Cash App balanceQR codes
Shop PayiOS,
Android
Online checkout serviceBank cards, Apple Pay, Google Wallet, UPI **,
Net banking
QR codes
Meta PayiOS,
Android
Online paymentsBank cards, PayPal, Shop PayNFC, QR codes
PayTMiOS,
Android
P2P and peer-to-merchant
transfers
Bank cards, UPI,
Net banking
QR codes, sound-based payments
PhonePeiOS
Android
Money transfers, offline and online paymentsBank cards, UPI,
Net banking
NFC, QR codes
YooMoneyiOS,
Android
Online and offline paymentsBank cards, e-wallet, cashNFC, QR codes
Notes: * MST is an abbreviation of Magnetic Secure Transmission. ** UPI—Unified Payments Interface. Symbol “–” denotes missing data.
Table 2. Comparison of models of customer intention to use e-wallet services.
ReferenceUtilized
Algorithm
Evaluation Metrics (Number)Statistically Significant Factors (Number)R2
Davis 1989 [34]MLRUsefulness, Ease of Use (2) UsageUsefulness (1)0.31–0.74
Venkatesh and Davis 2000 [35]PLS-SEMPerceived usefulness, Perceived ease of use, Subjective norm (3)Perceived usefulness, Perceived ease of use, Subjective norm (3)0.37–0.52
Venkatesh et al. 2003 [36]PLS-SEMEffort expectancy, Performance expectancy, Social influence, Facilitating conditions (4)Effort expectancy, Performance expectancy (2)0.36–0.77
Venkatesh and Bala 2008 [37]PLS-SEM Perceived usefulness, Perceived ease of use, Subjective norm, Voluntariness (4)Perceived usefulness, Perceived ease of use (2)0.40–0.53
de Sena Abrahão et al. 2016 [24]PLS-SEMPerceived expectations,
Effort expectations, Social influence,
Perceived risk, Perceived cost (5)
Perceived expectations,
Effort expectations, Social influence,
Perceived risk (4)
0.762
Lin et al. 2019 [25]PLS-SEMPerceived expectancy, Effort expectancy, Social influence, Facilitating conditions, Hedonic motivation, Price value, Security (7)Perceived expectancy,
Hedonic motivation, Security (3)
0.660
Malik et al. 2019 [26]MLRPerformance expectancy, Ease of use, Social influence, Enjoyment, Incentives, Aesthetics, Trust (7)Performance expectancy, Incentives, Trust (3)0.207–0.300
Phan et al. 2020 [27]PLS-SEMEffort expectancy, Performance expectancy, Social influence,
Security and privacy (4)
Performance expectancy,
Social influence (2)
Yang et al. 2021 [28]PLS-SEMPerceived usefulness, Perceived ease of use, Social influence, Facilitating conditions, Lifestyle compatibility, Perceived trust (6)Usefulness, Ease of use, Social influence, Lifestyle compatibility, Perceived trust (5)0.726
Shane et al. 2022 [29]PLS-SEMPerformance expectancy, Effort expectancy, Social influence, Facilitating conditions, Promotional benefits, Perceived trust (6)Performance expectancy, Facilitating conditions (2)0.478
Wardana et al. 2022 [30]PLS-SEMConvenience, Perceived usefulness, Perceived ease of use (3)Convenience, Perceived usefulness, Perceived ease of use (3)0.603
Kınış and Tanova 2022 [31]PLS-SEMCustomer knowledge, Perceived ease of use, Perceived usefulness, Trust (4)Customer knowledge, Perceived ease of use, Perceived usefulness, Trust (4)0.49–0.69
Raninda et al. 2022 [32]MLRPerceived usefulness, Perceived ease of use, Perceived security, Cashback promotion (4)Perceived usefulness, Perceived ease of use, Perceived security, Cashback promotion (4)0.570
Naysary 2022 [10]ML, AHPUsefulness, Risk, Ease of use, Customer service, User interface, Trust, Promotional reward, Associated costs, Interoperability, Security (10)Customers’ clusters,
e-wallets’ ranking
Notes: 1. The list ordering of evaluation metrics proposed by the authors is preserved. 2. Symbol “–” denotes missing data. 3. R2 is the determination coefficient.
Table 3. Customers profile in the sample (n = 257).
Variables of the SampleNo. of ConsumersPercentage (%)
1. GenderMale6726.1
Female19073.9
2. AgeUnder 206424.9
Between 21 and 307529.2
Between 31 and 403112.1
Between 41 and 506023.3
Over 502710.5
3. Place of residenceCity17066.1
Town7328.4
Village145.4
4. Municipality/Province --
5. Monthly income per household memberLess than BGN 132013251.4
More than BGN 132012548.6
6. EducationHigh school9938.5
Bachelor7930.7
Master7328.4
PhD62.3
7. Frequency of Internet usage per dayLess than 1 h3714.4
1–4 h14355.6
More than 4 h7730.0
8. Do you pay online?Yes, via bank software14355.6
Yes, via software of non-banking organization238.9
Yes, via bank and non-bank software197.4
Other20.8
No7027.2
18. Average number of e-wallet payments (monthly)Never5320.6
Between 1 and 5 times7730.0
Between 6 and 10 times5019.5
Between 11 and 15 times228.6
More than 15 times5521.4
Table 4. Average values by clusters and absolute differences between clusters by indicators.
PU1PU2PU3PU4PU5PE1PE2PE3PE4
Cluster #14.2694.113.9094.2744.2243.8863.7084.1374.146
Cluster #21.8161.7891.6841.8421.7371.7371.7111.8951.842
Difference2.4542.322.2242.4322.4872.1491.9972.2422.304
PE5PE6SI1SI2SI3SI4SI5FC1FC2
Cluster #14.1514.1923.4663.5073.6443.8263.4433.6853.991
Cluster #21.9211.6841.6321.6581.8161.7111.7891.7891.816
Difference2.232.5081.8341.8491.8282.1161.6531.8952.175
FC3FC4FC5LC1LC2LC3LC4PT1PT2
Cluster #13.9543.7263.8173.8584.0233.9863.7723.7493.721
Cluster #21.8161.6051.6321.6581.5791.6581.6321.7111.684
Difference2.1392.1212.1862.2012.4442.3282.142.0382.037
PT3PT4PT5PT6IEW1IEW2IEW3IEW4IEW5
Cluster #13.6713.6623.7123.7493.9593.9044.0273.8493.804
Cluster #21.6581.7631.6581.7371.5261.7371.7891.7111.632
Difference2.0131.8992.0542.0122.4332.1672.2382.1392.172
IEW6AEW1AEW2AEW3AEW4AEW5
Cluster #13.6623.9683.9184.0683.2332.836
Cluster #21.5261.9471.7631.7891.7112.605
Difference2.1362.0212.1552.2791.5220.23
Table 5. Factor loadings for indicators.
Indicator
Variable
Factor LoadingIndicator
Variable
Factor LoadingIndicator
Variable
Factor LoadingIndicator
Variable
Factor Loading
PE10.901SI20.895FC40.909PT50.884
PE20.884SI30.867FC50.920IEW10.904
PE30.936SI40.884LC30.967IEW20.881
PE40.945SI50.771LC40.967IEW30.954
PE50.929FC10.856PT10.942IEW40.939
PE60.915FC20.922PT30.955IEW50.927
SI10.851FC30.891PT40.939IEW60.892
Table 6. Construct reliability (DG rho and CR), convergent validity (AVE) and multicollinearity (VIF).
FactorDG RhoCRAVEVIF
Perceived ease of use0.964 *0.970 *0.884 *3.119 *
Social influence0.914 *0.931 *0.731 *2.720 *
Facilitating conditions0.944 *0.955 *0.810 *4.573 *
Lifestyle compatibility0.931 *0.967 *0.935 *3.370 *
Perceived trust0.949 *0.963 *0.866 *3.676 *
Intention to use e-wallet0.960 *0.968 *0.834 *
* DG rho: Dillon–Goldstein’s rho, * CR: Composite Reliability (>0.6); * AVE: Average Variance Extracted (>0.5); * VIF: Variance Inflation Factors (<5).
Table 7. Discriminant validity—Fornell and Larker criterion.
FactorPerceived Ease of UseSocial InfluenceFacilitating ConditionsLifestyle CompatibilityPerceived TrustIntention to Use e-Wallet
Perceived ease of use0.919
Social influence0.7060.855
Facilitating conditions0.7690.7410.900
Lifestyle compatibility0.7680.7330.7750.967
Perceived trust0.7120.7200.8340.7930.930
Intention to use e-wallet0.8070.8620.8280.8640.7920.913
Note: Italics represents the square root of AVE.
Table 8. Discriminant validity—cross loadings.
Indicator VariablePerceived Ease of UseSocial InfluenceFacilitating ConditionsLifestyle CompatibilityPerceived TrustIntention to Use e-Wallet
PE10.9010.6360.6680.6910.6540.698
PE20.8840.6530.7020.6750.6450.719
PE30.9360.6510.6920.6900.6650.737
PE40.9450.6300.7060.7130.6420.753
PE50.9290.6390.7290.7120.6590.762
PE60.9150.6820.7370.7460.6620.778
SI10.6330.8510.6470.6350.6230.670
SI20.6320.8950.6170.6320.6450.656
SI30.5840.8670.6540.5990.5920.656
SI40.6690.8840.6910.6960.6560.715
SI50.4810.7710.5450.5600.5540.540
FC10.6290.6320.8560.6230.6910.673
FC20.7340.6760.9220.7040.7460.780
FC30.7200.6750.8910.6960.6780.745
FC40.6700.6740.9090.7430.8370.762
FC50.7040.6770.9200.7170.7990.763
LC30.7680.7030.7750.9670.7180.835
LC40.7170.7150.7240.9670.7000.835
PT10.6970.6880.7750.7170.9420.781
PT30.6390.6470.7470.6750.9550.721
PT40.6510.6790.7620.6680.9390.703
PT50.6610.6630.8190.6630.8840.735
IEW10.7610.7020.7940.8270.7380.904
IEW20.7160.6790.7530.7510.7070.881
IEW30.7480.6800.8040.7910.7380.934
IEW40.7420.7180.7550.7820.7530.939
IEW50.7240.7110.7340.7710.7410.927
IEW60.7300.6830.6950.8060.6590.892
Table 9. Discriminant validity—HTMT.
FactorPerceived Ease of UseSocial InfluenceFacilitating ConditionsLifestyle CompatibilityPerceived TrustIntention to Use e-Wallet
Perceived ease of use
Social influence0.751
Facilitating conditions0.8060.799
Lifestyle compatibility0.8100.7960.827
Perceived trust0.7450.7750.8820.780
Intention to use e-wallet0.8390.8130.8700.9130.818
Table 10. The path coefficient of relationship between latent variables.
Hypothesis β Sample
Mean
MeanSDt Statisticsp ValuesR2f2Q2
02-Perceived ease of use 07-Intention to use e-wallet0.1910.1900.1910.0513.7190.0000.8370.0720.689
03-Social influence 07-Intention to use e-wallet0.0970.0930.0970.0491.9580.0520.021
04-Facilitating conditions 07-Intention to use e-wallet0.1810.1840.1810.0752.3970.0240.044
05-Lifestyle compatibility 07-Intention to use e-wallet0.4040.4050.4040.0695.8270.0000.296
06-Perceived trust 07-Intention to use e-wallet0.1390.1380.1390.0612.2820.0320.032
Disclaimer/Publisher’s Note: The statements, opinions and data contained in all publications are solely those of the individual author(s) and contributor(s) and not of MDPI and/or the editor(s). MDPI and/or the editor(s) disclaim responsibility for any injury to people or property resulting from any ideas, methods, instructions or products referred to in the content.

