Article

Estimating Benefits of Microtransit for Social Determinants of Health: A Social Return on Investment System Dynamics Model

by
Mohammad Maleki
and
Janille Smith-Colin
*
Department of Civil and Environmental Engineering, Southern Methodist University, P.O. Box 750340, Dallas, TX 75275-0340, USA
*
Author to whom correspondence should be addressed.
Systems 2023, 11(11), 538; https://doi.org/10.3390/systems11110538
Submission received: 20 September 2023 / Revised: 28 October 2023 / Accepted: 31 October 2023 / Published: 4 November 2023
(This article belongs to the Special Issue Decision Making and Policy Analysis in Transportation Planning)

Abstract

:
Lack of transportation services in low-income communities greatly affects people’s health and well-being, creating barriers to social determinants of health (SDOH). One potential solution that has gained the attention of US decision-makers in recent years is microtransit, a transportation intervention aimed at addressing this issue. Despite promising results from prior microtransit implementation, the extent to which these programs deliver social benefits remains uncertain. This study presents a novel model called Social Return on Investment System Dynamics (SROISD) to forecast the social benefits of a microtransit program in Holmes County, Mississippi. The SROISD model identifies the scope and key stakeholders, maps outcomes, and gives outcomes a value. A causal loop diagram is developed next based on mapped outcomes and a literature review, thereby conceptualizing the processes through which social benefits are gained from the microtransit program. Three stock and flow diagrams are then created from the causal loop diagram to formulate the system and produce results. Outcomes mapped relative to three SDOH areas (1) accessing healthcare, (2) accessing employment, and (3) social participation indicate an overall positive return from investing in microtransit within the low-income community of interest. Additionally, ridesharing demonstrates a significant positive correlation with the SROI ratio. These findings offer support for the advantages of investing in microtransit. Additionally, the SROISD methodology offers decisionmakers a dynamically responsive approach that integrates traditional return on investment methodologies with system dynamics to explore social benefits across a variety of impact categories.

1. Introduction

In recent years, there has been a growing recognition of the significant importance of social determinants of health (SDOH), as defined by the World Health Organization (WHO), as non-medical factors that influence health outcomes [1]. These factors are commonly categorized into five primary domains: health access and quality, education access and quality, social and community context, economic stability, and neighborhood and built environment [2]. While the influence of medical care on health is undeniable, research indicates that medical care alone accounts for only about 10–15 percent of population health outcomes, with social determinants playing a more substantial role, contributing to 50–60 percent of overall health outcomes [3].
Transportation, often considered a subcategory of the built environment SDOH categories, is an important factor contributing to population health. It is thought of by many as a social determinant of health [4,5], while also supporting access and mobility to almost all other SDOH categories (e.g., transportation access to healthcare, education, and employment) [6]. In low-income areas, where economic disparities and limited resources prevail, reliable and accessible transportation systems are even more vital for providing access to employment, healthcare, and other SDOH. Limited transportation access in a region may result in a cycle of poverty where residents are unable to fully participate in economic and social opportunities such as steady employment, leading to economic instability and thus creating transportation mobility barriers [7].
Recognizing the pivotal role of transportation as a social determinant of health, several innovative solutions have been employed to effectively address these challenges. One such solution is the implementation of microtransit programs, which have shown promise in mitigating barriers related to SDOH [8,9,10]. As defined by the Federal Transit Administration, Microtransit is a technology-enabled, multi-passenger transportation service that operates on dynamically generated routes [11]. Rossetti et al., further describe microtransit as a variety of on-demand transportation services that provide shared rides within a designated service area, typically utilizing vehicles such as vans, minivans, or microbuses [12]. In contrast to conventional fixed-route public transportation systems, microtransit programs are intended to be responsive to passenger demand and can change their routes and schedules in real-time. Users crowdsource rides by using a smartphone app or phone call provided by the private operator to make requests for rides [13].
Furthermore, microtransit has the potential to boost community cohesion and economic development, making it a vital tool for promoting sustainability and enhancing livability. Microtransit contributes to sustainability by addressing several sustainable development goals (SDG) described by the United Nations [14]. It promotes Good Health and Well-Being (SDG 3) by providing convenient and affordable transportation options that provide access to healthcare and reduce air pollution [15,16]. It supports Decent Work and Economic Growth (SDG 8) by creating job opportunities in the transportation sector [17]. Microtransit provides affordable access to employment opportunities and regular access to healthcare, helping to reduce poverty (SDG 1) by improving economic prospects for individuals and families, ultimately making urban areas more sustainable and livable.
Although prior experiences with several microtransit programs have demonstrated varying degrees of success [10], there remains a lack of comprehensive understanding regarding the advantages of investing in such transportation interventions. There is a need for an approach that can assess the benefits and social returns of microtransit interventions across different populations, as well as the impacts of budget availability on service quality.
Studies show that Social Return on Investment (SROI) is a valuable approach for comprehensively evaluating or forecasting social value created through investments in funded activities [18]. Given the potential social, economic, and environmental impacts of microtransit programs on SDOH outcomes, utilizing SROI becomes particularly relevant in assessing the effectiveness of such programs. However, the costs and benefits of a microtransit program accrue over several years, are influenced by several factors, and change over time. For instance, the program’s ridership can fluctuate due to changes in service quality, changes in car affordability, shifts in the cost of rides, and more. Moreover, these programs struggle with financial solvency and economic sustainability, in many instances limited by a monetary valuation of costs and benefits that fails to consider the full scope of societal value created. These realities create a need for a system of valuation that can dynamically track changes in system characteristics and provide a monetary valuation of costs and social benefits across broad categories. Hence, an adaptive approach is essential to precisely forecast the SROI arising from microtransit programs as they evolve over time.
In response to this matter, this study introduces an innovative approach called Social Return on Investment System Dynamics (SROISD), which pioneers the application of a system dynamics (SD)-based framework to forecast SROI and thus overall social value from investments. It is proposed that SROISD can serve as a highly valuable tool for forecasting future returns from programs whose costs and social benefits accrue and change dynamically. The ability to capture intricate, interconnected relationships within a system, simulate various scenarios, and offer insights into how changes over time can affect outcomes are just a few advantages that SD modeling offers. In order to provide a thorough understanding of how investments in social programs can yield long-term social value by accounting for dynamic interactions and dependencies, SROISD makes use of these advantages. This enables both policymakers and stakeholders to make more informed decisions.
The rest of this paper is organized as follows: In Section 2, a comprehensive review of existing literature related to microtransit programs, Social Return on Investment (SROI), and System Dynamics is provided. Section 3 delves into the specifics of the case study and the applied methodological framework. The system conceptualization is addressed in Section 4, followed by model formulation in Section 5. Section 6 is dedicated to model validation, while Section 7 encompasses the presentation of results, including scenario analysis, sensitivity analysis, and policy implications. Finally, Section 8 presents the conclusions.

2. Literature

2.1. Characteristics of Microtransit Programs

The term “microtransit” first appeared in 2014 to describe a brand-new class of transportation services provided by private organizations, including VIA, Bridj, and Chariot [13]. While conventional transit services are typically operated by public agencies, follow fixed routes and schedules, and provide more targeted coverage of densely populated areas, microtransit offers more flexible, demand-responsive services, often using smaller vehicles or ridesharing platforms. Microtransit programs are known for their adaptability, as routes and schedules can be adjusted in real-time to respond to passenger demand. These programs have also been designed to address the specific SDOH needs of targeted populations within a community and typically provide door-to-door or curb-to-curb service [19].
Microtransit programs are designed to cater to a diverse range of users with specific transportation needs. These users often include individuals who may lack access to traditional fixed-route transit or require more flexible transportation options. Microtransit services play a pivotal role in enhancing transportation equity by serving various groups, such as shift workers, low-income individuals, the elderly, disabled, and underserved communities. For example, Transportation Disadvantaged Late Shift (TD Late Shift) [17] offered by Pinellas Suncoast Transit Authority (PSTA) offers service to individuals with jobs that either begin or end between 9 p.m. and 6 a.m. The service specifically serves those who have no other means of transportation and have annual incomes of no greater than 150% of the federal poverty level. Another notable example is Rides to Wellness (R2W), operated by the Mass Transportation Authority (MTA) [16]. R2W targets the elderly, disabled, and transportation-disadvantaged community members of Flint, Michigan. It also extends its services to residents of areas not previously served by fixed-route transit, ensuring improved transportation access for underserved populations. Additionally, GoLink service in Dallas serves as a critical component of microtransit programs by providing access to areas that were previously not served by fixed-route public transit. It plays a vital role in offering first-mile access to fixed-route transit stations for all residents, including people who work in areas such as Inland Port Dallas [20]. Additional information on potential passengers of microtransit programs can be found in Table 1.
In addition to the programs in the US, there are examples of community-based microtransit programs in other countries. In the UK, the Dial-a-Community Bus in Maud, Aberdeenshire, is a charitable microtransit service combating isolation for vulnerable community members [21]. In Germany, Sprinti operates in the Hannover region, focusing on improving public transport accessibility, particularly through first- and last-mile solutions [22]. Additionally, TransLink in Queensland, Australia, offers a flexible local transport program connecting people to public transport networks, shopping, healthcare, and employment opportunities through shared and pre-booked services [23].
Microtransit programs, like all other funded activities, involve both costs and benefits. Understanding and evaluating these costs and benefits are fundamental to effective transportation planning and resource allocation. The costs incurred and social benefits delivered by microtransit can be assessed using performance measures [10], as is customary in transportation planning and performance measurement [24,25]. Table 1 presents the characteristics, target population, and performance measures used to capture the impacts of various microtransit programs across the United States, as published in work by the American Public Transportation Association (APTA) [10]. Performance measures will play a pivotal role in subsequent phases of this paper by facilitating the estimation of the benefits yielded by microtransit.
Table 1. Characteristics of microtransit programs in the U.S.
ProgramAgencyTarget PopulationGeneral CharacteristicsPerformance Measures
Transportation Disadvantaged Late Shift (TD Late Shift)
[10,17]
Pinellas Suncoast Transit Authority (PSTA)
People with jobs that begin or end between 9 p.m. and 6 a.m.
Have no other means of transportation, including family and friends
With annual incomes of no greater than 150% of the federal poverty level
Launched in 2016
Door-to-door service to and from work
Total of 25 trips a month
Monthly savings in operating costs
Average time gained for personal and leisure purposes per person
Number of new job opportunities or work shifts
Average number of people served per month
Number of jobs that program has provided
Passenger Satisfaction
Regional Transportation Commission FlexRIDE (RTC FlexRide)
[10,26]
Regional Transportation Commission (RTC)
People in unincorporated areas of Washoe County
Launched in 2019
Rides booked using the RTC smartphone app or via phone call
Funded with local sales tax dollars
Curb-to-curb rides to jobs, education, medical services, and grocery stores
Monthly savings in operating costs
Monthly amount of economic activity gained
Average decrease in time spent on daily commutes to and from work, education, medical centers, and grocery stores per person.
Average number of people served per month
Number of jobs accessed by the program
Rides to Wellness (R2W)
[10,16]
Mass Transportation Authority (MTA)
The elderly, disabled, or transportation-disadvantaged community members of Flint, Michigan.
Launched in 2016
Same-day door-to-door microtransit service for eligible residents
Mainly for non-emergency medical transportation (NEMT), but can also be booked for accessing grocery stores, beauty salons, farmers markets, pharmacies, government agencies, non-profits, laundromats, or senior centers
Average monthly decrease in no-show appointments
Average number of people served per month
Number of jobs accessed by the program
Average monthly cost savings when accessing medical centers
RideKC Microtransit
[10,27]
Johnson County Government
Residents of areas not previously served by fixed-route transit
Launched in 2019
Curb-to-Curb rides
Operates from 6 a.m. to 8 p.m.
Rides booked via the smartphone app, website, and phone call
Average monthly cost savings for mobility needs
Average number of people served per month
Number of jobs that program has created

2.2. Social Return on Investment

Social Return on Investment (SROI) is a valuable approach and framework for comprehensively evaluating or forecasting social value created through investments in funded activities [18,28]. The concept of SROI was pioneered in the late 1990s by the Roberts Enterprise Development Fund (REDF) in the United States [29,30] and was later tested by the New Economics Foundation (NEF) in the United Kingdom [31,32,33]. Early descriptions of SROI methodology imply that the approach initially developed from common methodologies for evaluating investments in business and finance allows nonprofit sector returns/payoffs to be defined in broader social terms [34]. SROI is often defined as a stakeholder-informed cost-benefit analysis (CBA) or a Return on Investment (ROI) approach that takes a broader perspective of returns by integrating social benefits in addition to project revenues [28,35]. The main objective of SROI is to estimate costs and benefits resulting from an investment, whether social, economic, or environmental, in monetary values [20], with a focus on non-traded, non-market products. SROI requires the participation of stakeholders in the estimation of financial proxies and the evaluation of social value created by organizations [36].
SROI analysis is classified as two different types: evaluative SROI, which examines past outcomes, and forecast SROI, which predicts the social value created when planned future outcomes are achieved [37]. SROI analysis comprises six distinct phases: (1) defining this study scope and identifying stakeholders; (2) mapping outcomes; (3) collecting data on the outcomes and assigning a value to them; (4) establishing impacts; (5) computing the SROI ratio; and (6) calculating, reporting, and validating the SROI measure [37]. SROI has been used to evaluate the impact of funded activities on SDOH [38,39,40] including transportation. For instance, SROI has been used to evaluate the impact of modifying vehicles for use by people with disabilities [32]. Results showed a return ranging from $2.78 to $17.32 for every dollar invested in vehicle modifications. SROI has also been used to measure the social value created by investing in risk-based transportation asset management systems in the state of Iowa [41]. Although there are studies that evaluate the monetary benefits of transportation programs through approaches such as CBA [42,43] and ROI [44], studies utilizing SROI to measure the social value created by transportation interventions remain few [45]. Considering the potential for societal gains, including in SDOH, that can result from investing in transportation services, SROI is an appropriate approach to capture social, economic, and environmental returns from such investments.

2.3. System Dynamics

System dynamics (SD) is a powerful tool that enables comprehensive analysis and modeling of complex, dynamic systems, providing valuable insights into the interdependencies and feedback loops that drive their behavior. Transportation systems, in particular, are often complex systems, involving various stakeholders and components that interact and influence one another, making them an ideal context for leveraging the power of SD [46]. SD originated in the mid-1950s through the pioneering work of Professor Jay W. Forrester at the Massachusetts Institute of Technology [47]. While SD initially found early applications in business management [48], many research papers have applied SD over the last several decades to fields including transportation-related issues [46,49]. SD has also been extensively used in transportation and health [50]. Causal loop diagrams (CLD) are used in SD to establish dynamic hypotheses, which serve as the foundation for constructing quantitative stock and flow diagrams (SFD). These SFDs then enable the simulation of a system’s behavior, facilitating the analysis and understanding of dynamic problems within the system.

3. Data and Methods

3.1. Case Study Context

This study forecasts SROI to estimate the social value generated from the implementation of microtransit in Holmes County, Mississippi, which is recognized as one of the lowest-income areas in the nation. A rural county with a population of nearly 17,000 individuals, of which 84 percent identify as Black or African American, the county faces significant socio-economic challenges, with a median income of $16,311 per year and 42 percent living below the poverty line. Additionally, Holmes County has limited public transit service available to residents. Transportation-related barriers to employment, healthcare, healthy food, and education are thus prevalent due to limited transit service. To address these challenges, a free-ride microtransit program was launched in fall 2021 by Feonix Mobility Rising, a non-profit impact organization, offering on-demand, door-to-door rides to local points of interest with the cooperation of other transit agencies in the city. Financial support for the program was offered by a major health insurance provider acting as the payer. Riders could book trips online or through the call center of the program, and transportation requests were fulfilled using taxis and wheelchair-accessible vehicles operated by volunteer drivers or a vehicle provided by one of the local transit agencies. The microtransit program was delivered as a collaboration between the local transit agencies and Feonix, the non-profit operator. This integrated, on-demand service thus filled in gaps in the existing rural transit service. While limited radio and newspaper advertisements were in place, the program primarily relied on a community resource coordinator for promotion, with further word-of-mouth within the community being a crucial rider attraction mechanism. The pilot program operated from September through December 2021, produced 373 rides, and served 61 individuals. Locations accessed by riders included employment, healthcare facilities, and other destinations.

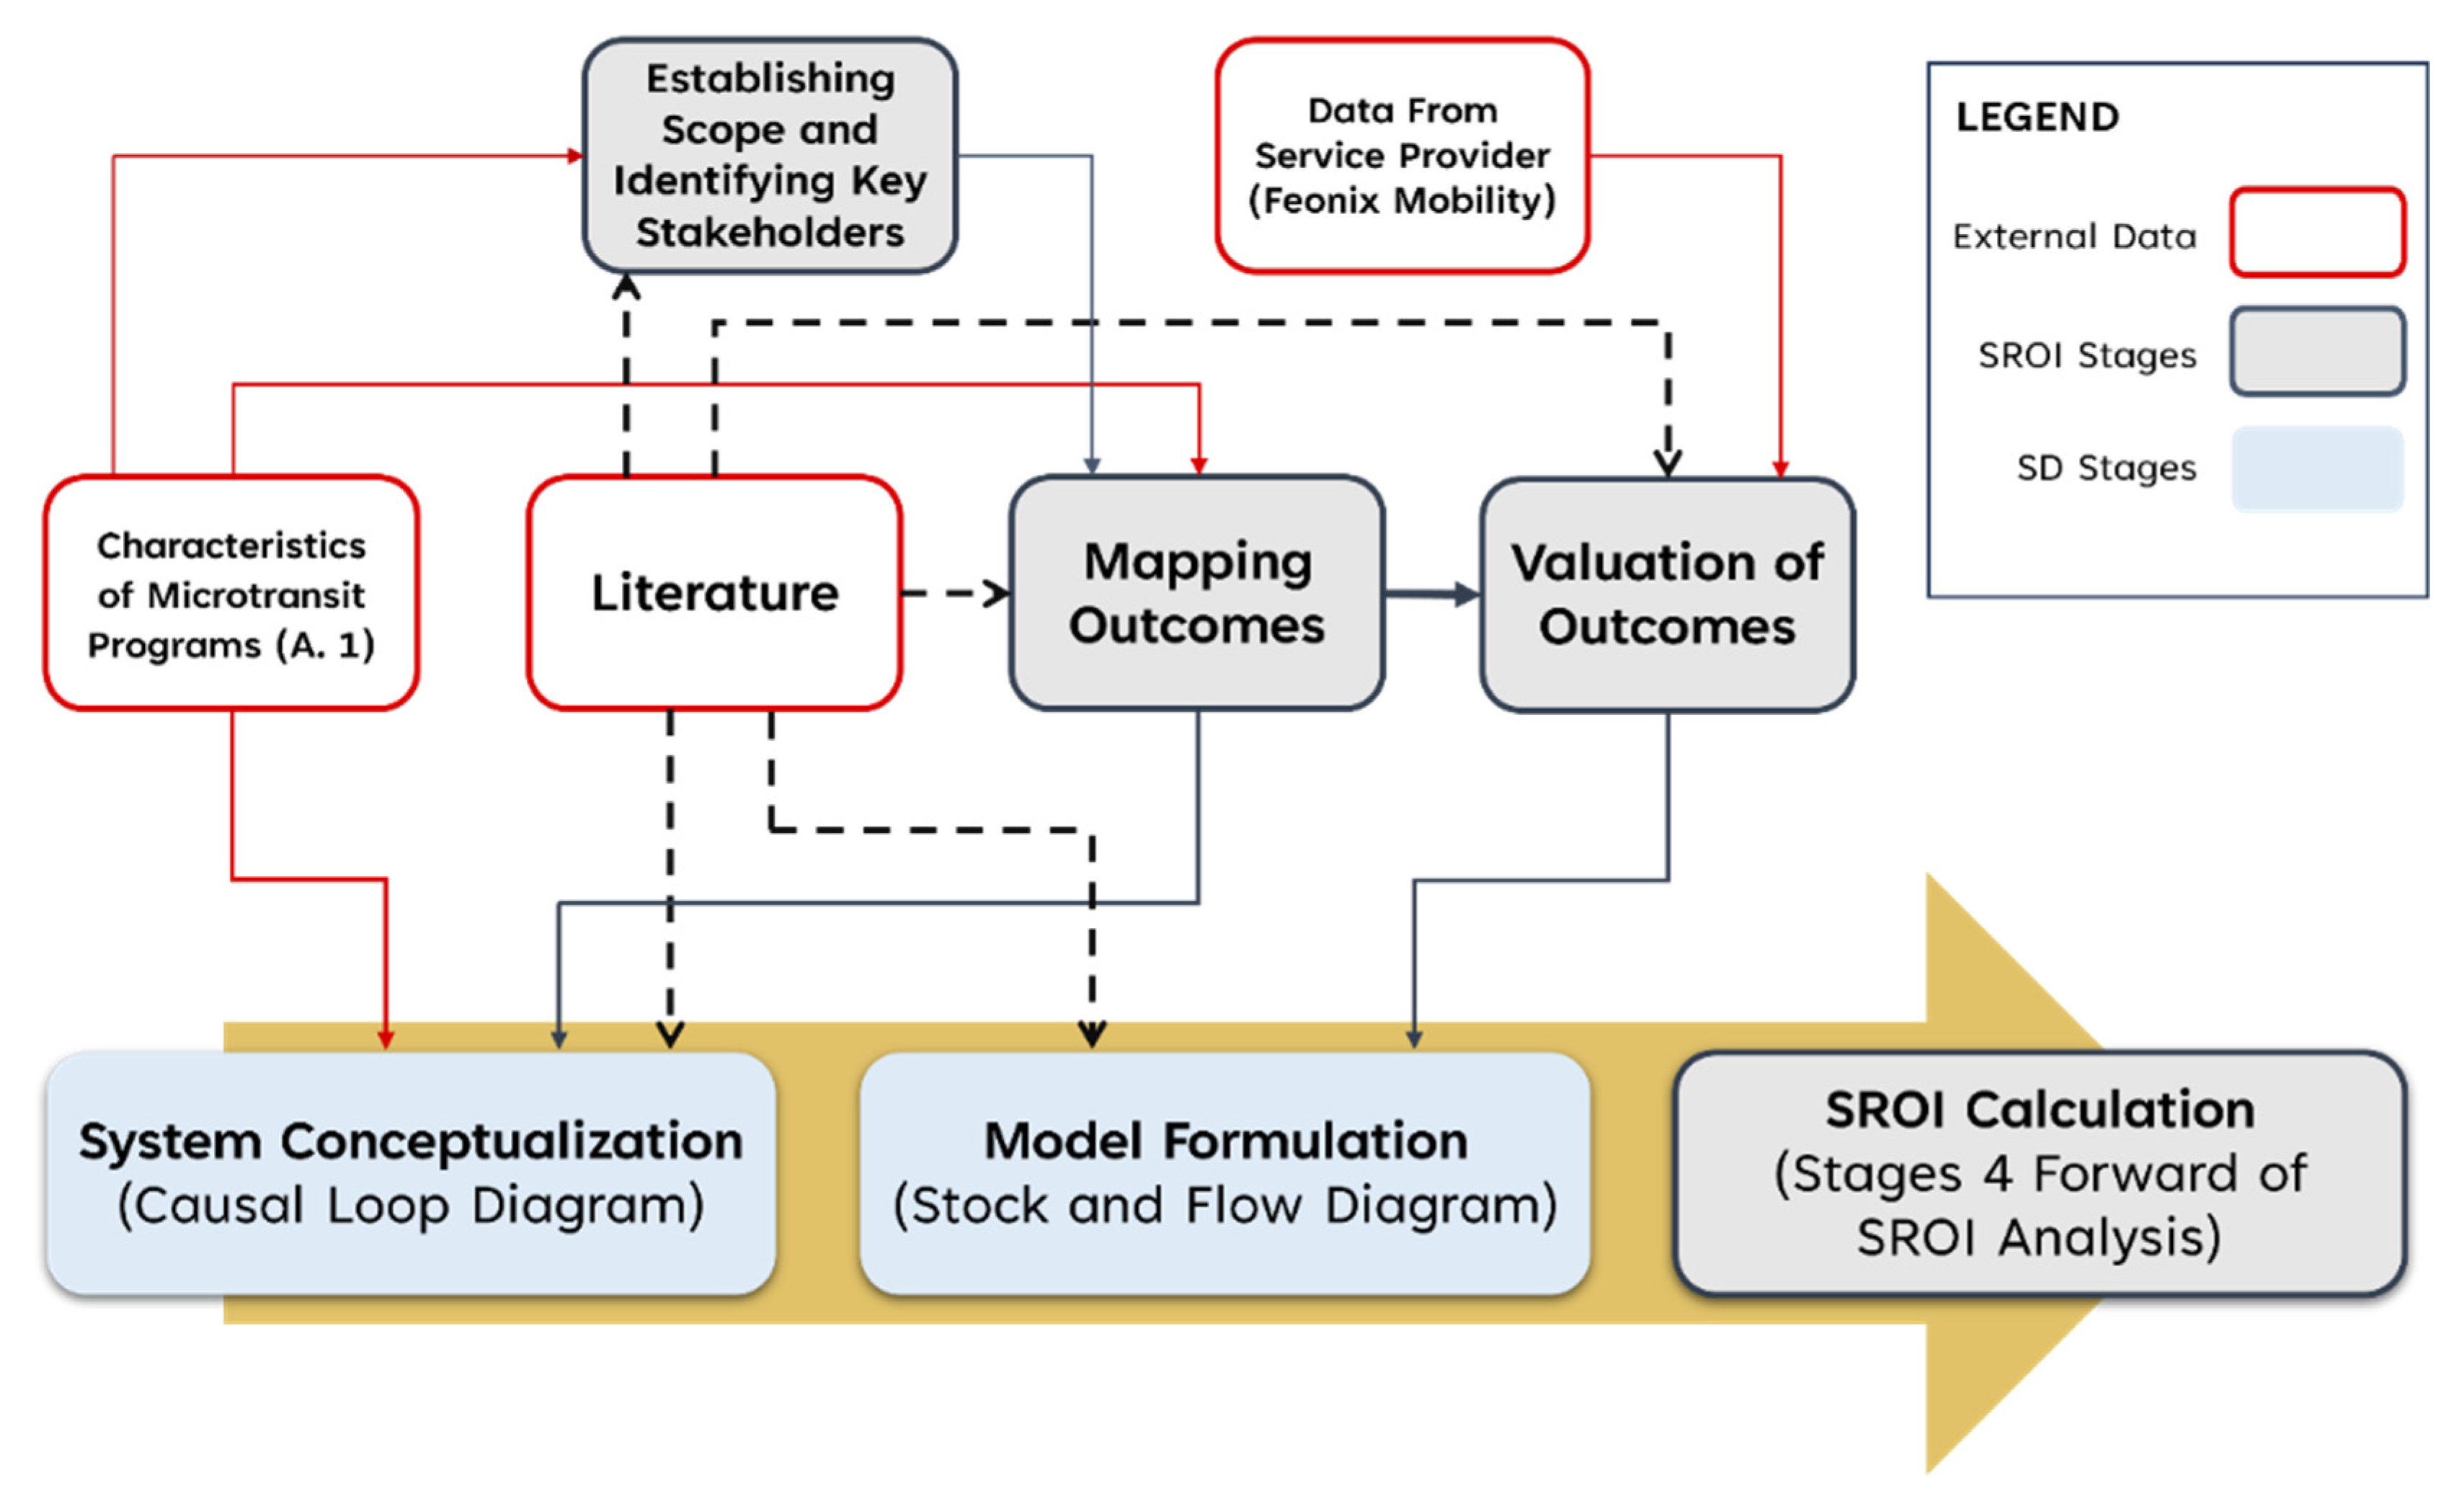
3.2. SROISD Framework

Social Return on Investment System Dynamics (SROISD), introduced in this paper, is a model that calculates SROI through an SD structure. As the name implies, SROISD integrates SROI steps with stages of SD and, informed by external data, allows interested parties to calculate SROI. Figure 1 presents the SROISD framework and steps used to calculate SROI. As shown in Figure 1, characteristics of microtransit programs, data from service provider teams, and literature will be used to establish scope and identify key stakeholders (SROI stage 1), map outcomes (SROI stage 2), and value outcomes (SROI stage 3). The results of these three stages, along with external data, will be used to develop two main stages of the SD model: system conceptualization, or causal loop diagrams (CLD), and model formulation, or stock and flow diagrams (SFD).
The primary objective of CLDs is to visually represent the key entities that influence the interventions being modeled and the beneficiaries of the system. On the other hand, SFDs aim to quantify these entities by assigning values or equations to the variables within the CLD. This allows for a computational simulation of the system, enabling a quantitative understanding of how it evolves over time. The simulation enables us to predict the social benefits and costs of the program, thereby allowing us to calculate SROI ratios for a specific time frame, as represented by the SROI calculation in Figure 1. Based on the categories of dynamic problems introduced by Hovmand [51], the problem modeled in this case analysis is a dynamic learning problem. In this learning problem, we aim to identify factors, such as microtransit program characteristics, stakeholder needs, geographic context, and service provider constraints, that contribute to fluctuations in the SROI ratio.
One of the needs of any pilot program is to demonstrate long-term sustainability and financial viability. This case study analysis applying the SROISD framework demonstrates how to dynamically capture returns from investment in such pilot programs, ultimately supporting future program decisions. Through this model, we can assess various scenarios and policy implications, evaluating their impact on the social return of the microtransit program. The sections that follow the SROISD framework are described in more detail, specifically using the Holmes County microtransit pilot program as a case example of the framework’s application.

4. System Conceptualization

According to the SROISD framework (Figure 1), the first stage of the model is system conceptualization. System conceptualization is informed by many steps, including establishing the scope, identifying key stakeholders, and mapping outcomes. External data from the literature and other key partners, such as transportation service providers, may also be relevant. The main output from system conceptualization is a causal loop diagram.

4.1. Defining Scope and Stakeholders

The first step of the SROISD framework is defining the analysis scope and identifying key stakeholders. The scope of this study is focused on assessing the social value derived from an on-demand microtransit program implemented to address transportation-related barriers to SDOH in Holmes County. Stakeholders were thus defined as riders (i.e., the target population), healthcare providers, transportation service providers and their staff, volunteers (i.e., drivers), and the Holmes County community at large.

4.2. Mapping Social Outcomes

This step maps the outcomes of the microtransit program. In this project, outcomes are mapped relative to three SDOH areas: (1) accessing healthcare, (2) accessing employment, and (3) social participation. For example, in the healthcare access category, on-demand microtransit has the potential to decrease the overall rate of missed medical appointments within a community [16]. Reduced rates of missed medical appointments can enhance health status, which in turn can reduce the frequency of emergency department (ED) visits [52,53,54,55]. Consequently, an increase in the number of medical visits and a decrease in missed appointments can yield financial benefits for healthcare providers. The microtransit intervention also has the potential to create social benefits related to job access. Outcomes include expanded access to new job opportunities as well as increased accessibility to jobs with varied working hours (i.e., work shifts), for example, early AM and late PM hours. Additionally, previous studies highlight the pivotal role that transportation plays in fostering social inclusion among individuals [56,57]. In areas characterized by limited car ownership, such as Holmes County, having access to a reliable transportation system can significantly enhance social inclusion. Change in social isolation is thus mapped as an outcome in this study. Consequently, this study identifies the following social outcomes of the microtransit program: decreased ED visits, increased medical appointments at healthcare centers, income gains, enhanced social inclusion, and improved mental health. These outcomes will be integrated into the CLD to show connections and feedback between key outcomes and system variables such as program characteristics and stakeholder needs. Outcomes mapped and monetary valuations assigned are by no means intended to be exhaustive but instead illustrative of the monetary valuations and variables included in this specific scenario development.

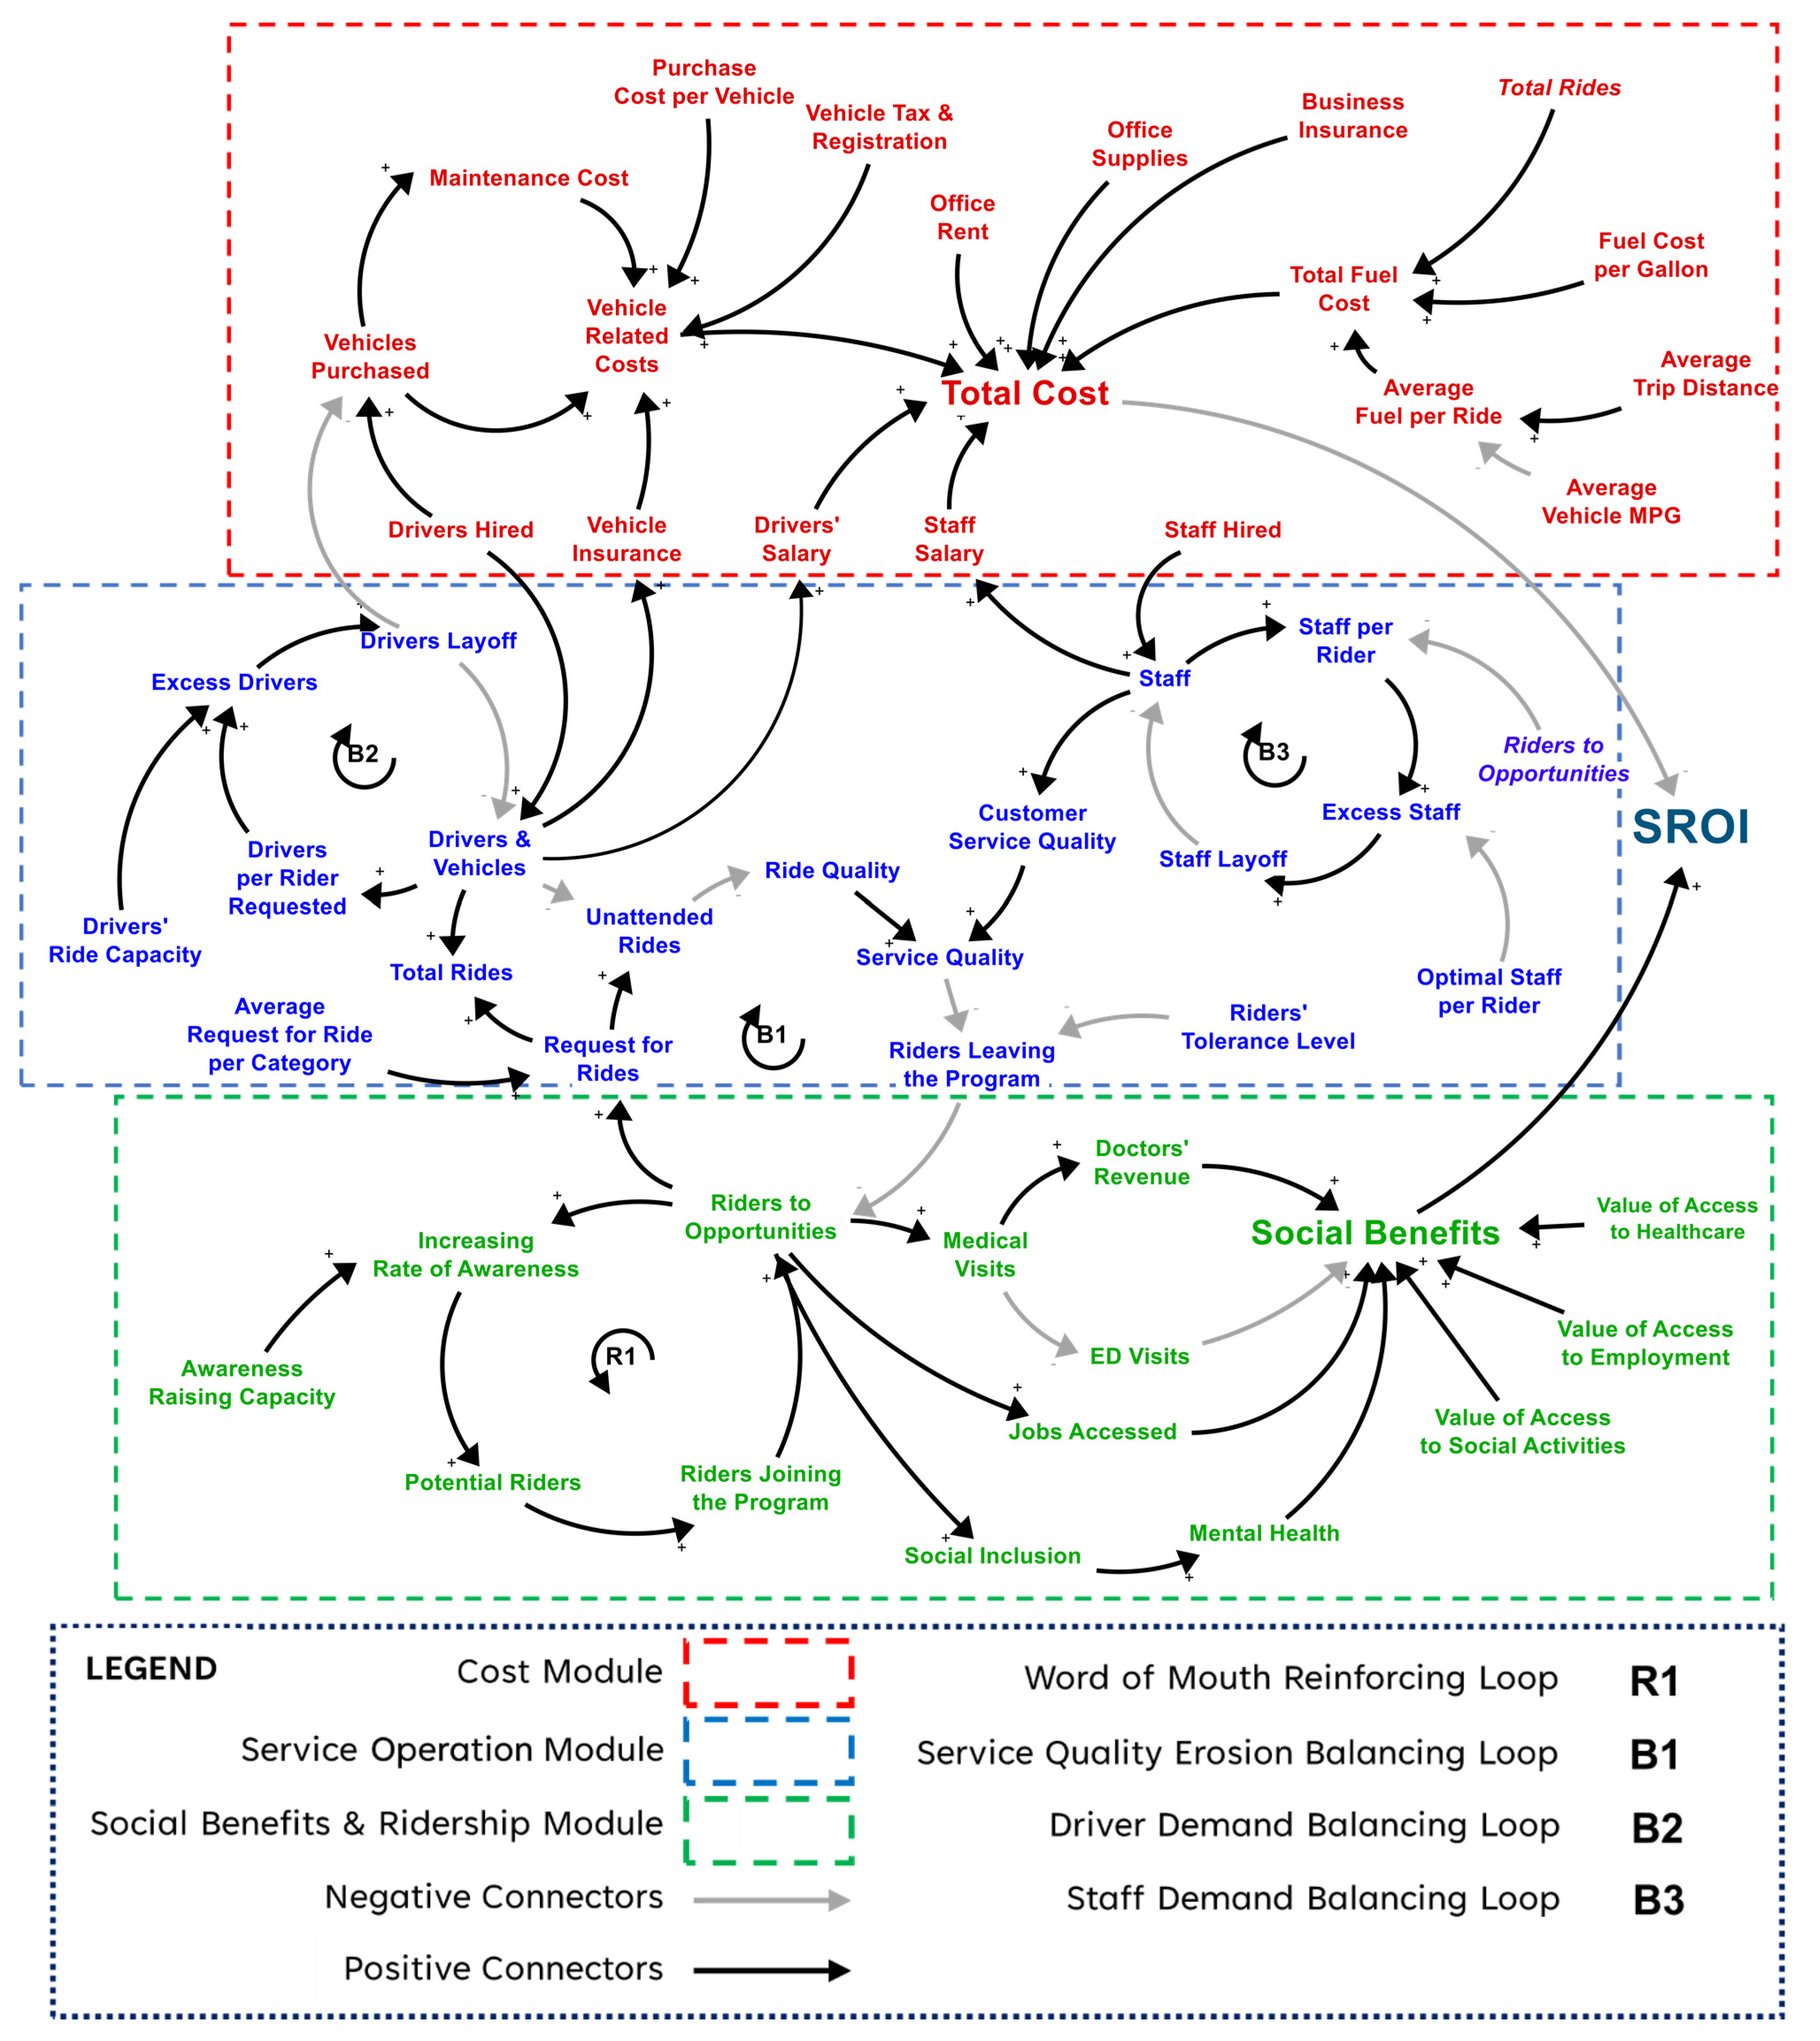
4.3. Causal Loop Diagram

After problem identification, the first step of every SD analysis involves formulating dynamic hypotheses, which utilize qualitative methods to create CLDs [58]. This step integrates mapped outcomes into the model as variables, along with other relevant factors specific to the problem, to create a CLD that conceptualizes the system as shown in the SROISD model (Figure 1). A CLD is comprised of two main components: variables and connectors. Connectors represent direct relationships between variables. Additionally, polarity (positive or negative) is used to signify the effect of one variable on another. A positive connector indicates that the connected variables change in the same direction, while a negative connector indicates the opposite. Frequently observed within a CLD are reinforcing loops, denoted as (R), and balancing loops, denoted as (B). Balancing and reinforcing loops, as their names suggest, are used to simultaneously erode the system and grow the system, thus preventing infinite growth.
Transportation systems consist of many variables and parameters, leading to the creation of an SFD that becomes excessively large. In order to tackle this challenge, Ercan et al. [59] propose the utilization of smaller subdivisions, known as subsections, within the overall model. Figure 2 shows the CLD, which is divided into three modules or subsections: Social Benefits, Costs, and Service Operations. The CLD also shows the relationship between these three modules and the target variable, SROI, which is distinct from these modules and is calculated by dividing social benefits by the program’s costs at each instance.

4.3.1. Social Benefits Module
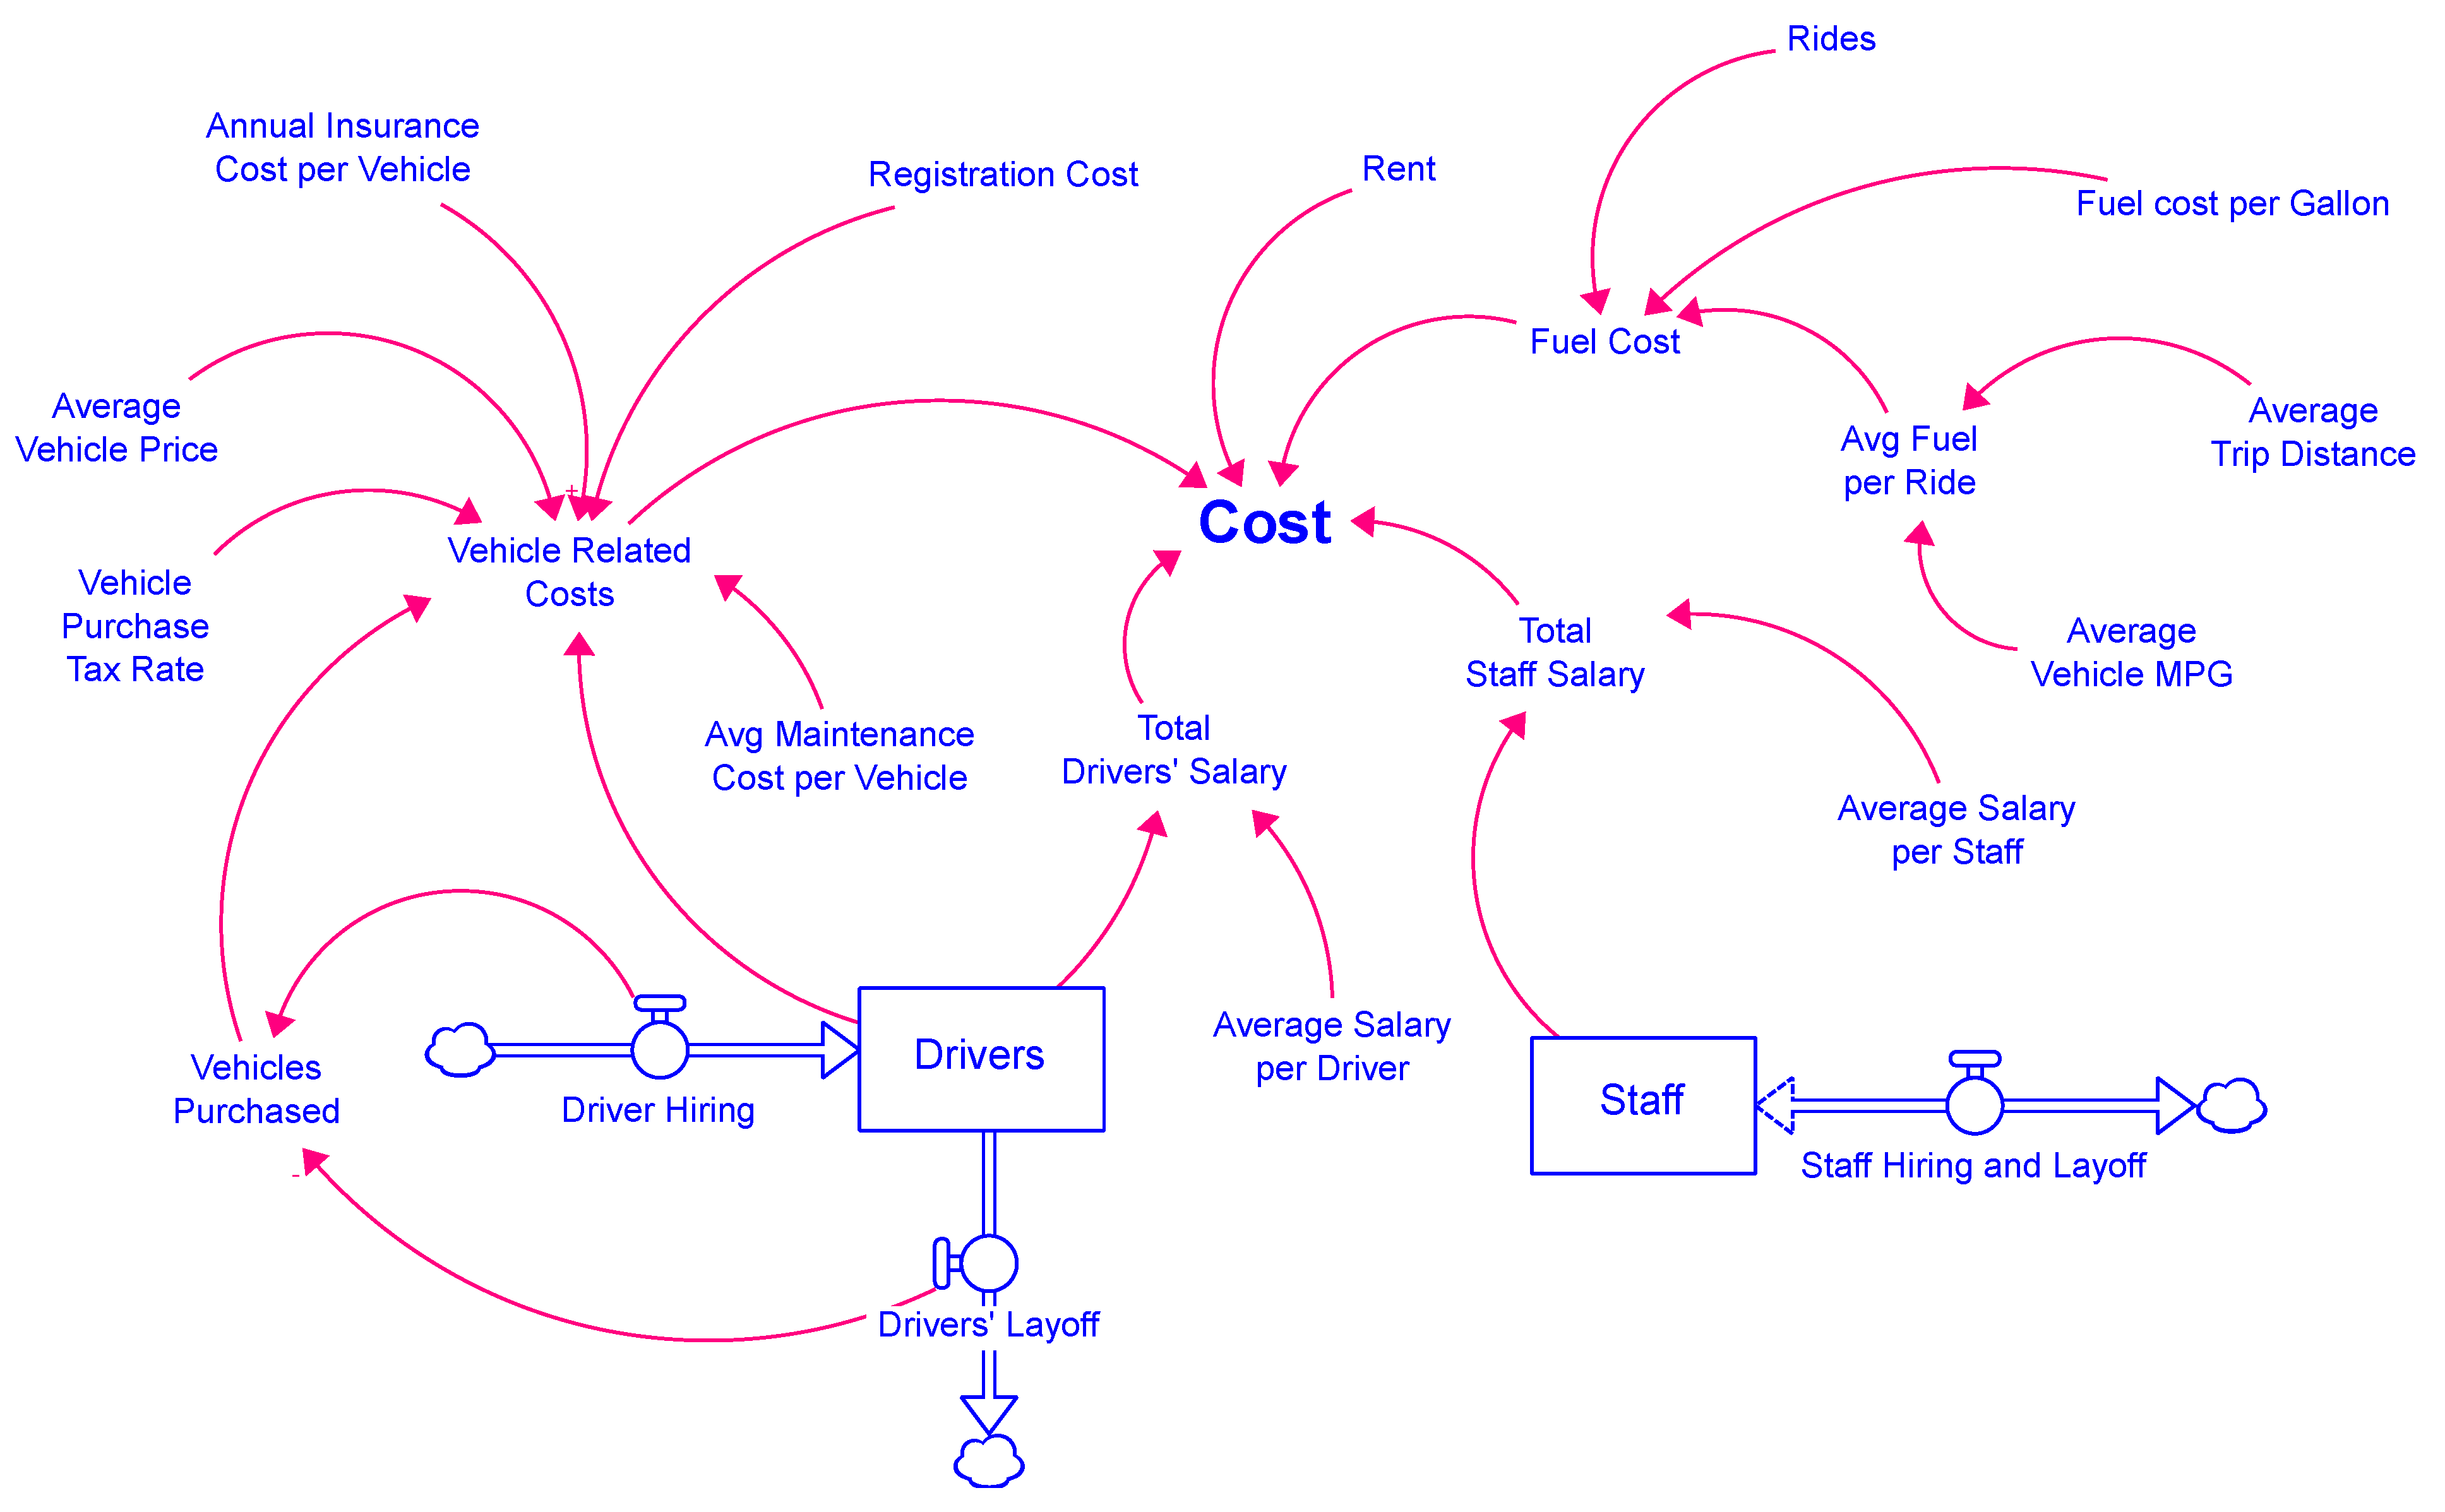
The social benefits module (i.e., the bottom module) consists of all the variables that contribute to benefits gained by stakeholders. The variables on the right side of the module were identified in the mapping outcomes step discussed in Section 4.2. For example, an increased number of “riders to opportunities” increases “medical visits”, which decreases “ED visits”, which increases “social benefits” gained. These benefits can be broadly categorized into three categories: access to healthcare, access to employment, and access to social activities. Late4 in the model formulation stage, proxy values will be assigned to each social benefit category.
On the left side of the social benefits module (R1), which is the word-of-mouth reinforcing loop, are the dynamics that lead to a change in the number of riders (i.e., target population) within the system. This loop is powered by word-of-mouth, or the passing of information about the pilot program and its available services from person to person. When the microtransit program first launches, only a small proportion of individuals are aware of the program, while many individuals who need the service are unaware of its existence. Those who are aware increase awareness by telling uninformed individuals about the program. People who become aware become potential riders, and ultimately some join the program, and the number of users increases. In the R1 loop, the ‘awareness-raising capacity’ represents the maximum number of individuals that can be reached by a single person. As information spreads about the program, there is ‘increasing awareness’ which creates ‘potential riders,’ leading to ‘riders joining the program,’ which increases the number of riders accessing opportunities as shown in Figure 2. These riders then create and receive social benefits, as further identified in the module.

4.3.2. Cost Module

The cost module consists of variables contributing to the total monetary costs of operating the microtransit service; these include vehicle-related costs such as vehicle purchase expenses, vehicle insurance, maintenance, registration, and annual taxes; office-related costs such as building rent and office supplies; salary-related costs such as driver and staff salaries; and fuel-related costs. Many of these costs are dynamic, meaning that they change based on patterns of related variables. For example, fuel costs depend on the quantity and average distance of rides, the miles per gallon (MPG) rating of vehicles, and the fuel price per gallon, while driver and staff costs are calculated based on the number of people hired and salaries. The costs included in the cost module were identified from the literature and based on data provided to the research team by the transportation provider operating the microtransit service. As shown in Figure 2, the total value of the model is captured in terms of total cost.

4.3.3. Service Operation Module

The final module of the CLD is the service operation module. The service operation module consists of a service quality erosion balancing loop, a driver demand balancing loop, and a staff demand balancing loop. Service quality, which is the target variable of the module, contributes directly to riders leaving the program and may impact riders joining the program. The microtransit program’s ability to offer rides is limited and reliant on the availability of drivers and cars. If ride requests surpass the program’s capacity, some requests go unattended, resulting in decreased ride quality and overall reduced service quality. Likewise, if the number of users exceeds the capacity of the customer service staff, unanswered calls and long wait times for feedback decrease customer service quality. Ultimately, a decrease in service quality, encompassing both ride quality and customer service quality, and driver capacity, causes some users to exit the program.
All three balancing loops of the CLD are located in the service operation module. B1 is the service quality erosion loop, showing that as more users join the program, service quality is likely to be lowered, leading some users to leave the program. B2 and B3 loops, related to driver and staff demand, work similarly. If driver supply exceeds demand, some drivers are let go for balance. B3 mirrors this for staff. Decisions about staff and driver surplus are measured using an optimal rider-staff ratio and a driver capacity measure. A higher staff-to-rider ratio results in more excess staff, and increased driver capacity results in more excess drivers. Finally, the rider tolerance variable informs the acceptance of service quality issues. At a 100% tolerance level, no one leaves the system, even with low service quality. Whereas, with a 10% tolerance level, small changes in service quality can lead to riders exiting the program.
Finally, it should be noted that the CLD model designed for microtransit programs can be adapted to a larger public transit system, such as trains and large buses with fixed routes. The flexible nature of the model can support several adjustments to vehicle types, workforce categories, and broader benefit and cost parameters. For example, large public transit systems encompass various vehicle types and require an expanded workforce, including drivers, maintenance crews, cleaning staff, and more. The social benefits module can also be broadened to address the larger ridership and diverse service areas related to these systems. Additionally, the cost module can consider the increased expenses associated with maintaining a more extensive and varied fleet of vehicles. Infrastructure maintenance and a more diverse workforce, encompassing driver salaries, maintenance personnel, and cleaning staff, can also be integrated into a model for larger transit systems. In the service operation module, balancing loops can manage numerous drivers, staff, and service quality factors on a larger scale, and parameters can be adapted to reflect the complexities and dynamics of a large public transit system. The model can thus be expanded and adjusted to align with the diverse nature and scope of these comprehensive transportation networks.

5. Model Formulation

The model formulation uses SFDs to simulate changes in the system. As shown in Figure 1, the model formulation stage of SD is informed by the SROI step “valuation of outcomes,” which relies heavily on the literature to define proxy values that monetize outcomes and, where available, also relies on real-world data, in this case provided by the transportation service provider.

5.1. Valuation of Outcomes

The primary focus of the outcome valuation step is assigning monetary values to the benefit categories identified in the Social Benefits module of Figure 2, including access to healthcare, access to employment, and access to social activities.
The SROISD framework assigns proxy values either through direct valuation or replacement valuation [32]. Direct valuation calculates the tangible benefits stakeholders would gain from an outcome, while replacement valuation assesses the costs that would be incurred without the outcome. For example, when assessing the benefit of transportation access to employment, direct valuation quantifies the total increase in income resulting from securing employment. In contrast, replacement valuation for a funded mental health improvement activity estimates the cost of mental health classes or therapy expenses that would result if mental health services were not covered through a proposed intervention. Proxy values are used in the stock and flow simulation of the social benefits module (see Figure 2) to forecast total annual social benefits gained. Table 2 shows the proxy values assigned to social benefits categories (i.e., access to healthcare, access to employment, and access to social activities). Table 2 shows the variables related to each social benefit category, measures of effectiveness (mostly identified in the literature), valuation methods used, and annual and total proxy values in dollars.
For example, the healthcare access social benefit category is represented by variables including decreased ED visits and increased medical visits, as shown in Figure 2. Based on the literature, an appropriate measure of effectiveness for medical visits is the average cost of a doctor’s appointment. This benefit accrues in the system because medical centers, which have been identified as system stakeholders, benefit from the increased number of rides to healthcare in terms of payments made to them. The assumption is that medical centers see an increased number of visits of 1/month or 12/year at an average cost of $450 per visit for a total annual valuation of $5400, as shown in Table 2.
The other access to healthcare variable captured in Table 2 is the number of ED visits avoided per person. Existing literature on the impacts of preventative care shows that, on average, primary care visits can reduce ED visits by approximately 0.34 visits per year [55,60,61]. As such, using replacement valuation, the measure of effectiveness is formulated as the total number of ED visits avoided per year (0.34) multiplied by the average cost of an ED visit, subtracting the cost of monthly primary care appointments in a year.
In the employment access category, direct valuation is used to monetize income gained using data for the average salary in Holmes County, which is estimated at $40,701. This benefit is gained when a person goes to work 260 days in a year (i.e., total number of working days per year [62]). To calculate the benefit per ride, $40,701 is divided by 520, accounting for total rides to and from employment per person in a year, which is calculated at $78.27. Similarly, for healthcare access and social inclusion benefits, the annual proxy values are divided by 24 (monthly rides to and from healthcare) and 156 (seeing friends or relatives once or twice a month [63]), as detailed in Table 2.
The output of the model formulation is stock and flow diagrams. These are discussed in more detail in the section that follows.
Table 2. Proxy Values of Outcomes.
Social Benefit CategoryVariablesMeasure of Effectiveness Valuation MethodAnnual Proxy ValueTotal Proxy Value Per RideSource
Healthcare access
Decreased ER visits.
Decreased ambulance use
[((average cost of ED visits + average cost of ambulance rides) × 0.34) − (average cost of medical appointments × 12)]/24Replacement valuation530 + 980 − (12 × 24.04 2) = $2255625/24 = $234.375[64,65,66,67]
Increased medical visits to healthcare centersAverage cost of doctor’s appointments × 12Direct valuation450 × 12 = $5400[64,65,66,67]
Employment accessIncome gainedAverage state salaryDirect valuation$40,70140,701/520 = $78.27[45,68]
Social inclusionSocial participationValue of seeing friends and relatives once or twice a week − value of seeing friends and relatives once or twice a monthReplacement valuation£12,000 in 2003; after exchange to USD and adjusted for inflation 1: $24,82426,557/156 = $170.23[32,63,69]
Improved mental healthCost of Medicare part b deductible + (average cost therapy sessions Mississippi × 12 × co pay rate of therapy visits) + (cost of 12 months antidepressants × co pay rate of drugs)Replacement valuation$1733[32,70,71,72,73]
1 Inflation is calculated based on [74] through www.measuringworth.com/exchange/. (accessed on 13 November 2022). 2 Calculations are based on values from the State of Mississippi.

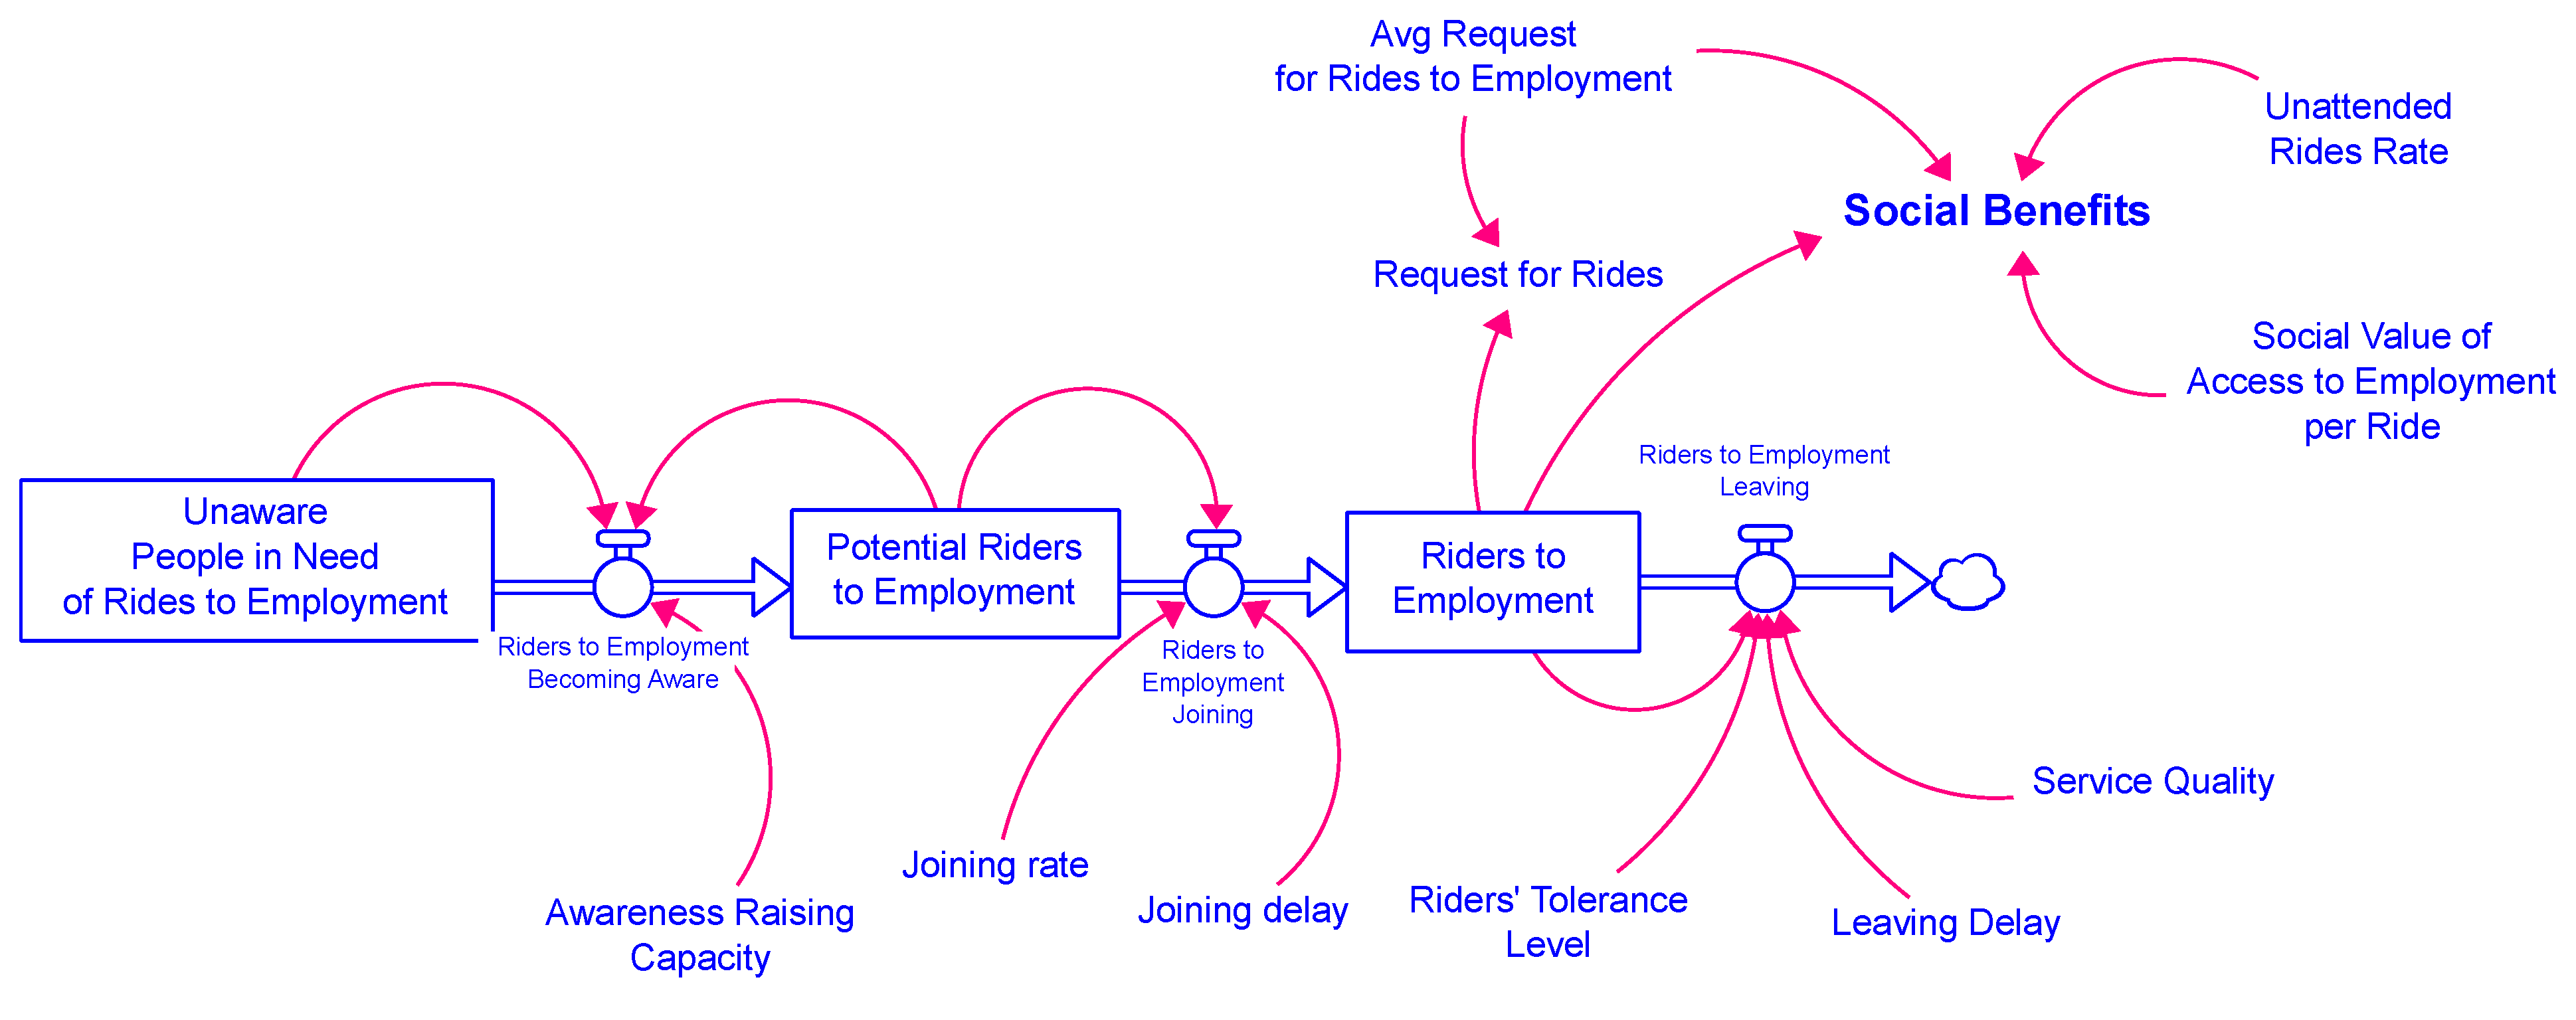
5.2. Stock and Flow Diagrams

This step uses proxy values to forecast total annual social benefits using stock and flow diagrams. As was conducted in the CLDs, the SFD is divided into three subsections or modules (see Figure 2). For simplicity, the SFD for the social benefits category “access to employment” is discussed.
SFDs show how quantities accumulate (stocks) and change (flows) over time in a system. While CLDs conceptualize the system, SFDs convert entities of the system into constants and variables, assign values to these variables, use equations to define relationships, simulate the system, and allow for changes over time to be observed.

5.2.1. Social Benefits Module SFD

Figure 3 illustrates the SFD for the “employment” social benefits module. Three key stocks are shown: “Unaware People in Need of Rides”, “Potential Riders to Employment”, and “Riders to Employment”. The diagram encompasses three flows: “Riders to Employment Becoming Aware”, “Riders to Employment Joining”, and “Riders to Employment Leaving”. A comprehensive elaboration on all stocks, flows, and associated variables within the diagram is presented as follows.
As shown in Figure 3, the social benefits variable is a function of the “unattended rides rate”, “requests for rides to employment”, and the “social benefit gained per ride to employment” variables. Social benefits are calculated using the following equation:
S B = ( 1 λ ) i = 1 3 R i V i   n ¯ i
where SB is social benefits, λ is unattended rides rate, which is between 0 and 1, R is quantity of riders to opportunities, V is proxy value of access to opportunities, n ¯ is average number of requests for rides to opportunities per person, i = 1 represents employment; i = 2 is healthcare; and i = 3 is social activities. The proxy value, or monetized social benefit, of access to employment is identified in Table 2. The components of the social benefits SFD are discussed in more detail below.

Unattended Rides Rate

In Figure 3, The “unattended rides rate” represents the number of ride requests that go unfulfilled due to limitations in driver capacity. The unattended rides rate ensures that benefits accrue based on completed rides, not those that drivers fail to complete. The summation of benefits is thus reduced by this factor, as the appropriate reason for multiplying the summary of benefits by (1 − λ) is that social benefits will only be obtained from rides completed and not those that are unattended. The following equation is used to calculate the unattended ride rate (λ):
λ = U R e q
where λ is the unattended ride rate, U is the number of unattended rides, and Req is the total number of requests for rides per year.
Methods for calculating unattended rides (U) and total requests for rides (Req) are described in the service operations module below.

Number of Riders

The next step includes determining the number of riders across three ride categories (see Figure 3). The process of individuals becoming users of the microtransit program does not happen instantly but takes some time. Therefore, in the SFD, three stocks are utilized to represent this process and account for the associated delays. Initially, individuals are in need of rides but are unaware of the program’s existence (stock 1: Unaware people in need of rides to employment). Then, they become acquainted with the program through word of mouth and transform into potential riders (stock 2: Potential riders to employment). Finally, they make a decision on whether or not to join the program and become riders (stock 3: Riders to employment), as shown in Figure 3.

Individuals in Need of Rides

The next step is to determine the number of riders in three categories. The process involves a gradual transition of persons who need rides, becoming aware of the microtransit program through word of mouth, and finally deciding to join as riders. Three stocks represent this process, with associated delays.
The first step uses census data to identify the total number of individuals in urgent need of transportation services across three ride categories. Unemployed individuals aged 16–65 without ambulatory difficulties living in zero-vehicle households and employed people who work beyond walking distance from their residence were considered in need of rides to employment [75,76,77,78]. To determine the number of individuals in need of rides to healthcare, this paper considers those in zero-vehicle households, aged above 65, and those between 16 and 65 with a disability [76,79]. Furthermore, residents who live in zero-vehicle households can benefit greatly from the social cohesion provided by the microtransit program [79]. Notably, populations from zero-vehicle households reflect a conservative estimate of microtransit program use, potentially leading to increased social benefits.

The Word-of-Mouth Process

The word-of-mouth process involves potential riders (individuals aware of the program) informing uninformed individuals about it (see Figure 3). It is important to note that a person can only inform those whom they interact with. McCormick et al., [80,81], found that, on average, each person interacts with 600 individuals. As such, this study estimates “Awareness Raising Capacity” at 3.6%, which is equal to 600 people in Holmes County. After becoming aware of the program, potential riders will decide whether or not to join.

Decision to Join or Leave the Program

The joining rate represents the proportion of potential riders who choose to participate. In Holmes County, where transportation options are limited, it is assumed that half of all potential riders will join the program within an average delay of three months. Notably, different values for the above variables were tested during the sensitivity analysis to assess their impact on the system’s performance and to check the sensitivity of the model to assumptions, as described in the sensitivity analysis section below.
The service quality variable, assessed within the service module, plays a crucial role in influencing the number of users who decide to leave the service. When there is a decline in service quality, individuals are less likely to stay in the program, based on their tolerance level. Both service quality and rider tolerance level are measured on a scale ranging from 0 to 1. Moreover, it is assumed that a continuous period of 9 months with declining service quality is required for individuals to decide about leaving the program. The equation used to determine riders’ departure from the service is as follows:
R D = R i ( 1 T L ) ( 1 Q ) L D
where RD is riders’ departure, R is number of riders, LD is leaving delay, TL is riders’ tolerance level, and Q is service quality.
According to the equation, a tolerance level of 1 (the maximum tolerance) results in 0 riders leaving. Other factors like relocation or job loss are not considered in this equation, which focuses solely on riders’ decisions based on service quality.
Finally, the request for rides variable is calculated using the following equation:
R e q = i = 1 3 R i n ¯ i
where Req is request for rides, R is number of riders, and n ¯ is average number of requests for rides to opportunities per person.
Equation (3) above states that the total number of requests for rides that are submitted to the program each year is calculated by multiplying the number of riders within each distinct category—namely healthcare; employment; and social participation—by the corresponding average request count for that specific category.

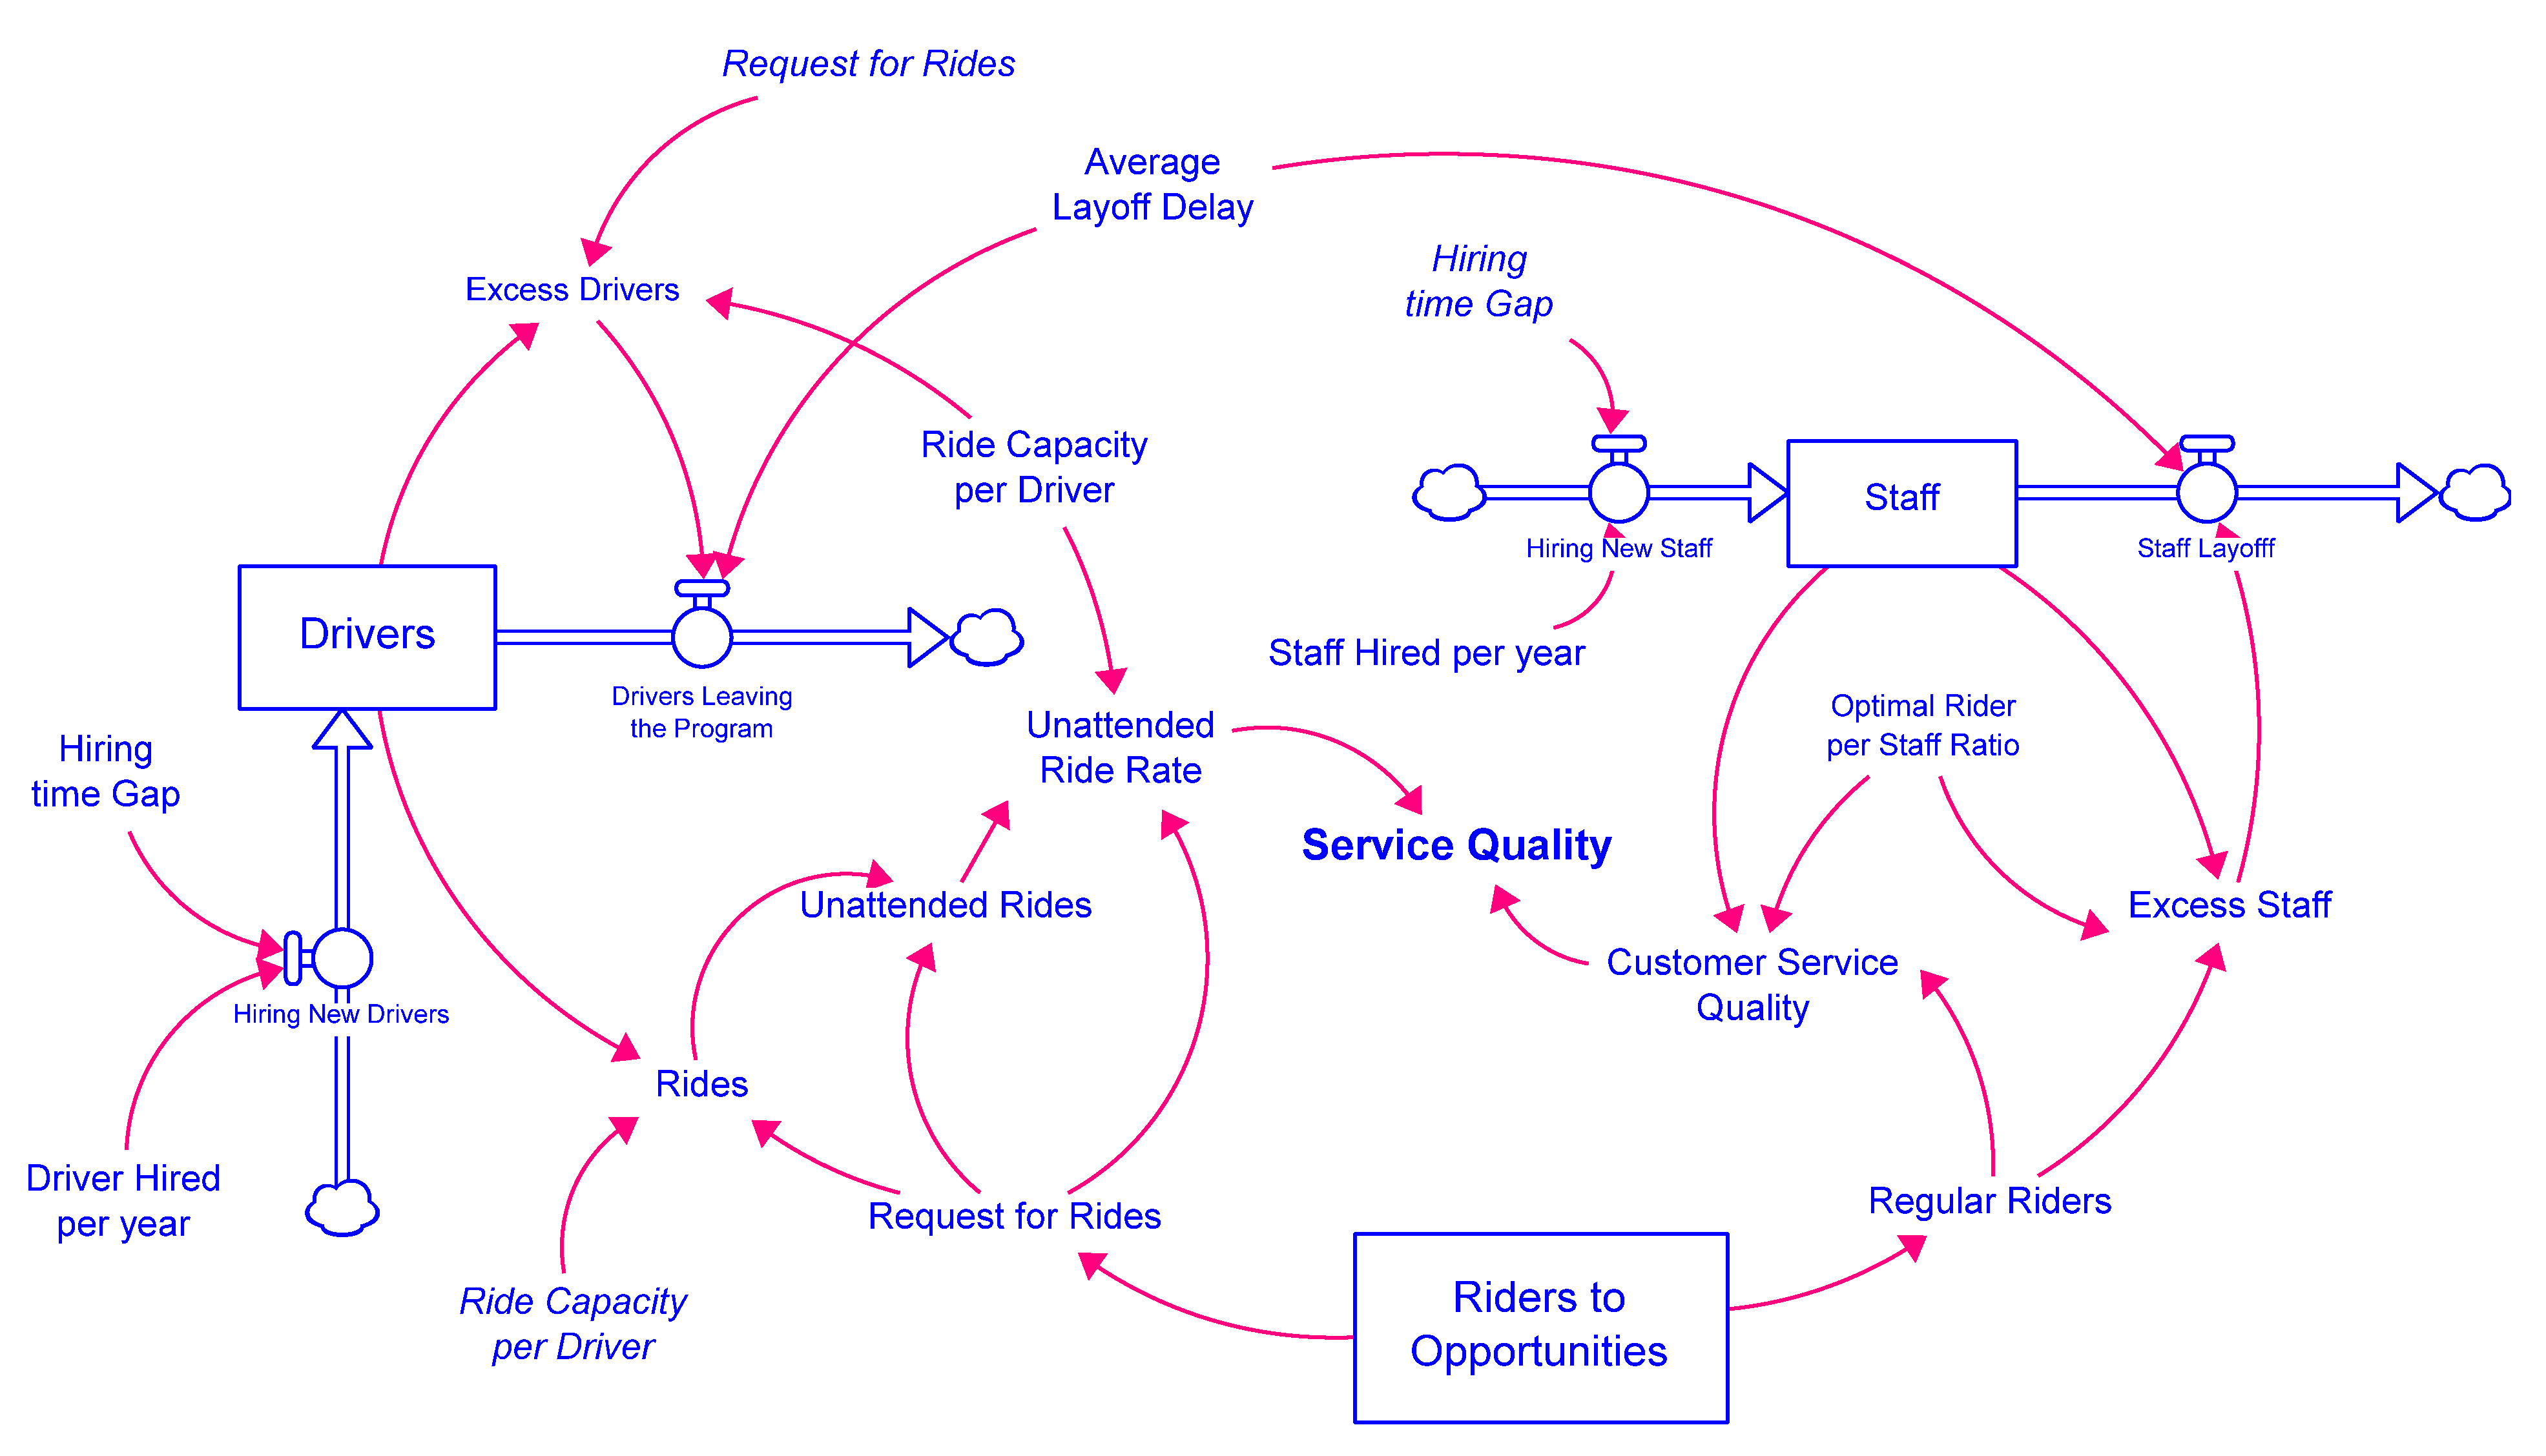
5.2.2. Service Operations Module SFD

Figure 4 shows the SFD for the service operations module. The main stocks of this SFD are “Drivers”, which represents the number of drivers in the program, and “Staff”, which shows the number of customer service staff. The 4 flows are “Hiring New Drivers”, “Drivers Leaving the Program”, “Hiring New Staff”, and “Staff Layoff”.
The target variable of the module is service quality, combining the unattended ride rate and customer service quality. Drivers in the program are estimated to have an average ride capacity of 2600 per year, or approximately 10 rides per day across 260 working days. Hence, certain ride requests go unattended as a result of driver ride capacity reaching its limit. Calculating the number of these unattended rides necessitates the application of a non-linear function. To accomplish this, the IF, THEN, and ELSE functions within Stella were used, as represented by the piecewise function below. The approach for computing unattended rides is outlined in Equation (5):
f ( U ) = R e q ( D × C ) ,   i f   R e q D × C > 1 0 , i f   R e q D × C 1
where U is unattended rides, D is the number of drivers, and C is the ride capacity per driver.
Conversely, the number of rides can be calculated simply by subtracting unattended rides from requests for rides.
According to the B2 loop in the CLD (Figure 2), the program keeps the number of drivers at an optimum level to minimize the cost. Therefore, it is needed first to find the number of excess drivers using the following piecewise function:
f ( S ) = S t a f f R e g O R   , i f   S t a f f > R e g O R 0 , i f   S t a f f     R e g O R
where S is excess staff, Reg is regular riders, and OR is optimal rider per staff. Staff leaving the program is also calculated by multiplying excess staff by the average layoff delay.
The variable customer service quality, which is between 0 and 1, is calculated using the following:
f ( C Q ) = 1 , i f   S t a f f × O R R e g   1 S t a f f × O R R e g , i f   S t a f f × O R R e g < 1
Finally, the service quality, which is the average of attended rides and customer service quality, is calculated as follows:
Q = C Q + ( 1 λ ) 2

5.2.3. Cost Module SFD
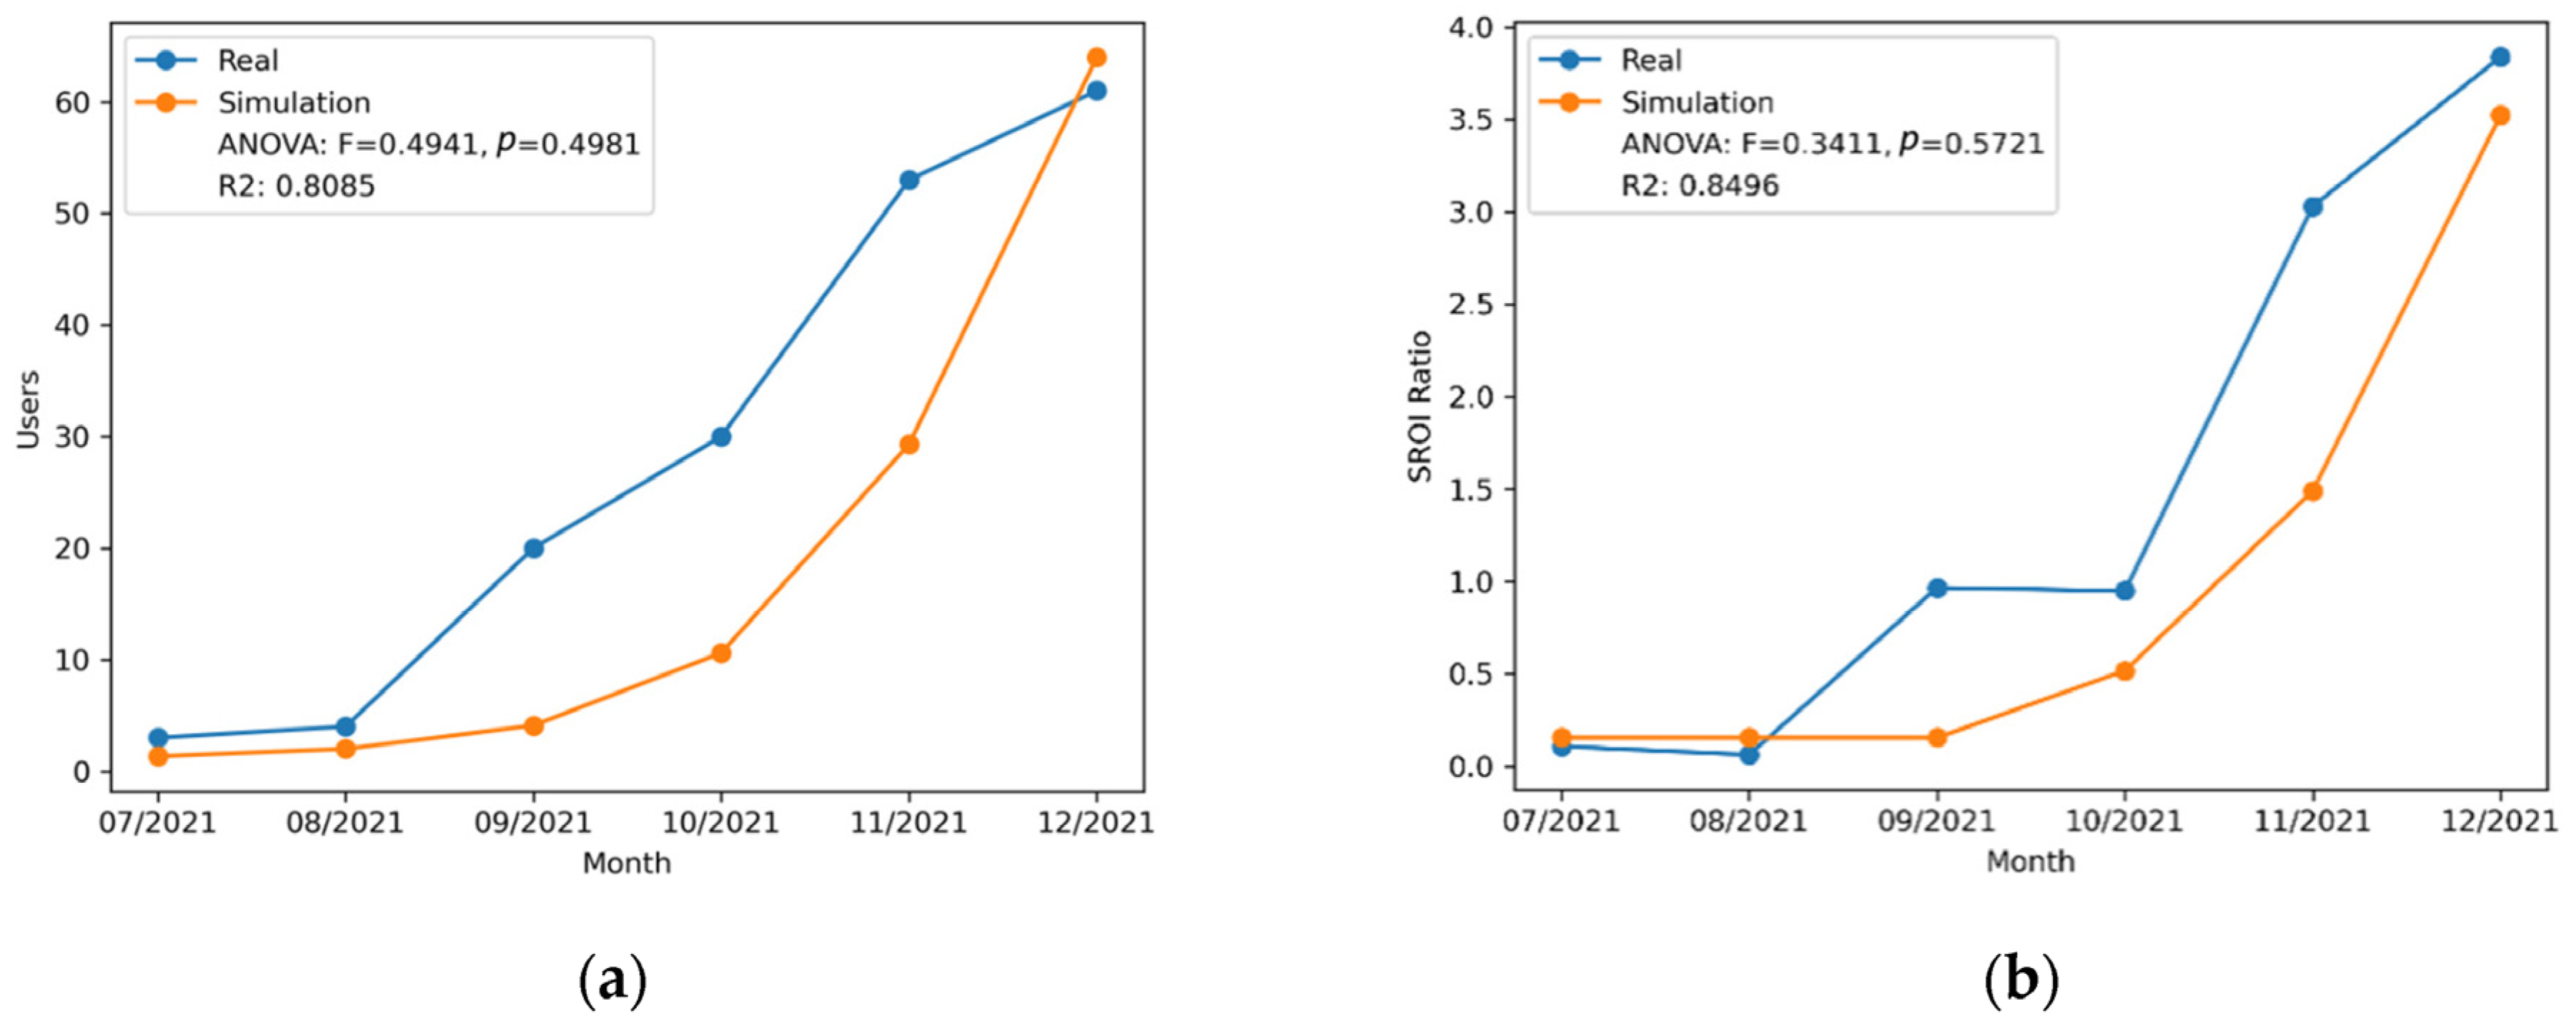
Figure 5 illustrates the SFD for the cost module. The stocks and flows in this SFD are explained in Service Operations Module SFD (Section 5.2.2).
Vehicle-related costs are a major expense category for microtransit. In this model, vehicle-related costs are calculated as follows, and all the variables are explained in detail in the subsequent section (fuel costs are addressed separately):
Vehicle   related   cos ts = ( Vehicle   Purchased ×   ( 1 + Tax ) ×   Price ) + Cars × ( Insurance + Maintenance + Registration )
In this case, it is assumed that the microtransit program purchases one vehicle per driver hired, unless there are spare vehicles available. Spare vehicles become available once a driver leaves the program. Therefore, the number of vehicles purchased each year is equal to the number of drivers hired minus the number of drivers leaving the program. Each vehicle in Mississippi incurs a 5% purchase tax [82]. On average, each vehicle has an annual insurance cost of $1471 [83] and an annual registration cost of $14 [84]. Average maintenance costs are estimated at $506 per year [85], including repairs and oil changes.
Other important costs considered in this analysis were personnel costs, office-related costs, and fuel costs. According to Salary.com, the median driver wage and median salary of a Customer Service Representative in Mississippi were estimated at $32,786 and $31,216, respectively [86,87]. Office-related costs were estimated at $36,000 per year, which is the average annual cost to rent a 1500 sqft class A office space in Mississippi [88]. Finally, fuel costs were determined by multiplying the average fuel consumed per ride, the number of rides, and the average fuel cost per gallon. Average fuel use per ride was estimated to be a function of average vehicle MPG (i.e., 31.7 mpg) [89] and average trip distance, which based on Holmes County data (i.e., reference data) were 6.3 miles [90]. Full details about variables included in the Cost Module, including equations, properties, units, and corresponding values, can be found in Table S1.

6. Model Validation

According to Sterman [58], all models, whether mental or formal representations, are simplified versions of the real world. In the field of SD, model validation remains a critical stage in the development process to ensure that constructed models accurately represent the structure and behavior of complex systems [91]. Model validation consists of several stages and plays a vital role in confirming the accuracy and reliability of models.
This study conducts multiple tests, drawing from existing literature and extending methods employed in prior research [58,91,92], including structure verification, parameter verification, dimensional consistency, and a behavior reproduction test. The initial tests focused on structure and parameter verification. The structure verification test ensured that all parameters and relationships within the model were representative of the context being investigated, which is a microtransit program in a low-income community. During the structure verification test, variables and relationships outlined in the CLD (Figure 2) were also checked to ensure that they represented characteristics of microtransit programs across the US (Table 1) as well as data provided by the microtransit program operator in Holmes County. Finally, variables were checked against findings from the literature, as they are cited in Section 4. In the parameter verification test, all values of variables used in the model were checked to ensure they were based on existing literature, which is all cited in Section 5.2 (Stock and Flow Diagram). Next, a dimensional consistency test was used to check each variable’s units; this check ensured dimensional equivalence and consistency. Table S1 provides a detailed overview of the verified units.
The final test conducted was a behavior reproduction test, where model results were compared to historical data provided by the microtransit program operator. To accomplish this, the values of constants, such as the number of drivers, driver salaries, staff salaries, etc., are adjusted based on the data at the time of the program. For example, since the drivers in the Holmes County program were unpaid volunteers, the average driver salary was set to zero in the model. Subsequently, a one-way Analysis of Variance (ANOVA) test is conducted, and the R-squared metric is measured to determine if there are statistically significant differences in means between the results of the model and historical data.
Figure 6 shows a comparison between model output and real data gathered during the fall 2021 piloting of the microtransit program in Holmes County, including F-statistics, p-values, and R-squared values. Results indicate that p-values for both results are higher than the confidence value (α) of 0.05 and R-squared values are above 0.8, meaning that there is no statistically significant difference between the results of the model and historical data.

7. Results and Discussion

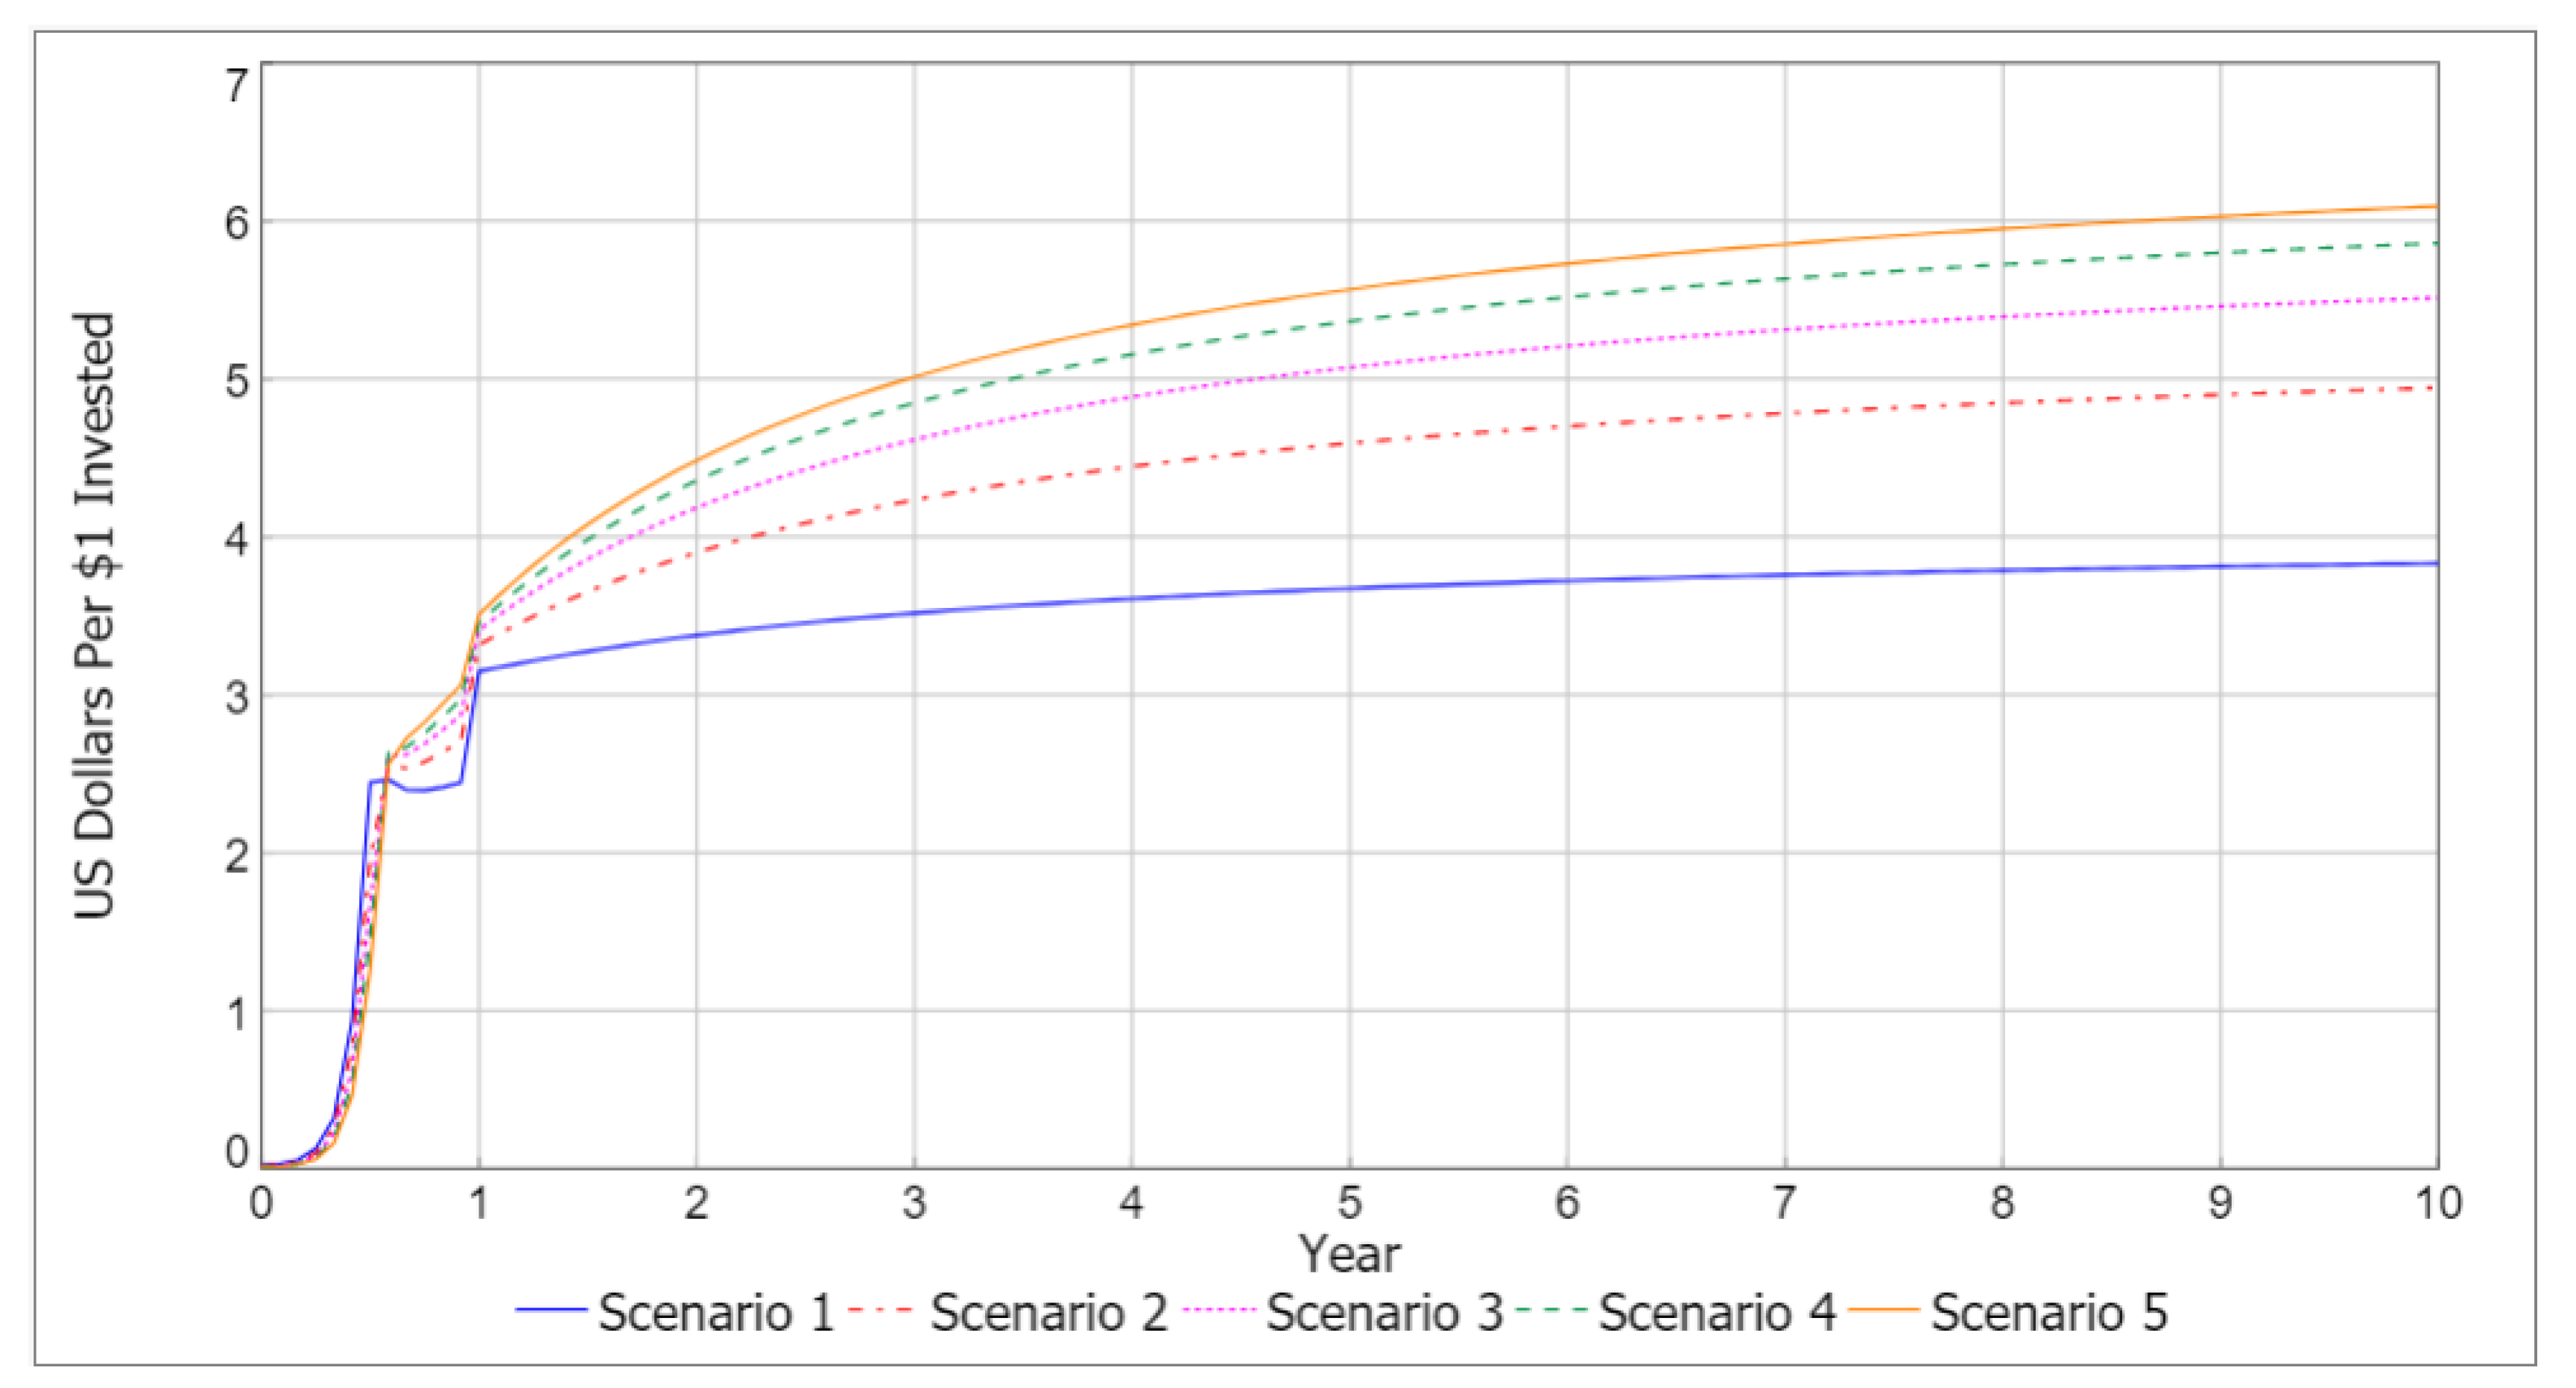
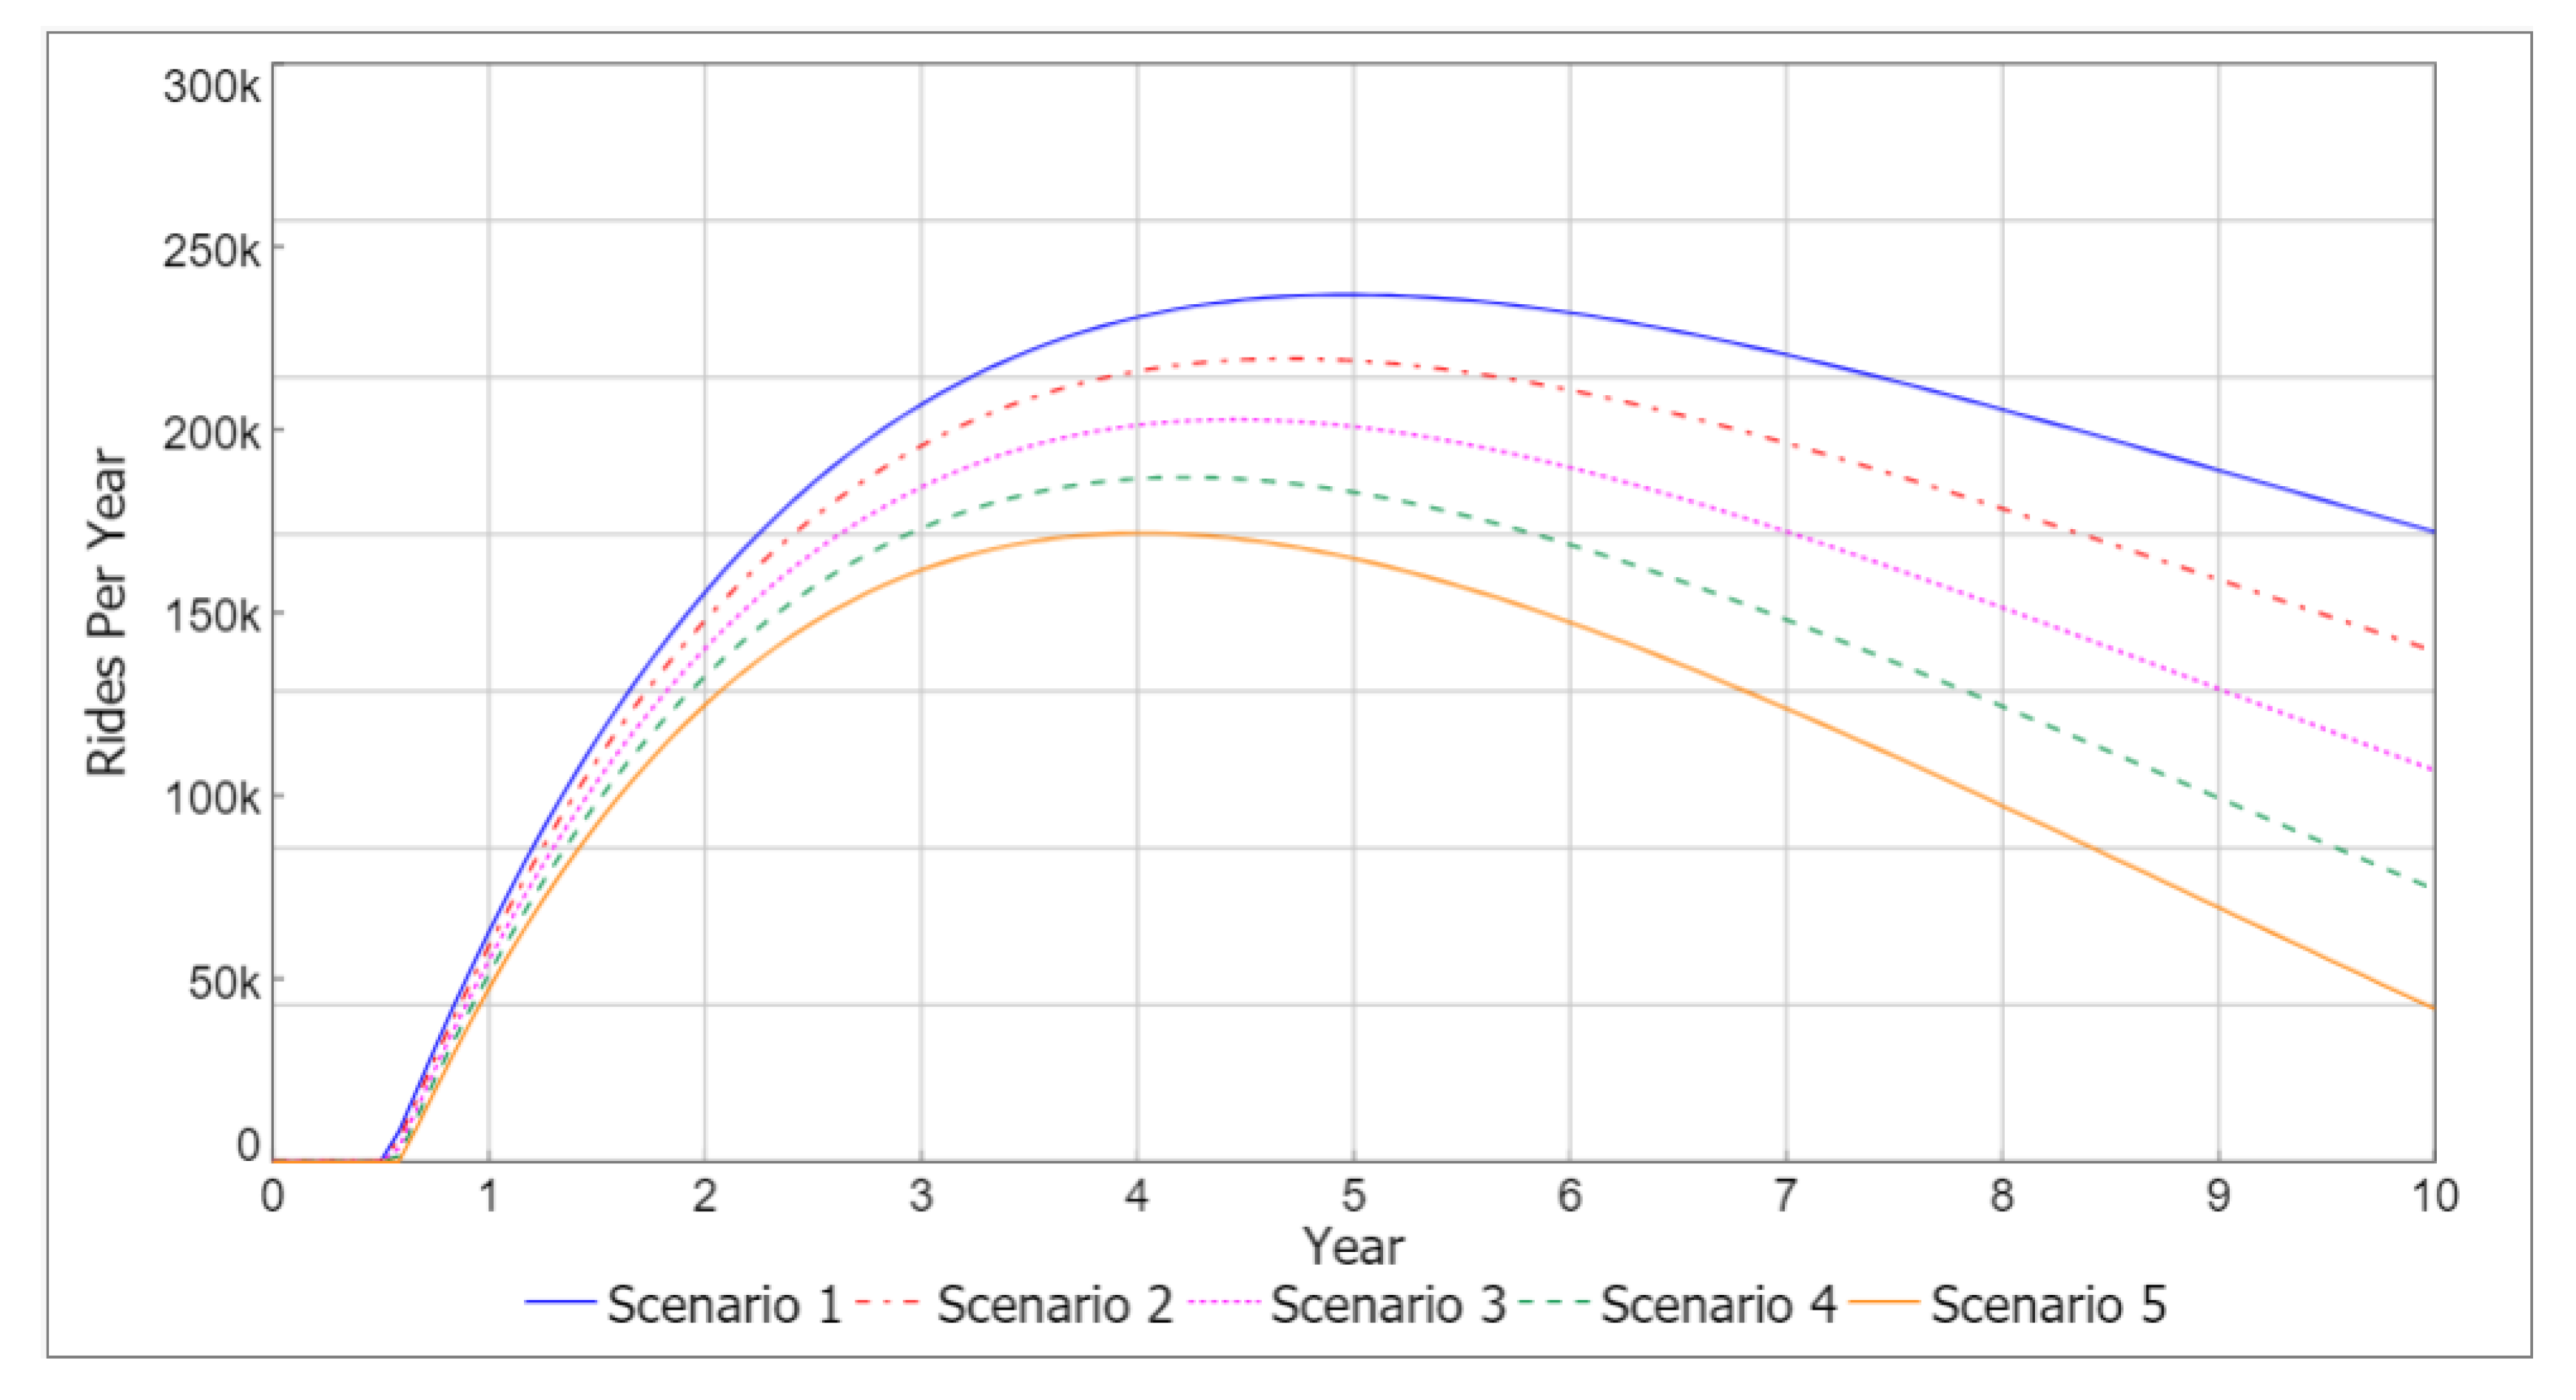
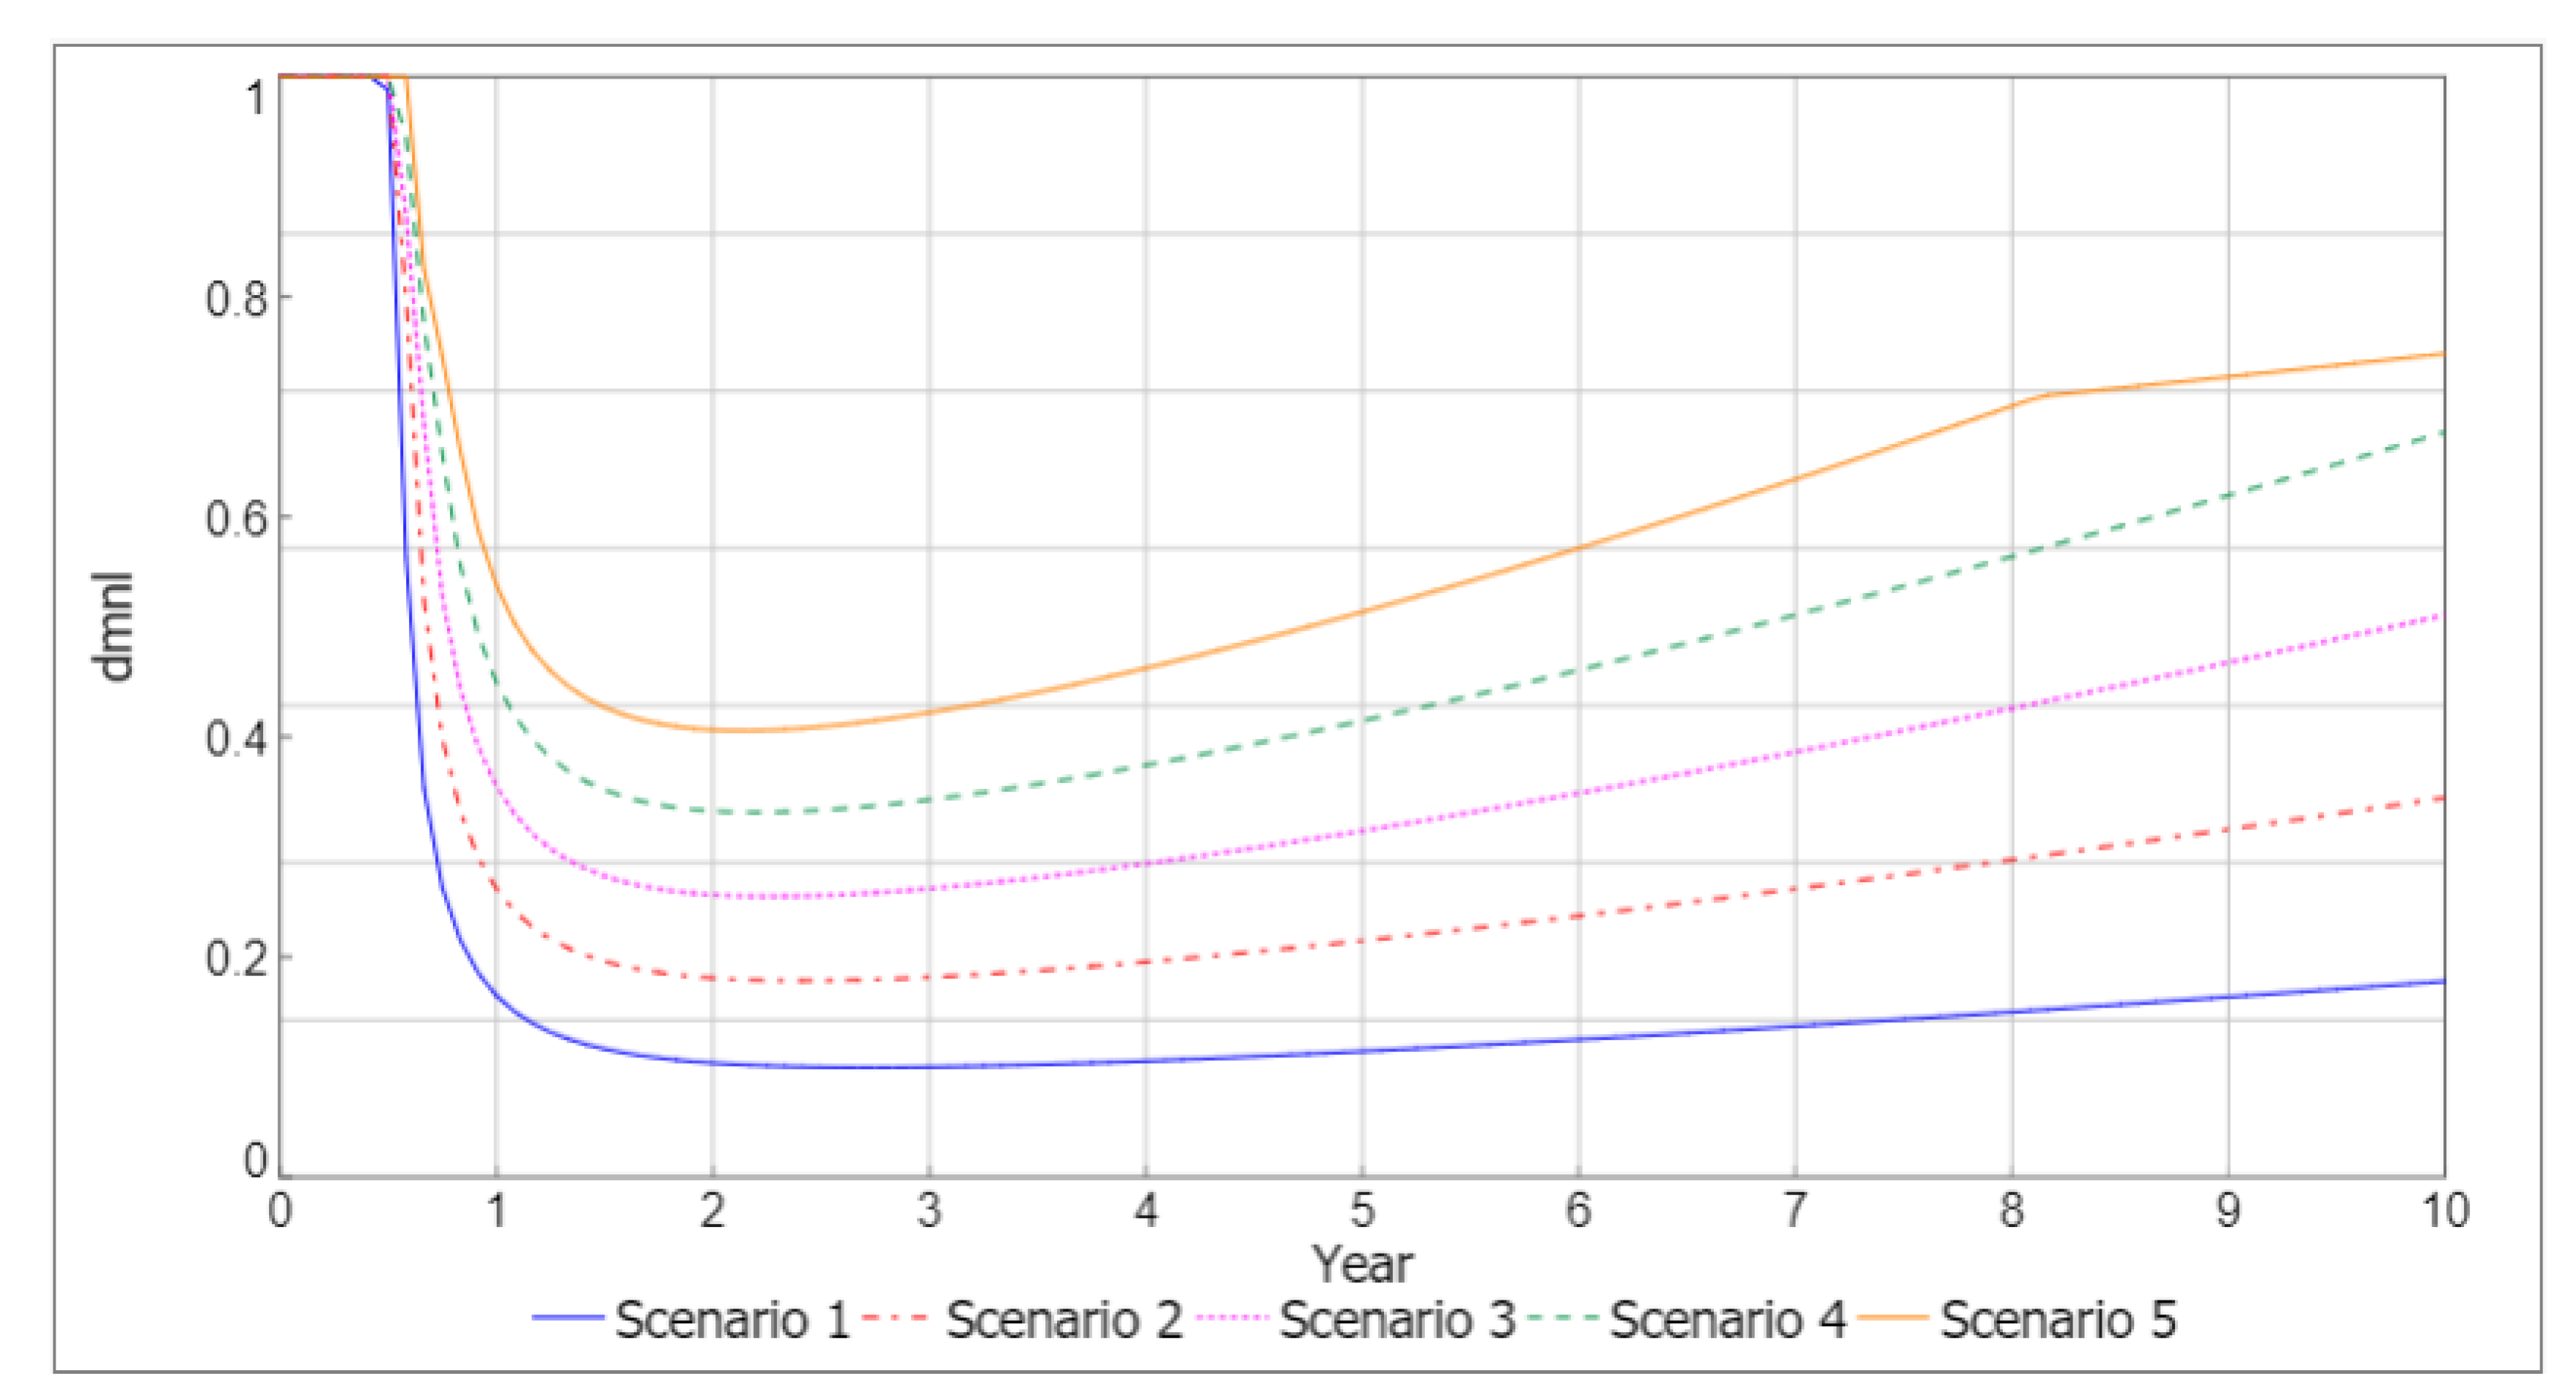
7.1. Scenario Analysis

The microtransit program’s social benefits depend on completed rides, which are influenced by its capacity, primarily determined by hiring drivers and staff. To assess different hiring options, 5 scenarios are formulated: scenario 1—hires 2 drivers and 2 staff per year; with the number of drivers and staff hired increasing by 2 in each subsequent scenario. Scenario 5 hires 10 drivers and 10 staff per year. Stella software was used to simulate each of the five scenarios and observe the corresponding changes in the SROI ratio. The target variable of the overall model was calculated as follows:
S R O I = P r e s e n t   V a l u e   o f   B e n e f i t s P r e s e n t   V a l u e   o f   I n v e s t m e n t s
In the SROISD model, the present value of benefits is represented as “Social Benefits” (the target variable of the social benefits module), and the present value of investments is represented as “Costs” (the target variable of the cost module). Scenario analysis outcomes and results are discussed below.
Dynamic changes in the model’s primary output variable, SROI, are shown in Figure 7, which shows SROI ratios for each scenario spanning a 10-year period. The graph demonstrates a clear trend wherein the SROI ratio rises as the program allocates more funds towards the recruitment of drivers and staff. These findings indicate that increasing investment in human resources leads to higher social returns. An analysis of the budget allocated to the program each year reveals that the SROI ratio can vary from 4 in the initial year to exceeding 6 by the end of the ten-year timeframe. This implies that for every $1 invested in the program, a social benefit of $4 to $6 can be realized. These results highlight the program’s potential for generating significant social value and offer a strong rationale for allocating resources towards the recruitment of drivers and staff to maximize social returns. Nevertheless, it can be observed that in the initial year, Scenario 1 produces the highest SROI ratio. This implies that the hiring of two drivers and staff suffices for the initial phase. However, as the user base expands, a greater number of drivers and staff members become needed.
Figure 8 and Figure 9 show trends in the number of unattended rides and service quality across each scenario. The findings show that hiring 10 drivers and 10 staff leads to a higher SROI ratio in the span of 10 years. As the number of drivers and staff increases, customer service quality improves, and the rate of unattended rides decreases.
Figure 8 highlights a noteworthy trend where the number of unattended rides shows an increase during years 3 to 6. This rise can be attributed to the growth in the number of requests for rides, which outpaces the available number of drivers hired during this period. However, as the recruitment of drivers gradually catches up with the increasing demand, the number of unattended rides starts to fall.
These results underscore the importance of maintaining an adequate workforce to meet customer demand and ensure high service quality. Increasing the number of drivers in line with the growth in ridership is thus a likely strategy for effectively tackling the problem of unattended rides and improving the customer experience.

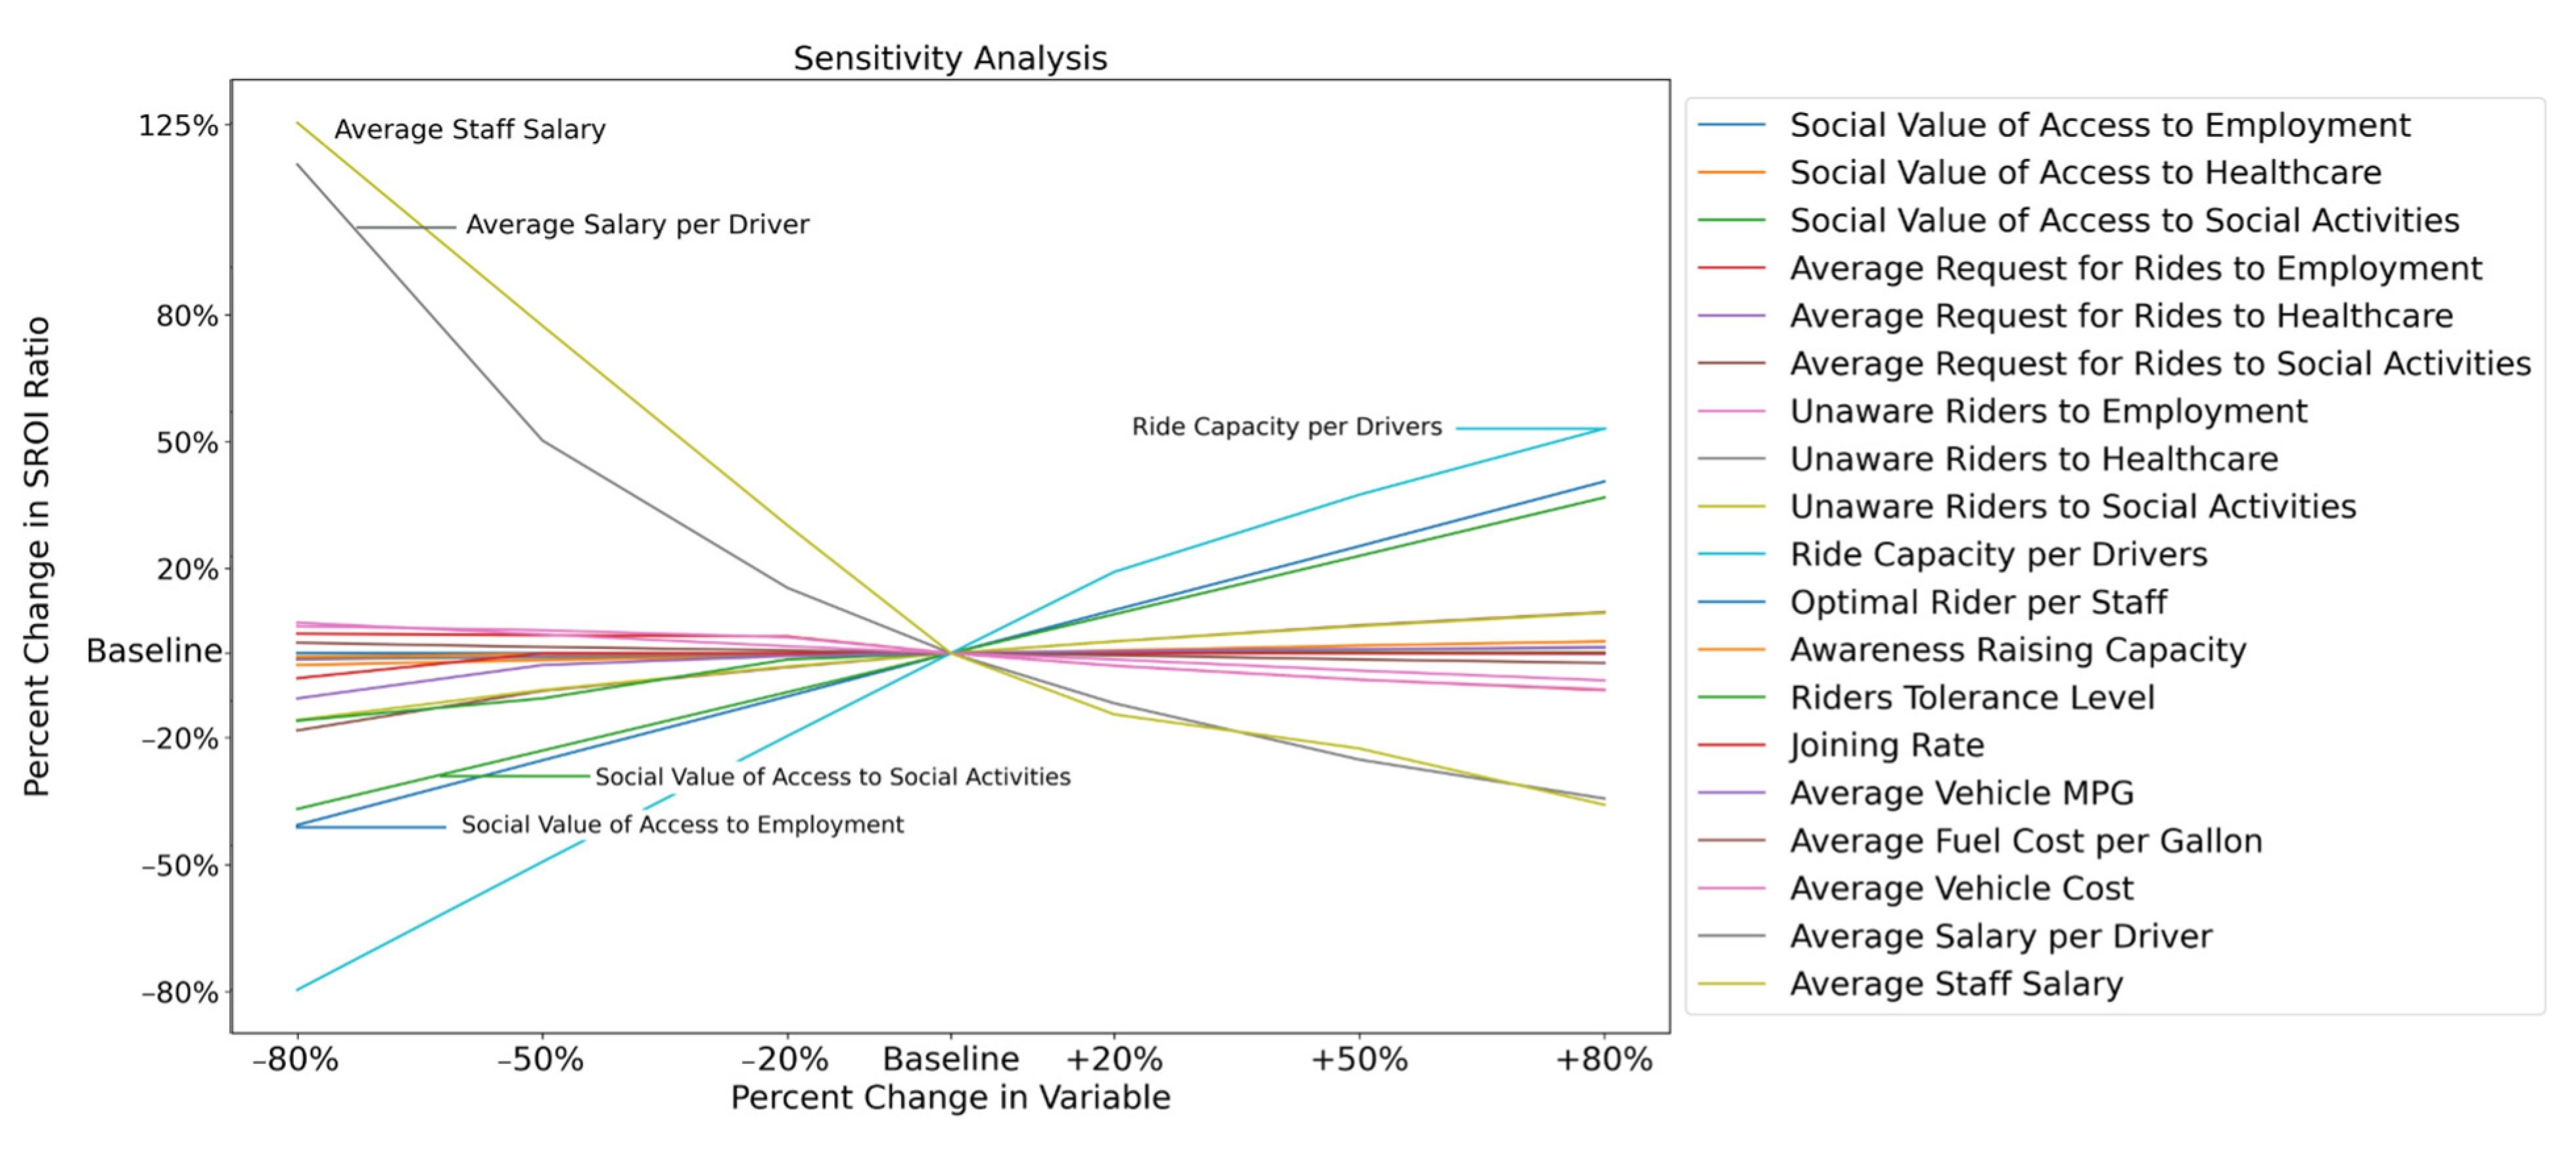
7.2. Sensitivity Analysis

Sensitivity analysis plays a crucial role in both SROI and SD studies. According to Nicholls et al. [37], sensitivity analysis is a key step in calculating SROI, allowing for the identification of proxy values that have the most significant impact on model output. In SD simulations, sensitivity analysis serves as a valuable tool for assessing the reliability of conclusions given uncertainties in the assumptions made during the system conceptualization and model formulation phases [58].
The SROISD model focuses on the SROI ratio as the primary output variable. The sensitivity analysis is thus performed by varying the SROI ratio. Figure 10 depicts the results of a sensitivity analysis performed using Stella software and plotted with the Matplotlib library in Python. Each line represents the relationship between variable changes (x-axis) and their corresponding impact on the SROI ratio (y-axis). Steeper line slopes indicate greater sensitivity of the SROI ratio to the variable being tested.
The SROI ratio is most sensitive to the following three variables: average salary per staff member, average salary per driver, and ride capacity per driver. As shown in Figure 10, decreasing average staff salary and average salary per driver by 80% leads to a around 125% increase in SROI after 10 years. On the other hand, a 20% increase in ride capacity per driver (from 10 to 12 rides per day) leads to a 22% increase in SROI. Additionally, as shown in Figure 10, sensitivity analysis of the social values (i.e., proxy values) of all benefit categories revealed that the social value of access to employment has the strongest impact on SROI. An 80% increase in social value of access to employment boosts the SROI ratio by around 40%, while an 80% decrease in social value of access to employment reduces SROI by 45%. Access to social activities shows relatively similar results. SROI is least sensitive to the social value of access to healthcare.

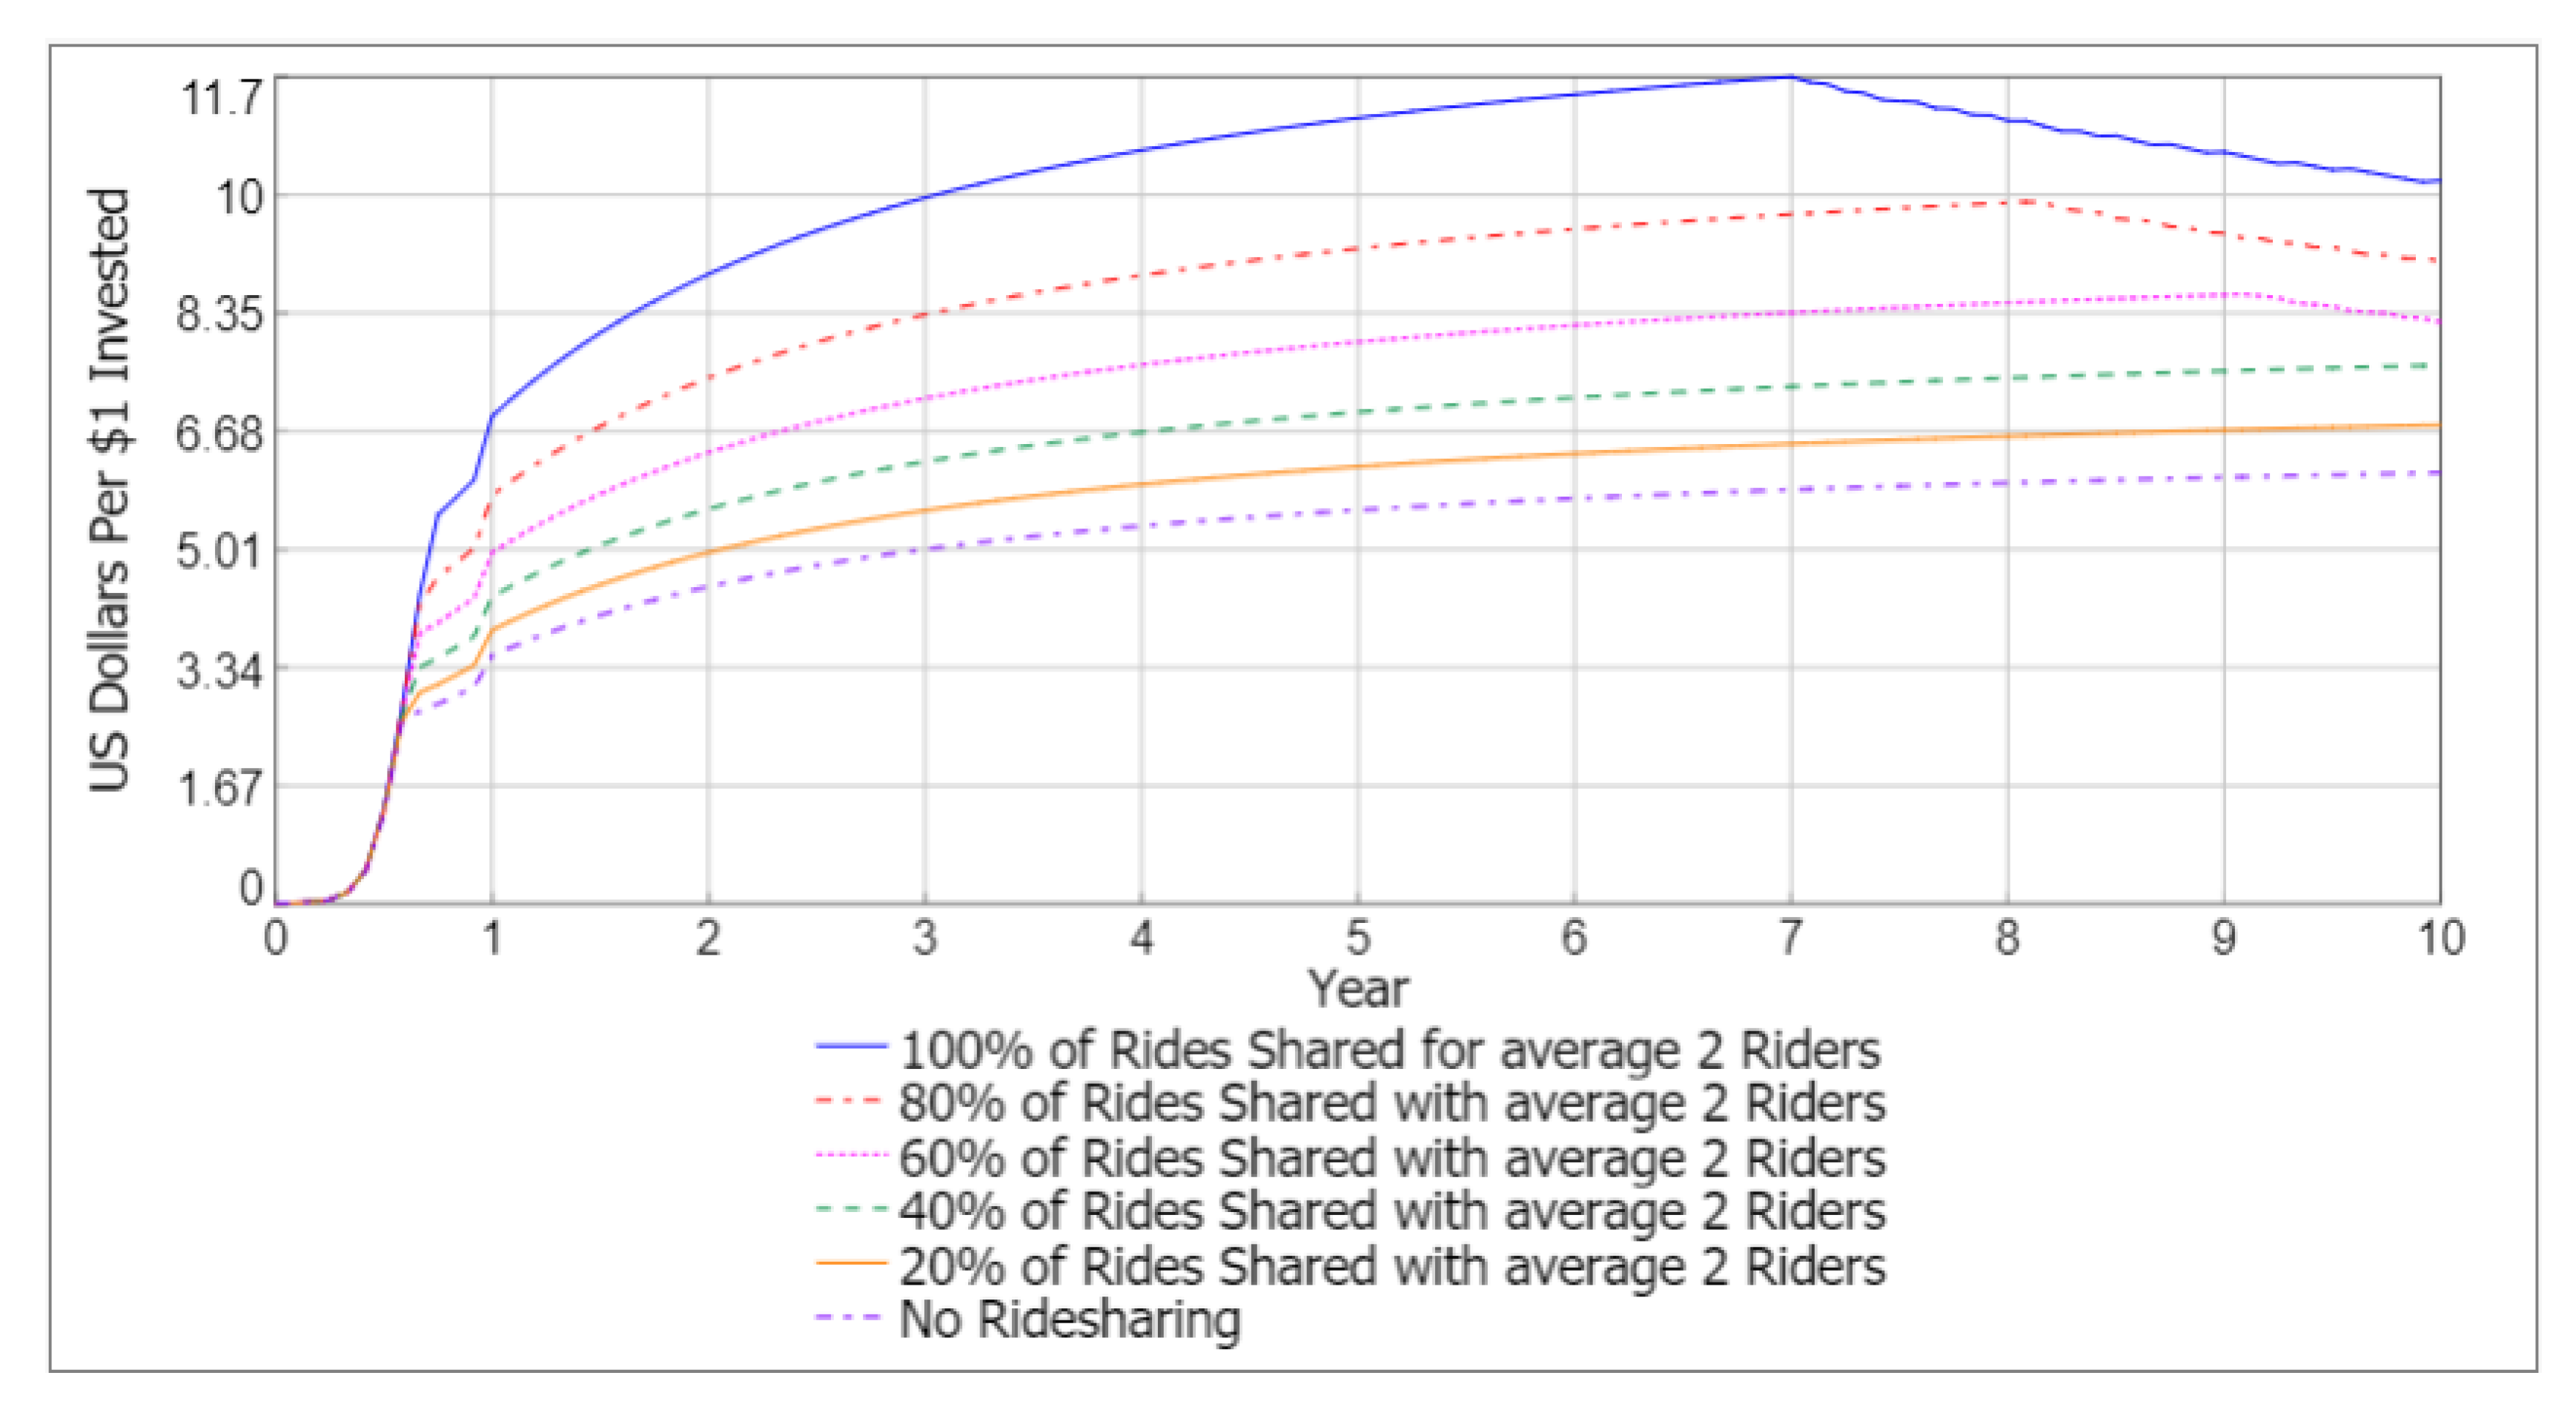
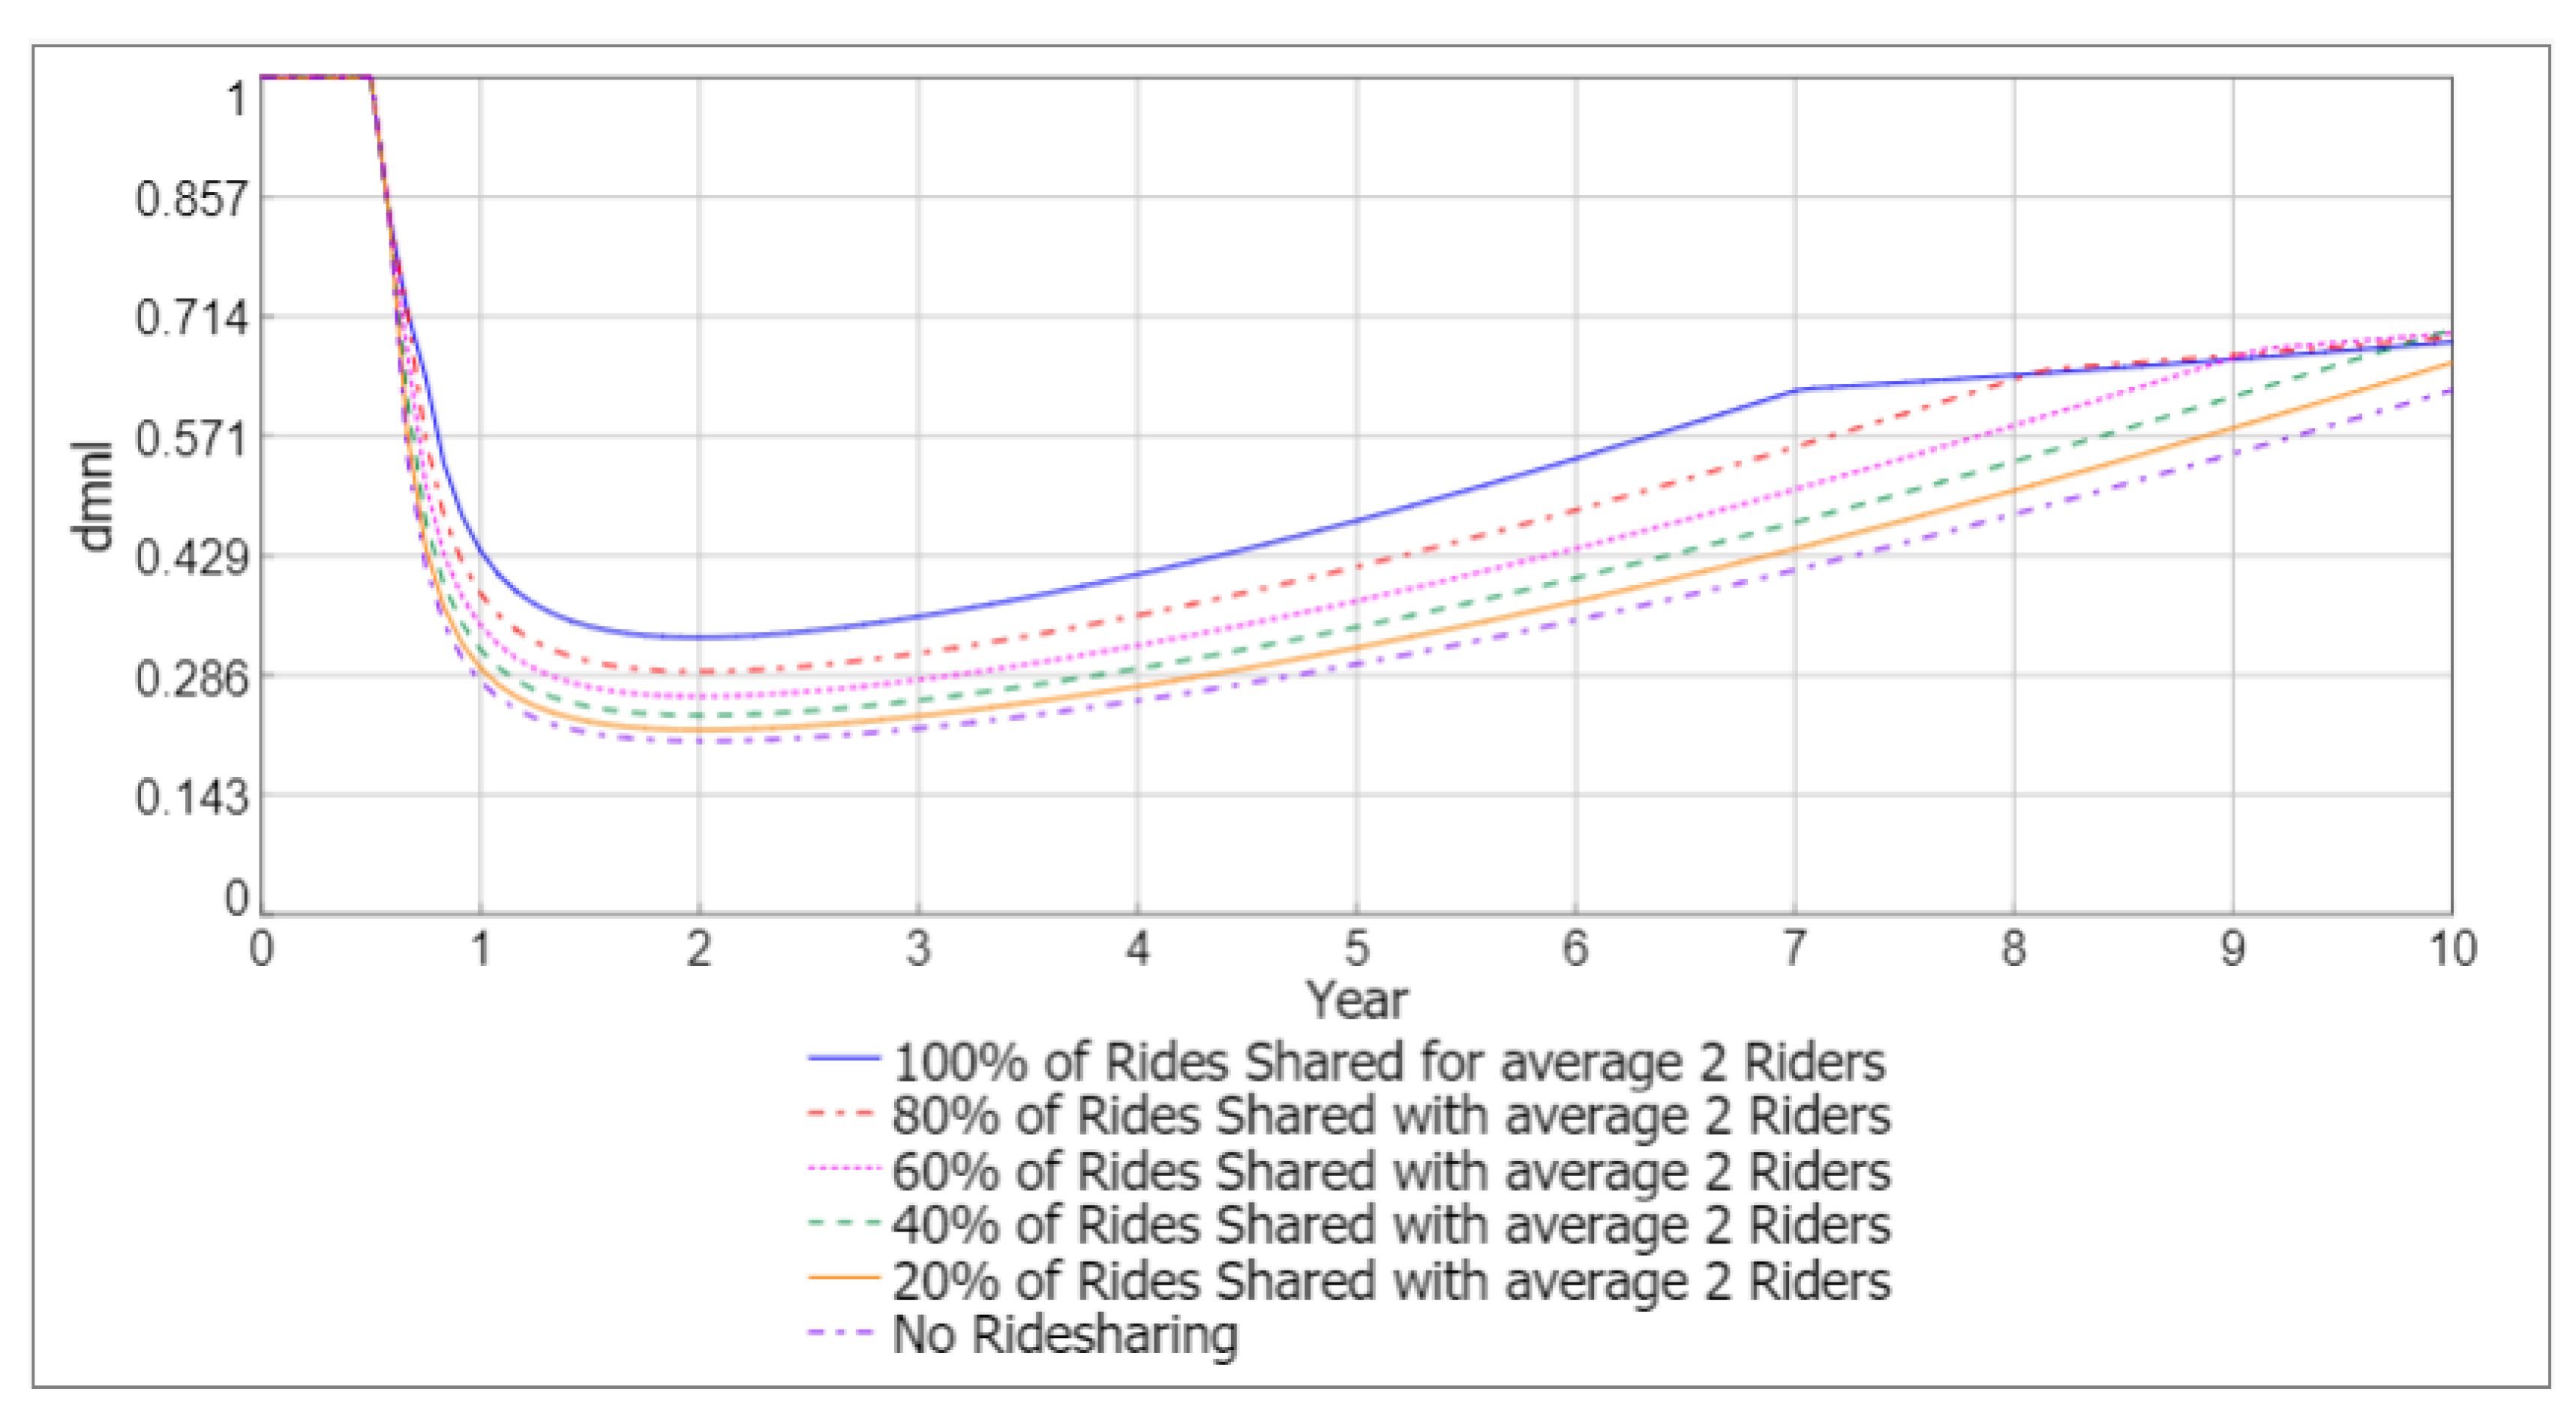
7.3. Policy Analysis and Implications

The SROISD model has several implications for transportation program runners. This model equips decision-makers and program administrators with a powerful tool to make informed financial and operational decisions. It allows them to not only assess the overall impact and returns of a microtransit program and other similar shared mobility services but also provides the flexibility to determine the magnitude and timing of resource allocations. The application of the SROISD approach to microtransit, as a proxy and example of transportation in general, showcases the adaptability of the methodology and its potential use for understanding various transportation programs by simply calibrating variables and adjusting relevant parameters. Decision-makers can use the model to optimize resource allocation decisions based on budget constraints and priorities. They can make data-driven decisions on when and where to invest, whether it is in expanding the fleet of vehicles, hiring additional staff, or incentivizing drivers. This level of precision in resource allocation is vital to ensuring that limited resources are utilized efficiently and social benefits are maximized.
Furthermore, the SROISD model offers insights into program dynamics over time, enables transportation decision makers to evaluate long-term sustainability and effectiveness, and identifies key points for potential adjustment and refinement. This flexibility not only benefits decision makers but also community members and other stakeholders, as the data driven, adaptive approach provided by SROISD expands the understanding of microtransit program reach and success.
Based on the results of our model, several policy considerations become apparent. First, the model demonstrates that policymakers may consider implementing optimization measures for driver and staff hiring to improve the program’s SROI over time. However, it is essential to carefully evaluate the potential trade-offs between cost savings, service quality, and financial earnings. Secondly, according to sensitivity analysis (Section 7.2), the model highlights the significance of ride capacity per driver in influencing both the SROI ratio and service quality. Policymakers should explore strategies to optimize ride capacity per driver, for example, through driver training and route planning, as these actions significantly impact driver capacity and subsequently SROI, as shown in Figure 10. Additionally, policymakers may consider ride sharing as an approach to increasing driver capacity, as discussed below.
It can be concluded from the results of the sensitivity analysis (Figure 10) that incorporating ride-sharing initiatives can have a positive impact on both the SROI ratio and the service quality of the microtransit program. By encouraging ridesharing among passengers with similar routes or destinations, policymakers can optimize vehicle capacity and reduce operational costs. Particularly for access to employment services, which have the highest average request for rides, a ride share of at least 2 people in one vehicle results in a 50% decrease in requests for rides to employment and an increase of approximately 5% and 13% in the SROI ratio and service quality, respectively.
In fact, by incorporating a ridesharing variable into the model, we can further explore the effects of ridesharing on the SROI ratio. This variable is multiplied by the rides requested and divided by the social benefit variable. When we set the ridesharing variable at different values, such as 0.5, 0.4, 0.3, 0.2, or 0.1, it represents the average proportion of rides that are shared among two individuals: 100%, 80%, 60%, 40%, or 10%, respectively. We conducted tests using different values for the ridesharing variable, and the results are presented in Figure 11 and Figure 12. These findings demonstrate a positive relationship between ridesharing and the SROI ratio, providing further evidence of the beneficial impacts of ridesharing.
Policymakers can explore various strategies to promote ride sharing, such as implementing technology solutions that facilitate matchmaking between passengers with compatible travel plans. By leveraging the power of ridesharing, the microtransit program can achieve higher SROI and enhanced service quality, further benefiting the low-income area and its residents.
Finally, efforts to increase the average request for rides to employment can enhance the overall program impact. Policy interventions may involve targeted campaigns, partnerships with local employers, or improved accessibility to employment centers. By considering these strategies, decision-makers can make informed choices to maximize the social benefits of the microtransit program in the low-income area while balancing the effects of salary reductions on staff and drivers.

8. Conclusions

Reliable and accessible transportation plays a crucial role in low-income areas by connecting communities to essential resources. Transportation is not only an SDOH but also helps to address barriers that people may face in accessing other SDOH categories such as healthcare, employment, and education. Transportation availability thus not only improves personal mobility but can also help break the cycle of poverty by providing access to opportunities. Previous studies have highlighted the importance of microtransit programs as reliable transportation solutions that aim to address barriers to SDOH. However, there remains a need for an approach to effectively measure the long-term social and economic impact of microtransit and other on-demand transit systems. SROI is a comprehensive method that takes into account the perspectives of stakeholders and considers both the social benefits and project revenues, going beyond the traditional ROI approach. However, microtransit costs are not typically incurred upfront, and both costs and social benefits derived from such programs are subject to change over time due to the effects of several factors. This study presents an innovative SD-based model called SROISD, which offers a 10-year forecast of the SROI for a microtransit program in a low-income area. The model takes into consideration various factors that influence the costs and social benefits generated by such a program, as well as the complex interactions between them. To illustrate the application of the model, results from a case study analysis in Holmes County, MS, are reported.
Results of this case analysis suggest that microtransit, depending on the amount of money invested, can offer a social return, or SROI, where social benefits gained from the program outweigh costs by approximately 4 to 6 times. The model further suggests that an increase in the number of rides that one driver can accommodate per day has a significant impact on the SROI ratio over time, offering support for the concept of ridesharing in microtransit. Results of this case analysis further indicate that potential benefits derived from microtransit are notably higher than costs when considering access to SDOH categories (e.g., healthcare, employment, and social activities) and impacts on stakeholders, including riders, healthcare providers, and transportation operators.
Overall, the results underscore the considerable positive impact of microtransit on enhancing access to crucial services, promoting sustainability, and fostering social inclusion. Furthermore, these findings provide invaluable insights for decision-makers seeking to optimize resource allocation over the long term. The model empowers them to make data-driven decisions, determining both the degree and timing of resources allocated to the microtransit program. Such strategic flexibility is vital to ensuring that limited resources are utilized efficiently while maximizing the program’s social benefits. Additionally, the model offers a dynamic view of the program over time, allowing decision-makers to assess its sustainability and effectiveness, which, in turn, supports the long-term success of the program.
This study contributes to the existing knowledge of SROI and SD by applying SD to forecast SROI, providing a dynamic, forward-looking perspective. SROI stands as a superior metric for evaluating the impact of transportation programs on SDOH when compared to traditional ROI approaches. Unlike conventional ROI, which primarily focuses on monetary returns, SROI encompasses a broader spectrum of social benefits and costs, resulting in a more comprehensive evaluation of social impact. Furthermore, SROISD sets itself apart by offering substantial advantages in comparison to other studies that have employed SROI. While SROI methodologies have been utilized for forecasting, they are often static in nature and assume upfront costs and immediate returns. In contrast, the SROISD model is useful in the context of transportation programs, where costs dynamically evolve over time. The dynamic modeling capabilities of SD allow for the accurate tracking of both costs and social returns, offering decision-makers a clearer understanding of the intricate financial and social dynamics at play.
Moreover, SROISD introduces the pivotal capability of forecasting, a feature that is challenging in traditional SROI methodologies, particularly when it comes to transportation programs with evolving costs and benefits. While SROI has been used for forecasting in certain contexts, it assumes upfront costs and does not align well with transportation programs, where costs and benefits change dynamically over time. In contrast, the SROISD model excels in this regard, providing the necessary flexibility for forecasting within such complex and evolving systems.
This study, despite its significant contributions, had several limitations that warrant further investigation. Firstly, while a microtransit program can benefit multiple stakeholders, this study focused only on those who would experience significant benefits (i.e., riders to employment, riders to healthcare, riders to social activities, and healthcare providers), leaving room to explore the potential advantages for other stakeholders in future research. Additionally, it is important to note that microtransit programs can have environmental impacts that should be considered in future work, and the associated technology costs need closer examination to provide a comprehensive understanding of the program’s overall implications. Secondly, the evaluation of transportation interventions typically involves quality of life surveys like health-related quality of life (HRQOL) and measures such as the quality-adjusted life-year (QALY). However, as this study aimed to forecast social benefits, the feasibility of utilizing measures like QALY was limited, as surveys needed to be conducted pre- and post-program, necessitating the reliance on alternative measures such as the number of ED visits avoided, incomes gained, benefits gained from seeing friends and relatives, etc. Future investigations could explore the inclusion of QALY and HRQOL to provide a more comprehensive evaluation. Moreover, this study focused on three access categories—health; employment; and social activities—to demonstrate the methodological application of the SROISD model; disregarding other potential social benefits that microtransit programs offer; such as access to education, food, etc. Future studies should expand the analysis to encompass a broader range of service categories to capture the full scope of social benefits provided by microtransit programs. Additionally, variables such as the leaving delay for riders and the average layoff delay for drivers and staff rely on researcher assumptions due to challenges faced in their precise measurement. These assumed variables underwent additional calibration to align them with the reference data. Furthermore, during sensitivity analysis, delay variables were checked to determine their impacts on model output. Findings indicated a limited impact on the SROI output variable.
To further develop the SROISD model, future work can include additional stakeholders and aim to capture a wider range of social benefits. Such expanded analysis would provide more comprehensive insights into the social advantages associated with microtransit programs. Additionally, conducting a survey with stakeholders would be instrumental in exploring their viewpoints and gaining a better understanding of the social benefits they perceive. Furthermore, recent advancements in microtransit programs have seen the incorporation of technologies such as in-vehicle cameras. Future work should consider the costs and benefits associated with integrating these technologies into the analysis. This could involve evaluating how these technologies impact safety, service quality, and operational efficiency, as well as assessing the potential privacy and data security implications. Moreover, it is crucial to acknowledge that the emergence of new ridesharing modes, such as robotaxis, has the potential to alter outcomes related to SROI. These innovations may reduce driver salary costs, decrease unattended rides, and increase trip chaining possibilities, further improving service operation efficiencies. As technologies advance, population needs change, and opportunities expand, there will be an ongoing need to evaluate SROI and the impact of new emerging factors.

Supplementary Materials

The following supporting information can be downloaded at: https://www.mdpi.com/article/10.3390/systems11110538/s1, Table S1. Description of Variables.

Author Contributions

Conceptualization, M.M. and J.S.-C.; Data curation, M.M. and J.S.-C.; Formal analysis, M.M. and J.S.-C.; Methodology, M.M. and J.S.-C.; Resources, J.S.-C.; Software, M.M.; Supervision, J.S.-C.; Validation, M.M. and J.S.-C.; Visualization, M.M.; Writing—original draft, M.M. and J.S.-C.; Writing—review and editing, J.S.-C. All authors have read and agreed to the published version of the manuscript.

Funding

This research was completed with support from the National Academies of Science, Engineering, and Medicine (NASEM) Gulf Research Program, Early Career Fellowship—Human Health and Resilience Track, Grant #2000012306.

Data Availability Statement

Limited data is available online as referenced in this paper. some data is not publicly available due to privacy restrictions.

Acknowledgments

We would like to extend our sincere appreciation to Feonix—Mobility Rising for their invaluable support and cooperation in providing data and insights that greatly contributed to the success of this research. Feonix—Mobility Rising has explicitly consented to be acknowledged in this publication.

Conflicts of Interest

The authors declare no conflict of interest.

References

  1. Who.int Social Determinants of Health. Available online: https://www.who.int/health-topics/social-determinants-of-health (accessed on 2 February 2023).
  2. CDC.com about Social Determinants of Health. Available online: https://www.cdc.gov/socialdeterminants/about.html (accessed on 14 March 2022).
  3. Ogunwole, S.M.; Golden, S.H. Social Determinants of Health and Structural Inequities—Root Causes of Diabetes Disparities. Diabetes Care 2021, 44, 11–13. [Google Scholar] [CrossRef] [PubMed]
  4. Wolfe, M.K. Access to Health Care: Perspectives on Transportation as a Social Determinant of Health. Ph.D. Dissertation, The University of North Carolina at Chapel Hill University Libraries, Chapel Hill, NC, USA, 2020. [Google Scholar]
  5. Butler, S.M. What Is the Outlook for Addressing Social Determinants of Health? JAMA Health Forum 2021, 2, e213639. [Google Scholar] [CrossRef] [PubMed]
  6. Transportation and Social Determinants of Health Destinations. Available online: https://nationalcenterformobilitymanagement.org/transportation-and-social-determinants-of-health-destinations/ (accessed on 13 October 2023).
  7. Weinstein, J.N.; Geller, A.; Negussie, Y.; Baciu, A. National Academies of Sciences, Engineering, and Medicine Committee on Community-Based Solutions to Promote Health Equity in the United States. In Communities in Action: Pathways to Health Equity; National Academies Press: Washington, DC, USA, 2017. [Google Scholar]
  8. Bardaka, E.; Hajibabai, L.; Singh, M.P. Reimagining Ride Sharing: Efficient, Equitable, Sustainable Public Microtransit. IEEE Internet Comput. 2020, 24, 38–44. [Google Scholar] [CrossRef]
  9. Macfarlane, G.S.; Hunter, C.; Martinez, A.; Smith, E. Rider Perceptions of an On-Demand Microtransit Service in Salt Lake County, Utah. Smart Cities 2021, 4, 717–727. [Google Scholar] [CrossRef]
  10. Doyle, T. American Public Transportation Association Releases New Mobility Innovation Report; American Public Transportation Association: Washington, DC, USA, 2021. [Google Scholar]
  11. Shared Mobility Definitions|FTA. Available online: https://www.transit.dot.gov/regulations-and-guidance/shared-mobility-definitions (accessed on 21 April 2022).
  12. Rossetti, T.; Broaddus, A.; Ruhl, M.; Daziano, R. Commuter Preferences for a First-Mile/Last-Mile Microtransit Service in the United States. Transp. Res. Part A Policy Pract. 2023, 167, 103549. [Google Scholar] [CrossRef]
  13. National Academies of Sciences, Engineering, and Medicine. Microtransit or General Public Demand–Response Transit Services: State of the Practice; The National Academies Press: Washington, DC, USA, 2019. [Google Scholar]
  14. THE 17 GOALS|Sustainable Development. Available online: https://sdgs.un.org/goals (accessed on 6 October 2023).
  15. How Microtransit Helps Reduce Emissions. Available online: https://ridewithvia.com/resources/articles/how-microtransit-helps-reduce-emissions/ (accessed on 6 October 2023).
  16. Rides to Wellness|Genesee County|MTA Flint. Available online: https://www.mtaflint.org/rides-to-wellness/ (accessed on 12 March 2022).
  17. Osman, M. Pinellas Suncoast Transit Authority’s TD Late Shift Program; American Public Transportation Association: Washington, DC, USA, 2019. [Google Scholar]
  18. Gosselin, V.; Boccanfuso, D.; Laberge, S. Social Return on Investment (SROI) Method to Evaluate Physical Activity and Sport Interventions: A Systematic Review. Int. J. Behav. Nutr. Phys. Act. 2020, 17, 26. [Google Scholar] [CrossRef]
  19. Feigon, S.; Murphy, C. Shared Mobility and the Transformation of Public Transit; American Public Transportation Association: Washington, DC, USA, 2016; ISBN 0-309-44582-5. [Google Scholar]
  20. GoLink. Available online: https://www.dart.org/guide/transit-and-use/golink (accessed on 11 October 2023).
  21. Jeon, C.M.; Amekudzi, A.A.; Guensler, R.L. Sustainability Assessment at the Transportation Planning Level: Performance Measures and Indexes. Transp. Policy 2013, 25, 10–21. [Google Scholar] [CrossRef]
  22. Bertini, R.L.; El-Geneidy, A. Generating Transit Performance Measures with Archived Data. Transp. Res. Rec. 2003, 1841, 109–119. [Google Scholar] [CrossRef]
  23. FlexRIDE On-Demand Service. Available online: https://www.rtcwashoe.com/public-transportation/flexride/ (accessed on 30 March 2022).
  24. Shaheen, S.; Stocker, A.; Lazarus, J.; Bhattacharyya, A. RideKC: Bridj Pilot Evaluation: Impact, Operational, and Institutional Analysis; UC Berkeley: Berkeley, CA, USA, 2016; p. 67. [Google Scholar]
  25. Available online: https://dialabus.org.uk/about/ (accessed on 16 October 2023).
  26. Flexible On-Demand Transport Made to Fit Your Needs. Available online: https://www.gvh.de/en/timetable/sprinti/ (accessed on 16 October 2023).
  27. Flexible Local Transport. Available online: https://translink.com.au/travel-with-us/on-demand (accessed on 17 October 2023).
  28. Kempton, O.; Warby, A. Measuring the Social Return on Investment of Stage 3 Adaptations and Very Sheltered Housing in Scotland; Envoy Partnership: London, UK, 2012. [Google Scholar]
  29. Emerson, J.; Wachowicz, J.; Chun, S. Social Return on Investment: Exploring Aspects of Value Creation in the Nonprofit Sector. Box Set Soc. Purp. Enterp. Ventur. Philanthr. New Millenn. 2000, 2, 130–173. [Google Scholar]
  30. Emerson, J.; Twersky, F. New Social Entrepreneurs: The Success, Challenge and Lessons of Non-Profit Enterprise Creation; Homeless Economic Fund, the Roberts Foundation: San Fransisco, CA, USA, 1996. [Google Scholar]
  31. Aeron-Thomas, D.; Nicholls, J.; Forster, S.; Westall, A. Social Return on Investment: Valuing What Matters; New Economics Foundation: London, UK, 2004. [Google Scholar]
  32. Hutchinson, C.; Berndt, A.; Cleland, J.; Gilbert-Hunt, S.; George, S.; Ratcliffe, J. Using Social Return on Investment Analysis to Calculate the Social Impact of Modified Vehicles for People with Disability. Aust. Occup. Ther. J. 2020, 67, 250–259. [Google Scholar] [CrossRef]
  33. Millar, R.; Hall, K. Social Return on Investment (SROI) and Performance Measurement: The Opportunities and Barriers for Social Enterprises in Health and Social Care. Public Manag. Rev. 2013, 15, 923–941. [Google Scholar] [CrossRef]
  34. Cordes, J.J. Using Cost-Benefit Analysis and Social Return on Investment to Evaluate the Impact of Social Enterprise: Promises, Implementation, and Limitations. Eval. Program Plan. 2017, 64, 98–104. [Google Scholar] [CrossRef] [PubMed]
  35. Kousky, C.; Ritchie, L.; Tierney, K.; Lingle, B. Return on Investment Analysis and Its Applicability to Community Disaster Preparedness Activities: Calculating Costs and Returns. Int. J. Disaster Risk Reduct. 2019, 41, 101296. [Google Scholar] [CrossRef]
  36. McGrath, R.; Stevens, K. Forecasting the Social Return on Investment Associated with Children’s Participation in Circus-Arts Training on Their Mental Health and Well-Being. Int. J. Sociol. Leis. 2019, 2, 163–193. [Google Scholar] [CrossRef]
  37. Nicholls, J.; Lawlor, E.; Neitzert, E.; Goodspeed, T. A Guide to Social Return on Investment; Office of the Third Sector, The Cabinet Office: London, UK, 2012. [Google Scholar]
  38. Bellucci, M.; Nitti, C.; Franchi, S.; Testi, E.; Bagnoli, L. Accounting for Social Return on Investment (SROI): The Costs and Benefits of Family-Centred Care by the Ronald McDonald House Charities. SEJ 2019, 15, 46–75. [Google Scholar] [CrossRef]
  39. Bottero, M.; Ambrosini, G.; Callegari, G. Valuing the Impact of Social Housing Renovation Programs: An Application of the Social Return on Investment (SROI). In Appraisal: From Theory to Practice; Stanghellini, S., Morano, P., Bottero, M., Oppio, A., Eds.; Green Energy and Technology; Springer International Publishing: Cham, Switzerland, 2017; pp. 291–302. ISBN 978-3-319-49675-7. [Google Scholar]
  40. Drabo, E.F.; Eckel, G.; Ross, S.L.; Brozic, M.; Carlton, C.G.; Warren, T.Y.; Kleb, G.; Laird, A.; Pollack Porter, K.M.; Pollack, C.E. A Social-Return-On-Investment Analysis Of Bon Secours Hospital’s ‘Housing For Health’ Affordable Housing Program: Study Evaluates the Broader Social, Environmental, and Economic Benefits of Bon Secours Hospital’s Housing for Health Program. Health Aff. 2021, 40, 513–520. [Google Scholar] [CrossRef]
  41. Miller, M.C.; Rueda, J.A.; Gransberg, D.D. Applying Social Return on Investment to Risk-Based Transportation Asset Management Plans in Low-Volume Bridges. Transp. Res. Rec. 2015, 2473, 75–82. [Google Scholar] [CrossRef]
  42. Ventura, R.; Bonera, M.; Carra, M.; Barabino, B.; Maternini, G. Evaluating the Viability of a Tram-Train System. A Case Study from Salento (Italy). Case Stud. Transp. Policy 2022, 10, 1945–1963. [Google Scholar] [CrossRef]
  43. Khazraeian, S.; Hadi, M. Monte Carlo Simulation-Based Benefit-Cost Analysis Combined with Analytical Hierarchy Process to Support ITS Investment with Consideration of Connected Vehicle Technology. Transp. Res. Rec. 2018, 2672, 1–12. [Google Scholar] [CrossRef]
  44. Arafat, M.; Iqbal, S.; Hadi, M. Utilizing an Analytical Hierarchy Process with Stochastic Return On Investment to Justify Connected Vehicle-Based Deployment Decisions. Transp. Res. Rec. 2020, 2674, 462–472. [Google Scholar] [CrossRef]
  45. Wright, S.; Nelson, J.D.; Cooper, J.M.; Murphy, S. An Evaluation of the Transport to Employment (T2E) Scheme in Highland Scotland Using Social Return on Investment (SROI). J. Transp. Geogr. 2009, 17, 457–467. [Google Scholar] [CrossRef]
  46. Shepherd, S.P. A Review of System Dynamics Models Applied in Transportation. Transp. B Transp. Dyn. 2014, 2, 83–105. [Google Scholar] [CrossRef]
  47. Forrester, J.W. Industrial Dynamics: A Major Breakthrough for Decision Makers. Harv. Bus. Rev. 1958, 36, 37–66. [Google Scholar]
  48. Sterman, J.D. Business Dynamics: Systems Thinking and Modeling for a Complex World; Nachdr.; Irwin/McGraw-Hill: Boston, MA, USA, 2000; ISBN 978-0-07-238915-9. [Google Scholar]
  49. Abbas, K.A.; Bell, M.G. System Dynamics Applicability to Transportation Modeling. Transp. Res. Part A Policy Pract. 1994, 28, 373–390. [Google Scholar] [CrossRef]
  50. Harrison, G.; Grant-Muller, S.M.; Hodgson, F.C. A Review of Transport-Health System Dynamics Models. J. Transp. Health 2021, 22, 101138. [Google Scholar] [CrossRef]
  51. Hovmand, P.S. Community Based System Dynamics; SpringerLink; Springer: New York, NY, USA, 2014; ISBN 978-1-4614-8763-0. [Google Scholar]
  52. Musich, S.; Wang, S.; Hawkins, K.; Klemes, A. The Impact of Personalized Preventive Care on Health Care Quality, Utilization, and Expenditures. Popul. Health Manag. 2016, 19, 389–397. [Google Scholar] [CrossRef] [PubMed]
  53. Naydeck, B.L.; Pearson, J.A.; Ozminkowski, R.J.; Day, B.T.; Goetzel, R.Z. The Impact of the Highmark Employee Wellness Programs on 4-Year Healthcare Costs. J. Occup. Environ. Med. 2008, 50, 146–156. [Google Scholar] [CrossRef] [PubMed]
  54. Triemstra, J.D.; Lowery, L. Prevalence, Predictors, and the Financial Impact of Missed Appointments in an Academic Adolescent Clinic. Cureus 2018, 10, e3613. [Google Scholar] [CrossRef]
  55. Tsai, M.-H.; Xirasagar, S.; Carroll, S.; Bryan, C.S.; Gallagher, P.J.; Davis, K.; Jauch, E.C. Reducing High-Users’ Visits to the Emergency Department by a Primary Care Intervention for the Uninsured: A Retrospective Study. Inq. J. Health Care Organ. Provis. Financ. 2018, 55, 0046958018763917. [Google Scholar] [CrossRef]
  56. He, S.Y.; Thøgersen, J.; Cheung, Y.H.Y.; Yu, A.H.Y. Ageing in a Transit-Oriented City: Satisfaction with Transport, Social Inclusion and Wellbeing. Transp. Policy 2020, 97, 85–94. [Google Scholar] [CrossRef]
  57. Velho, R.; Holloway, C.; Symonds, A.; Balmer, B. The Effect of Transport Accessibility on the Social Inclusion of Wheelchair Users: A Mixed Method Analysis. Soc. Incl. 2016, 4, 24–35. [Google Scholar] [CrossRef]
  58. Sterman, J. Business Dynamics; Irwin/McGraw-Hill c2000: Boston, MA, USA, 2010; ISBN 0-07-231135-5. [Google Scholar]
  59. Ercan, T.; Onat, N.C.; Tatari, O. Investigating Carbon Footprint Reduction Potential of Public Transportation in United States: A System Dynamics Approach. J. Clean. Prod. 2016, 133, 1260–1276. [Google Scholar] [CrossRef]
  60. Coleman, E.A.; Eilertsen, T.B.; Kramer, A.M.; Magid, D.J.; Beck, A.; Conner, D. Reducing Emergency Visits in Older Adults with Chronic Illness. A Randomized, Controlled Trial of Group Visits. Eff. Clin. Pr. 2001, 4, 49–57. [Google Scholar]
  61. Chu, L.; Sood, N.; Tu, M.; Miller, K. Reduction of Emergency Department Use in People with Disabilities. Am. J. Manag. Care 2017, 23, e409–e415. [Google Scholar] [PubMed]
  62. How Many Working Days Are in a Year? Available online: https://www.symmetry.com/payroll-tax-insights/how-many-working-days-are-in-a-year (accessed on 3 June 2023).
  63. Powdthavee, N. Putting a Price Tag on Friends, Relatives, and Neighbours: Using Surveys of Life Satisfaction to Value Social Relationships. J. Socio-Econ. 2008, 37, 1459–1480. [Google Scholar] [CrossRef]
  64. Chhabra, K.R.; McGuire, K.; Sheetz, K.H.; Scott, J.W.; Nuliyalu, U.; Ryan, A.M. Most Patients Undergoing Ground And Air Ambulance Transportation Receive Sizable Out-Of-Network Bills: An Analysis of the Prevalence and Financial Impact of out-of-Network Billing for Ground and Air Ambulance Transportation. Health Aff. 2020, 39, 777–782. [Google Scholar] [CrossRef]
  65. CMS.Gov. Available online: https://data.cms.gov/provider-data/search?page-size=50&theme=Physician%20office%20visit%20costs (accessed on 13 November 2022).
  66. Stacker.Com. Available online: https://stacker.com/mississippi/what-common-medical-visits-cost-mississippi-and-how-they-compare-nearby-states (accessed on 13 November 2022).
  67. Moore, B.J.; Liang, L. Costs of Emergency Department Visits in the United States, 2017. In Healthcare Cost and Utilization Project (HCUP) Statistical Briefs [Internet]; Agency for Healthcare Research and Quality (US): Rockville, MD, USA, 2020. [Google Scholar]
  68. Mississippi: Average Annual Pay 2019. Available online: https://www.statista.com/statistics/732696/mississippi-annual-pay/ (accessed on 13 November 2022).
  69. Maleki, M.; Mohammadpour, S.; Azadeh, S.R. The Effect of Infrastructural Integration of Regional Transport on Tourism Promotion: The Case of Guilan Province, Iran. JURA 2020, 12, 217–231. [Google Scholar] [CrossRef]
  70. Coverage of Therapy and Mental Health Benefits. Available online: https://www.https://www.medicareplans.com/outpatient-mental-health-coverage//outpatient-mental-health-coverage/ (accessed on 27 March 2023).
  71. How Much Do Antidepressants Cost? With & without Insurance. Available online: https://khealth.com/learn/antidepressants/how-much-do-antidepressants-cost/ (accessed on 27 March 2023).
  72. Lamanna, M.; Klinger, C.A.; Liu, A.; Mirza, R.M. The Association between Public Transportation and Social Isolation in Older Adults: A Scoping Review of the Literature. Can. J. Aging 2020, 39, 393–405. [Google Scholar] [CrossRef]
  73. Does Medicare Cover Physical Therapy in 2023? Available online: https://www.theseniorlist.com/medicare/medicare-cover-physical-therapy/ (accessed on 27 March 2023).
  74. Officer, L.H.; Williamson, S.H. Computing ‘Real Value’Over Time with a Conversion between UK Pounds and US Dollars, 1791 to Present. Meas. Worth Accessed Dec. 2019, 27, 2019. [Google Scholar]
  75. U.S. Census Bureau EMPLOYMENT STATUS. Available online: https://data.census.gov/table?q=Holmes+County,+Mississippi&t=Employment&tid=ACSST5Y2020.S2301 (accessed on 2 June 2023).
  76. U.S. Census Bureau DISABILITY CHARACTERISTICS. Available online: https://data.census.gov/table?q=Holmes+County,+Mississippi&t=Disability&tid=ACSST5Y2020.S1810 (accessed on 3 June 2023).
  77. U.S. Census Bureau SEX BY AGE BY AMBULATORY DIFFICULTY. Available online: https://data.census.gov/table?q=Holmes+County,+Mississippi&t=Disability&tid=ACSDT5Y2020.B18105 (accessed on 3 June 2023).
  78. U.S. Census Bureau COMMUTING CHARACTERISTICS BY SEX. Available online: https://data.census.gov/table?q=Holmes+County,+Mississippi&t=Employment&tid=ACSST5Y2020.S0801 (accessed on 3 June 2023).
  79. datausa.io Holmes County, MS|Data USA. Available online: https://datausa.io/profile/geo/holmes-county-ms (accessed on 3 June 2023).
  80. McCormick, T.H.; Salganik, M.J.; Zheng, T. How Many People Do You Know?: Efficiently Estimating Personal Network Size. J. Am. Stat. Assoc. 2010, 105, 59–70. [Google Scholar] [CrossRef]
  81. The Average American Knows How Many People?—The New York Times. Available online: https://www.nytimes.com/2013/02/19/science/the-average-american-knows-how-many-people.html (accessed on 18 September 2023).
  82. Motor Vehicle Licensing FAQs|DOR. Available online: https://www.dor.ms.gov/tagstitles/motor-vehicle-licensing-faqs (accessed on 6 June 2023).
  83. Best Cheap Car Insurance in Mississippi for 2023. Available online: //www.usnews.com/insurance/auto/cheap-car-insurance-mississippi (accessed on 10 April 2023).
  84. Available online: CarRegistration.com/blog (accessed on 10 April 2023).
  85. Car Repair Costs Ranked State-by-State... Where Does Yours Rank?—Autoblog. Available online: https://www.autoblog.com/2011/06/24/car-repair-costs-ranked-state-by-state-where-does-yours-rank/ (accessed on 6 June 2023).
  86. Taxi Driver Salary in Mississippi. Available online: https://www.salary.com/research/salary/benchmark/taxi-driver-salary/ms (accessed on 24 January 2023).
  87. Customer Service Representative I Salary in Mississippi. Available online: https://www.salary.com/research/salary/benchmark/customer-service-representative-i-salary/ms (accessed on 24 January 2023).
  88. Ridgeland Office Price per Sqft and Office Market Trends. Available online: https://www.commercialcafe.com/office-market-trends/us/ms/ridgeland/ (accessed on 7 June 2023).
  89. FOTW #1237, May 9, 2022: Fuel Economy for All Vehicle Classes Has Improved Substantially Over the Past Two Decades. Available online: https://www.energy.gov/eere/vehicles/articles/fotw-1237-may-9-2022-fuel-economy-all-vehicle-classes-has-improved (accessed on 7 June 2023).
  90. Feonix—We are Working to Bring Life-Changing Mobility Solutions. Available online: https://feonix.org/ (accessed on 26 October 2023).
  91. Alirezaei, M.; Onat, N.; Tatari, O.; Abdel-Aty, M. The Climate Change-Road Safety-Economy Nexus: A System Dynamics Approach to Understanding Complex Interdependencies. Systems 2017, 5, 6. [Google Scholar] [CrossRef]
  92. Qudrat-Ullah, H.; Seong, B.S. How to Do Structural Validity of a System Dynamics Type Simulation Model: The Case of an Energy Policy Model. Energy Policy 2010, 38, 2216–2224. [Google Scholar] [CrossRef]
Figure 1. SROISD framework.
Systems 11 00538 g001
Figure 2. Casual Loop Diagram.
Systems 11 00538 g002
Figure 3. Stock and flow diagram for the social benefits module.
Systems 11 00538 g003
Figure 4. Stock and flow diagram for the service module.
Systems 11 00538 g004
Figure 5. Stock and flow diagram for the cost module.
Systems 11 00538 g005
Figure 6. Results of the Behavior Reproduction Test: (a) Number of riders; (b) SROI ratio.
Systems 11 00538 g006
Figure 7. SROI Ratios per Scenario.
Systems 11 00538 g007
Figure 8. Unattended Rides per Scenario.
Systems 11 00538 g008
Figure 9. Service Quality per Scenario.
Systems 11 00538 g009
Figure 10. Sensitivity Analysis Results.
Systems 11 00538 g010
Figure 11. Effect of Ridesharing on SROI.
Systems 11 00538 g011
Figure 12. Effect of Ridesharing on Service Quality.
Systems 11 00538 g012
Disclaimer/Publisher’s Note: The statements, opinions and data contained in all publications are solely those of the individual author(s) and contributor(s) and not of MDPI and/or the editor(s). MDPI and/or the editor(s) disclaim responsibility for any injury to people or property resulting from any ideas, methods, instructions or products referred to in the content.

