Article

Assessing the Effects of Urban Digital Infrastructure on Corporate Environmental, Social and Governance (ESG) Performance: Evidence from the Broadband China Policy

1
School of Economics, Minzu University of China, Beijing 100081, China
2
China Institute for Vitalizing Border Areas and Enriching the People, Minzu University of China, Beijing 100081, China
3
Institute for Global Health and Development, Peking University, Beijing 100871, China
4
School of Economics, Peking University, Beijing 100871, China
*
Author to whom correspondence should be addressed.
These authors contributed equally to this work.
Systems 2023, 11(10), 515; https://doi.org/10.3390/systems11100515
Submission received: 4 September 2023 / Revised: 3 October 2023 / Accepted: 11 October 2023 / Published: 15 October 2023

Abstract

:
Urban digital infrastructure is the cornerstone of optimizing resource allocation and promoting sustainable economic development in the era of digital economy, and it will also affect corporate ESG performance. Based on the data of Chinese A-share listed companies from 2011 to 2021, an asymptotic difference-in-difference model is used to investigate the impact of urban digital infrastructure on corporate ESG performance based on the “broadband China” strategy and its underlying mechanism. This paper finds that urban digital infrastructure can promote corporate ESG performance. Further, urban digital infrastructure can contribute to corporate ESG performance by increasing research and development (R&D) investment, improving corporate governance, and increasing information transparency. Through heterogeneity analysis, the results show urban digital infrastructure contributes more significantly to the ESG performance of state-owned, small and medium, growth-stage, and low-profit companies and is more pronounced in non-heavy polluting companies and companies in the central and western regions. This paper has enhanced the theoretical framework of urban digital infrastructure and corporate ESG (environmental, social, and governance) performance, paving the way for a new approach to the collaborative development of cities and enterprises in pursuit of green and sustainable growth.

1. Introduction

With the rapid growth of the global economy, sustainable economics has gradually emerged as a significant driving force propelling continuous development in our era [1]. In recent years, the rising awareness of the importance of environmental protection and social responsibility has placed higher demands on corporate sustainability. Carbon peaking, carbon neutrality, and ecological civilization-building have become global consensuses, and all stakeholders expect companies to balance environmental and social impacts with economic growth. As early as 1992, the United Nations Environment Programme Finance Initiative (UNEPFI) stated that financial institutions were expected to integrate environmental, social, and corporate governance (ESG) considerations into their decision-making processes. As times have changed, stakeholder needs have shifted significantly in the investment arena. Investors are increasingly focused on labor rights, business ethics, and environmental protection. This shift has driven an important transformation in corporate sustainability. ESG as a system of indicators to assess the comprehensive sustainability of companies [2,3,4], is receiving widespread attention for its focus on environmental, social, and corporate governance aspects. The factors influencing ESG performance have been well explored in existing studies. Starting from the external environment, scholars have studied the influencing factors of ESG performance from social institutions [5], carbon regulatory policy risks [6], environmental policy uncertainty [7], digital finance [2], and multiculturalism [8]. Internally, research has examined the impact of several aspects on the performance of ESG, such as supervisory or collusive behaviors of major shareholders [9], heterogeneity of ownership structure [10], and digitalization of companies [11]. Despite the considerable amount of research focusing on ESG performance and its influencing factors, urban digital infrastructure, which serves as a “central node” and “transmission link” in modern economic systems, has yet to be included in the scope of consideration.
The digital era refers to the current period in our society and economic environment in which digital technology is highly prevalent and widely utilized [12]. In this era, the volume of information and data continues to expand, necessitating the use of digital technology for efficient processing and management of this extensive information and data. As the underlying logic supporting digital technology, urban digital infrastructure provides efficient information exchange and data storage capabilities. It offers the essential conditions required for businesses to engage in digital operations and address market challenges. At the same time, urban digital infrastructure is also an essential part of sustainable development. Through digital transformation, companies can better fulfill their social responsibilities and contribute to environmental protection and social welfare. At the moment, academics are studying the macro- and micro-level evolution of urban digital infrastructure. On a micro level, urban digital infrastructure empowers enterprises to leverage digital technologies like the Internet, big data, and blockchain [13]. This enables them to decrease transaction costs and enhance productivity, ultimately impacting corporate governance [14]. At the macro level, urban digital infrastructure impacts low-carbon development [15]. This means that while benefiting from the “low-carbon dividend” brought by urban digital infrastructure, governments and enterprises in developing countries have also achieved significant results in environmental sustainability. Furthermore, urban digital infrastructure contributes to reducing carbon emissions in Chinese cities [16]. These studies all suggest that urban digital infrastructure has some positive impact on sustainability [17]. ESG performance is a crucial metric for assessing a company’s sustainability [2]. Nevertheless, the current body of literature lacks concrete evidence regarding the direct impact of urban digital infrastructure on corporate ESG performance.
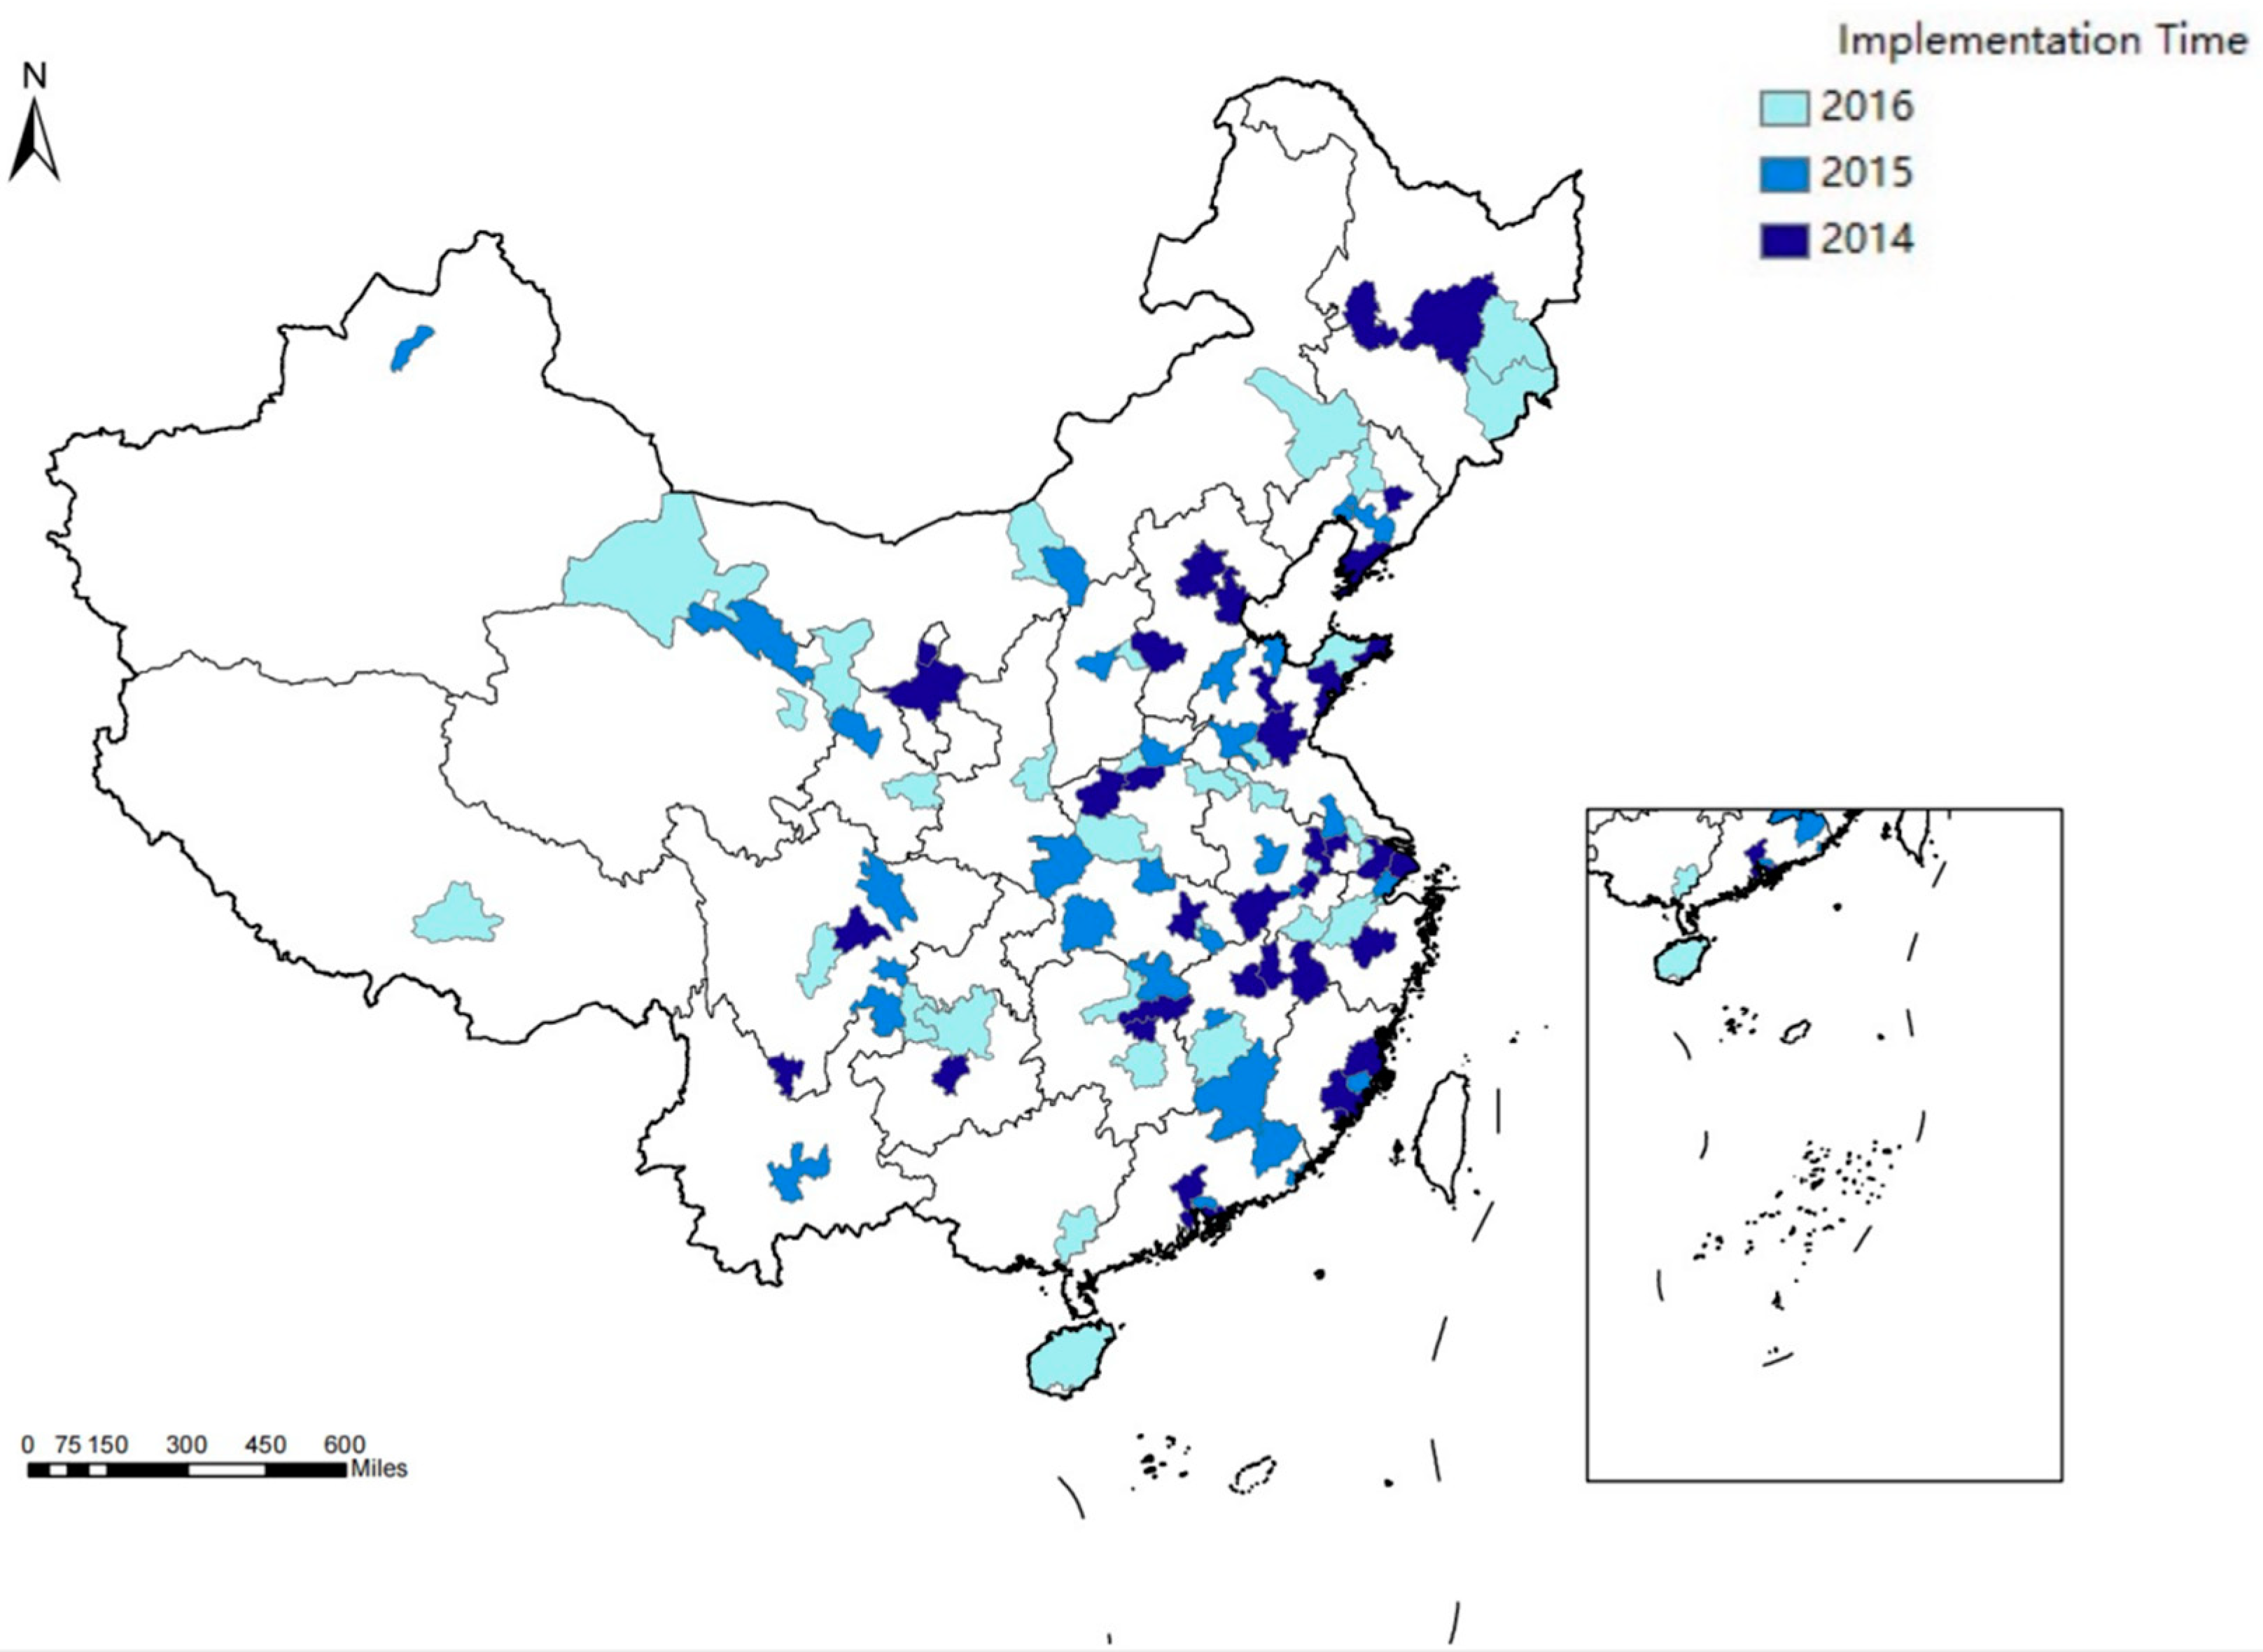
For this paper, the research sample comprises panel data from Chinese A-share listed companies spanning the period from 2011 to 2021. It employs the “Broadband China” strategy as a quasi-natural experiment to empirically examine the impact of urban digital infrastructure on corporate ESG performance. The “Broadband China” strategy selected 120 cities (grouped into three batches) in 2014, 2015, and 2016 as demonstration cities for the purpose of developing broadband infrastructure. 
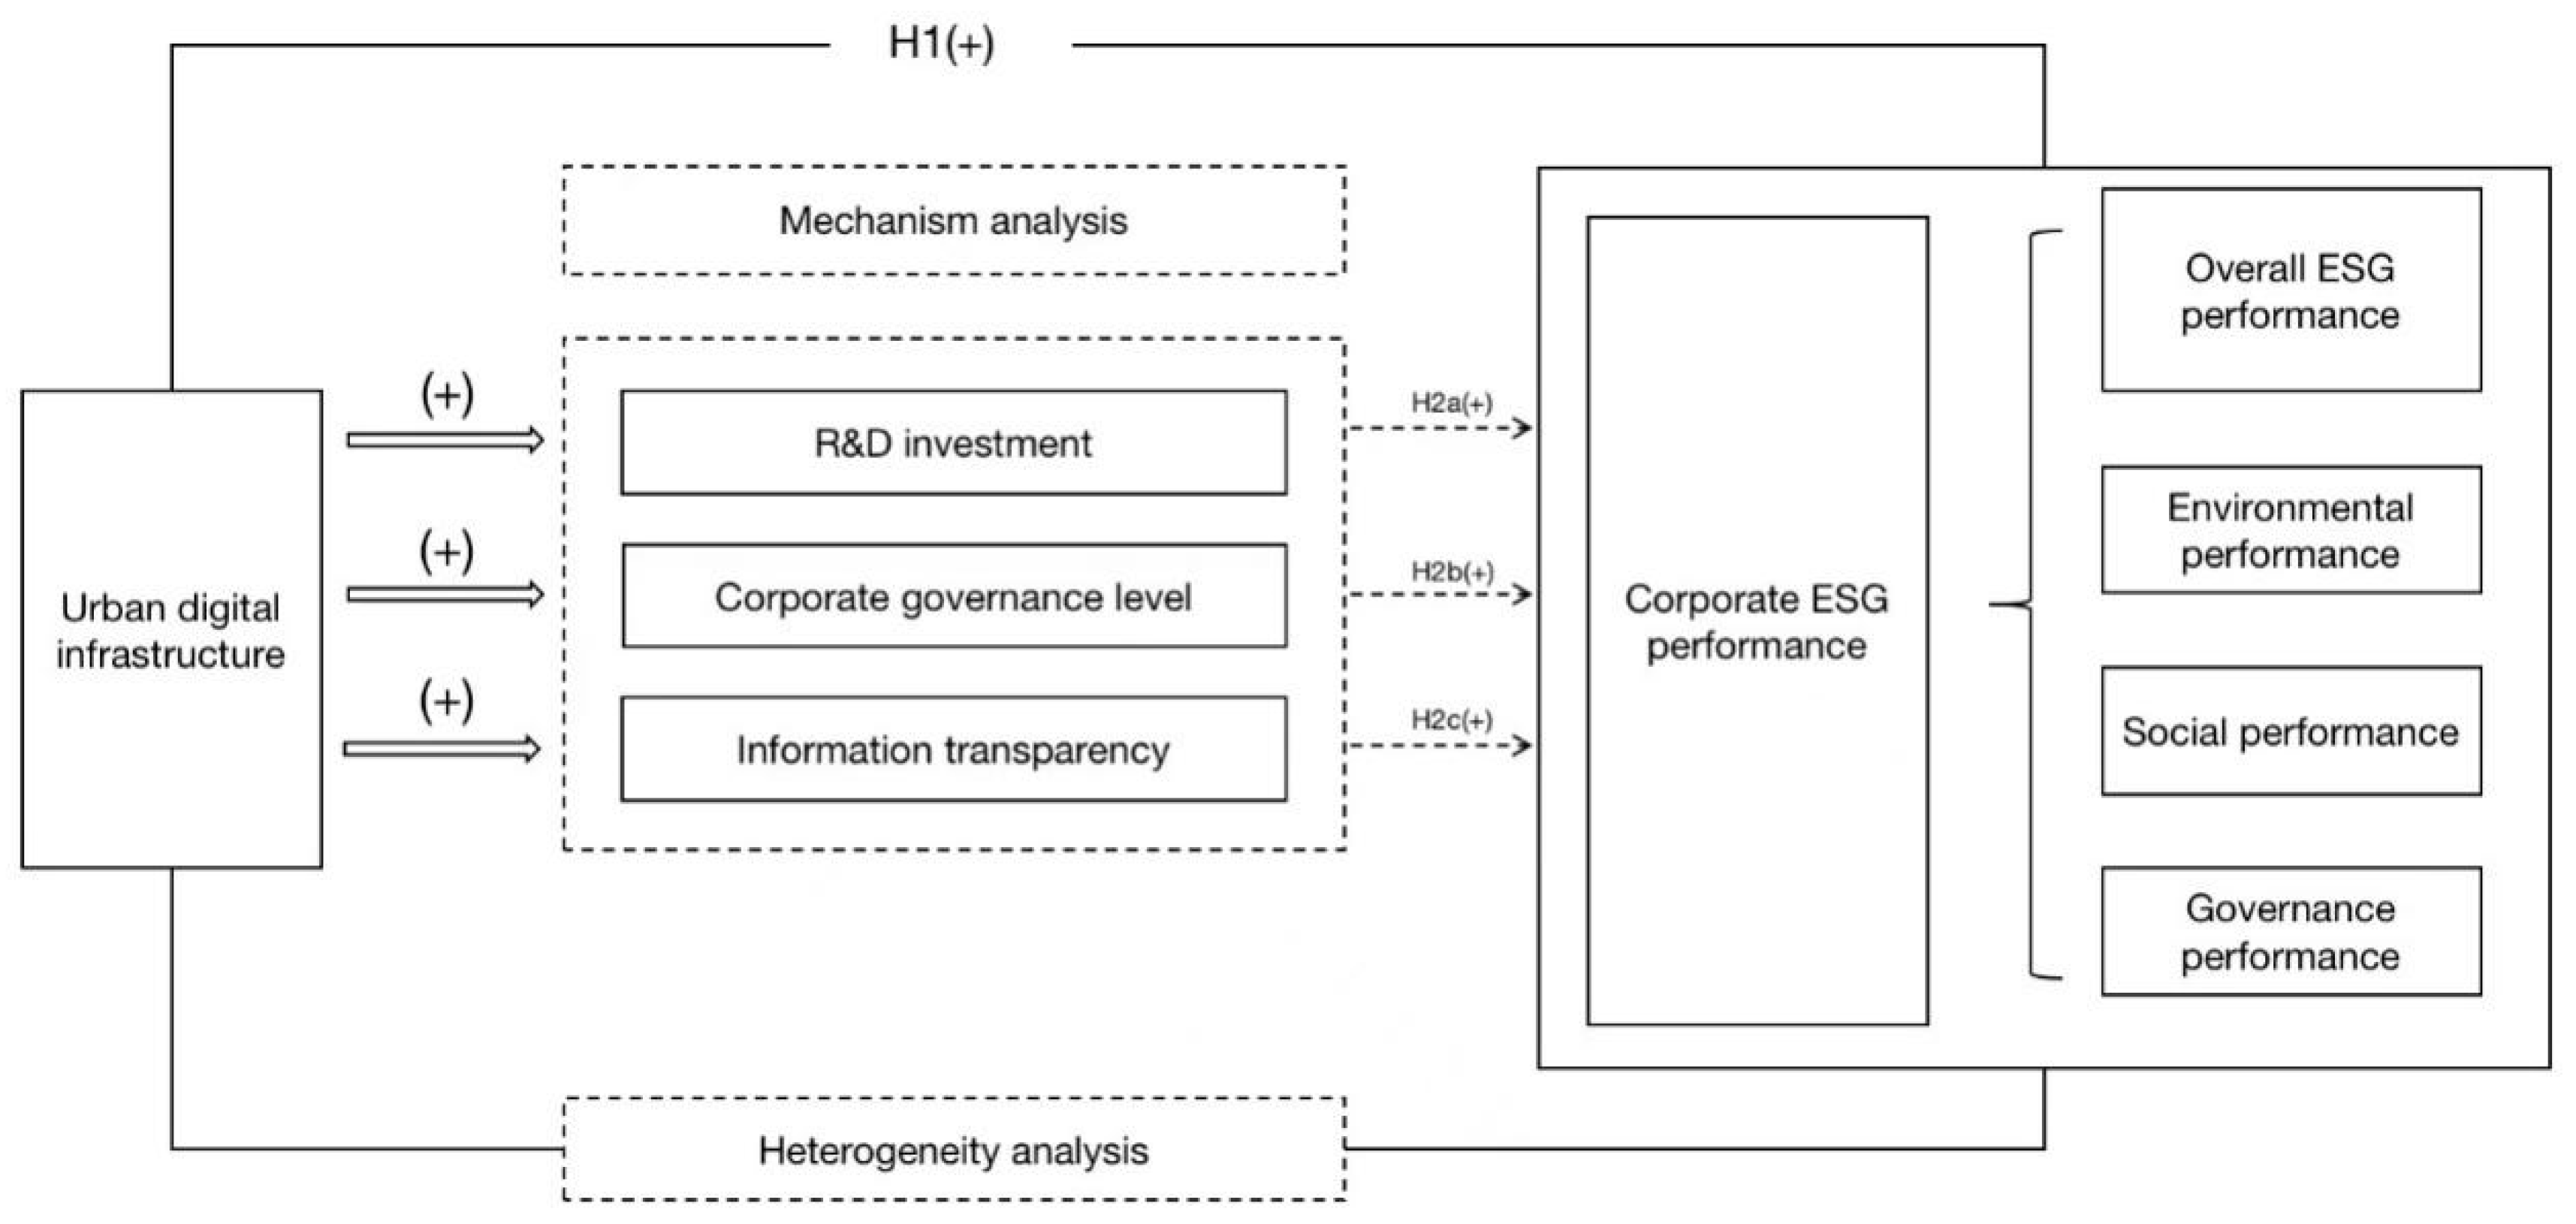
Figure 1 depicts the distribution of cities, with the various shades of blue signifying the various “Broadband China” strategy implementation years. The darker the color, the earlier the implementation year. The selection of these cities for the “Broadband China” strategy was conducted independently of the development status of local enterprises, thus establishing a relatively exogenous factor for companies. To create distinct groups, this paper divides the sample into an experimental group and a control group based on whether the registered location of listed companies falls within the designated “Broadband China” demonstration cities. The paper employs the difference in difference (DID) method to examine the impact of urban digital infrastructure on corporate ESG performance. The important finding from the research is that urban digital infrastructure can greatly improve corporate ESG performance. Additionally, robustness checks were conducted by incorporating macro-level factors, excluding samples from directly administered and provincial capital cities, and utilizing alternative rating agencies for the dependent variable. Secondly, the mechanism analysis indicates that urban digital infrastructure can promote corporate ESG performance by increasing R&D investment, enhancing corporate governance, and improving information transparency (Figure 2). Moreover, the influence of urban digital infrastructure on ESG performance demonstrates variations and heterogeneity. From a company-level perspective, urban digital infrastructure greatly promotes corporate ESG performance in state-owned enterprises, small-scale businesses, those in the growth phase, and companies with lower profitability. Urban digital infrastructure has a greater influence on promoting ESG performance in non-polluting enterprises and businesses registered in China’s central and western regions.
Compared to previous studies, this paper’s marginal contributions lie in the following three aspects. Firstly, this paper leverages the “Broadband China” strategy to create a quasi-natural experiment and empirically analyze the impact of urban digital infrastructure on corporate ESG performance, which enriches the research on the effects brought about by urban digital infrastructure. The utilization of quasi-natural experiments in this paper enhances the reliability of causal inferences. Quasi-natural experiment methods, which combine causal identification techniques such as randomized controlled trials, matching methods, and instrumental variable approaches, enable more accurate inference of causal effects. Secondly, in terms of paper quality, this paper contributes to the understanding of the variables affecting ESG performance. From existing research, scholars have already conducted extensive discussions on the variables affecting corporate ESG performance. In recent years, with the development of the digital economy, there has been literature focusing on the impact of digitalization on ESG performance, but most studies have been conducted from the perspective of digital finance, and less attention has been paid to the role of urban digital infrastructure. Urban digital infrastructure is the cornerstone of the development of digital economy and has a wider impact on economic and social development, but the existing literature has not paid enough attention to it, especially its role in ESG, and this paper makes up for the gap. Thirdly, the practical implications of this study are of significant importance for both businesses and policymakers. Through an examination of how the development of urban digital infrastructure impacts corporate ESG (environmental, social, and governance) performance, businesses can gain a deeper understanding of the critical role of digital infrastructure in achieving sustainable development goals and enhancing their ESG performance. This understanding can help businesses enhance their social reputation, attract investors and customers, and prepare for future sustainability initiatives. Additionally, policymakers can benefit from the research findings as they provide valuable insights and guidance. Policymakers can use these results to formulate policies that actively encourage businesses to participate in the development of urban digital infrastructure and incorporate ESG considerations into their strategic planning. These policies can contribute to reducing information asymmetry, enhancing information transparency, and increasing external oversight of businesses, thereby motivating companies to fulfill their social responsibilities more effectively. Overall, these measures have the potential to improve corporate ESG performance while also supporting the achievement of sustainable development goals.
The structure of this paper is as follows: Section 2 presents theoretical analysis and research hypotheses. The model creation process, pertinent variables, and a description of the paper’s data are all included in Section 3. Section 4 presents regression results and robustness test regarding the impact of urban digital infrastructure on ESG performance, further examining mechanism analysis and heterogeneity analysis. Section 5 offers a thorough summary of the report and emphasizes the conclusions drawn from the research.

2. Theoretical Analysis and Research Hypotheses

2.1. The Impact of Urban Digital Infrastructure on Corporate ESG Performance

Whether a company can improve its ESG performance depends not only on its internal knowledge base but also on its ability to integrate and utilize external information effectively [18]. Specifically, companies need to understand external information to establish ESG strategies aligned with their values and business focus. A company’s understanding of market and customer demands, regulatory and government dynamics, and industry and competitive landscape can guide them in formulating and optimizing its ESG strategies, ultimately improving its corporate ESG performance. At the same time, companies need to collect, clean, and analyze a vast amount of ESG information to measure their ESG performance. This includes property and capacity data, supply chain and partner information, as well as social and human-resources related external information. Urban digital infrastructure can establish ESG information exchange platforms, reducing the cost of ESG information dissemination and thereby facilitating corporate ESG performance. Specifically, urban digital infrastructure can build bridges for the free flow of ESG information. Geographical distances can hinder the free flow of information. However, urban digital infrastructure can to some extent break spatial constraints [19], establishing channels for the free circulation of information, and promoting resource sharing. This, in turn, stimulates the innovation capacity and sustainability awareness of enterprises, ultimately enhancing their ESG performance. Moreover, robust urban digital infrastructure reduces the search and transmission costs of ESG information. It lowers the cost of searching for the latest R&D outcomes and facilitates the transmission of vast amounts of information. This accelerates the dissemination and exchange of ESG information, providing companies with abundant resources to enhance their ESG performance. Lastly, the diverse and convenient methods facilitated by urban digital infrastructure, such as video calls and online meetings, greatly facilitate the collision and integration of information. This accelerates cooperation efficiency among various nodes in the value chain [20], which is beneficial for enhancing corporate ESG performance.
This paper suggests hypothesis 1 in light of the analyses previously mentioned.
H1. 
Urban digital infrastructure has a positive impact on corporate ESG performance.

2.2. The Mediating Role of R&D Investment, Corporate Governance Level, and Information Transparency

Drawing upon existing research, urban digital infrastructure provides a material foundation for improving corporate ESG performance. This paper elucidates the pathways through which urban digital infrastructure promotes corporate ESG performance from two perspectives: internal management and external relationships. Corporate governance and R&D investments place a strong emphasis on organizational design, decision-making processes, management, and resource allocation inside the business to ensure its long-term sustainable growth. When viewed in terms of external relations, the level of information transparency focuses on the transparency of financial, operational, and governance information that the company publicly provides. It aims to enhance trust and cooperation between the company and shareholders, investors, media, and government, thereby influencing the company’s healthy development.

2.2.1. Digital Infrastructure Enhances Corporate ESG Performance through R&D Investment

The construction of digital infrastructure has, to some extent, increased corporate R&D investment, subsequently enhancing corporate ESG performance. Firstly, the integration of digital applications, such as artificial intelligence, big data, and blockchain, with R&D enables real-time information dissemination [21]. Electronic commerce platforms and other digital channels facilitate efficient communication between buyers and sellers, effectively reducing information exchange costs for businesses, as well as internal operational expenses and other economic activity costs. The reduction in various costs improves the profitability of enterprises, thereby incentivizing increased R&D investments [22]. Furthermore, increased R&D investment can encourage companies to engage in autonomous innovation and product upgrades, which contributes to the renewal of product manufacturing processes and the enhancement of technological innovation capabilities. Through these means, enterprises can enhance production efficiency across various departments, optimizing corporate ESG performance. In addition, R&D investment can also improve a company’s environmental performance by influencing the intensity of energy and carbon emissions, aligning with the perspectives of natural resource-based theories [23].
We recommend hypothesis H2a based on the analysis provided above.
H2a. 
Urban digital infrastructure promotes corporate ESG performance by increasing R&D investment.

2.2.2. Digital Infrastructure Enhances Corporate ESG Performance by Improving Corporate Governance

Urban digital infrastructure contributes to the enhancement of corporate governance within organizations [24]. The application of large-scale urban digital infrastructure enables organizations to adopt a more networked and flattened organizational structure. Various internal components of the organization are standardized and digitized through the integration of various digital technologies into their production, operations, and management processes, facilitating the rapid and accurate transmission of information [25]. Consequently, the internal governance level of enterprises is elevated. The improvement in internal governance level aids enterprises in accurately addressing various environmental, social, and governance risks. By establishing flexible risk management mechanisms and crisis response plans, enterprises can effectively respond to risk events, reduce adverse impacts on business operations and stakeholders, and thereby safeguard long-term interests and sustainable development. Furthermore, high-level governance is often associated with a long-term value perspective [26], prioritizing not just short-term profits but also long-term sustainability. This encourages enterprises to focus on long-term viability, including the achievement of ESG objectives.
Based on the paper above, we put forward hypothesis H2b:
H2b. 
Urban digital infrastructure promotes corporate ESG performance by improving corporate governance.

2.2.3. Digital Infrastructure Enhances Corporate ESG Performance by Increasing Information Transparency

The growth of urban digital infrastructure improves information openness within businesses [27,28], helping them to fulfill their corporate social obligations. When there is information asymmetry between company management and external stakeholders, the management may selectively disclose social responsibility information to maximize their benefits. This selective disclosure can harm the interests of external stakeholders and significantly hinder the company’s sustainable development. In an era where urban digital infrastructure is being developed quickly, technologies like blockchain and artificial intelligence make it possible to track and record business actions, increasing the extent of information disclosure [29]. Simultaneously, with the rise of information technology and the advent of the internet, communication methods have undergone enhancements, giving rise to novel communication channels, alleviating communication costs [30,31], and achieving greater information transparency [32,33]. On the one hand, increased information transparency helps investors to assess specific fixed characteristics of a company more accurately [34], leading to a gradual reduction in the information gap between the company and external stakeholders. At the same time, stakeholders can utilize urban digital infrastructure to participate in the company’s decision-making processes. Various convenient methods, such as video calls and online meetings, enable them to communicate their value propositions and enhance the awareness of corporate social responsibility. Corporate social responsibility contributes to enhancing a company’s image [35], thereby achieving higher ESG ratings. On the other hand, increased information transparency expands the governance boundaries of the capital market, allowing companies to easily attract investors, analysts, market intermediaries, and other stakeholders. This helps reduce information asymmetry [36], enhance information transparency, and increase external monitoring pressure on the company [37], thereby driving the company to fulfill its social responsibilities.
We suggest hypothesis H2c based on the analysis presented above:
H2c. 
Urban digital infrastructure positively influences corporate ESG performance by enhancing information transparency.

2.3. The Heterogeneous Impact of Urban Digital Infrastructure on Corporate ESG Performance

Companies come in a variety of shapes and sizes, as well as in different regions, stages of development, and industries. As a result, there are variations in how the expansion of urban digital infrastructure affects corporate ESG performance. The heterogeneity of this impact is examined in this article at the regional, industry, and firm levels.
At the business level, four parameters can be used to assess the heterogeneity of the influence of urban digital infrastructure on corporate ESG performance: ownership nature; company size; corporate life cycle; and profitability status. In terms of the nature of ownership, the coexistence of state-owned listed companies and non-state-owned listed companies, including privately-owned listed companies, is a critical institutional background in China’s capital market [38]. State-owned businesses often experience greater pressure than non-state-owned businesses to strike a balance between the interests of stakeholders and social obligations, and they are also expected to take on more duties related to public benefit and social welfare. In this context, urban digital infrastructure can serve as a crucial means for providing public services and promoting social welfare, helping state-owned enterprises fulfill their social responsibility requirements. In terms of company size, small-scale enterprises often face limited resources and capabilities, including financial, human, and technological aspects. Urban digital infrastructure may give small-scale enterprises more excellent opportunities and means to improve their ESG performance. It can provide more effective, innovative, and sustainable solutions, assisting small businesses in developing corporate governance, social responsibility, and environmental management practices. In contrast, large-scale enterprises may already possess more resources and capabilities to address ESG challenges. Therefore, the impact of urban digital infrastructure on ESG performance may be less significant. In terms of the company lifecycle, enterprises in the growth stage are typically experiencing rapid development and expansion. Their business models, processes, and technologies require continuous investment and improvement. Urban digital infrastructure provides a robust technological foundation and digital solutions that help enterprises in the growth stage improve efficiency, innovate products and services, and better address ESG challenges. In contrast, mature and declining-stage enterprises may have already established relatively stable business models, so the impact of urban digital infrastructure on their ESG performance is relatively small. Furthermore, growth-stage enterprises often face limited resources and capabilities, including finance, human resources, and technology. Urban digital infrastructure can provide additional resources and support to help improve the ESG performance of growth-stage enterprises. In contrast, mature and declining-stage enterprises may already possess a certain level of resources and capabilities and may prioritize maintaining and managing existing ESG standards. As a result, the impact of urban digital infrastructure on their ESG performance may be relatively smaller. In terms of profitability, low-profit enterprises often face more significant risks and challenges, including financial stability, market share competition, and reputation risks. Therefore, they have more motivation to improve their ESG performance to mitigate these risks and enhance the sustainability and competitiveness of the business. Urban digital infrastructure can assist low-profit enterprises in enhancing environmental management, social responsibility, and corporate governance, achieving significant progress in ESG performance. In contrast, high-profit enterprises may already have favorable financial conditions and market positions, resulting in lower demand for ESG improvements. As a result, their ESG performance may be less significantly affected by the expansion of urban digital infrastructure.
The proposed hypothesis H3a is based on the analysis presented above:
H3a. 
State-owned, small and medium-sized, mature, and high-profit enterprises all significantly promote the impact of urban digital infrastructure on corporate ESG performance.
Industry-level heterogeneity is examined in terms of whether the company is a heavy polluter to investigate the heterogeneous impact of urban digital infrastructure on corporate ESG performance. Non-heavy polluting businesses typically place a higher priority on sustainability and environmental responsibility. They are more willing to invest in urban digital infrastructure to improve environmental impact and meet societal expectations. In contrast, heavy-polluting companies may face more significant challenges in terms of environmental responsibility and may have fewer investments in urban digital infrastructure. Regarding business model differences, non-polluting companies may be more inclined to adopt clean and sustainable business models. Urban digital infrastructure can give them more opportunities for efficient resource utilization, reduce environmental impact, and drive green innovation. The business models of polluting companies may conflict with environmental concerns, which can result in a relatively smaller impact of urban digital infrastructure on their ESG performance. Regarding risk management needs, non-polluting companies may face relatively lower environmental and social risks. Urban digital infrastructure can help them better manage and mitigate these risks. However, polluting companies face a greater variety and complexity of risks, making it challenging for urban digital infrastructure to address these issues comprehensively.
The proposed hypothesis H3b is based on the analysis presented above:
H3b. 
The promoting effect of urban digital infrastructure on corporate ESG performance is more significant in non-polluting industries.
We examine the spatial heterogeneity of the impact of urban digital infrastructure on corporate ESG performance by taking into account enterprises in the central-western and eastern regions. In terms of infrastructure needs, companies in the central-western region may need more developed infrastructure. Urban digital infrastructure can help bridge this gap by providing more efficient and reliable information and communication networks, thus improving production efficiency and business management for these companies. In contrast, companies in the eastern region have already benefited from better infrastructure conditions. Therefore, the impact of urban digital infrastructure on ESG performance may be more minor. The comparatively underdeveloped condition of the central and western regions makes urban digital infrastructure a more important driving force for their advancement in terms of regional development inequalities. By leveraging urban digital infrastructure, companies in the central and western regions can better integrate into a global competition, enhance their innovation capabilities, and gain market access and sustainable development opportunities. Companies in the eastern region are already relatively mature and developed, so the impact of urban digital infrastructure on their ESG performance may be relatively limited.
The proposed hypothesis H3c is based on the analysis presented above:
H3c. 
For businesses in the central and western areas, the enhancing impact of urban digital infrastructure on ESG performance is particularly pronounced.

3. Research Methodology

3.1. Model Construction

This paper analyzes the “Broadband China” pilot policy as a quasi-natural experiment to determine the average impact of urban digital infrastructure on corporate ESG performance. The paper employs a multi-period DID model for examination, considering the limitations of the traditional DID model with a single time point for policy implementation. The “Broadband China” pilot policy was implemented in 2014, 2015, and 2016. The multi-period DID model captures the progressive implementation of the same policy across different groups. The specific approach is as follows:
E S G i t = α 0 + α 1 D i g i t + α i c o n t r o l s i t + μ i + υ t + ε i t
In the equation, E S G i t represents the ESG performance of listed company i in year t. The D i g i t represents whether the registered location of the listed company i is a “Broadband China” pilot city in year t. α 0 represents the intercept term. c o n t r o l s i t represents the set of control variables. μ i represents individual fixed effects, and υ t represents time-fixed effects. ε i t represents the random disturbance term. α 1 represents the average causal effect of urban digital infrastructure on corporate ESG performance. If α 1 is greater than 0, it indicates that urban digital infrastructure positively impacts corporate ESG performance. Conversely, if α 1 is less than 0, it suggests a suppressing effect.
It is reiterated that the focus of this paper is to confirm how the growth of urban digital infrastructure affects corporate ESG performance through elements like higher R&D investment, improved corporate governance, and increased corporate transparency. This paper combines the steps of constructing a mediation effect model. Based on model (1), Models (2) and (3) are constructed as follows:
I n m e d i a i t = β 0 + β 1 D i g i t + β i c o n t r o l s i t + μ i + υ t + ε i t
E S G i t = ρ 0 + ρ 1 D i g i t + ρ 2 Ι n m e d i a i t + ρ i c o n t r o l s i t + μ i + υ t + ε i t
In Model (2) and Model (3), I n m e d i a i t represents the mediating variables, including RD for R&D investment, G e v o r n for corporate governance level, and D S C O R E for corporate transparency. In Model (2), the coefficient β 1 of D i g represents the impact of urban digital infrastructure on the mediating variable. If the coefficient β 1 of variable D i g in Model (2) and the coefficient ρ 2 of variable D i g in Model (3) are both significant, it indicates that variable I n m e d i a i t serves as a mediating pathway through which urban digital infrastructure affects corporate ESG performance.

3.2. Variables

3.2.1. Explained Variable

This paper refers to the methods of Hu et al [15]. Based on the enterprise ESG ratings in the Huazheng Database, the following ratings are assigned to the corresponding categories: AAA is given the value of 9, AA is given the value of 8, A is given the value of 7, BBB is given the value of 6, BB is given the value of 5, B is given the value of 4, CCC is given the value of 3, CC is given the value of 2, and C is given the value of 1. The ESG performance (ESG), environmental performance (Environ), social performance (Social), and governance performance (Govnce) of the companies are all measured by these ratings. The natural logarithm of the allotted scores is used in this paper as the benchmark for measuring ESG performance. A higher score denotes the companies’ improved ESG performance.

3.2.2. Explanatory Variable

In order to achieve better causal inference, this paper did not directly select specific indicators at the city level to measure urban digital infrastructure. Instead, virtual variables (Dig) were created based on the event of a company’s registered location being selected as a “Broadband China” demonstration city at different periods. The variable is given a value of 1 if the observation time was after the year when a company’s registration location was chosen as a “Broadband China” demonstration city during the sample period (i.e., the treatment group); otherwise, it is given a value of 0 [39].

3.2.3. Mediating Variables

R&D Investment
This paper measures the intensity of R&D investment using the ratio of total R&D expenses to operating income. It is denoted as RD. A higher RD value indicates the company’s higher level of R&D investment.
Corporate Governance Level
Building upon relevant studies conducted by Mohanty and Mishra [40], this paper employs principal component analysis (PCA) to construct a comprehensive indicator that measures the level of corporate governance from multiple aspects, such as decision-making, supervision, and incentives. The metric of whether the chairperson and manager positions are combined represents the decision-making authority of the CEO. The incentive mechanism in corporate governance is indicated by executive salary and the executive shareholding ratio. The percentage of independent directors and the size of the board are used to illustrate the board of directors’ oversight functions. The institutional ownership and equity balance ratios indicate the ownership structure’s monitoring role. Using principal component analysis, a composite index of corporate governance, abbreviated “Gov”, is created based on the aforementioned indicators. In the first principal component, the loading coefficients of the seven variables, namely executive compensation, executive shareholding ratio, independent director ratio, the board size, institutional shareholding ratio, equity balance ratio, and whether the chair and CEO positions are combined, are 0.331, 0.461, −0.502, 0.432, 0.289, −0.109, and −0.379, respectively. According to the size of the loading coefficients, the executive shareholding ratio, independent director ratio, and board size have a considerably greater impact on governance than other measures.
Information Transparency
The degree to which external information users can successfully access particular information about a publicly traded company, such as annual reports, various information disclosure announcements, analyst reports, and corporate resource disclosure information, is referred to as transparency, according to the definition given by Bushman et al. [41]. This paper measures information transparency using the Disclosure Score (SCORE) provided by the Shenzhen Stock Exchange for annual information disclosure evaluations of Shenzhen-listed companies. The assessment of information disclosure performance is categorized into four grades (A, B, C, D) based on the level of information transparency, ranging from high to low (excellent, good, qualified, and unqualified). This information is disclosed on the website of the Shenzhen Stock Exchange, and the annual information disclosure index (DSCORE) for Shenzhen-listed companies is manually collected. Higher scores on the DSCORE, which has a scale from 1 to 4, indicate greater levels of information transparency.

3.2.4. Control Variables

Based on previous studies [42,43], this paper selects variables such as firm size ( S i z e ), leverage ratio ( L e v ), return on assets ( R O A ), ownership structure ( I n d e p ), equity multiplier ( E q u i t y ), and Tobin’s Q ( T o b i n Q ) as control variables. Firm size ( S i z e ) reflects the operational scale and market competitiveness of a company. Larger companies are more likely to access external funding, which to some extent can alleviate their financial pressure [44]. In addition, these large companies are “too big to fail,” which increases their chances of obtaining more financial support under government guarantees. The leverage ratio ( L e v ) reflects a company’s ability to acquire external funding. The leverage ratio, to some extent, represents the company’s risk exposure, which could be a factor influencing corporate ESG performance. The return on assets ( R O A ) reflects a company’s profitability. This indicator effectively demonstrates the company’s performance in generating income and efficiently utilizing its assets, which can contribute to corporate ESG performance. The ownership structure ( I n d e p ) can reflect the composition of decision-makers within a company, significantly impacting ESG performance. Tobin’s Q ( T o b i n Q ) is commonly used as an essential indicator to measure a company’s performance and growth [2]. Corporate ESG performance is not only related to a company’s financial indicators but is also influenced by the economic and environmental context in which it operates. In this paper, regional industrial structure ( I N D s t ) and population growth rate ( p o p ) are selected as control variables at the city level. It is recognized that regional industrial structure has a significant impact on a company’s sustainable development. The variables and specific information can be found in Table 1.
This paper uses data from 2011 to 2021 on A-share listed companies in China and 323 cities. The data primarily comes from the China Stock Market & Accounting Research Database (CSMAR) and Wind Database (WIND). Some data, such as the disclosure assessment results of listed companies, were manually collected and compiled. The information on “Broadband China” pilot cities comes from the “Notice on the Development of Creating “Broadband China” Demonstration Cities (City Clusters)” published in 2014, 2015, and 2016 by the National Development and Reform Commission and the Office of the Ministry of Industry and Information Technology. Due to missing data and undisclosed information, the following data treatments were conducted in this paper: 1. excluding samples with ST and PT status, as well as those with missing values in key variables; 2. excluding samples with less than six years of continuous data; 3. to control for extreme values’ interference, this paper cut all variables by truncating them at the 1st and 99th percentiles.

4. Results

4.1. Descriptive Statistics

The significant factors in this paper’s descriptive statistics are shown in Table 2. The mean (median) of the logarithm of Huazheng ESG Composite Score, which measures corporate ESG performance, is 1.370 (1.386), with a standard deviation of 0.327. The enormous disparity in ESG scores among various organizations is indicated by the wide gap between the maximum and minimum values. The standard deviation of the control variable “firm size” is 1.389, indicating a significant variation in size among different listed companies. The standard deviation of TobinQ from the viewpoint of company value is 1.684, showing a significant difference among businesses. The return on assets (ROA) represents the profitability of the company, and the minimum value is negative. It is observed that the profitability situation of some companies is not optimistic. Additionally, the descriptive statistical analysis of the control variables identifies notable variations between the companies. This confirms the appropriateness of selecting these variables as control variables, as they effectively capture the substantial variations among the firms.

4.2. Regression Results and Analysis

Table 3 displays the findings of the baseline regression analysis using Model (1). The paper uses stepwise regression as its methodology. Columns (1) to (4) take time and personal effects into consideration as we analyze how urban digital infrastructure affects three important sub-indicators and corporate ESG performance. The regression coefficient of urban digital infrastructure on corporate ESG performance is 0.016 and passes the significance test at the 5% level. In Columns (5) to (8), where additional control variables are included, the regression result of urban digital infrastructure on corporate ESG performance is 0.021, passing the significance test at the 1% level. The conclusion is still true. This suggests that there is a strong positive correlation between the two, with corporate ESG performance improving with more urban digital infrastructure. Specifically, listed companies’ environmental and governance aspects have significantly improved due to urban digital infrastructure in their respective locations. As a result, companies are more inclined to allocate resources to areas such as energy management, corporate organizational governance, and internal ethical risk management.

4.3. Robustness Test

To ensure the stability of the core hypotheses mentioned earlier, this paper conducts robustness tests using several methods, including parallel trend analysis, placebo effects, PSM-DID, incorporating macroeconomic factors, excluding directly governed cities and provincial capitals from the regression, and replacing the rating agency of the dependent variable.

4.3.1. Parallel Trend Analysis

This paper utilizes the event study approach to evaluate the parallel trend since it is assumed that the experimental and control groups had parallel trends before the adoption of the policy (Figure 3). Parallel trend analysis presents the outcomes. All coefficients are not significant before the policy pilot is put into action. This suggests that before the introduction of urban infrastructure, the ESG performance of the experimental and control groups had parallel patterns. In the fourth year after the policy implementation, the two groups significantly differ in ESG performance. This shows that from the standpoint of dynamic impacts, the growth of urban digital infrastructure has short- and long-term effects on corporate ESG performance. In summary, the treatment and control groups’ development trends were parallel before the policy implementation. The DID model designed in this paper is compelling.

4.3.2. Placebo Effect

In the baseline regression of this analysis, various factors that could affect corporate ESG performance were previously taken into account. However, it is still difficult to determine whether there are other important omitted variables. Therefore, following the approach of scholars, a placebo test using random sampling is conducted to verify the issue of omitted variables. In this paper, specifically, while keeping the order of control variables unchanged, a placebo test is conducted by randomly selecting policy variables from the sample of pilot cities and periods. A total of 500 iterations of the regression analysis are run while accounting for firm fixed effects and time effects.
Figure 4 presents the findings. The regression coefficient of 0.021 is a low probability event, indicating that the omission of variables is unlikely to have an impact on the core findings of this paper.

4.3.3. PSM-DID

This paper uses the PSM-DID model to reduce the effect of sample bias on the results of the baseline regression to address the problem of sample selection bias. By categorizing the sample into an experimental group consisting of companies registered in “Broadband China” demonstration cities and a control group consisting of companies registered in non- “Broadband China” demonstration cities, and matching individuals with similar characteristics in both groups, the paper aims to simulate the “counterfactual” scenario to the greatest extent possible. Specifically, following the approach of Giannetti et al. [45], propensity scores are calculated through regression analysis using other control variables as benchmarks, and then matching is conducted based on these propensity scores. To ensure the robustness of the matching results, this paper employs three methods for matching: 1:2 nearest neighbor matching; radius matching (with a radius of 0.01); and kernel matching. All of these methods have passed the parallelism test.
The findings of the repeated regression analysis on the matched sample are presented in Table 4.The regression coefficients between the growth of the urban digital infrastructure and corporate ESG performance are continuously significant and positive. This provides evidence that even after controlling for sample selection bias, urban digital infrastructure continues to significantly promote corporate ESG performance.

4.3.4. Add Macro Variables

Only company-level metrics were taken into account in the baseline regression; however, macroeconomic variables should also be taken into account when analyzing factors affecting corporate ESG performance. In this paper, regional industrial structure ( I N D s t ) and population growth rate ( p o p ) were used as macroeconomic indicators, and these variables were added to the regression to obtain further empirical results, as shown in Table 5. The coefficient of the variable “Dig” is significantly positive, even after considering the impact of macroeconomic factors. This suggests that urban digital infrastructure can still have a significant promoting effect on corporate ESG performance.

4.3.5. Excluding Mega-Cities and Provincial Capitals

Mega cities and provincial capital cities have much more developed urban digital infrastructure than other prefecture-level cities; hence, this paper re-estimated the model after removing these cities to reduce any bias in the total estimation. The estimation results are presented in Table 6. It is evident that urban digital infrastructure significantly improves corporate ESG performance. Specifically, urban infrastructure enhances corporate governance, but its impact on environmental and social dimensions is relatively smaller.

4.3.6. Changing the Rating Agency of the Explanatory Variable

The dependent variables for the regression analysis in this paper are the ESG performance scores from three rating agencies, namely Wind, Bloomberg, and HuaZheng. The regression results, as shown in columns (1) to (3) of Table 7, reveal coefficients of 0.209, 0.576, and 0.021 and the development of urban digital infrastructure significantly improves corporate ESG performance.

4.4. Mechanism Analysis

The empirical results indicate that urban digital infrastructure improves corporate ESG performance. So, what are the underlying mechanisms behind this influence? Through the mechanisms of R&D investment, corporate governance level, and information transparency based on models (2) and (3) in turn, this paper tests whether urban digital infrastructure has a positive impact on corporate ESG performance. The regression results are shown in Table 8 and are based on the model (1).

4.4.1. Intrinsic Mechanisms of Urban Digital Infrastructure Affecting Corporate ESG Performance: R&D Investment

Columns (1) to (2) of Table 8 combined show the regression results for the effect of R&D expenditure and urban digital infrastructure on corporate ESG performance. The Dig regression coefficient in column (1) is 0.107, which is significant at the 1% level. This indicates that urban digital infrastructure positively effects promoting companies’ R&D investment. In column (2), when both the Dig variable and R&D investment (RD) are included, the regression coefficient for Dig is 0.066, and for RD it is 0.007. At the 1% level, both coefficients are significant. This confirms that R&D investment is a vital transmission pathway through which urban digital infrastructure influences corporate ESG performance. The Sobel test further supports the existence of the mediating role played by R&D expenditure. By calculation, it is found that the indirect effect through the pathway of R&D investment accounts for approximately 14.14% of the total effect. This suggests that urban digital infrastructure can promote corporate ESG performance by enhancing R&D investment.

4.4.2. Urban Digital Infrastructure Promotes Corporate Governance Level for Corporate ESG Performance

The regression results for the influences of corporate governance level and urban digital infrastructure on corporate ESG performance are shown in columns (3) to (4) of Table 8. In column (3), the regression coefficient for the urban digital infrastructure variable (Dig) is 0.035, which is significant at the 1% level. This indicates that urban digital infrastructure is beneficial for enhancing corporate governance level. The regression coefficients of Dig and corporate governance level (Gevorn) are 0.021 and 0.017, respectively, after adding both urban digital infrastructure variables (Dig) and corporate governance level (Gevorn) in column (2), and both are significant at the 1% level. This verifies that the level of corporate governance is a vital transmission pathway for urban digital infrastructure to influence corporate ESG performance. Furthermore, in conjunction with the Sobel test, the mediating effect of the corporate governance level variable is confirmed. By calculation, it is found that the indirect effect of the corporate governance level pathway accounts for approximately 71.98% of the total effect. This indicates that urban digital infrastructure can promote corporate ESG performance by enhancing corporate governance, and overall, the indirect effects are substantial.

4.4.3. Urban Digital Infrastructure Enhances Corporate ESG Performance by Increasing Information Transparency

The regression coefficient of the urban digital infrastructure variable (Dig) in column (5) in Table 8 is similarly seen to be significantly positive at the 5% level from column (5) to column (6). This suggests that improving urban digital infrastructure will increase the transparency of company information. The regression coefficients for the growth of the urban digital infrastructure (Dig) and information disclosure transparency (DSCORE) are 0.017 and 0.077, respectively, in column (6). The coefficients have a 10% and 1% significance level, respectively. It is confirmed that improving information transparency is a vital transmission pathway through which urban digital infrastructure enhances corporate ESG performance. Furthermore, it can be seen from the results of the Sobel test that the indirect impact of information openness is responsible for roughly 11.92% of the overall effect. This shows that by increasing information transparency, urban digital infrastructure might support corporate ESG performance.

4.5. The Heterogeneity Analysis of Digital Infrastructure on Corporate ESG Performance

This paper evaluates the effect of developing urban digital infrastructure on corporate ESG performance and its underlying processes across the entire sample by performing many robustness checks. It is crucial to keep in mind, nonetheless, that depending on the company characteristics or business sectors, the relationship between urban digital infrastructure and corporate ESG performance may change. Using this information, the research analyzes heterogeneity at the business, industry, and regional levels. The research takes into account variables including profitability, life cycle, business size, and ownership structure at the firm level. At the industry level, the analysis considers factors such as pollution intensity. The regional level includes the Midwest and the East.

4.5.1. Firm-Level Heterogeneity Analysis

The empirical results in Table 9 indicate that in terms of ownership structure, urban digital infrastructure positively impacts corporate ESG performance. The difference between the coefficients for state-owned and non-state-owned businesses, however, suggests that state-owned businesses are more strongly affected by urban digital infrastructure in terms of ESG performance. According to the survey, state-owned businesses are better at negotiating policies and can more easily take advantage of the growth of the urban digital economy by leveraging their national reputation. At the same time, state-owned enterprises are expected to take on greater responsibilities in terms of environmental and social aspects. To contribute to national policies, improve their digital skills, and encourage high-quality and environmentally friendly urban development, state-owned businesses should lead the way.
Based on the natural logarithm of total assets, the paper separates businesses into small- and medium-sized enterprises and large-scale enterprises. Table 9’s columns (3) and (4) show that small-scale businesses are more significantly impacted by the growth of urban digital infrastructure than large-scale businesses are. This could be because small-scale companies are generally more flexible and adaptable than large-scale companies. They are more likely to embrace and adopt new digital technologies and workflows, facilitating their transformation and upgrading efforts, ultimately leading to improved ESG performance. Furthermore, in terms of risk control, urban digital infrastructure can help small-scale companies reduce costs, improve efficiency, and optimize risk management. Additionally, small-scale companies often have a relatively more straightforward process for implementing risk control measures. This enables them to strengthen their compliance management and enhance their overall ESG performance.
Different stages of a company’s lifecycle involve different future development plans and varying levels of ESG performance. This paper drew inspiration from Dickinson [46] and classified company lifecycles based on the positive or negative levels of cash flows at different stages. As a company ages, it exhibits different characteristics in its development. As a result, the stages of growth, maturity, and decline are separated into the company lifecycle. As shown in Table 10, urban digital infrastructure significantly impacts corporate ESG performance in the growth stage, as indicated by the significant coefficient at the 5% level. However, it does not have a significant influence on corporate ESG performance in the mature and decline stages. This suggests that companies need to have core competitiveness to survive at different stages of development. Therefore, younger companies tend to have stronger ESG performance, which can attract more investment.
The average capital return rate is used to categorize organizations into high-profit and low-profit groups. This method relates a company’s cash flow level to its decision-making, which in turn influences its ESG performance. Companies with lower profitability levels often adopt a gradual improvement approach conducive to sustainably advancing digital transformation within reasonable cost boundaries. Companies with higher profitability levels may be more inclined to achieve digital transformation rapidly. Low-profitability companies use a progressive approach to avoid one-time high-cost significant changes, leveraging limited resources and time to achieve significant improvement goals. This approach is more favorable for promoting corporate ESG performance.

4.5.2. Industry-Level Heterogeneity

It is evident from the empirical findings in columns (1) and (2) of Table 11 that the estimated coefficients of the primary explanatory variable Dig are favorable and significant at the 5% level for both groups. However, the estimated coefficient of Dig for the non-heavy polluting group is more extensive. This suggests that both non-heavy and heavy-polluting companies benefit from urban digital infrastructure in terms of their ESG performance. However, comparatively, urban digital infrastructure has a more substantial impact on the ESG performance of non-heavy polluting companies. The paper suggests that non-heavy polluting industries are primarily concentrated in the service sector, which tends to have a higher sensitivity to digital economic resources. Heavy polluting companies, on the other hand, face stricter environmental regulations and disclosure requirements, driving their focus on ESG performance. When there is an improvement in the external environment, such as urban digital infrastructure, companies in both non-heavy-polluting and heavy-polluting industries experience positive effects. However, heavy-polluting companies, mainly concentrated in the manufacturing sector, may have stricter requirements for the external conditions needed for digital transformation. This makes the driving force primarily internal within the companies. Therefore, while developing urban digital infrastructure, focusing on non-heavy polluting industries and increasing their share is important. This will strengthen the beneficial effects of the development of urban digital infrastructure on corporate ESG performance in these sectors.

4.5.3. Regional Heterogeneity

In this paper, panel data from the eastern region and the central-western area are empirically analyzed in light of the disparities in economic development that exist among China’s various regions. The data are shown in Table 11. Industry heterogeneity and regional heterogeneity show that, as compared to enterprises located in the eastern region, the central-western region shows a more noticeable influence of urban digital infrastructure on ESG performance. A possible explanation is that the difference in industrial structure plays a role. The central-western region tends to have a higher concentration of resource-based industries and traditional manufacturing sectors than the eastern region. These industries often have more significant environmental and social impacts. As a result, to improve their ESG performance, businesses in the central-western region may need to pay more attention to their environmental and social obligations during the construction of their urban digital infrastructure. On the other hand, companies in the eastern region, especially those in high-tech, finance, and other service industries, may have different industry characteristics and business models that prioritize innovation and market competition. As a result, in many businesses, the effect of urban digital infrastructure on ESG performance might be less significant. The central-western region and the eastern region differ from one another in terms of regional development. The central-western region is usually in a phase of industrial restructuring and upgrading, where urban digital infrastructure can help companies achieve transformation and upgrading, thus improving their ESG performance. On the other hand, many companies in the eastern region have undergone a more extended development period and already have a higher level of ESG performance. Therefore, compared to the central-western region, the eastern region may not have as much of an impact from the expansion of urban digital infrastructure on enhancing ESG performance.

5. Discussion and Conclusions

5.1. Discussion

In recent years, with the increasing global pursuit of sustainable development, companies’ environmental, social, and corporate governance (ESG) performance has become a focal point of attention. ESG performance serves as both a critical foundation for investors, customers, and other stakeholders to assess a company’s worth and reputation as well as a key indicator of corporate sustainable development. In this context, urban digital infrastructure, as a significant component of modern business development, has garnered significant attention from researchers and practitioners due to its relationship with corporate ESG performance.
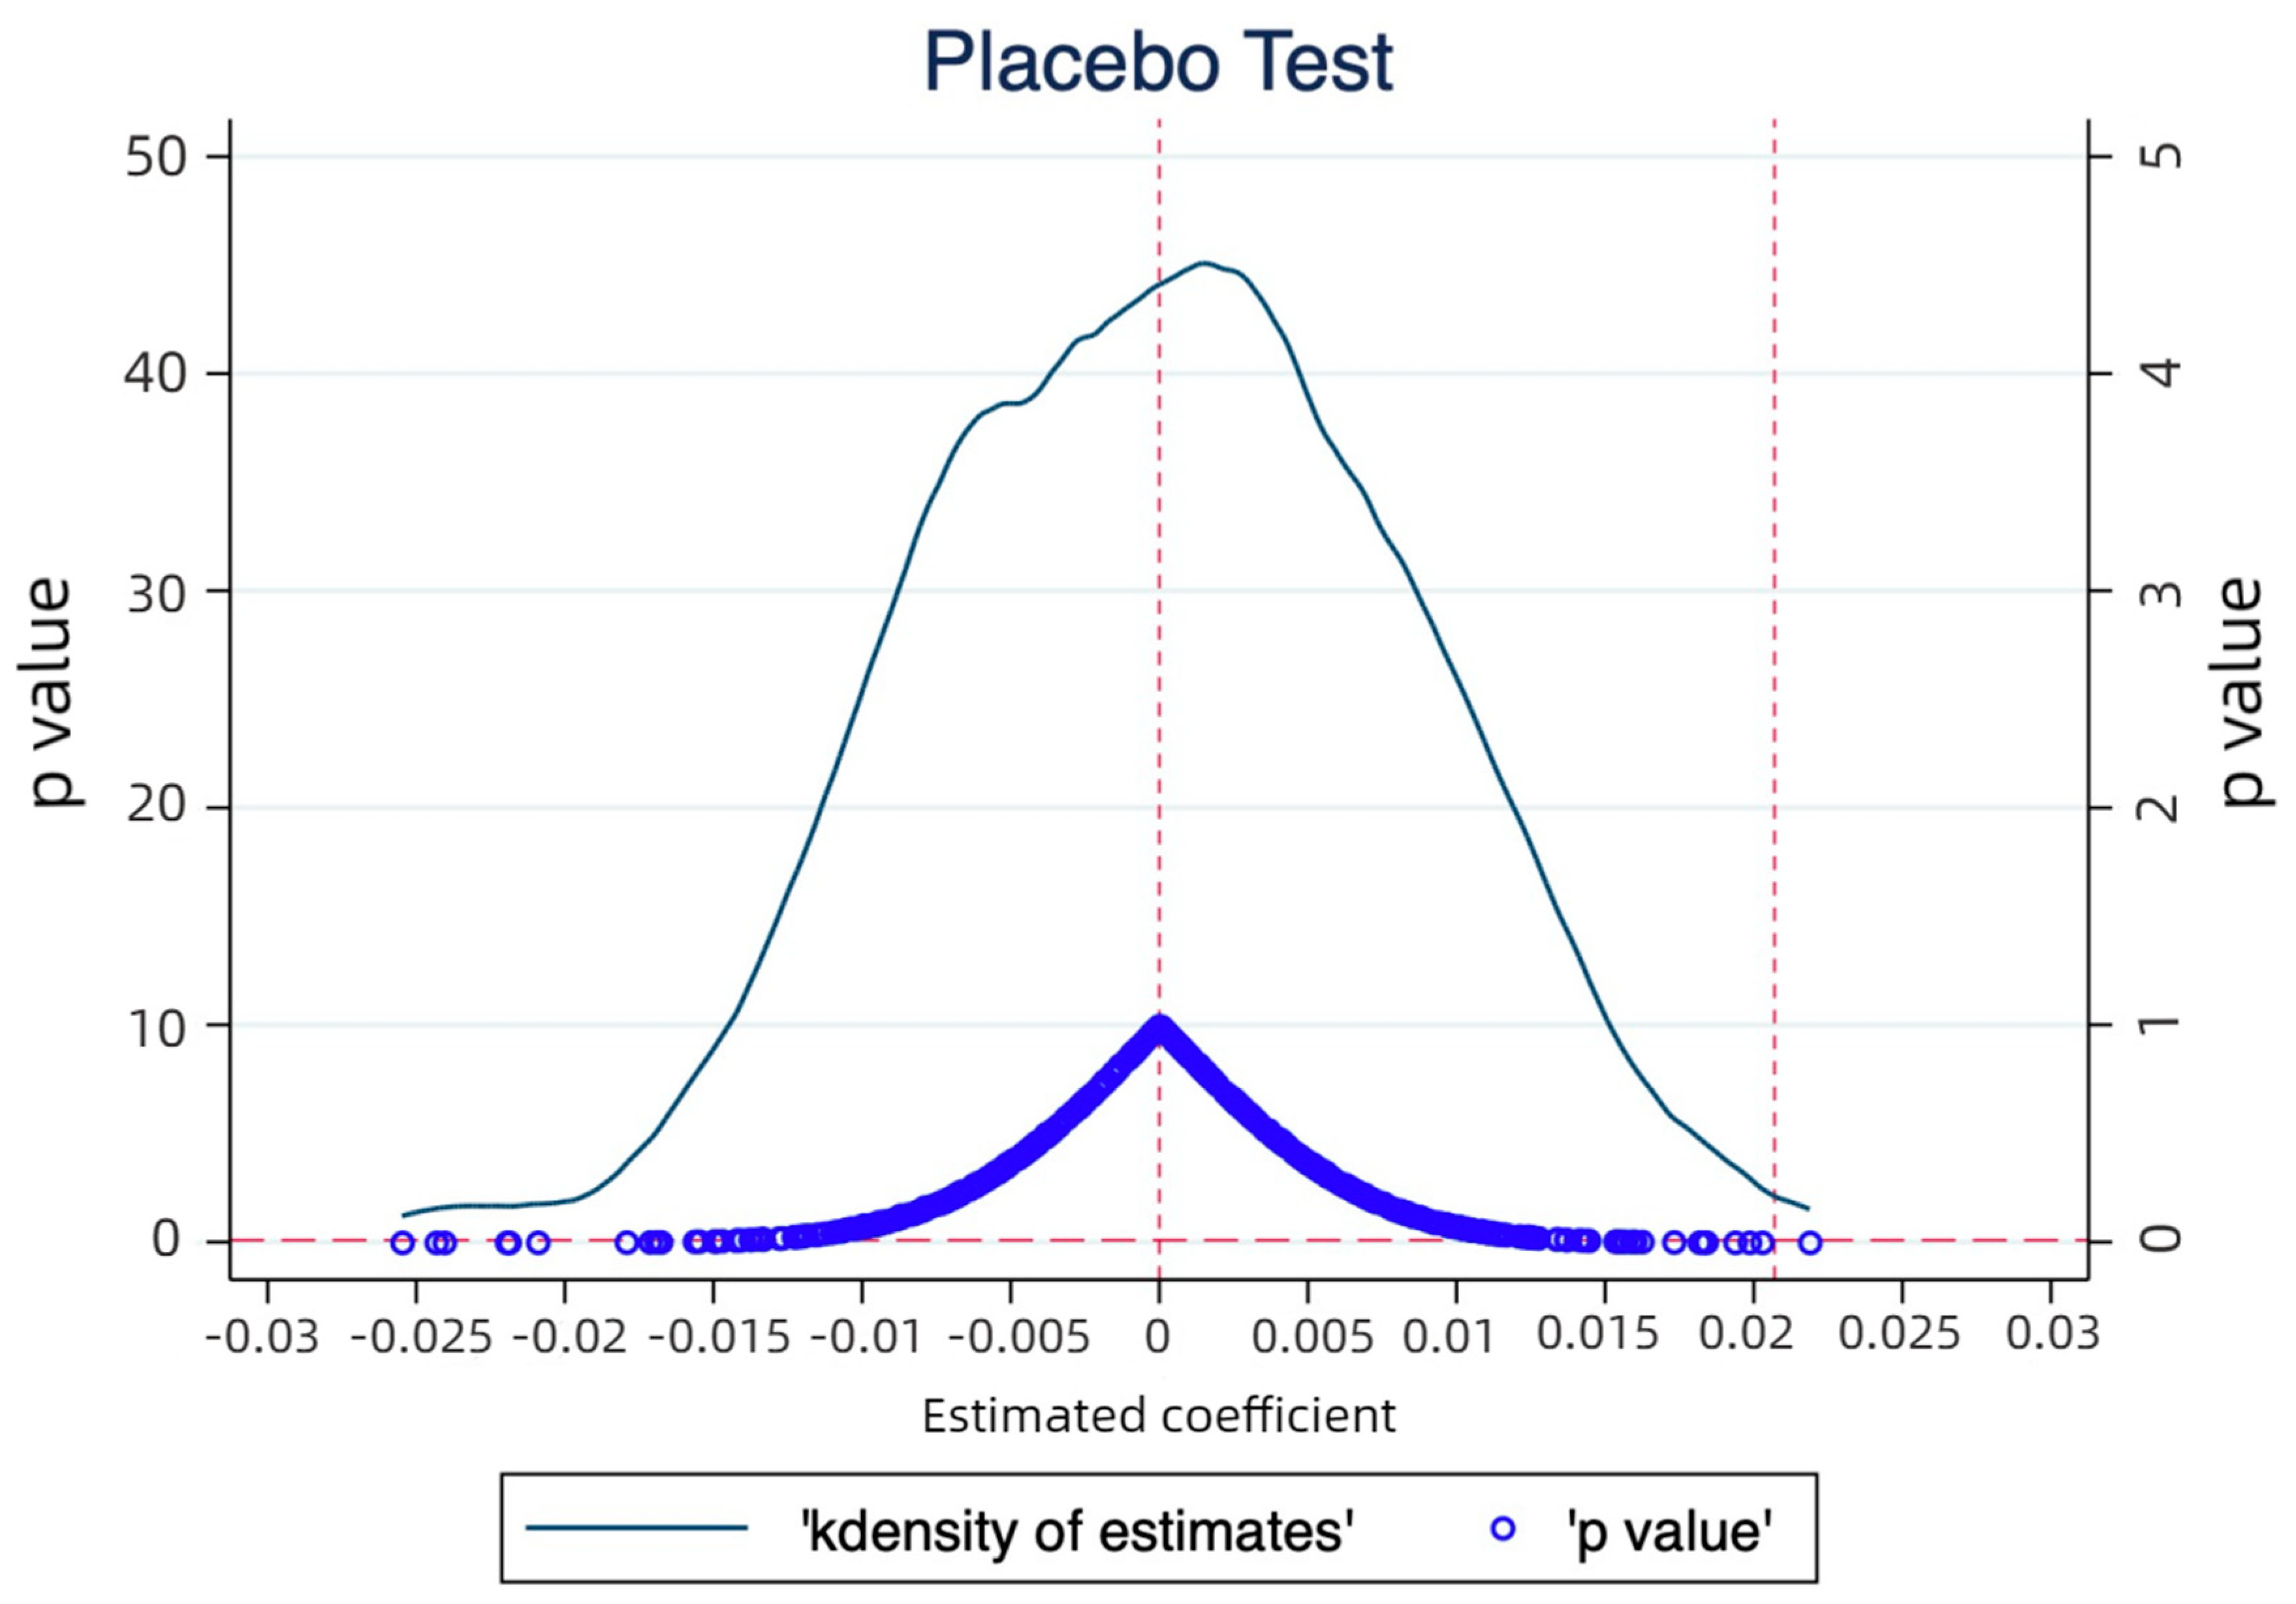
This paper places cities and enterprises within the green and high-quality development framework. It uses a variety of econometric techniques to conduct empirical testing based on theoretical analysis and the “Broadband China” quasi-natural experiment. Data from Chinese A-share listed firms from 2011 to 2021 are used in the paper. The conclusions are as follows. Firstly, urban digital infrastructure significantly positively affects corporate ESG performance. This paper addresses endogeneity concerns by employing propensity score matching and placebo tests. Robustness checks are conducted by incorporating macroeconomic factors, excluding samples from direct-controlled and provincial capital cities, and using alternative ESG rating agencies as explanatory variables. Secondly, urban digital infrastructure can promote corporate ESG performance through various channels, such as increasing R&D investments, enhancing corporate governance, and improving information transparency. Thirdly, state-owned enterprises, small businesses, growing companies, and companies with lower profitability all perform better in ESG metrics at the corporate level, where urban digital infrastructure is more relevant. Urban digital infrastructure has a greater influence on ESG performance at the industry and regional levels for non-polluting businesses and businesses in the central and western regions.
However, this paper has several limitations. Firstly, the indicators for urban digital infrastructure and corporate ESG performance may need improvement due to data constraints. Future research should adapt to new characteristics and refine these indicators accordingly. Secondly, studying the impact of digital infrastructure on corporate ESG performance is a complex and multifaceted issue that requires consideration of various factors and possibilities. For instance, a more in-depth examination of the individual sub-indicators of ESG performance can provide a more comprehensive understanding of the effects of digitization on environmental, social, and governance aspects. Additionally, investments and efforts by companies in digitization may be influenced by competitive pressures and market dynamics, making the competitive environment another crucial factor to consider. Furthermore, digital infrastructure encompasses a wide range of different digital technologies, such as big data analytics, artificial intelligence, and the Internet of Things, among others. These technologies may have distinct and specific impacts on ESG performance. Through a deeper exploration of these unaddressed areas, we can gain a more comprehensive understanding of the relationship between digitization and ESG. This comprehensive research approach can offer valuable insights and opportunities for future studies, ultimately contributing to sustainable development and enhanced corporate ESG performance. Finally, as the global digital economy enters a new stage of development, urban digital infrastructure is profoundly transforming the economy and society, continuously impacting the sustainable development of companies, regions, and even individuals. This paper focuses on China and analyzes the impact of urban digital infrastructure on corporate ESG performance. In future research, it would be beneficial to broaden the perspective and analyze this issue from the standpoint of global economic development. Achieving sustainable development through urban digital infrastructure and improving corporate ESG performance requires comprehensive planning and long-term efforts.

5.2. Conclusions

The government and enterprises can consider the following policy implications in light of the paper’s findings.
Accelerating the growth of the digital economy and enhancing urban digital infrastructure should be priorities. Various parts of China have varied levels of development for their urban digital infrastructure, which shows there is space for growth. Companies should seize the opportunities presented by the digital economy era and embark on digital transformation and upgrading. By leveraging digital resources, aligning with policy directions, and promoting sustainable development, companies can assume greater social responsibilities and optimize internal governance efficiency, enhancing their ESG performance.
Enhancing corporate awareness of ESG performance is crucial. Under the supervision and guidance of the government and the market, companies should gradually shift their attitudes towards ESG performance from passive to proactive, increasing their motivation to improve ESG performance and viewing it as an intrinsic requirement. In future developments, companies must consider ESG performance essential to enhance competitiveness, achieve long-term growth, and fulfill social responsibilities. Additionally, public officials should improve their ability to enforce information disclosure, gain an in-depth understanding of companies’ actual situations, establish information exchange platforms, facilitate communication among companies, and positively influence and shape corporate ESG behavior through targeted “dialogue” within urban digital infrastructure.
Based on heterogeneity analysis, it is crucial to strictly control the proportion of heavily polluting industries and actively promote their green transformation for companies with different property rights, varying sizes, geographical locations, profitability levels, industries, and life cycles. Efforts should be made to leverage the leading role of state-owned enterprises and seize the new resources, opportunities, and trends brought by urban digital infrastructure. Local governments should adopt targeted approaches and develop multi-level support programs for different types of enterprises. Limited fiscal resources should be allocated to urban digital infrastructure to lower the barriers for companies to embrace digitization, enhance their digital capabilities, and promote ESG performance.

Author Contributions

Conceptualization, C.Z. and C.L.; data curation, C.Z., X.Z. and C.L.; formal analysis, X.D., S.J. and C.L.; funding acquisition, S.J., Y.Z. and C.L.; investigation, X.D.; methodology, C.Z., X.D., S.J., Y.Z. and C.L.; project administration, C.L.; resources, S.J. and Y.Z.; software, X.D. and X.Z.; validation, X.Z.; visualization, C.Z.; writing—original draft, C.Z. and C.L.; writing—review & editing, C.Z., X.D., X.Z., S.J., Y.Z. and C.L. All authors have read and agreed to the published version of the manuscript.

Funding

We acknowledge financial support from the National Natural Science Foundation of China (Grant No. 72103221) and China Postdoctoral Science Foundation (2020TQ0048, 2021M700460). The authors declare that they have no relevant or material financial interests that relate to the research described in this paper.

Data Availability Statement

Not applicable.

Conflicts of Interest

The authors declare no conflict of interest.

References

  1. Wang, Z.; Deng, Y.; Zhou, S.; Wu, Z. Achieving sustainable development goal 9: A study of enterprise resource optimization based on artificial intelligence algorithms. Resour. Policy 2023, 80, 103212. [Google Scholar] [CrossRef]
  2. Ren, X.; Zeng, G.; Zhao, Y. Digital Finance and Corporate ESG Performance: Empirical Evidence from Listed Companies in China. Pac. Basin Financ. J. 2023, 79, 102019. [Google Scholar] [CrossRef]
  3. Schaltegger, S.; Hörisch, J. In search of the dominant rationale in sustainability management: Legitimacy-or profit-seeking? J. Bus. Ethics 2017, 145, 259–276. [Google Scholar] [CrossRef]
  4. Seibert, R.M.; Macagnan, C.B. Social responsibility disclosure determinants by philanthropic higher education institutions. Meditari Account. Res. 2019, 27, 258–286. [Google Scholar] [CrossRef]
  5. Ortas, E.; Álvarez, I.; Jaussaud, J.; Garayar, A. The Impact of Institutional and Social Context on Corporate Environmental, Social and Governance Performance of Companies Committed to Voluntary Corporate Social Responsibility Initiatives. J. Clean. Prod. 2015, 108, 673–684. [Google Scholar] [CrossRef]
  6. Shu, H.; Tan, W. Does Carbon Control Policy Risk Affect Corporate ESG Performance? Econ. Model. 2022, 120, 106148. [Google Scholar] [CrossRef]
  7. Wang, W.; Sun, Z.; Wang, W.; Hua, Q.; Wu, F. The Impact of Environmental Uncertainty on ESG Performance: Emotional vs. Rational. J. Clean. Prod. 2023, 397, 136528. [Google Scholar] [CrossRef]
  8. Shin, J.; Moon, J.J.; Kang, J. Where Does ESG Pay? The Role of National Culture in Moderating the Relationship between ESG Performance and Financial Performance. Int. Bus. Rev. 2022, 32, 102071. [Google Scholar] [CrossRef]
  9. Wang, L.; Qi, J.; Zhuang, H. Monitoring or Collusion? Multiple Large Shareholders and Corporate ESG Performance: Evidence from China. Financ. Res. Lett. 2023, 53, 103673. [Google Scholar] [CrossRef]
  10. Wang, Y.; Lin, Y.; Fu, X.; Chen, S. Institutional Ownership Heterogeneity and ESG Performance: Evidence from China. Financ. Res. Lett. 2023, 51, 103448. [Google Scholar] [CrossRef]
  11. Fang, M.; Nie, H.; Shen, X. Can Enterprise Digitization Improve ESG Performance? Econ. Model. 2023, 118, 106101. [Google Scholar] [CrossRef]
  12. Wang, Z.; Liang, F.; Li, C.; Xiong, W.; Chen, Y.; Xie, F. Does China’s low-carbon city pilot policy promote green development? Evidence from the digital industry. J. Innov. Knowl. 2023, 8, 100339. [Google Scholar] [CrossRef]
  13. Li, C.; Zhang, X.; Dong, X.; Yan, Q.; Zeng, L.; Wang, Z. The impact of smart cities on entrepreneurial activity: Evidence from a quasi-natural experiment in China. Resour. Policy 2023, 81, 103333. [Google Scholar] [CrossRef]
  14. Li, C.; Xu, Y.; Zheng, H.; Wang, Z.; Han, H.; Zeng, L. Artificial intelligence, resource reallocation, and corporate innovation efficiency: Evidence from China’s listed companies. Resour. Policy 2023, 81, 103324. [Google Scholar] [CrossRef]
  15. Hu, J.; Zhang, H.; Irfan, M. How Does Digital Infrastructure Construction Affect Low-Carbon Development? A Multidimensional Interpretation of Evidence from China. J. Clean. Prod. 2023, 396, 136467. [Google Scholar] [CrossRef]
  16. Tang, K.; Yang, G. Does Digital Infrastructure Cut Carbon Emissions in Chinese Cities? Sustain. Prod. Consum. 2022, 35, 431–443. [Google Scholar] [CrossRef]
  17. Jiang, Z.; Zhang, X.; Zhao, Y.; Li, C.; Wang, Z. The impact of urban digital transformation on resource sustainability: Evidence from a quasi-natural experiment in China. Resour. Policy 2023, 85, 103784. [Google Scholar] [CrossRef]
  18. Liu, F.-H.; Huang, T.-L. The Influence of Collaborative Competence and Service Innovation on Manufacturers’ Competitive Advantage. J. Bus. Ind. Mark. 2018, 33, 466–477. [Google Scholar] [CrossRef]
  19. Rietmann, C. Corporate Responsibility and Place Leadership in Rural Digitalization: The Case of Hidden Champions. Eur. Plan. Stud. 2022, 31, 409–429. [Google Scholar] [CrossRef]
  20. Bakos, J.Y. Reducing Buyer Search Costs: Implications for Electronic Marketplaces. Manag. Sci. 1997, 43, 1676–1692. [Google Scholar] [CrossRef]
  21. Sovbetov, Y. Impact of digital economy on female employment: Evidence from Turkey. Int. Econ. J. 2018, 32, 256–270. [Google Scholar] [CrossRef]
  22. Thompson, P.; Williams, R.; Thomas, B. Are UK SMEs with active web sites more likely to achieve both innovation and growth? J. Small Bus. Enterp. Dev. 2013, 20, 934–965. [Google Scholar] [CrossRef]
  23. Alam, M.S.; Atif, M.; Chien-Chi, C.; Soytaş, U. Does corporate R&D investment affect firm environmental performance? Evidence from G-6 countries. Energy Econ. 2019, 78, 401–411. [Google Scholar]
  24. Riaz, Z.; Ray, P.; Ray, S. The impact of digitalisation on corporate governance in Australia. J. Bus. Res. 2022, 152, 410–424. [Google Scholar] [CrossRef]
  25. Jiang, L.; Bai, Y. Strategic or Substantive Innovation? -the Impact of Institutional Investors’ Site Visits on Green Innovation Evidence from China. Technol. Soc. 2022, 68, 101904. [Google Scholar] [CrossRef]
  26. Chahine, S.; Zeidan, M.J.; Dairy, H. Corporate governance and the market reaction to stock repurchase announcement. J. Manag. Gov. 2012, 16, 707–726. [Google Scholar] [CrossRef]
  27. Liu, G.; Liu, B. How digital technology improves the high-quality development of enterprises and capital markets: A liquidity perspective. Financ. Res. Lett. 2023, 53, 103683. [Google Scholar] [CrossRef]
  28. Niu, Y.; Wang, S.; Wen, W.; Li, S. Does digital transformation speed up dynamic capital structure adjustment? Evidence from China. Pac. Basin Financ. J. 2023, 79, 102016. [Google Scholar] [CrossRef]
  29. Shahzad, K.; Zhang, Q.; Zafar, A.U.; Ashfaq, M.; Rehman, S.U. The Role of Blockchain-Enabled Traceability, Task Technology Fit, and User Self-Efficacy in Mobile Food Delivery Applications. J. Retail. Consum. Serv. 2023, 73, 103331. [Google Scholar] [CrossRef]
  30. Fu, H.; Ye, B.H.; Law, R. You do well and I do well? The behavioral consequences of corporate social responsibility. Int. J. Hosp. Manag. 2014, 40, 62–70. [Google Scholar] [CrossRef]
  31. Seibert, R.M.; Macagnan, C.B. Responsabilidade Social: A Transparência das Instituições de Ensino Superior Filantrópicas; Novas Edições Acadêmicas: Florianópolis, SC, Brazil, 2017. [Google Scholar]
  32. Macagnan, C.B. Evidenciação voluntária: Fatores explicativos da extensão da informação sobre recursos intangíveis. Rev. Contab. Finanças 2009, 20, 46–61. [Google Scholar] [CrossRef]
  33. Macagnan, C.B.; Seibert, R.M. Sustainability indicators: Information asymmetry mitigators between cooperative organizations and their primary stakeholders. Sustainability 2021, 13, 8217. [Google Scholar] [CrossRef]
  34. Dasgupta, S.; Gan, J.; Gao, N. Transparency, Price Informativeness, and Stock Return Synchronicity: Theory and Evidence. J. Financ. Quant. Anal. 2010, 45, 1189–1220. [Google Scholar] [CrossRef]
  35. Si, R.; Zhang, X.; Yao, Y.; Liu, L.; Lu, Q. Influence of Contract Commitment System in Reducing Information Asymmetry, and Prevention and Control of Livestock Epidemics: Evidence from Pig Farmers in China. One Health 2021, 13, 100302. [Google Scholar] [CrossRef] [PubMed]
  36. Pedron, A.P.B.; Macagnan, C.B.; Simon, D.S.; Vancin, D.F. Environmental disclosure effects on returns and market value. Environ. Dev. Sustain. 2021, 23, 4614–4633. [Google Scholar] [CrossRef]
  37. Zhong, Y.; Zhao, H.; Yin, T. Resource Bundling: How Does Enterprise Digital Transformation Affect Enterprise ESG Development? Sustainability 2023, 15, 1319. [Google Scholar] [CrossRef]
  38. Sun, L.; Liu, S.; Chen, P. Does the Paternalism of Founder-Managers Improve Firm Innovation? Evidence from Chinese Non-State-Owned Listed Firms. Financ. Res. Lett. 2022, 49, 103146. [Google Scholar] [CrossRef]
  39. Wang, Q.; Hu, A.; Tian, Z. Digital transformation and electricity consumption: Evidence from the Broadband China pilot policy. Energy Econ. 2022, 115, 106346. [Google Scholar] [CrossRef]
  40. Mohanty, P.; Mishra, S. A Comparative Study of Corporate Governance Practices of Indian Firms Affiliated to Business Groups and Industries. Corp. Gov. Int. J. Bus. Soc. 2021, 22, 278–301. [Google Scholar] [CrossRef]
  41. Bushman, R.M.; Piotroski, J.D.; Smith, A.J. What Determines Corporate Transparency? SSRN Electron. J. 2004, 42, 207–252. [Google Scholar] [CrossRef]
  42. Amore, M.D.; Bennedsen, M. Corporate Governance and Green Innovation. J. Environ. Econ. Manag. 2016, 75, 54–72. [Google Scholar] [CrossRef]
  43. Li, C.; Wang, Y.; Zhou, Z.; Wang, Z.; Mardani, A. Digital finance and enterprise financing constraints: Structural characteristics and mechanism identification. J. Bus. Res. 2023, 165, 114074. [Google Scholar] [CrossRef]
  44. Faulkender, M.; Wang, R. Corporate Financial Policy and the Value of Cash. J. Financ. 2006, 61, 1957–1990. [Google Scholar] [CrossRef]
  45. Giannetti, M.; Liao, G.; Yu, X. The Brain Gain of Corporate Boards: Evidence from China. J. Financ. 2015, 70, 1629–1682. [Google Scholar] [CrossRef]
  46. Dickinson, V. Cash Flow Patterns as a Proxy for Firm Life Cycle. Account. Rev. 2011, 86, 1969–1994. [Google Scholar] [CrossRef]
Figure 1. Map of pilot cities in the “Broadband China” strategy.
Systems 11 00515 g001
Figure 2. Diagram of mechanism analysis.
Systems 11 00515 g002
Figure 3. Parallel trend analysis.
Systems 11 00515 g003
Figure 4. Placebo effect.
Systems 11 00515 g004
Table 1. Main variable definitions.
Variable Symbol Calculation Method
Explained variableCorporate ESG performance E S G Natural logarithm of the combined environmental, social, and governance score.
Explanatory variableUrban digital infrastructure D i g If the company’s registered location was selected as a “Broadband China” demonstration city during the sample period (i.e., treatment group) and the observation time is after the year of selection, the variable D i g takes a value of 1; otherwise, it takes a value of 0.
Control variableCompany size S i z e The natural logarithm of total assets is used to measure the company’s size.
Leverage ratio L e v The natural logarithm of the ratio of total liabilities to total assets is used to measure the company’s leverage.
Return on assets R O A The natural logarithm of the net profit ratio to total assets is used to measure the company’s profitability.
Shareholding structure I n d e p The logarithm of the number of independent shareholders is used to measure the company’s ownership structure.
Equity multiplier E q u i t y The natural logarithm of the ratio of total assets to owner’s equity is used to measure the company’s leverage ratio.
Tobin Q T o b i n Q The ratio of market value to replacement cost is used to measure the company’s market-to-book ratio.
City control variablesIndustrial structure I N D s t The natural logarithm of the ratio of the tertiary industry’s output value to the secondary industry’s output value is used to measure the industrial structure.
Population growth rate p o p The natural logarithm of the ratio between annual and average population change is used to measure the population growth rate.
Table 2. Descriptive statistics.
VariableNMeanMedianSdMinMax
ESG22,8221.3701.3860.32704.382
Dig22,8220.47100.49901
Lev22,8220.4440.4390.2140.04900.972
ROA22,8220.03100.03200.0680−0.3560.198
Indep22,8223.20130.57325
Equity22,8222.2591.7721.6851.02915.47
Size22,82222.3622.201.38914.9428.64
TobinQ22,8222.2641.7111.6840.85211.66
INDst15,9141.7681.2481.2970.4205.464
pop18,3602.4252.4230.4981.0543.484
Table 3. Impact of urban digital infrastructure on corporate ESG performance.
Variable(1)(2)(3)(4)(5)(6)(7)(8)
ESGEnvironSocialGovnceESGEnvironSocialGovnce
Dig0.016 **0.009 ***−0.0020.006 ***0.021 ***0.008 ***−0.0030.009 ***
(2.333)(4.642)(−0.653)(2.848)(3.162)(4.210)(−1.130)(4.225)
Lev −0.207 ***0.016 ***0.029 ***−0.138 ***
(−10.592)(2.694)(3.860)(−22.843)
ROA 0.509 ***−0.0100.081 ***0.146 ***
(16.203)(−1.070)(6.607)(15.057)
Indep 0.018 ***−0.0020.0000.008 ***
(3.320)(−1.283)(0.134)(5.098)
Equity −0.004 **−0.003 ***−0.004 ***0.001 **
(−2.017)(−4.823)(−5.981)(2.393)
Size 0.056 ***0.014 ***0.028 ***0.012 ***
(14.136)(11.250)(17.863)(9.642)
TobinQ −0.017 ***−0.001 ***−0.000−0.003 ***
(−10.487)(−2.656)(−0.671)(−6.292)
_cons1.362 ***4.088 ***4.305 ***4.362 ***0.164 *3.790 ***3.677 ***4.128 ***
(382.966)(3840.813)(3143.562)(3929.432)(1.861)(140.411)(106.634)(151.080)
N22,82222,82222,82222,82222,82222,82222,82222,822
codeYesYesYesYesYesYesYesYes
yearYesYesYesYesYesYesYesYes
R20.4390.6650.5740.4110.4670.6680.5850.451
Notes: The symbols *, ** and *** represent for the levels of significance at the 10%, 5% and 1% levels, respectively. This note applies to the following tables.
Table 4. PSM-DID.
Table 4. PSM-DID.
Variable(1)(2)(3)
Nearest-NeighborRadiusKernel
Dig0.156 ***0.022 **0.022 **
(3.063)(2.528)(2.539)
Lev−0.225 ***−0.211 ***−0.220 ***
(−7.749)(−9.219)(−9.674)
ROA0.314 ***0.411 ***0.399 ***
(7.051)(12.424)(12.282)
Indep0.0130.0080.009
(1.642)(1.333)(1.388)
Equity−0.004 *−0.005 ***−0.005 **
(−1.764)(−2.590)(−2.336)
Size0.081 ***0.078 ***0.079 ***
(13.277)(16.217)(16.516)
TobinQ−0.004−0.004 **−0.004 **
(−1.640)(−2.416)(−2.487)
_cons−0.504 ***−0.335 ***−0.360 ***
(−3.589)(−3.112)(−3.355)
N12,58318,67518,732
codeYesYesYes
yearYesYesYes
R20.5340.5370.537
Note: t statistics in parentheses; ***, ** and * indicate significance at the 1%, 5% and 10% statistical levels, respectively.
Table 5. Robustness test-add macro factors.
Variable(1)(2)(3)(4)
ESGEnvironSocialGovnce
Dig0.015 *−0.015−0.0040.049 ***
(1.698)(−1.301)(−0.254)(3.784)
Lev−0.041 ***0.037 ***0.042 ***−0.126 ***
(−7.563)(5.332)(4.494)(−15.936)
ROA0.106 ***0.025 **0.085 ***0.144 ***
(12.134)(2.246)(5.719)(11.407)
Indep0.009 ***−0.0010.006 **0.015 ***
(5.438)(−0.679)(2.305)(6.379)
Equity−0.002 ***−0.002 ***−0.002 ***−0.002 ***
(−5.326)(−3.857)(−3.191)(−3.397)
TobinQ−0.003 ***−0.003 ***−0.005 ***−0.002 ***
(−6.707)(−4.627)(−6.676)(−2.607)
INDst0.006 ***0.008 ***−0.0020.008 ***
(3.291)(3.517)(−0.563)(3.339)
pop−0.001−0.0010.004−0.004
(−0.309)(−0.362)(1.276)(−1.484)
_cons4.266 ***4.088 ***4.273 ***4.337 ***
(423.654)(317.963)(248.939)(297.490)
N14,74114,74114,74114,741
codeYesYesYesYes
yearYesYesYesYes
R20.5450.6730.5610.445
Note: t statistics in parentheses; ***, ** and * indicate significance at the 1%, 5% and 10% statistical levels, respectively.
Table 6. Robustness test-excluding municipalities and provincial capitals.
Variable(1)(2)(3)(4)
ESGEnvironSocialGovnce
Dig0.027 *0.012−0.0360.089 ***
(1.684)(0.589)(−1.267)(3.793)
Lev−0.046 ***0.0130.047 ***−0.132 ***
(−6.862)(1.468)(3.893)(−13.383)
ROA0.069 ***0.0000.058 ***0.089 ***
(6.379)(0.021)(3.027)(5.589)
Indep0.008 ***−0.005 *0.010 ***0.012 ***
(4.196)(−1.904)(2.891)(4.323)
Equity−0.002 ***−0.001 *−0.004 ***0.000
(−3.011)(−1.952)(−3.531)(0.083)
TobinQ−0.004 ***−0.003 ***−0.005 ***−0.005 ***
(−7.285)(−3.543)(−4.617)(−5.542)
_cons4.271 ***4.110 ***4.273 ***4.336 ***
(367.048)(273.202)(206.013)(253.468)
N9445944594459445
codeYesYesYesYes
yearYesYesYesYes
R20.5610.6680.5590.453
Note: t statistics in parentheses; *** and * indicate significance at the 1% and 10% statistical levels, respectively.
Table 7. Robustness test-replacement of explanatory variables.
Variable(1)(2)(3)
WindBloombergHuazheng
Dig0.209 **0.576 ***0.021 ***
(2.401)(3.473)(3.162)
Lev−0.193 ***−2.308 ***−0.207 ***
(−2.924)(−3.941)(−10.592)
ROA−0.0693.091 ***0.509 ***
(−0.984)(3.400)(16.203)
Indep0.037 **0.305 **0.018 ***
(2.255)(2.556)(3.320)
Equity−0.012 **−0.059−0.004 **
(−2.564)(−1.133)(−2.017)
Size0.174 ***1.211 ***0.056 ***
(11.170)(10.898)(14.136)
TobinQ0.014 ***0.103 **−0.017 ***
(2.775)(2.418)(−10.487)
_cons1.945 ***−1.0710.164 *
(5.480)(−0.429)(1.861)
N9914970522,822
codeYesYesYes
yearYesYesYes
R20.8040.8180.467
Note: t statistics in parentheses; ***, ** and * indicate significance at the 1%, 5% and 10% statistical levels, respectively.
Table 8. Analysis of the mechanism of action.
VariableR&D InvestmentCorporate Governance LevelInformation Transparency
(1)(2)(3)(4)(5)(6)
RDESGGevornESGDSCOREESG
Dig0.107 ***0.066 ***0.035 ***0.021 ***0.034 **0.017 *
(2.756)(9.979)(3.027)(3.238)(2.066)(1.955)
RD 0.007 ***
(5.625)
Gevorn 0.017 ***
(4.494)
DSCORE 0.077 ***
(16.683)
Lev−1.407 ***−0.199 ***−0.162 ***−0.258 ***−0.303 ***−0.185 ***
(−11.964)(−9.923)(−4.681)(−13.608)(−6.251)(−7.238)
ROA−1.025 ***0.620 ***0.0010.408 ***1.770 ***0.426 ***
(−5.310)(18.930)(0.014)(13.401)(24.131)(10.764)
Indep0.053 *0.022 ***−0.193 ***0.020 ***−0.0190.018 **
(1.671)(4.108)(−20.343)(3.796)(−1.393)(2.432)
Equity0.008−0.0020.003−0.003 *−0.004−0.007 ***
(0.701)(−1.274)(1.037)(−1.807)(−0.893)(−2.650)
Size0.0160.047 ***−0.179 ***0.075 ***0.078 ***0.043 ***
(0.681)(11.595)(−25.219)(18.899)(7.975)(8.321)
TobinQ−0.034 ***−0.022 ***−0.055 ***−0.011 ***0.006−0.021 ***
(−3.440)(−12.909)(−19.255)(−7.199)(1.499)(−10.562)
_cons0.5560.340 ***4.653 ***−0.236 ***1.420 ***0.225 **
(1.042)(3.761)(29.618)(−2.687)(6.568)(1.974)
N19,91419,91422,09222,09214,36814,368
codeYesYesYesYesYesYes
yearYesYesYesYesYesYes
R20.7140.4770.8140.4920.4320.451
Sobel test0.004
(z = 8.123, p = 4.441 × 10⁻¹⁶)
0.002
(z = 5.387, p = 7.181 × 10−08)
0.004
(z = 3.07, p = 0.002)
Indirect effects as a percentage14.14%71.98%11.92%
Note: t statistics in parentheses; ***, ** and * indicate significance at the 1%, 5% and 10% statistical levels, respectively.
Table 9. Company heterogeneity—ownership structure and business size.
Variable(1)(2)(3)(4)
State-OwnedNon-State-OwnedSmall and Medium SizeLarge Scale
Dig0.026 ***0.022 **0.029 ***0.006
(2.916)(2.334)(3.209)(0.577)
Lev−0.138 ***−0.201 ***−0.214 ***−0.148 ***
(−4.567)(−7.155)(−8.601)(−3.488)
ROA0.095 *0.600 ***0.461 ***0.405 ***
(1.808)(14.328)(11.964)(6.385)
Indep0.026 ***0.0020.022 ***0.011
(3.883)(0.238)(2.607)(1.592)
Equity−0.007 ***−0.002−0.003−0.011 ***
(−3.445)(−0.483)(−1.426)(−3.648)
Size0.067 ***0.054 ***0.031 ***0.121 ***
(10.773)(9.249)(4.488)(14.149)
TobinQ−0.009 ***−0.016 ***−0.021 ***−0.002
(−3.540)(−7.114)(−9.889)(−0.540)
_cons−0.1120.240 *0.715 ***−1.370 ***
(−0.808)(1.874)(4.863)(−6.973)
N987412,21513,3699310
codeYesYesYesYes
yearYesYesYesYes
R20.5250.4460.4500.507
Note: t statistics in parentheses; ***, ** and * indicate significance at the 1%, 5% and 10% statistical levels, respectively.
Table 10. Company heterogeneity —life cycle and profitability.
Variable(1)(2)(3)(4)(5)
Growth PeriodMature PeriodRecession PeriodLow ProfitabilityHigh Profitability
Dig0.021 **0.0050.0210.042 ***0.012
(2.015)(0.449)(1.110)(3.991)(1.250)
Lev−0.132 ***−0.176 ***−0.303 ***−0.195 ***−0.182 ***
(−3.859)(−4.365)(−6.874)(−6.466)(−5.739)
ROA0.562 ***0.499 ***0.169 ***0.421 ***0.467 ***
(9.240)(7.989)(2.643)(9.131)(6.113)
Indep0.015 *0.019 **0.0030.029 ***0.014 *
(1.754)(2.091)(0.205)(3.460)(1.787)
Equity−0.002−0.017 ***0.002−0.005 **−0.006 **
(−0.612)(−4.255)(0.498)(−2.175)(−2.148)
Size0.032 ***0.038 ***0.094 ***0.065 ***0.040 ***
(4.734)(4.542)(8.650)(9.323)(7.124)
TobinQ−0.024 ***−0.014 ***−0.012 ***−0.014 ***−0.017 ***
(−8.687)(−4.664)(−3.010)(−5.107)(−7.426)
_cons0.702 ***0.593 ***−0.640 ***−0.1020.555 ***
(4.620)(3.210)(−2.650)(−0.662)(4.392)
N94988069427810,68711,838
codeYesYesYesYesYes
yearYesYesYesYesYes
R20.4300.4870.5560.4920.463
Note: t statistics in parentheses; ***, ** and * indicate significance at the 1%, 5% and 10% statistical levels, respectively.
Table 11. Industry heterogeneity and regional heterogeneity.
Variable(1)(2)(3)(4)
Non-Heavily PollutedHeavy PollutionMidwestEast
Dig0.020 **0.019 **0.054 ***0.004
(2.142)(2.008)(4.700)(0.437)
Lev−0.200 ***−0.186 ***−0.225 ***−0.191 ***
(−7.303)(−6.154)(−6.538)(−7.888)
ROA0.543 ***0.419 ***0.264 ***0.610 ***
(13.178)(8.303)(4.548)(16.187)
Indep0.028 ***0.0070.034 ***0.011 *
(3.896)(0.810)(3.607)(1.693)
Equity−0.003−0.004 *−0.004−0.003
(−1.311)(−1.698)(−1.528)(−1.412)
Size0.064 ***0.048 ***0.055 ***0.058 ***
(11.679)(6.901)(7.651)(11.707)
TobinQ−0.019 ***−0.012 ***−0.010 ***−0.020 ***
(−8.567)(−4.589)(−3.601)(−10.091)
_cons−0.0100.353 **0.1040.163
(−0.083)(2.305)(0.651)(1.482)
N12,22610,496709115,721
codeYesYesYesYes
yearYesYesYesYes
R20.4860.4610.4820.461
Note: t statistics in parentheses; ***, ** and * indicate significance at the 1%, 5% and 10% statistical levels, respectively.
Disclaimer/Publisher’s Note: The statements, opinions and data contained in all publications are solely those of the individual author(s) and contributor(s) and not of MDPI and/or the editor(s). MDPI and/or the editor(s) disclaim responsibility for any injury to people or property resulting from any ideas, methods, instructions or products referred to in the content.

