Article

Exploring the Impacts of COVID-19 on Coastal Tourism to Inform Recovery Strategies in Nelson Mandela Bay, South Africa

by
Estee Vermeulen-Miltz
1,2,*,
Jai Kumar Clifford-Holmes
1,3,
Bernadette Snow
1,2 and
Amanda Talita Lombard
1
1
Institute for Coastal and Marine Research, Nelson Mandela University, Gqeberha 6001, South Africa
2
One Ocean Hub, University of Strathclyde, Glasgow G1 1XQ, UK
3
Institute for Water Research, Rhodes University, Makhanda 6139, South Africa
*
Author to whom correspondence should be addressed.
Systems 2022, 10(4), 120; https://doi.org/10.3390/systems10040120
Submission received: 8 July 2022 / Revised: 5 August 2022 / Accepted: 5 August 2022 / Published: 12 August 2022
(This article belongs to the Special Issue System Dynamics Models for Public Health and Health Care Policy)

Abstract

:
Globally, the COVID-19 pandemic bought devastating impacts to multiple economic sectors, with a major downfall observed in the tourism sector owing to explicit travel bans on foreign and domestic tourism. In Nelson Mandela Bay (NMB), South Africa, tourism plays an important role; however, negative effects from the pandemic and resulting restrictions has left the sector dwindling and in need of a path to recovery. Working together with local government and stakeholders, this study applied system dynamics modelling to investigate the impacts of COVID-19 on coastal tourism in NMB to provide decision-support and inform tourism recovery strategies. Through model analysis, a suite of management interventions was tested under two ‘what-if’ scenarios, with reference to the business-as-usual governance response scenario. Scenario one specifically aimed to investigate a desirable tourism recovery strategy assuming governance control, whereas scenario two investigated a scenario where the effects of governance responses were impeded on by the exogenous effects from the virus. Results suggest that uncertainty remained prevalent in the trajectory of the infection rate as well as in associated trends in tourism; however, through the lifting of travel restrictions and the continual administration of vaccines, a path to recovery was shown to be evident.

1. Introduction

The COVID-19 pandemic, and its subsequent lockdowns, was a severe shock to the global economy. After the initial spread of the virus from its origin in China, governments around the world started to respond, some more cautiously and hastily than others, in an effort to combat the spread of the virus. Despite interventions, a continual rise in infection rates led to the declaration of a global pandemic by the World Health Organisation (WHO) in March 2020. Thereafter, stricter government interventions through national lockdowns were introduced to assist in ‘flattening the infection curve’. Though the national lockdowns were introduced with good intent to help ‘save lives’, the strict restrictions caused devastating impacts on the global economy. This effect was exacerbated in South Africa (SA) and locally in Nelson Mandela Bay (NMB), the focus area of this study, where the economy was previously strained by slow economic growth and social imbalances [1]. Multiple sectors have been devasted by the impacts of COVID-19, with many countries experiencing large contractions in Gross Domestic Product (GDP) and a consequential decline in employment levels [2]. It has been projected that the tourism sector will be one of the most affected by the pandemic, with devastating impacts that have never been observed before. Globally, COVID-19 caused a ~70% decrease in international tourism, return to the levels of 30 years ago, a significantly greater reduction than what was observed during the SARS virus in 2003 or the global economic recession in 2009, which resulted in contractions of ~0.4% and ~4%, respectively [2,3]. Economies slowly started to recover in 2021 owing to the lift of ‘lockdown’ restrictions in response to the administration of vaccines; however, sectors such as tourism, that were less resilient to the exogenous shock of the pandemic, are still experiencing negative effects, with remaining uncertainty concerning the rate of recovery to pre-pandemic levels.
In SA, and at a local scale, in NMB, uncertainty around recovery has manifested throughout in the tourism sector. Tourism plays an important role in the metro, with a total economic contribution (direct and induced) of ~R14 billion in 2019 (~11% of GDP), and employs a total of 98,000 persons, with the largest contribution coming from domestic tourism [4]. As a result of the pandemic, in reference to 2019, the metro experienced a 72% and 45% contraction in foreign and domestic tourists, respectively, followed by a 61% decrease in bednight sales and a 37% decline in direct tourism spend [4]. To ‘control’ COVID-19 transmission in SA, the government adopted an adaptive risk reduction strategy based on a five-level alert system, with level five corresponding to the strictest level of restrictions (i.e., national lockdown). The restrictions, particularly those associated with public movement, drastically impacted domestic and foreign tourism, where provincial travel was only permitted for levels one and two, and foreign travel only at level one, notwithstanding individual country’s travel ban thresholds. Additional restrictions including beach closures and accommodation capacity limitations further affected coastal tourism in the bay. Moreover, the trajectory of COVID-19 infections influenced travelers’ behaviour patterns through changes in the perception of the susceptibility and severity of the situation [5]. This study therefore highlights the need for tourism stakeholders and related government authorities to understand the knock-on effects arising from COVID-19 and associated feedback processes to facilitate and enable sustainable tourism recovery.
The temporal nature underlying the impacts of COVID-19 on tourism, and the associated uncertainty regarding tourism recovery, makes it particularly amenable to the method of system dynamics modelling (SDM). SDM is a structured approach to systems thinking that involves mapping, modelling, and managing complex and dynamic problems [6]. The method has proven to be advantageous for policy makers to gain a holistic overview of the problem and recognise key feedback effects and time delays through analytical decision support. SDM has been widely applied in the field of epidemiology [7] and recently used to explore questions related to COVID-19 and the underlying social responses and consequential impacts. Different models have been applied to different regions and contexts and to address different questions. For example, SDM was applied to investigate the evolution of COVID-19 infection waves and societal responses at a global scale [8,9]. Similarly, Ibarra-Vega [10] and Sy et al. [11] assessed COVID-19 outbreak responses to various containment policies. SDM as a method has also been proven suitable for application in tourism management and planning [12,13,14,15]. In combination, a few simulation-based studies have been applied to explore tourism re-opening strategies amid COVID-19 [16,17] and specifically to investigate the impacts on coastal tourism [18]. The application of SDM has therefore proven to be particularly useful to explore the complex infection dynamics and to understand impacts on tourism over time by providing a virtual environment to simulate and test recovery strategies.
This study aimed to develop a system dynamics model to simulate the impacts of COVID-19 on coastal tourism in NMB, in order to provide decision-support and to inform recovery strategies. This entailed:
  • Exploring the implications of COVID-19 on the tourism sector by mapping the cause-and-effect problem dynamics;
  • Identifying key model variables that could serve as leverage points for potential management interventions;
  • Simulating scenarios of how different management interventions can facilitate sustainable recovery of the tourism sector.

2. Methods: System Analysis and Simulation Design

System dynamics modelling (SDM) was applied in this study. Model development consisted of conceptualisation, model formulation, and model testing, in line with SDM best practices [19,20]. Model conceptualisation involved desktop research and stakeholder engagement, where Causal Loop Diagramming (CLD) was applied as a tool to facilitate stakeholder engagement and to capture multiple perspectives. The stakeholders involved in the process included representatives from the tourism sector, local government, accommodation groups, and local tourism operators. The meeting process was divided into three stages held between September 2021 and February 2022. The processes consisted of individual stakeholder meetings (to capture stakeholders’ ‘mental models’) and two group modelling workshops: the first aimed at presenting the model results and discussing relevant scenarios and the second focused on discussing leverage points and management interventions from the stance of the local municipality. A more comprehensive overview of the stakeholder engagement process is available in [21]. Thereafter, model formulation entailed formulating the stock–flow diagrams (SFDs) with associated algebraic equations and parameters values. Finally, model testing was performed through a series of validation tests to build confidence in the model structure and behaviour (see Section 2.3).

2.1. Model Boundary

The model boundary was drawn by collating information from the literature and stakeholder conversations into a holistic CLD. This included identifying and mapping the common causal links that capture the dynamics associated with the impacts of COVID-19 on coastal tourism in the bay. The boundary map shows the causal links and feedback loops between the key model variables. These feedback loops are described in more detail below (Figure 1 and Table 1).

2.2. Model Structure

The model is divided into three sub-models: (1) COVID-19 infection dynamics; (2) tourism dynamics of NMB; (3) coastal tourism impacts (Figure 2). Figure 2 shows that COVID-19 affects tourism, which in turn affects COVID-19 infection dynamics. Similarly, tourism affects coastal tourism activities, which in turn affects the attractiveness of tourism in NMB. A simplified overview of the sub-model structures is shown below (Figure 3, Figure 4 and Figure 5). The model was built in Stella® Architect software [22]. It simulates the dynamics over a five-year period, from January 2019 to December 2023, using a daily time scale and the Euler integration method. The model was parameterised with data and information obtained from scientific literature, news articles, and stakeholders. Additional information on model documentation is available in the supplementary materials (Tables S1 and File S1).

2.2.1. COVID-19 Sub-Model Structure

COVID-19 Infection Dynamics

The COVID-19 sub-model captures the infection dynamics at a national scale, given that government decisions regarding the pandemic were initially based on country-level statistics, which in turn were enforced in provincial and local regions (Figure 3). The model is based on the Susceptible–Exposed–Infected–Recovered (SEIR) structure, which is commonly applied in epidemiology [7,8,9]. The COVID-19 infection is initiated by an imported infection at the beginning of 2020 through foreign tourists. Thereafter, the infection dynamics are formulated such that the Susceptible Population (60 million persons) flows into the Exposed Population depending on the infectivity of the virus, which can depend on the variant of the virus. In the model, the infectivity is estimated to be 0.0125 dmnl, so as to obtain a reproduction factor between 3 and 5 dmnl, depending on the number of social contacts (~14 persons/person/day) and duration of the infection (~14 days) [23]. After an incubation delay of approximately ~5 days [8,10], the exposed population then becomes either symptomatically or asymptomatically infectious. According to [24], it has been found, based on seroprevalence estimates (i.e., SARS-CoV-2 antibody positivity among the population), that, for every reported, case there are approximately nine asymptomatic cases (and hence unreported). This has particularly increased uncertainty regarding transmission of the virus among asymptomatic infectious and susceptible persons. Depending on the infection duration, asymptomatic and symptomatic persons recover, except for the severe symptomatic cases (~15–20% [25]) that are admitted to hospital. Further, depending on the fatality of the virus (~3–5% [10]), the hospitalised population can recover or become deceased, where the fatality fraction is subject to the level of healthcare strain, defined by hospital capacity (i.e., intensive care (ICU) beds = 3000 persons; [1,26]). Based on the level of health care strain, decisions are made based on the severity of the infection trend and hence the level of social restrictions, which, in turn, are intended to decrease the number of social contacts to slow transmission of the virus. In order to ‘control’ infection trends in the model (i.e., decrease transmission), the process of vaccination is introduced, which ultimately ‘drains’ the susceptible population stock, at least for the period of vaccine efficacy. The model does not differentiate between different types of vaccines or differences in vaccine efficacy, though this may be important to consider for future work. Nor does the model differentiate between the effectiveness of infection-induced immunity against vaccination immunity, as suggested in [27], but rather assumes that the recovered and vaccinated population may become susceptible again after 180 days (6 months) [28,29] in the absence of an immune-escaping variant. Therefore, the effects of vaccination are formulated with the purpose of decreasing the level of hospitalisations and fatalities, and to achieve ‘heard immunity’ (i.e., ~70% of the population with immune response either from vaccination or recovery from previous infection as defined by WHO) such that the likelihood of mutation and infection is decreased. The rate of vaccination is affected by a daily (initial) vaccination goal of ~300,000 persons/day [30], which is formulated through a step function starting in March 2021 and changes depending on vaccination demand, which is dependent on the perceived severity induced through the level of healthcare strain. Lastly, the rate of vaccination is constrained by vaccination hesitancy, which has been shown to range between 50 and 70% [31] on the basis of cultural grounds, or from being unaware, apathetic, or misinformed [32].

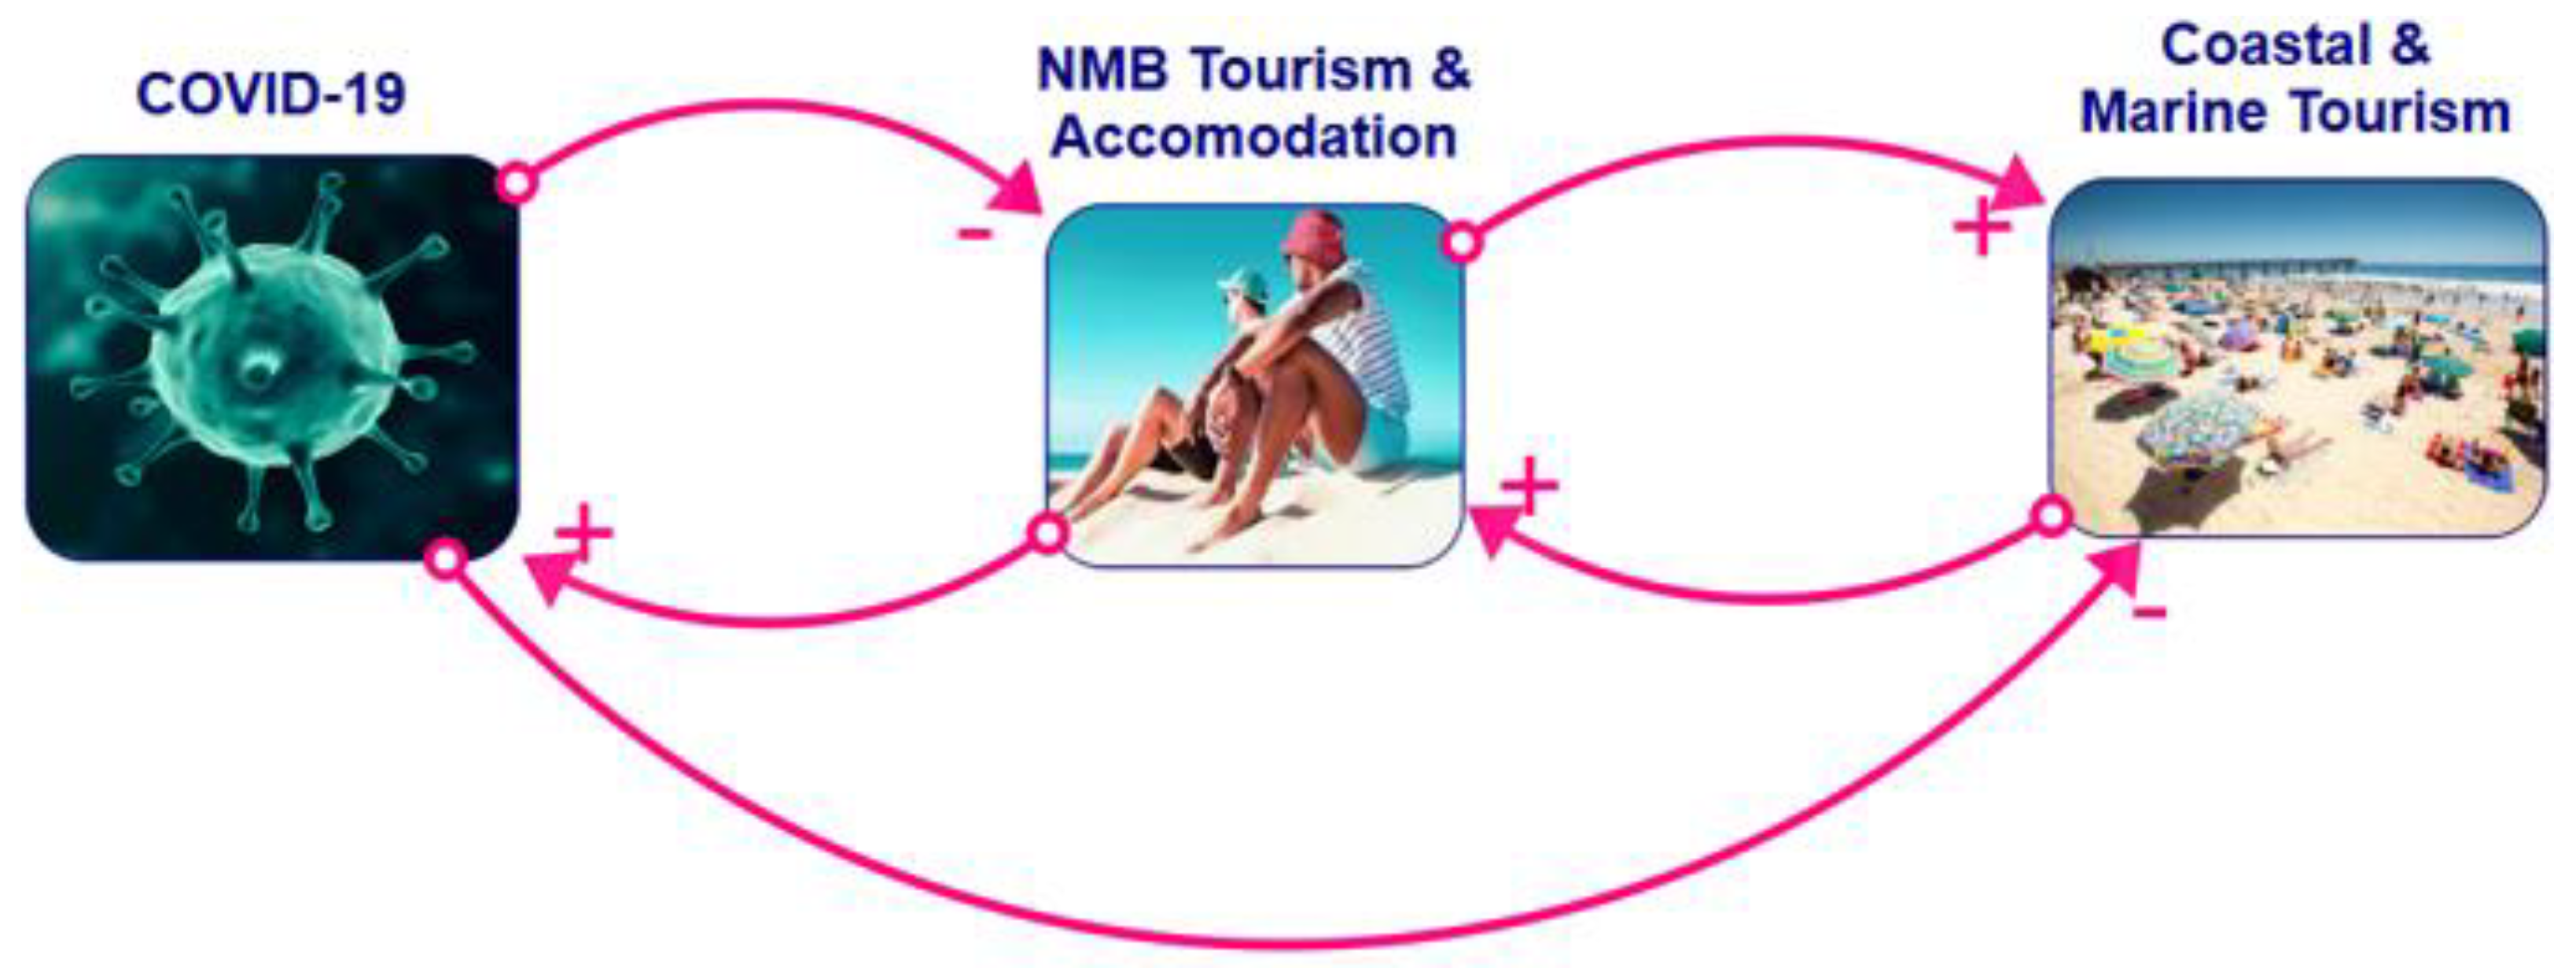
Effects of COVID-19 on Tourism Behaviour

The national infection trends and wave severity further impact tourism demand in NMB, with different effects for foreign and domestic tourism behaviour (Figure 3 and Figure 4). Foreign travel risk is formulated by applying the formula that was developed by the Centres for Disease Control and Prevention (CDC). This calculates the travel health threshold, which is based on the cumulative infection incidence per 100,000 individuals of the population over a consecutive 28-day period [33]. Then, according to the four-level system criteria of the CDC, reported numbers above 500 persons categorise countries on the red list and prohibit travel, whereas reported figures below 500 gradually lowers restrictions. Therefore, in the model, foreign tourism depends on the number of tourists that normally visit SA per year (10.2 million in 2019 [34]), subject to the current travel restriction level. In contrast, domestic tourism in SA is formulated through a domestic tourism pool, which is represented by the populations that are assumed to have ‘herd immunity’, as they are assumed to be more willing to travel. The portion of the population that are less likely to travel are those that remain susceptible and are therefore still affected by the perceived risk of travel emanating from trends in healthcare strain, which is expected to delay travel decisions by ~365 days. This logic was derived from an investigation conducted by [5], whereby changes in the infection rate directly affected the perceived severity of the situation, hence decreasing attractiveness of travel, whereas, understanding the chances of contracting the virus affected perceived susceptibility and the willingness to travel. This theory is in line with the concept of “risk habituation” by [35], whereby perceived risk decreases as threats decrease or becoming increasingly familiar. Variables associated with the effects of socio-economic uncertainty on one’s willingness to travel are additionally considered to be relevant to the problem context but have been excluded from the model boundary during the current analysis and can be considered for future adaptations.

2.2.2. Tourism Sub-Model Structure

NMB Tourism and Accommodation

In NMB, there are two stocks of tourists, namely domestic and foreign tourists, initialised to 2019 data (Figure 4). The number of tourists, both foreign and domestic, is dependent on the attractiveness of NMB as a tourist destination, which depends on factors such as seasonality, tourism infrastructure, the attractiveness of coastal and marine activities, and, finally, the effects on travel emanating from the COVID-19 infection rate (Figure 3 and Figure 4). Regardless of the purpose for travel, tourists are typically in the bay for short trips (~3 days for domestic tourists and ~2 days for foreigners [36]). The number of tourists staying in paid accommodation at any time (~36% for domestic tourists and 50% for foreign tourists), relative to the number of accommodation facilities (~400 facilities) and accommodation capacity (~15,000 persons), determines the level of accommodation occupancy. The number of bednights sold multiplied by the average rate per night (~R600 person/day) further contributes to local tourism revenue, in addition to those obtained from daily tourist spending (~R800–R1500/person/day [36]) and revenue from coastal and marine activities. It is then assumed that a fraction of total tourism revenues (~20%), collected through tourist taxes and levies, contributes towards the local municipal tourism budget. A higher tourism budget is required to increase tourism attractiveness through local investments in public and tourism infrastructure; however, degrading infrastructure simultaneously increases expenditure, in addition to operational costs and costs associated with COVID-relief funding during the periods of travel restriction. Lastly, tourism labour is assumed to increase in relation to the number of tourists visiting the bay, assuming 1 employee for every 40 tourists, calculated according to the number of employees in the sector obtained from [37,38]. In the tourism sub-model, the main variables of interest are the total number of bednights sold; accommodation occupancy; the total number of tourists; the tourism budget; tourism employees; and the state of tourist infrastructure. These variables have been identified in the literature, as well as by stakeholders, to be particularly important as indicators with which to measure the impacts of COVID-19 on the tourism sector (Figure 4).

Coastal Tourism Dynamics
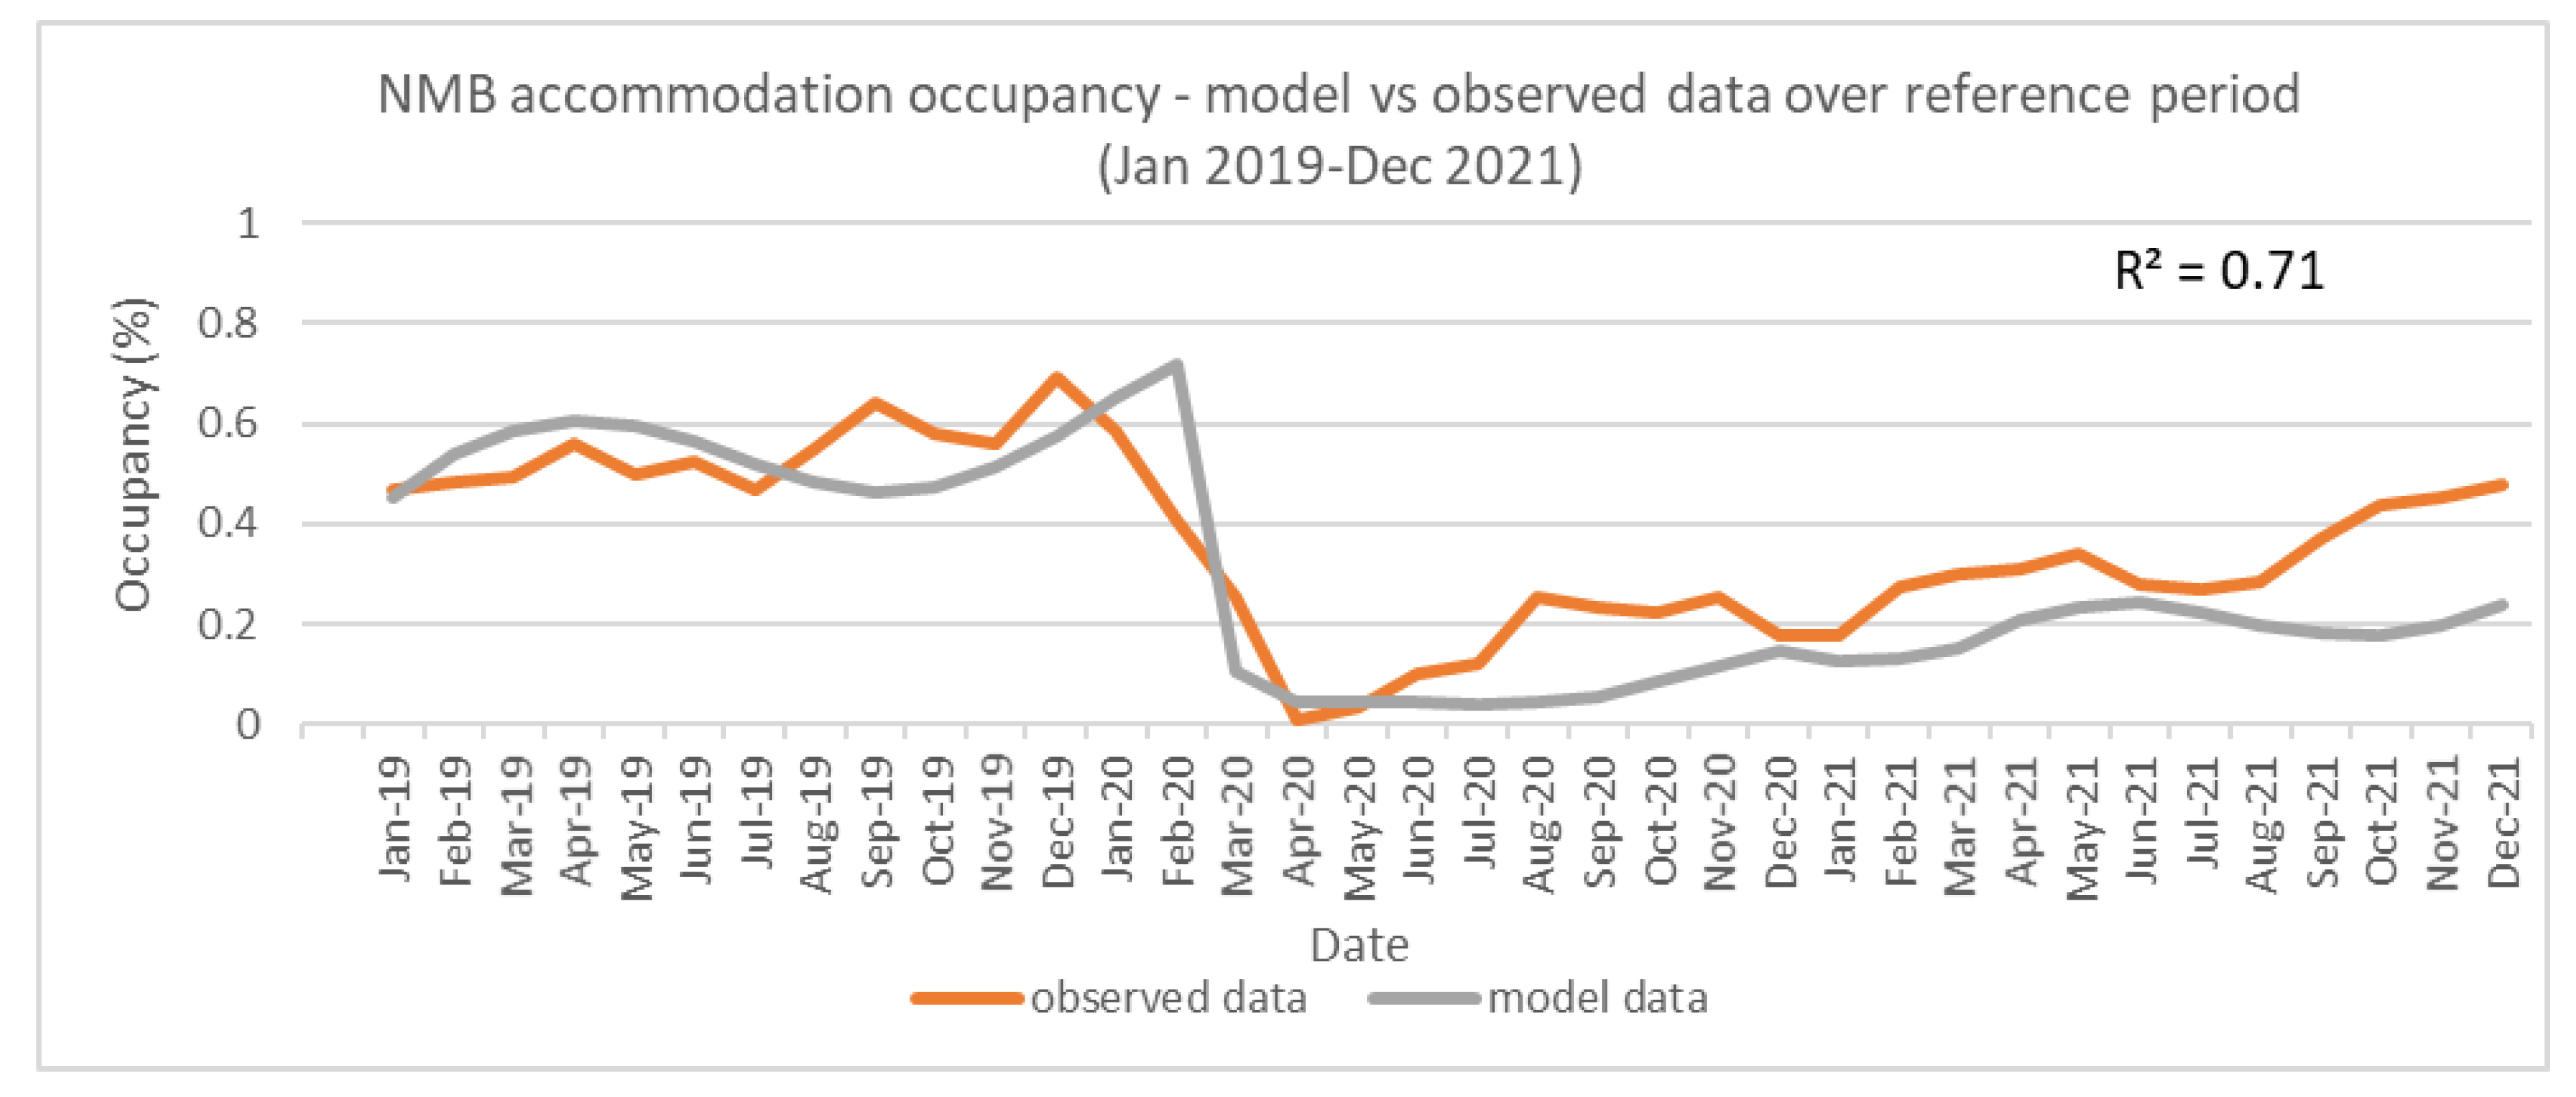
The coastal tourism sub-model specifically aims to capture the knock-on effects on beach recreation and marine tour participation and associated revenues (Figure 5). As reported in [38,39], coastal and marine tourism attracts approximately 55% of visiting tourists through beach recreation alone. The normal coastal and marine attractiveness factor is largely dependent on the marine aesthetic value of the bay, which is formulated through a stock variable “Marine health”. Marine health is, however, subject to changes in the rate of cumulative pressure from other marine developments in the bay [40] (Figure 5). Next, marine wildlife tours are considered an attractive marine activity [41], with the number of tour participants affected by the attractiveness of marine wildlife tours [42] and tour costs. The number of tourists engaging in coastal and marine activities and a portion of the revenues obtained can be considered valuable in creating marine awareness and funding conservation activities aimed at conserving marine health. All the same, the impacts that arose directly from the pandemic included beach closures and the closure of beach establishments [43]. This decreased the overall attractiveness of coastal and marine tourism, largely decreasing the number of tourists visiting the bay, with consequences on tourism accommodation, revenue, and labour (Figure 5).

2.3. Model Testing

As the study was undertaken simultaneous to the evolving dynamics of the COVID-19 pandemic, model validation was a continuous and iterative process. This involved comparing the model data to available observational data to determine the ‘goodness of fit’ and assisted in manually calibrating the model to verify the estimated model parameters. To verify the model behaviour, infection data for South Africa were sourced from Johns Hopkins University and compared to model results (Figure 6a). To calculate the ‘goodness of fit’ between the observed and model data, the model data were exported and the coefficient of determination, a measure of the data variance, was calculated in Microsoft Excel. According to the final baseline run, the model explains 73% of the data variance of the observed COVID-19 infections, measured according to the seven-day-moving average (Figure 6a). The model was first validated in October 2021, before the onset of the fourth wave associated with the Omicron variant. According to the outdated model run (October version), the projected simulation suggested that SA may experience a fourth wave over the December 2021 holiday period, albeit with a smaller amplitude (Figure 6b). This projection was consistent with the projection from the SA COVID-19 Ministerial Advisory Committee, which reported that “the fourth wave will likely be a small mini wave”, and that the severity of the fourth wave depends on a balance between the prospects of a new immune-escaping variant versus vs. the rate of vaccination by this time [24]. After observing changes in the reported infections during the fourth wave, the model structure and assumptions were re-evaluated and adjusted accordingly.
To validate trends in tourism at a local scale, observed data in accommodation occupancy from 2019 to 2021 were compared with the modelled occupancy data. Stakeholders specifically suggested the validation of trends in tourism one-year prior to the onset of the pandemic to verify the model against trends observed ‘normally’. The data were made available to the study by the Nelson Mandela Bay Municipality (NMBM), the Department of Economic Development, Tourism and Agriculture, and were recommended as an effective indicator with which to measure tourism variability at a local scale [4].
Baseline results show that the modelled accommodation occupancy captures 71% of the variance of the observed data (Figure 7). Additional testing included running extreme parameter tests and ensuring that the model was dimensionally consistent and structurally robust. Finally, a multivariate sensitivity analyses, using the Latin Hypercube Sampling method, was performed over 50 runs to investigate changes in model behaviour under a combination of parameter values. The parameter values of the included model variables were varied by 50% of the baseline value, as suggested in [19] (Table A1). Results of the multivariate sensitivity analysis are shown in Appendix A (Figure A1). As expected, the extreme conditions tests and multivariate sensitivity analysis revealed variability in the model results, though the results remained robust and behaviourally sound.

3. Results

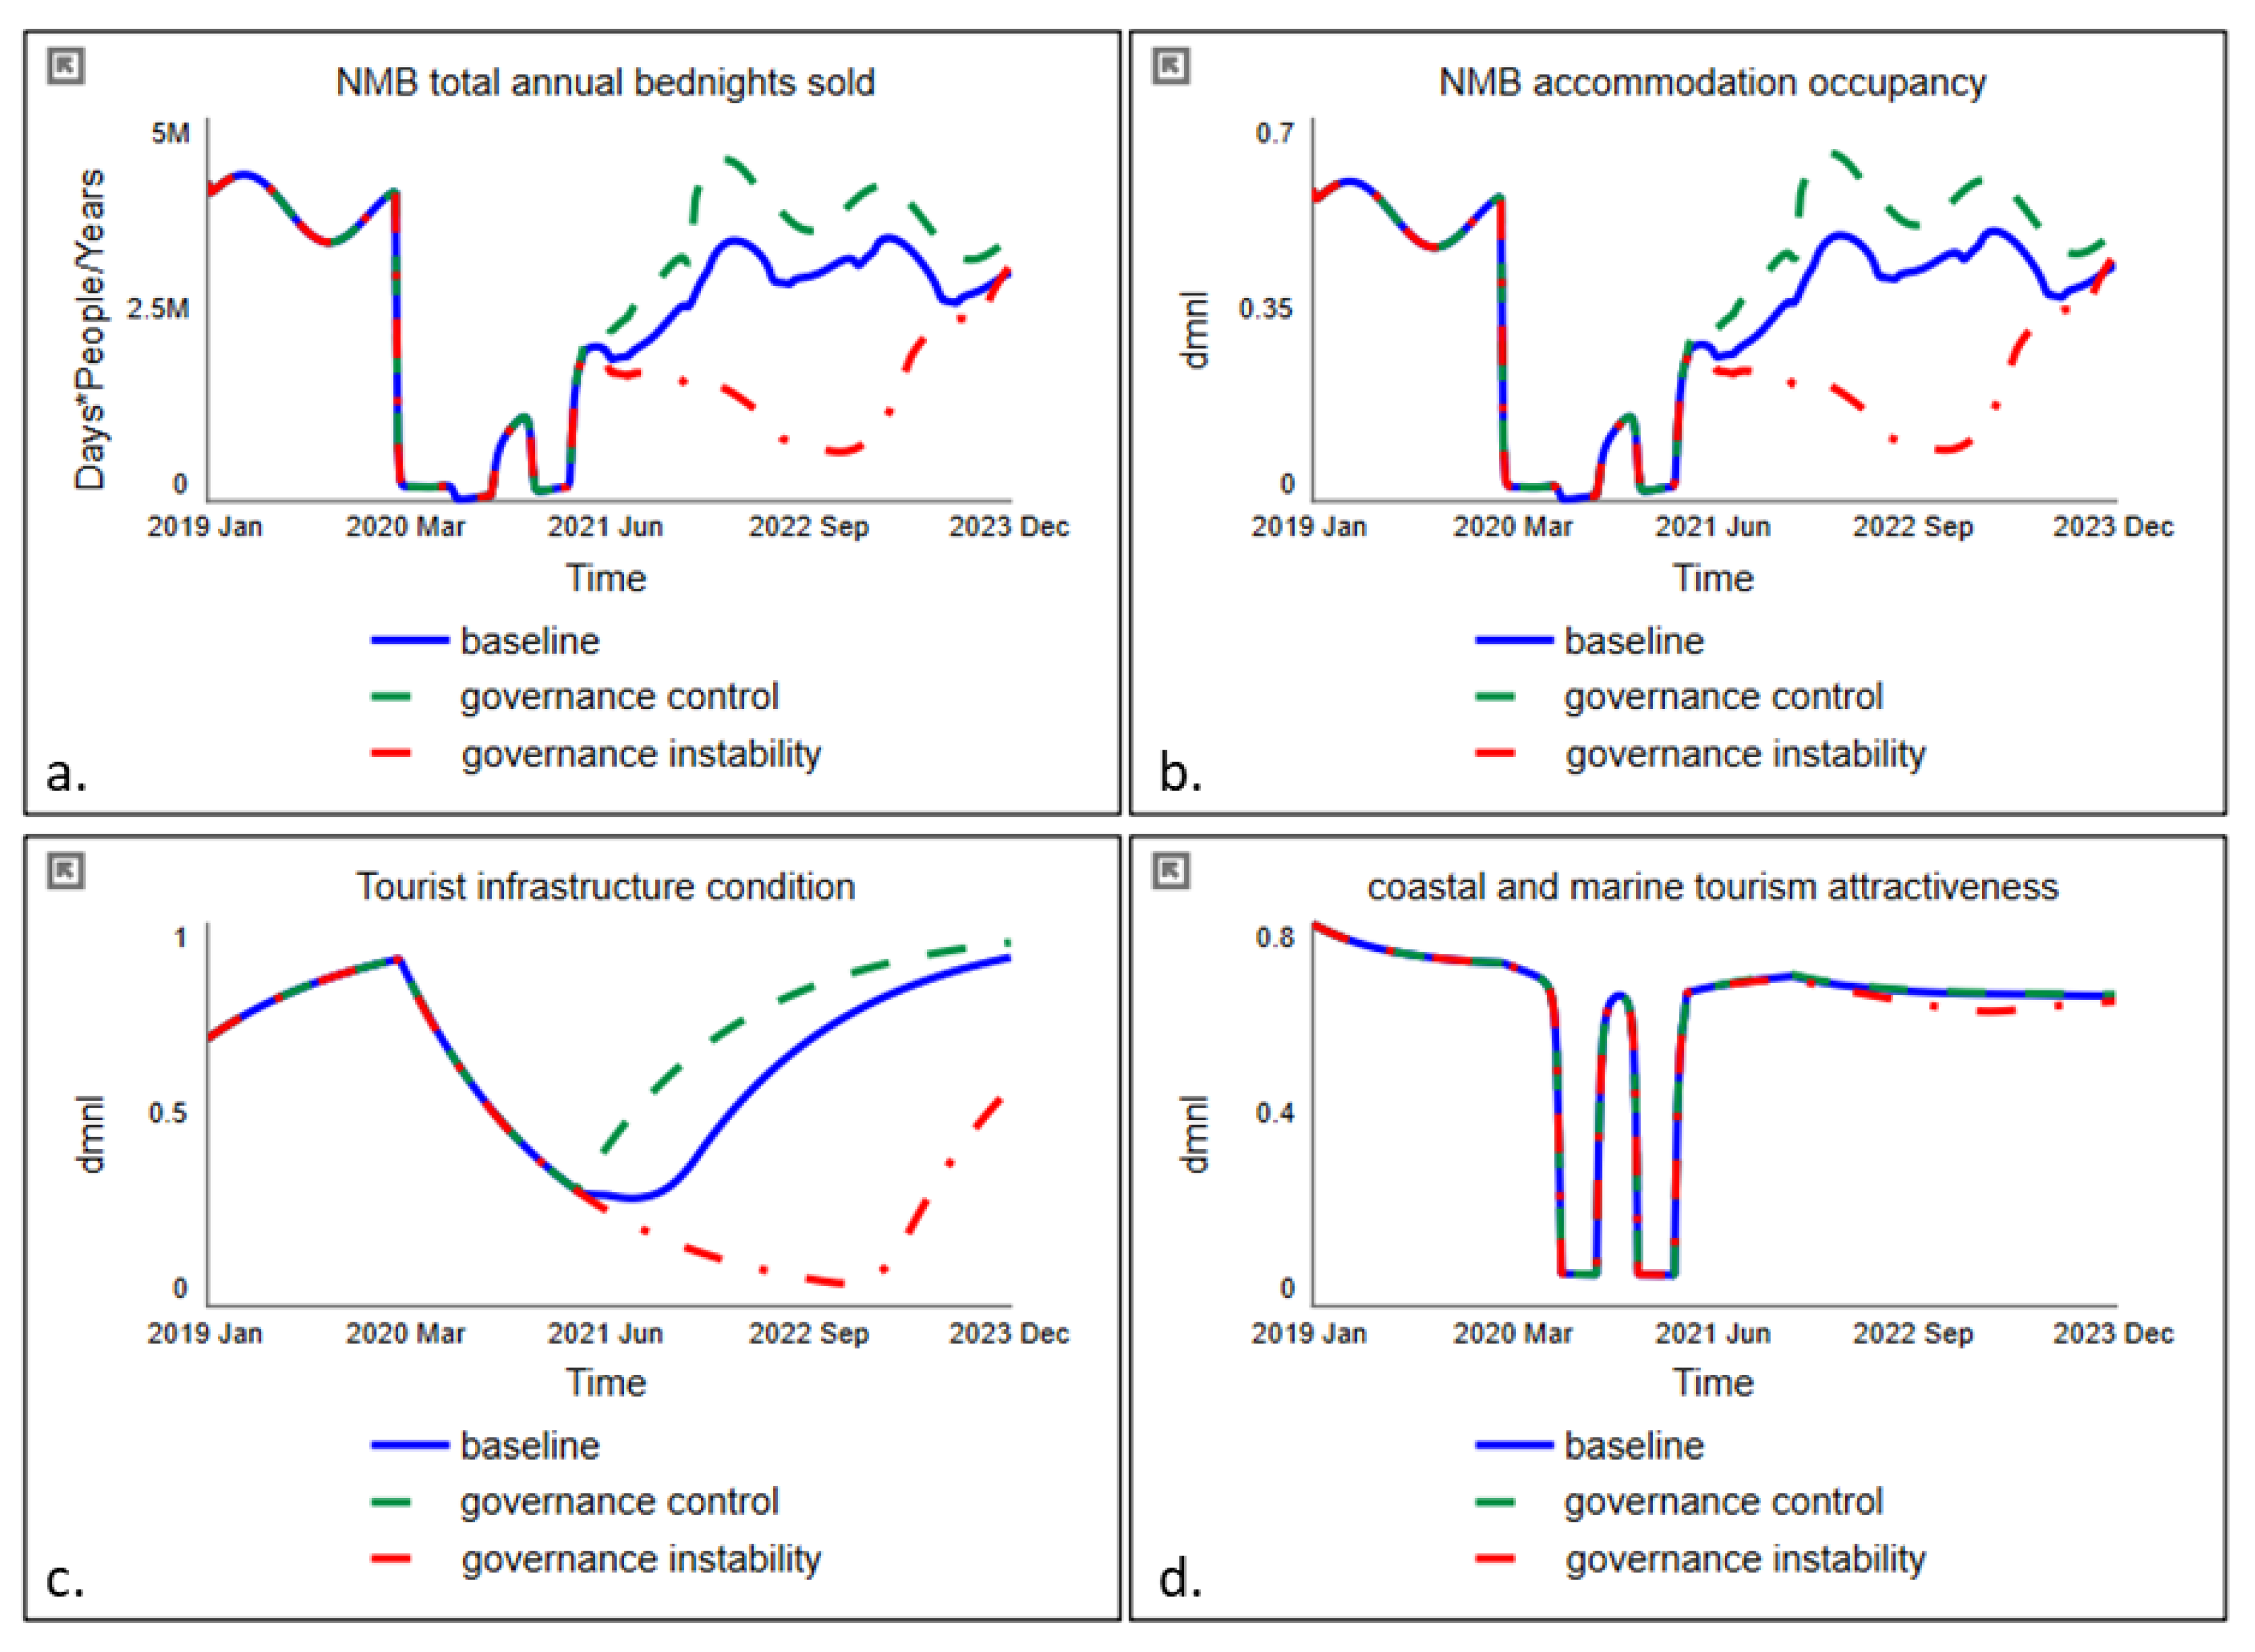
3.1. Model Scenarios

Once the model was considered to be sufficiently robust (i.e., it performed the right behaviour for the right reasons), scenario planning was performed. This consisted of testing the model results under two scenarios compared to the baseline (or business-as-usual (BAU)) scenario. The BAU scenario captures the infection trends and projected tourism recovery under current governance decision-making strategies as formulated in the model. As for the two exploratory scenarios, scenario one investigates a desirable tourism recovery strategy, assuming that the government has control of the situation, through enabling a rapid vaccination rollout process, securing efficacious vaccines, and ensuring effective tourism management. In contrast, scenario two portrays a situation of governance instability, whereby uncertainty regarding the infection trajectory, owing to high levels of vaccination hesitancy, risks of an immune-escaping variants, and a lax tourism response strategy leads to a less desirable recovery trajectory.
Table 2 shows the variables and associated parameter values that were varied during the scenario analysis. ‘Vaccination acceptance’ corresponds to the fraction of the population accepting the vaccination, and ‘vaccination efficacy’ corresponds to the probability of losing immunity after the assumed period of 180 days (or 6 months) [28]. The intervention ‘government response time’ corresponds to the time delay for government to respond to the severity of the pandemic and implement social restrictions, and changes to the ‘ICU capacity’ can affect the level of healthcare strain and, ultimately, fatalities. In the tourism sub-model, the ‘CDC travel limit’ corresponds to the threshold by which foreign travel becomes prohibited, and ‘marketing intensity’ refers to a change in marketing campaigns. Then, the ‘fraction of funds to COVID relief’ is the portion of the tourism budget that is diverted towards COVID-related costs, implementation, and business support and, lastly, ‘infrastructure upgrade costs’ refers to the minimum costs associated to small infrastructure upgrades that can contribute towards tourism attractiveness.
For the COVID-19 sub-model, the results of the scenario analysis were specifically investigated in terms of the COVID-19 infection rate and the number of vaccinated persons in SA (Figure 8). Furthermore, to investigate the impacts of COVID-19 on coastal tourism, results were analysed in terms of the total number of bednights sold in NMB, accommodation occupancy, tourism infrastructure condition, and coastal tourism attractiveness (Figure 9). Though other indicators such as tourism revenues and tourism employment are also important, these results are not shown; however, it is expected that changes in these indicators are primarily driven through changes in the number of tourists. Under the baseline simulation, the model shows three consecutive infection peaks corresponding to the results showed in the observed data, in addition to a fourth peak around December 2021, with a maximum of ~25,000 persons/days (Figure 6 and Figure 8a). Moreover, Figure 8b shows the number of vaccinated persons (assuming full vaccination) to reach approximately 18 million by February 2022, though this tends to level off, as the portion of the population that is willing to accept the vaccine becomes vaccinated and, due to decreasing vaccination demand.
Trends in NMB tourism show a sharp decrease in the numbers of bednights sold during the ‘midst’ of the pandemic, when foreign and domestic travel was prohibited, as well as when NMB was declared a national COVID-19 hotspot in December 2020, leading to subsequent beach closures (Figure 9a) [44]. Similarly, the trend in accommodation occupancy decreased to as low as 1% in April 2020 and is slowly recovering to levels around 35–40% from mid-2021, in line with observed results and stakeholder perspectives (Figure 7 and Figure 9b). Figure 9c,d shows the projected impacts of the pandemic on public and tourism infrastructure condition, which is shown to decreases over the period of the pandemic owing to a lack of tourism revenue and a diminishing tourism budget. The condition of tourist infrastructure is, however, projected to increase as tourists slowly return; however, this is dependent on the magnitude of upgrades, associated costs, and delays in initiating upgrades. Lastly, Figure 9d shows the level of participation in coastal tourism, with two evident dips in attractiveness corresponding to the time of beach closures, which drastically reduced the attractiveness of beach recreation during this time.
Results from scenario 1 illustrate a more desirable recovery trajectory, as shown in terms of the infection rate as well as in NMB tourism, with the former showing smaller infection peaks from February 2022 to December 2023 and the latter showing a visible increase in the number of tourists and bednights sold from October 2021 onwards, with trends in occupancy recovering to pre-pandemic levels in early 2022 (Figure 8 and Figure 9a,b). Figure 9c,d show that tourist infrastructure condition is also expected to recover with the return of tourists, and that no more beach closures can be expected, possibly owing to the adaptations to the levels of social restrictions due to increasing immunity. The results from scenario 2,show an increase in wave peaks, with a fifth peak expected over June 2022, followed by additional waves owed to low levels of immunity among the population as well an increased risk of breakthrough infections (Figure 8a,b). Trends in NMB tourism and accommodation concurrently take a longer time to recover to levels observed in 2019 in this scenario, with projected knock-on effects on the state of local tourism infrastructure further inhibiting future tourism growth (Figure 9a–d). Both scenarios show how the beach closures drastically impacted coastal tourism attractiveness during the periods of infection peaks; however, as social restrictions were relaxed, coastal and marine tourism attractiveness recovered (Figure 9d). Furthermore, the effect of marine health on coastal tourism attractiveness is less evident in the results, owing to a longer delay associated with changes in marine health.

3.2. Model Interface

An additional output from the study is the model visual user interface (VUI) (Figure 10), which provides a ‘user-friendly’ portal to engage with the model. Decision-makers or stakeholders can unravel the cause-and-effect model structure and explore model scenarios by adjusting the model variables through ‘levers’ on the interface. Additional variables (e.g., variant infectivity, variant introduction time) are additionally included to investigate the impacts of future variants on the resilience of tourism recovery strategies. The VUI can additionally be used in a collaborative stakeholder setting, whereby stakeholders representing different institutions or areas of the problem can implement alternative management interventions to investigate tourism recovery strategies in NMB, similar to what was demonstrated during the group stakeholder workshops.

4. Discussion: Recommendations and Policy Design

The scenario analysis that was performed to investigate the impacts of COVID-19 on coastal tourism in NMB highlighted the complexity and uncertainty that existed, and remains to exist, around projected infection trends, recovery delays, and vulnerabilities of the tourism sector to the effects of the COVID-19 pandemic (Figure 8 and Figure 9). During the time of writing, the baseline simulation suggested that, under current governance response and vaccination rates, subsequent waves are expected with lower infection peaks and levels of severity in terms of healthcare strain and fatalities (Figure 8 and Figure 9). While this may be logical, the projection relies on the assumption that current vaccinations are sufficiently effective against existing variants, though skepticism exists regarding the length of the immunity of current vaccinations (i.e., waning immunity) [45], as well as existing controversy surrounding mandatory vaccination protocols to overcome vaccination hesitancy [32,46]. Moreover, the analysis reveals that, even though government can adopt different means to respond, there can be scenarios where even strong response strategies may be weakened by factors beyond their control, such as by breakthrough infections owing to the introduction of immune-escaping variants, as shown by the recent Omicron variant [47].
Nonetheless, the model is an analytical tool with which to investigate uncertainty, such that governments could ‘test’ their strategies through ‘what-if’ scenarios in order to evaluate the resilience of their responses and, hence, the knock-on effects on the tourism sector. Moreover, the model demonstrated how the rate of tourism recovery is dependent on various feedback effects and the effectiveness of management interventions under alternative governance scenarios. The analysis has additionally highlighted that there is not necessarily only one response with which to assist in the recovery of coastal tourism in NMB, but rather multiple interventions, each with a different degree of leverage that could simultaneously be applied to achieve a more desirable trajectory. Such interventions could include, but are not limited to, the following:
  • Rapid vaccination procurement and administration;
  • Vaccination awareness and campaigns to address vaccination hesitancy;
  • Research and development into vaccination efficacy;
  • Adaptations to international travel limit thresholds recognising the need for personal responsibility and well-being relative to situational awareness;
  • Allowing tourists to return to enhance tourism cash flow and the recovery of the tourism budget;
  • Redirecting and possibly increasing the tourism budget towards public and tourism infrastructure to increase tourism attractiveness;
  • Funding diversion towards tourism marketing to stimulate demand;
  • Collaboration among local government directorates (tourism, public health, safety and security, infrastructure and engineering) to establish a consensus regarding departments’ recovery mandates.
Lastly, there has been confusion regarding the levels of restrictions, which has contributed to the levels of social and sectoral adherence fatigue. Though the government has opted towards adaptive, risk-adverse strategies (as is required for a rapid response), adverse and sudden changes to COVID-19 regulations and decision-making thresholds has made it difficult for sectors to adapt. Therefore, governments should remain transparent about their decision-making criteria and develop decision frameworks that are informed through scientifically robust models and datasets.

5. Conclusions

This study highlights the importance of exploratory simulation to support decision-making. Using system dynamics modelling, this study investigated the impacts of COVID-19 on coastal tourism in Nelson Mandela Bay (NMB), South Africa, with the aim to devise and simulate the effects of potential recovery pathways. The model provided the means to simulate stakeholder’s mental models under alternative scenarios to demonstrate how feedback behaviour and time delays can affect tourism recovery. Though the model boundary may be limited to this specific problem, the boundary may be adapted, and the assumptions adjusted, to explore similar policy questions in the future. This can include downscaling the model to investigate infection trends at a more local scale and the transmission of COVID-19 among tourists and the local population in NMB, as well as incorporating localised socio-economic impacts into the model boundary. Additional scenarios can also be tested to investigate the effectivity of recommended tourism policies to future variants. Finally, additional behavioural validation with updated tourism data could further improve the analysis. This study concludes that there are various levels of uncertainty that need to be considered during the development of a recovery plan for the tourism sector or any other economic sector in this regard, but that small changes in multiple interventions could result in more sustainable recovery pathways.

Supplementary Materials

The following supporting information can be downloaded at: https://www.mdpi.com/article/10.3390/systems10040120/s1. Table S1. Model Documentation. File S1. Model Equations.

Author Contributions

E.V.-M. was the lead modeler and author on this paper. J.K.C.-H. assisted in model development, stakeholder engagement and writing. A.T.L. and B.S. contributed to writing, editing and providing financial support. All authors have read and agreed to the published version of the manuscript.

Funding

This research was funded by the One Ocean Hub GCRF UKRI grant NE/S008950/1. Additional support and the APC was provided by the South African Research Chairs Initiative through the South African National Department of Science and Innovation/National Research Foundation, by a Community of Practice grant (UID: 110612).

Institutional Review Board Statement

The study was conducted in accordance with the Declaration of Helsinki and approved by the Ethics Committee of Nelson Mandela University (H20-BES-DEV-003) for studies involving stakeholder engagement.

Informed Consent Statement

Informed consent was obtained from all participants involved in the study.

Data Availability Statement

All data used in this study can be found at https://ourworldindata.org/explorers/coronavirus-data-explorer (accessed on 15 February 2022), and [48] or in indicated references. The model interface is accessible at https://exchange.iseesystems.com/public/esteevermeulen/nelson-mandela-bay-covid-19---coastal-and-marine-tourism-recovery-tool (accessed on 8 July 2022).

Acknowledgments

The authors wish to thank all involved stakeholder institutions for their participation in the study.

Conflicts of Interest

The authors declare no conflict of interest.

Appendix A

Table A1. Model variables and associated parameter values applied in the multivariate sensitivity analysis. Parameter values were varied by ±50% of the base value and simulated using a UNIFORM distribution.
COVID-19 Sub-Model
Asymptomatic contacts[7; 14; 21]
Infectivity[0.00625; 0.0125; 0.01875]
Immunity duration[90; 180; 270]
Vaccination hesitancy[0.50; 0.70; 0.80]
Hospital capacity (change for scenarios)[1500; 3000; 4500]
ICU fraction[0.10; 0.20; 0.30]
Travel risk perception delay[180; 365; 545]
Governance reaction time (time to perceive severity)[15; 30; 45]
NMB Tourism & Accommodation Sub-Model
Fraction of tourism revenues to NMB tourism budget[0.10; 0.20; 0.30]
Operational costs fraction[0.15; 0.3; 0.45]
Public and Tourist Infrastructure costs[1.5 × 10⁶; 3 × 10⁶; 4.5 × 10⁶]
Public and Tourist Infrastructure condition (t0)[0.6; 0.8; 1]
Fraction of tourism budget to COVID-relief[0.25; 0.5; 0.75]
Coastal Tourism Sub-Model
Marine heath (t0)[0.6; 0.8; 1]
Figure A1. Outputs from the multivariate sensitivity analysis showing the variability in trends of infectious cases (persons/days) (a), vaccinated persons (persons) (b), the number of tourists visiting Nelson Mandela Bay (persons/year) (c), and accommodation occupancy levels (dmnl) (d). The confidence intervals represent the spread of uncertainty with 50% in blue, 75% in red, 95% in magenta, 100% in green, and the mean result in orange.
Systems 10 00120 g0a1

References

  1. Schröder, M.; Bossert, A.; Kersting, M.; Aeffner, S.; Coetzee, J.; Timme, M.; Schlüter, J. COVID-19 in South Africa: Outbreak despite Interventions. Nature Sci. Rep. 2021, 11, 4956. [Google Scholar] [CrossRef] [PubMed]
  2. UNCTAD. COVID-19 and Tourism: Assessing the Economic Consequences; UNCTAD: Geneva, Switzerland, 2020; Volume 9. [Google Scholar]
  3. UNWTO. COVID-19 and Tourism 2020: A Year in Review; UNWTO: Madrid, Spain, 2020. [Google Scholar]
  4. NMBM EDTA. Nelson Mandela Bay Municipality—Economic Development, Tourism and Agriculture: Tourism Master Plan 2021–2030; Gqeberha, South Africa, 2021. Available online: https://www.nelsonmandelabay.gov.za/DataRepository/Documents/2021-22-idp-adopted_6Mb5j.pdf (accessed on 25 February 2022).
  5. Naseer, K.; Qazi, J.; Qazi, A.; Avuglah, B.K.; Tahir, R.; Rasheed, R.A.; Khan, S.K.; Khan, B.A.; Zeeshan, M.; Humayun, M.A.; et al. Travel Behaviour Prediction amid COVID-19 Underlaying Situational Awareness Theory and Health Belief Model. Behav. Inf. Technol. 2021, 1–11. [Google Scholar] [CrossRef]
  6. Richmond, B. Systems Thinking: Critical Thinking Skills for the 1990s and Beyond. Syst. Dyn. Rev. 1993, 9, 113–133. [Google Scholar] [CrossRef]
  7. Homer, J.B.; Hirsch, G.B. System Dynamics Modeling for Public Health: Background and Opportunities. Am. J. Public Health 2006, 96, 452–458. [Google Scholar] [CrossRef] [PubMed]
  8. Rahmandad, H.; Lim, T.Y.; Sterman, J. Behavioral Dynamics of COVID-19: Estimating Underreporting, Multiple Waves, and Adherence Fatigue across 92 Nations. Syst. Dyn. Rev. 2021, 37, 5–31. [Google Scholar] [CrossRef] [PubMed]
  9. Struben, J. The Coronavirus Disease (COVID-19) Pandemic: Simulation-Based Assessment of Outbreak Responses and Postpeak Strategies. Syst. Dyn. Rev. 2020, 36, 247–293. [Google Scholar] [CrossRef]
  10. Ibarra-Vega, D. Lockdown, One, Two, None, or Smart. Modeling Containing COVID-19 Infection. A Conceptual Model. Sci. Total Environ. 2020, 730, 138917. [Google Scholar] [CrossRef]
  11. Sy, C.; Ching, P.M.; San Juan, J.L.; Bernardo, E.; Miguel, A.; Mayol, A.P.; Culaba, A.; Ubando, A.; Mutuc, J.E. Systems Dynamics Modeling of Pandemic Influenza for Strategic Policy Development: A Simulation-Based Analysis of the COVID-19 Case. Process Integr. Optim. Sustain. 2021, 5, 461–474. [Google Scholar] [CrossRef]
  12. Sedarati, P.; Santos, S.; Pintassilgo, P. System Dynamics in Tourism Planning and Development. Tour. Plan. Dev. 2019, 16, 256–280. [Google Scholar] [CrossRef]
  13. Kapmeier, F.; Gonçalves, P. Wasted Paradise? Policies for Small Island States to Manage Tourism-Driven Growth While Controlling Waste Generation: The Case of the Maldives. Syst. Dyn. Rev. 2018, 34, 172–221. [Google Scholar] [CrossRef]
  14. Mai, T.; Smith, C. Scenario-Based Planning for Tourism Development Using System Dynamic Modelling: A Case Study of Cat Ba Island, Vietnam. Tour. Manag. 2018, 68, 336–354. [Google Scholar] [CrossRef]
  15. Pizzitutti, F.; Walsh, S.J.; Rindfuss, R.R.; Gunter, R.; Quiroga, D.; Tippett, R.; Mena, C.F. Scenario Planning for Tourism Management: A Participatory and System Dynamics Model Applied to the Galapagos Islands of Ecuador. J. Sustain. Tour. 2017, 25, 1117–1137. [Google Scholar] [CrossRef]
  16. Škare, M.; Soriano, D.R.; Porada-Rochoń, M. Impact of COVID-19 on the Travel and Tourism Industry. Technol. Forecast. Soc. Change 2021, 163, 120469. [Google Scholar] [CrossRef] [PubMed]
  17. Zhong, L. A Dynamic Pandemic Model Evaluating Reopening Strategies amid COVID-19. PLoS ONE 2021, 16, e0248302. [Google Scholar] [CrossRef] [PubMed]
  18. Gu, Y.; Onggo, B.S.; Kunc, M.H.; Bayer, S.; Gu, Y.; Onggo, B.S.; Kunc, M.H.; Bayer, S. Current Issues in Tourism Small Island Developing States (SIDS) COVID-19 Post-Pandemic Tourism Recovery: A System Dynamics Approach Small Island Developing States (SIDS) COVID-19 Post-Pandemic. Curr. Issues Tour. 2021, 25, 1481–1508. [Google Scholar] [CrossRef]
  19. Ford, A. Modelling the Environment, 2nd ed.; Island Press: Washington, DC, USA, 2009. [Google Scholar]
  20. Sterman, J.D. Business Dynamics: Systems Thinking and Modeling for a Complex World; McGraw-Hill Education: New York, NY, USA, 2010; ISBN 007238915X. [Google Scholar]
  21. Vermeulen-Miltz, E.; Clifford-Holmes, J.K.; Snow, B.; Lombard, A.T. COVID-19 and Tourism Recovery in Nelson Mandela Bay, South Africa: A Participatory System Dynamics Approach. J. Sustain. Tour. 2022. in review. [Google Scholar]
  22. Richmond, B.; Peterson, S. An Introduction to Systems Thinking, STELLA; High Performing Systems, Inc.: Watkinsville, GA, USA, 2001; ISBN 0970492111. [Google Scholar]
  23. Khairulbahri, M. Modeling the Effect of Asymptomatic Cases, Social Distancing, and Lockdowns in the First and Second Waves of the COVID-19 Pandemic: A Case Study of Italy. SciMed. J. 2021, 3, 265–273. [Google Scholar] [CrossRef]
  24. Grant, L.; Otter, A.; Malan, M. How Do We Know If SA Is in a Third COVID-19 Wave—And Could There Be a Fourth? Mail Guardian. 9 June 2021. Available online: https://mg.co.za/coronavirus-essentials/2021-06-09-how-do-we-know-if-sa-is-in-a-third-covid-19-wave-and-could-there-be-a-fourth/ (accessed on 31 August 2021).
  25. Li, Q.; Guan, X.; Wu, P.; Wang, X.; Zhou, L.; Tong, Y.; Ren, R.; Leung, K.S.M.; Lau, E.H.Y.; Wong, J.Y.; et al. Early Transmission Dynamics in Wuhan, China, of Novel Coronavirus–Infected Pneumonia. N. Engl. J. Med. 2020, 382, 1199–1207. [Google Scholar] [CrossRef]
  26. Naidoo, R.; Naidoo, K. Prioritising ‘Already-Scarce’ Intensive Care Unit Resources in the Midst of COVID-19: A Call for Regional Triage Committees in South Africa. BMC Med. Ethics 2021, 22, 28. [Google Scholar] [CrossRef]
  27. Brereton, C.; Pedercini, M. COVID-19 Case Rates in the UK: Modelling Uncertainties as Lockdown Lifts. Systems 2021, 9, 60. [Google Scholar] [CrossRef]
  28. SAT, South African Tourism. The Road to Recovery Report: South Africa Tourism; SAT, South African Tourism: Johannesburg, South Africa, 2021; Volume 2. [Google Scholar]
  29. Goldberg, Y.; Mandel, M.; Bar-On, Y.M.; Bodenheimer, O.; Freedman, L.; Haas, E.J.; Milo, R.; Alroy-Preis, S.; Ash, N.; Huppert, A. Waning Immunity after the BNT162b2 Vaccine in Israel. N. Engl. J. Med. 2021, 385, e85. [Google Scholar] [CrossRef] [PubMed]
  30. Merten, M. South Africa Shifts the COVID-19 Vaccination Goal Posts to 70% of Adults by Christmas. Daily Maverick. 9 September 2021. Available online: https://www.dailymaverick.co.za/article/2021-09-09-south-africa-shifts-the-covid-19-vaccination-goal-posts-to-70-of-adults-by-christmas/ (accessed on 25 February 2022).
  31. Ebrahim, Z. COVID-19: Three SA Experts Weigh in on Breakthrough Infections, Immunity, and Vaccine Hestiancy. News24 Health 2021. Available online: https://www.news24.com/health24/medical/infectious-diseases/coronavirus/to-vaccinate-or-not-to-vaccinate-against-covid-19-three-sa-experts-weigh-in-20210920-2 (accessed on 20 September 2021).
  32. Mumtaz, N.; Green, C.; Duggan, J. Exploring the Effect of Misinformation on Infectious Disease Transmission. Systems 2022, 10, 50. [Google Scholar] [CrossRef]
  33. CDC. How CDC Determines the Level for COVID-19 Travel Health Notices; CDC: Atlanta, GA, USA, 2021.
  34. Stats, S.A. Tourism 2020. In Report No. 03-51-02; 2020; Volume 2. Available online: http://www.statssa.gov.za/publications/Report-03-51-02/Report-03-51-022020.pdf (accessed on 25 February 2022).
  35. Raude, J.; MCColl, K.; Flamand, C.; Apostolidis, T. Understanding Health Behaviour Changes in Response to Outbreaks: Findings from a Longitudinal Study of a Large Epidemic of Mosquito-Borne Disease. Soc. Sci. Med. 2019, 230, 184–193. [Google Scholar] [CrossRef] [PubMed]
  36. NMBM EDTA Nelson Mandela Bay Tourism Statistics 2013–2019; 2019. Available online: https://www.statssa.gov.za/ (accessed on 25 February 2022).
  37. Myles, P.; Louw, E. Nelson Mandela Bay 2011 Annual Tourism Research Report. 2011. Available online: https://www.nmbt.co.za/uploads/1/files/doc_2011_annual_tourism_research_report.pdf (accessed on 25 February 2022).
  38. Myles, P.; Louw, E. Nelson Mandela Bay 2014 Annual Tourism Research Report. 2014. Available online: https://www.nmbt.co.za/uploads/1/files/doc_2014_annual_tourism_research_report.pdf (accessed on 25 February 2022).
  39. DEDEAT. Eastern Cape Tourism State of Play Study; Report Compiled for Eastern Cape Department of Economic Development, Environmental Affairs and Tourism by Grant Thornton; Eastern Cape Department of Economic Development, Environmental Affairs and Tourism: Bisho, South Africa, 2013. [Google Scholar]
  40. Vermeulen-Miltz, E.; Clifford-Holmes, J.K.; Scharler, U.M.; Lombard, A.T. A System Dynamics Model to Support Marine Spatial Planning in Algoa Bay, South Africa. Environ. Model. Softw. 2022. in review. [Google Scholar]
  41. Gary, K. “Know Your Bay” A Guide to the Features and Creatures of Our Algoa Bay Hope Spot; WESSA: Cape Town, South African, 2018. [Google Scholar]
  42. Judge, C.; Penry, G.S.; Brown, M.; Witteveen, M. Clear Waters: Assessing Regulation Transparency of Website Advertising in South Africa’s Boat-Based Whale-Watching Industry. J. Sustain. Tour. 2020, 29, 964–980. [Google Scholar] [CrossRef]
  43. Zielinski, S.; Botero, C.M. Beach Tourism in Times of COVID-19 Pandemic: Critical Issues, Knowledge Gaps and Research Opportunities. Int. J. Environ. Res. Public Health 2020, 17, 7288. [Google Scholar] [CrossRef]
  44. Ellis, E. How Nelson Mandela Bay Went from 349 to 3092 Cases in Two Weeks. Daily Maverick. 7 November 2020. Available online: https://www.dailymaverick.co.za/article/2020-11-07-how-nelson-mandela-bay-went-from-349-to-3092-cases-in-two-weeks/ (accessed on 6 July 2021).
  45. Gregory, A. Pfizer Covid Jab “90% Effective against Hospitalisation for at Least 6 Months”. Guardian. 5 October 2021. Available online: https://www.theguardian.com/world/2021/oct/05/pfizer-covid-jab-90-effective-against-hospitalisation-for-at-least-6-months? (accessed on 16 November 2021).
  46. World Health Organisation. COVID-19 and Mandatory Vaccination: Ethical Considerations and Caveats; Policy Brief; WHO: Geneva, Switzerland, 2021; pp. 13–17. [Google Scholar]
  47. Schmidt, C. Why Is Omicron So Contagious? Scientific American. 17 December 2021. Available online: https://www.scientificamerican.com/article/why-is-omicron-so-contagious/ (accessed on 25 January 2022).
  48. Dong, E.; Du, H.; Gardner, L. An Interactive Web-Based Dashboard to Track COVID-19 in Real Time. Lancet Infect. Dis. 2020, 20, 533–534. [Google Scholar] [CrossRef]
Figure 1. Casual map (or Casual-Loop-Diagram) illustrating the key model variables and feedback loops making up the model structure. Positive arrows (in green) represent a positive polarity and negative arrows (in red) represent a negative polarity; ‘B’ represents a balancing (negative) loop and ‘R’ represents a reinforcing (positive) loop. Orange variables show the suggested leverage points. Grey boxes illustrate areas of input from different stakeholder groups.
Systems 10 00120 g001
Figure 2. Holistic model structure showing the links between the three submodels.
Systems 10 00120 g002
Figure 3. Simplified stock–flow diagram showing the main model variables that were formulated to simulate the COVID-19 infection dynamics at a national scale. Encircled variables represent the key output variables of interest, which were chosen based on their importance for decision-making and policy analysis. Variables in pink are those connected to another sub-model, and orange variables are applied in scenario analysis or in the visual user interface. This structure also applies to Figure 4 and Figure 5 below.
Systems 10 00120 g003
Figure 4. Stock–flow diagram showing the main model variables that were formulated to capture the impacts of COVID-19 on tourism in Nelson Mandela Bay (NMB).
Systems 10 00120 g004
Figure 5. Stock–flow diagram showing the main model variables that were formulated to capture the impacts of COVID-19 on coastal and marine tourism activities.
Systems 10 00120 g005
Figure 6. Behaviour over time graphs of the seven-day-moving average of infections in South Africa (persons/days) over the reference period (January 2020–November 2021 or 664 days) (a) and for the projected model period (December 2023 or 1444 days) (b). Model results are shown in orange and observed data obtained from Our World in Data are shown in blue.
Systems 10 00120 g006
Figure 7. Nelson Mandela Bay accommodation occupancy levels as observed (in orange) and simulated in the model (in grey) from January 2019 to December 2021.
Systems 10 00120 g007
Figure 8. Model results of the infectious cases (persons/days) (a) and vaccinated population (persons) (b) under three scenarios. The baseline run (or business-as-usual scenario) is shown in solid blue, scenario one in dashed green lines, and scenario two in dot-dashed red.
Systems 10 00120 g008
Figure 9. Model results of the total number of tourist bednight sales in NMB (people.days/years) (a) and associated tourism indicators: accommodation occupancy (dmnl) (b), tourist infrastructure condition (dmnl) (c) and coastal marine attractiveness (dmnl) (d) under three model scenarios. The baseline run (or business-as-usual scenario) is shown in solid-blue, scenario one in dashed green lines and two in dot-dashed red.
Systems 10 00120 g009
Figure 10. Central control panel in the visual user interface to enable additional scenario analyses. The interface is accessible through the following link: https://exchange.iseesystems.com/public/esteevermeulen/nelson-mandela-bay-covid-19---coastal-and-marine-tourism-recovery-tool (accessed on 8 July 2022).
Systems 10 00120 g010
Table 1. Description of the balancing and reinforcing feedback loops affecting model behaviour. The sequence of variables in each loop is described, where a plus corresponds to a positive polarity and a minus a negative polarity.
Feedback LoopFeedback Loop Description
Balancing Feedback Loops
B1 “virus running out of fuel”
(infectedsusceptible + risk of infection + infected)
The “virus running out of fuel” balancing loop explains how the infection population decreases as the susceptible population decreases, thus limiting the number of infection cases. More susceptible persons, more infections, more infections, less susceptible people.
B2 “stay safe”
(infected + hospitalised + healthcare strain + social restrictionsrisk of infection + infected)
“Stay safe” demonstrates how a reduction in social contacts through lockdown and social distancing regulations reduces the risk of infection, which decreases the infected population. More infections, more social restrictions, lower risk of infection, lower infected population.
B3 “vaccination relief”
(infected + hospitalised + healthcare strain + perceived severity +vaccination demand + vaccinatedsusceptible + risk of infection + infected)
This loop shows that more infected cases result in a higher vaccination demand, which in turn may increase the number of vaccinated persons, which reduces the susceptible population vulnerable to being infected.
B4 “vaccination immunity”
(hospitalised + healthcare strain + perceived severity + vaccination demand + vaccinatedinfection severity + hospitalised)
The “vaccination immunity loop” captures the effects of decreased severity and hospitalisations as the vaccinated population increases.
B5 “foreign travel lock-down”
(infected + international travel banforeign tourists + infected)
The foreign and domestic tourism lockdown loops explain how the number of infected cases decreases the number of foreign and domestic tourists due to various travel restrictions. This results in less movement from tourists and, hence, the risk of infection transmission.
B6 “domestic travel lock-down”
(infected + perceived severity + travel risktourism attractiveness + domestic tourists + infected)
B7 “too much room at the inn”
(accommodation occupancy − closures − capacityoccupancy)
This loop explains how a low accommodation occupancy can result in more accommodation closures, which in turn decreases tourism accommodation capacity, which increases the accommodation occupancy fraction across the metro.
Reinforcing feedback loops
R1 “contact spreading”
(infected + risk of infection + infected)
Contact spreading explains that more infected persons can increase the risk of infection, transmission of the infection, and, hence, the number of infections. However, this loop is counteracted on by the ‘virus running out of fuel’ balancing loop.
R2 “reinfections”
(infected + recovered + herd immunity + susceptible + risk of infection + infected)
The “reinfections loop” shows the reinforcing effect, where those who have recovered from infection or who were vaccinated become susceptible again after the assumed immunity delay.
R3 “tourism infrastructure investment”
(tourism attractiveness + tourists + revenues + public infrastructure + tourism attractiveness)
The tourism infrastructure investment loop shows that an increase in tourism can increase the tourism budget, which can result in higher investment in public and tourism infrastructure, which can increase the attractiveness of tourism and hence the number of tourists.
R4 “marine aesthetic beauty”
(coastal and marine attractiveness + marine tours + tourist participation + marine health awareness + marine health + attractiveness)
“Nature showing off” explains how a healthy marine environment can increase the level of participation in coastal and marine activities, which can result in a higher awareness of the natural value of the bay and a greater awareness of the need to protect this natural value.
Table 2. Key variables and associated parameter values applied in the scenario analysis.
Model Parameter and UnitBase Value–Business as UsualScenario 1–Governance ControlScenario 2–Governance Instability
COVID-19 Interventions
Vaccination acceptance (dmnl) (opposite to hesitancy)0.500.800.40
Vaccination efficacy (immunity duration) (dmnl)18027090
Government response time (days)301540
ICU capacity (persons)300040002500
Tourism Interventions
CDC travel limit (persons)5001000800
Marketing intensity (%)11.21
Fraction of tourism budget to COVID relief (%)10.30.4
Infrastructure upgrade costs (R)3 × 1062 × 1064 × 106
Publisher’s Note: MDPI stays neutral with regard to jurisdictional claims in published maps and institutional affiliations.

