Article

Determining Soil Microbial Communities and Their Influence on Ganoderma Disease Incidences in Oil Palm (Elaeis guineensis) via High-Throughput Sequencing

by
Yit Kheng Goh
1,2,
Muhammad Zarul Hanifah Md Zoqratt
3,
You Keng Goh
2,
Qasim Ayub
1,3 and
Adeline Su Yien Ting
1,*
1
School of Science, Monash University Malaysia, Bandar Sunway 47500, Malaysia
2
Advanced Agriecological Research Sdn. Bhd., Petaling Jaya 47810, Malaysia
3
Monash University Malaysia Genomics Facility, Bandar Sunway 47500, Malaysia
*
Author to whom correspondence should be addressed.
Biology 2020, 9(12), 424; https://doi.org/10.3390/biology9120424
Submission received: 27 October 2020 / Revised: 23 November 2020 / Accepted: 25 November 2020 / Published: 27 November 2020
(This article belongs to the Collection Featured Student Papers)

Abstract

:

Simple Summary

Biological and physicochemical soil factors involved in the incidence of the basal stem rot (BSR) disease in an oil palm (Elaeis guineensis) plantation in Malaysia were characterized. Blenheim soil with a low BSR disease incidence and Bernam soil with high BSR disease incidence were analyzed and observed to have differences in composition and diversity of soil prokaryotic and eukaryotic communities. Blenheim soil with a high pH and calcium was shown to have higher prokaryotic and eukaryotic diversity compared to Bernam soil. High abundances of rare metabolically diverse and versatile bacterial taxa, bacterial taxa that increased with the introduction of biocontrol agents, potential disease-suppressive bacteria, and bacterivorous flagellates were observed in Blenheim soil. In contrast, Bernam soil was predominantly characterized by potential disease-inducible bacterial taxa. A combination of both abiotic and biotic elements might be essential in driving disease-suppressive soil microbiome toward Ganoderma BSR in Blenheim soil.

Abstract

Basal stem rot (BSR), caused by Ganoderma boninense, is the most devastating oil palm disease in South East Asia, costing US$500 million annually. Various soil physicochemical parameters have been associated with an increase in BSR incidences. However, very little attention has been directed to understanding the relationship between soil microbiome and BSR incidence in oil palm fields. The prokaryotic and eukaryotic microbial diversities of two coastal soils, Blenheim soil (Typic Quartzipsamment—calcareous shell deposits, light texture) with low disease incidence (1.9%) and Bernam soil (Typic Endoaquept—non-acid sulfate) with high disease incidence (33.1%), were determined using the 16S (V3–V4 region) and 18S (V9 region) rRNA amplicon sequencing. Soil physicochemical properties (pH, electrical conductivity, soil organic matter, nitrogen, phosphorus, cation exchange capacity, exchangeable cations, micronutrients, and soil physical parameters) were also analyzed for the two coastal soils. Results revealed that Blenheim soil comprises higher prokaryotic and eukaryotic diversities, accompanied by higher pH and calcium content. Blenheim soil was observed to have a higher relative abundance of bacterial taxa associated with disease suppression such as Calditrichaeota, Zixibacteria, GAL15, Omnitrophicaeota, Rokubacteria, AKYG587 (Planctomycetes), JdFR-76 (Calditrichaeota), and Rubrobacter (Actinobacteria). In contrast, Bernam soil had a higher proportion of other bacterial taxa, Chloroflexi and Acidothermus (Actinobacteria). Cercomonas (Cercozoa) and Calcarisporiella (Ascomycota) were eukaryotes that are abundant in Blenheim soil, while Uronema (Ciliophora) and mammals were present in higher abundance in Bernam soil. Some of the bacterial taxa have been reported previously in disease-suppressive and -conducive soils as potential disease-suppressive or disease-inducible bacteria. Furthermore, Cercomonas was reported previously as potential bacterivorous flagellates involved in the selection of highly toxic biocontrol bacteria, which might contribute to disease suppression indirectly. The results from this study may provide valuable information related to soil microbial community structures and their association with soil characteristics and soil susceptibility to Ganoderma.

1. Introduction

Oil palm (Elaeis guineensis Jacq.) is a highly valuable commercial oil crop in South East Asia (SEA) [1,2]. Malaysia has the second largest acreage in the world dedicated to oil palm area (~5.8 million hectares), producing more than 19.5 million tons of palm oil [3] and contributing ~USD$16 billion to Malaysian export revenue [4]. This perennial crop is unfortunately susceptible to several pests and diseases. Basal stem rot (BSR) disease, caused by Ganoderma boninense Pat. (synonym: Ganoderma orbiforme (fr.) Ryvarden), is the most prevalent fungal disease of oil palm in SEA [5,6,7]. BSR disease causes rotting of the bole of the oil palm trunk, leading to the reduction of fruit production and incurring losses amounting to US$500 million annually in SEA [2,8,9]. There are several soil abiotic factors associated with high BSR disease incidences. For example, field observations revealed that low soil pH, high salinity, and high electrical conductivity, as well as heavy textured soils with poor drainage or with high water retention capacity, were associated with higher BSR incidence [5,10,11,12].
To date, there is no effective control measure known to prevent BSR disease [12]. Surgery, constructing isolation trenches, and soil mounding were studied and found to be tedious, expensive, and ineffective [8,13]. Sanitation approaches during existing plantings and at replanting have been practiced to minimize the size of diseased stumps, and have been known to reduce BSR disease incidences when done properly [13]. Fungicide drenching and trunk injection were generally not effective in controlling BSR disease [13]. These chemical approaches also cause environmental and safety issues. Furthermore, the development of effective and less laborious control of Ganoderma disease has been hindered by the lack of reliable early detection tools [8,12]. Therefore, this has encouraged the emphasis on environmental-friendly alternatives to manage BSR disease, which include biological control, development of BSR-tolerant or -resistant oil palm cultivars, and application or study of BSR-suppressive soil. Various potential fungal and bacterial biocontrol agents, namely Trichoderma harzianum, T. viride, Pseudomonas fluorescens, P. aeruginosa, Burkholderia cepacia, and Bacillus species, have been screened and studied for the control of Ganoderma disease in nursery, glasshouse, and field experiments [14,15,16]. In addition, biological control agents with plant growth promoting and other important antifungal traits, in particular T. asperellum and P. aeruginosa with chitinase, cellulase, glucanase, and indole acetic acid-producing capabilities, were studied for the control of BSR disease, improving the growth of the oil palm and facilitating better nutrient uptake by the plant [17]. Screening of various oil palm progenies and varieties from various origins, as well as development of disease-tolerant, or -resistant, cultivars were explored as well. For instance, Dura × Pisifera cross from Congo x Cameroon origin and Deli × Yangambi cultivars were reported with partial resistance to BSR disease [18,19,20].
Soil microbiota is critical in establishing healthy soil, improving soil fertility, and ensuring sustainable plant productivity. Microbial communities achieve these through mechanisms such as plant-growth promoting and stress-ameliorating capabilities, as well as suppressing soil-borne pathogens [21,22,23,24,25]. In a few instances, high microbial richness, diversity, and functional diversity of soil microbiota were reported to contribute to disease suppression and survival of the plants [24,26]. Soil suppressiveness, a plant defense mechanism established by native microorganisms in soil, provides the first defensive barrier against soil-borne phytopathogens [23,27]. Advancement in high-throughput second-generation sequencing has offered a new avenue in studying and characterizing soil microbiota that is related to disease-suppressive soils [25] and has since been applied to study soils suppressiveness towards Pythium irregulare [28], Fusarium wilt [29], and Rhizoctonia solani [27]. Ros et al. [28] reported that soil suppressiveness towards P. irregulare was mainly correlated to abiotic elements (pH, electrical conductivity, and total organic carbon), as well as biotic properties (bacterial and fungal taxa). Siegel–Hertz et al. [19] discovered that fungal and bacterial genera with known inhibitory activities toward phytopathogens were more abundant in suppressive soil. Mendes et al. [20] showed that γ- and β-Proteobacteria, Firmicutes, and Actinobacteria were more abundant in soils suppressive towards R. solani. Although the microbiomes of a wide range of disease-suppressive soils for crops has also been reported, the microbiome analysis of soils related to BSR disease of oil palm is not well characterized. Existing studies revealed that most of the 16S- and 18S-targeted amplicon sequencing studies related to Malaysian and Indonesian oil palm ecosystems compared soil microbiomes to understand the effects of land use. This included soils from rainforest, logged forest, rubber field, and oil palm cultivation [30,31,32,33]. None of the studies examined the microbiome of soils in relation to BSR incidence. Therefore, this study, embarking on the microbiome comparison between BSR-suppressive and -conducive soils, is expected to contribute immensely to the understanding of the microbial diversity and influence of microbiota on disease incidence of BSR.
Malaysian coastal soils have a long-established history of BSR [34]; unfortunately, information related to soil prokaryotic and eukaryotic microbial communities and diversity for oil palms planted on coastal soils is still limited. Blenheim and Bernam soils are coastal soils from an oil palm plantation in Perak, Malaysia. Blenheim soil (Typic Quartzipsamment—old beach ridge with shells) is characterized by coarse sand to loamy coarse sand texture and high pH, whereas Bernam soil (Typic Endoaquept—non-acid sulfate) is a silty clay to silty clay loam textured soil with low pH [35,36]. Both soils are planted with palms of similar planting material (Dura x Pisifera) and of the same age, and with similar management practices (i.e., inter-cropping, fertilizing routines) for the past two decades. Based on the initial census conducted in early 2018, BSR disease incidences in Blenheim soil were lower (less than 5%) compared to Bernam soil (more than 15%). In our study, we aimed to describe prokaryotic and eukaryotic communities of the two coastal soils from the oil palm plantation by using Illumina 16S rRNA and 18S rRNA amplicon sequencing, respectively. In addition, soil physicochemical parameters and the BSR incidence for palms planted on Blenheim and Bernam soils were recorded. To observe spatial variation between soil samples within close proximity, soil samples from four separate microsites, in particular top- and subsoils from palm circle and inter-palms regions were also included in the current study. Our findings provide new insights into the potential biotic and abiotic properties associated with soil suppressiveness of Ganoderma BSR disease in oil palm.

2. Materials and Methods

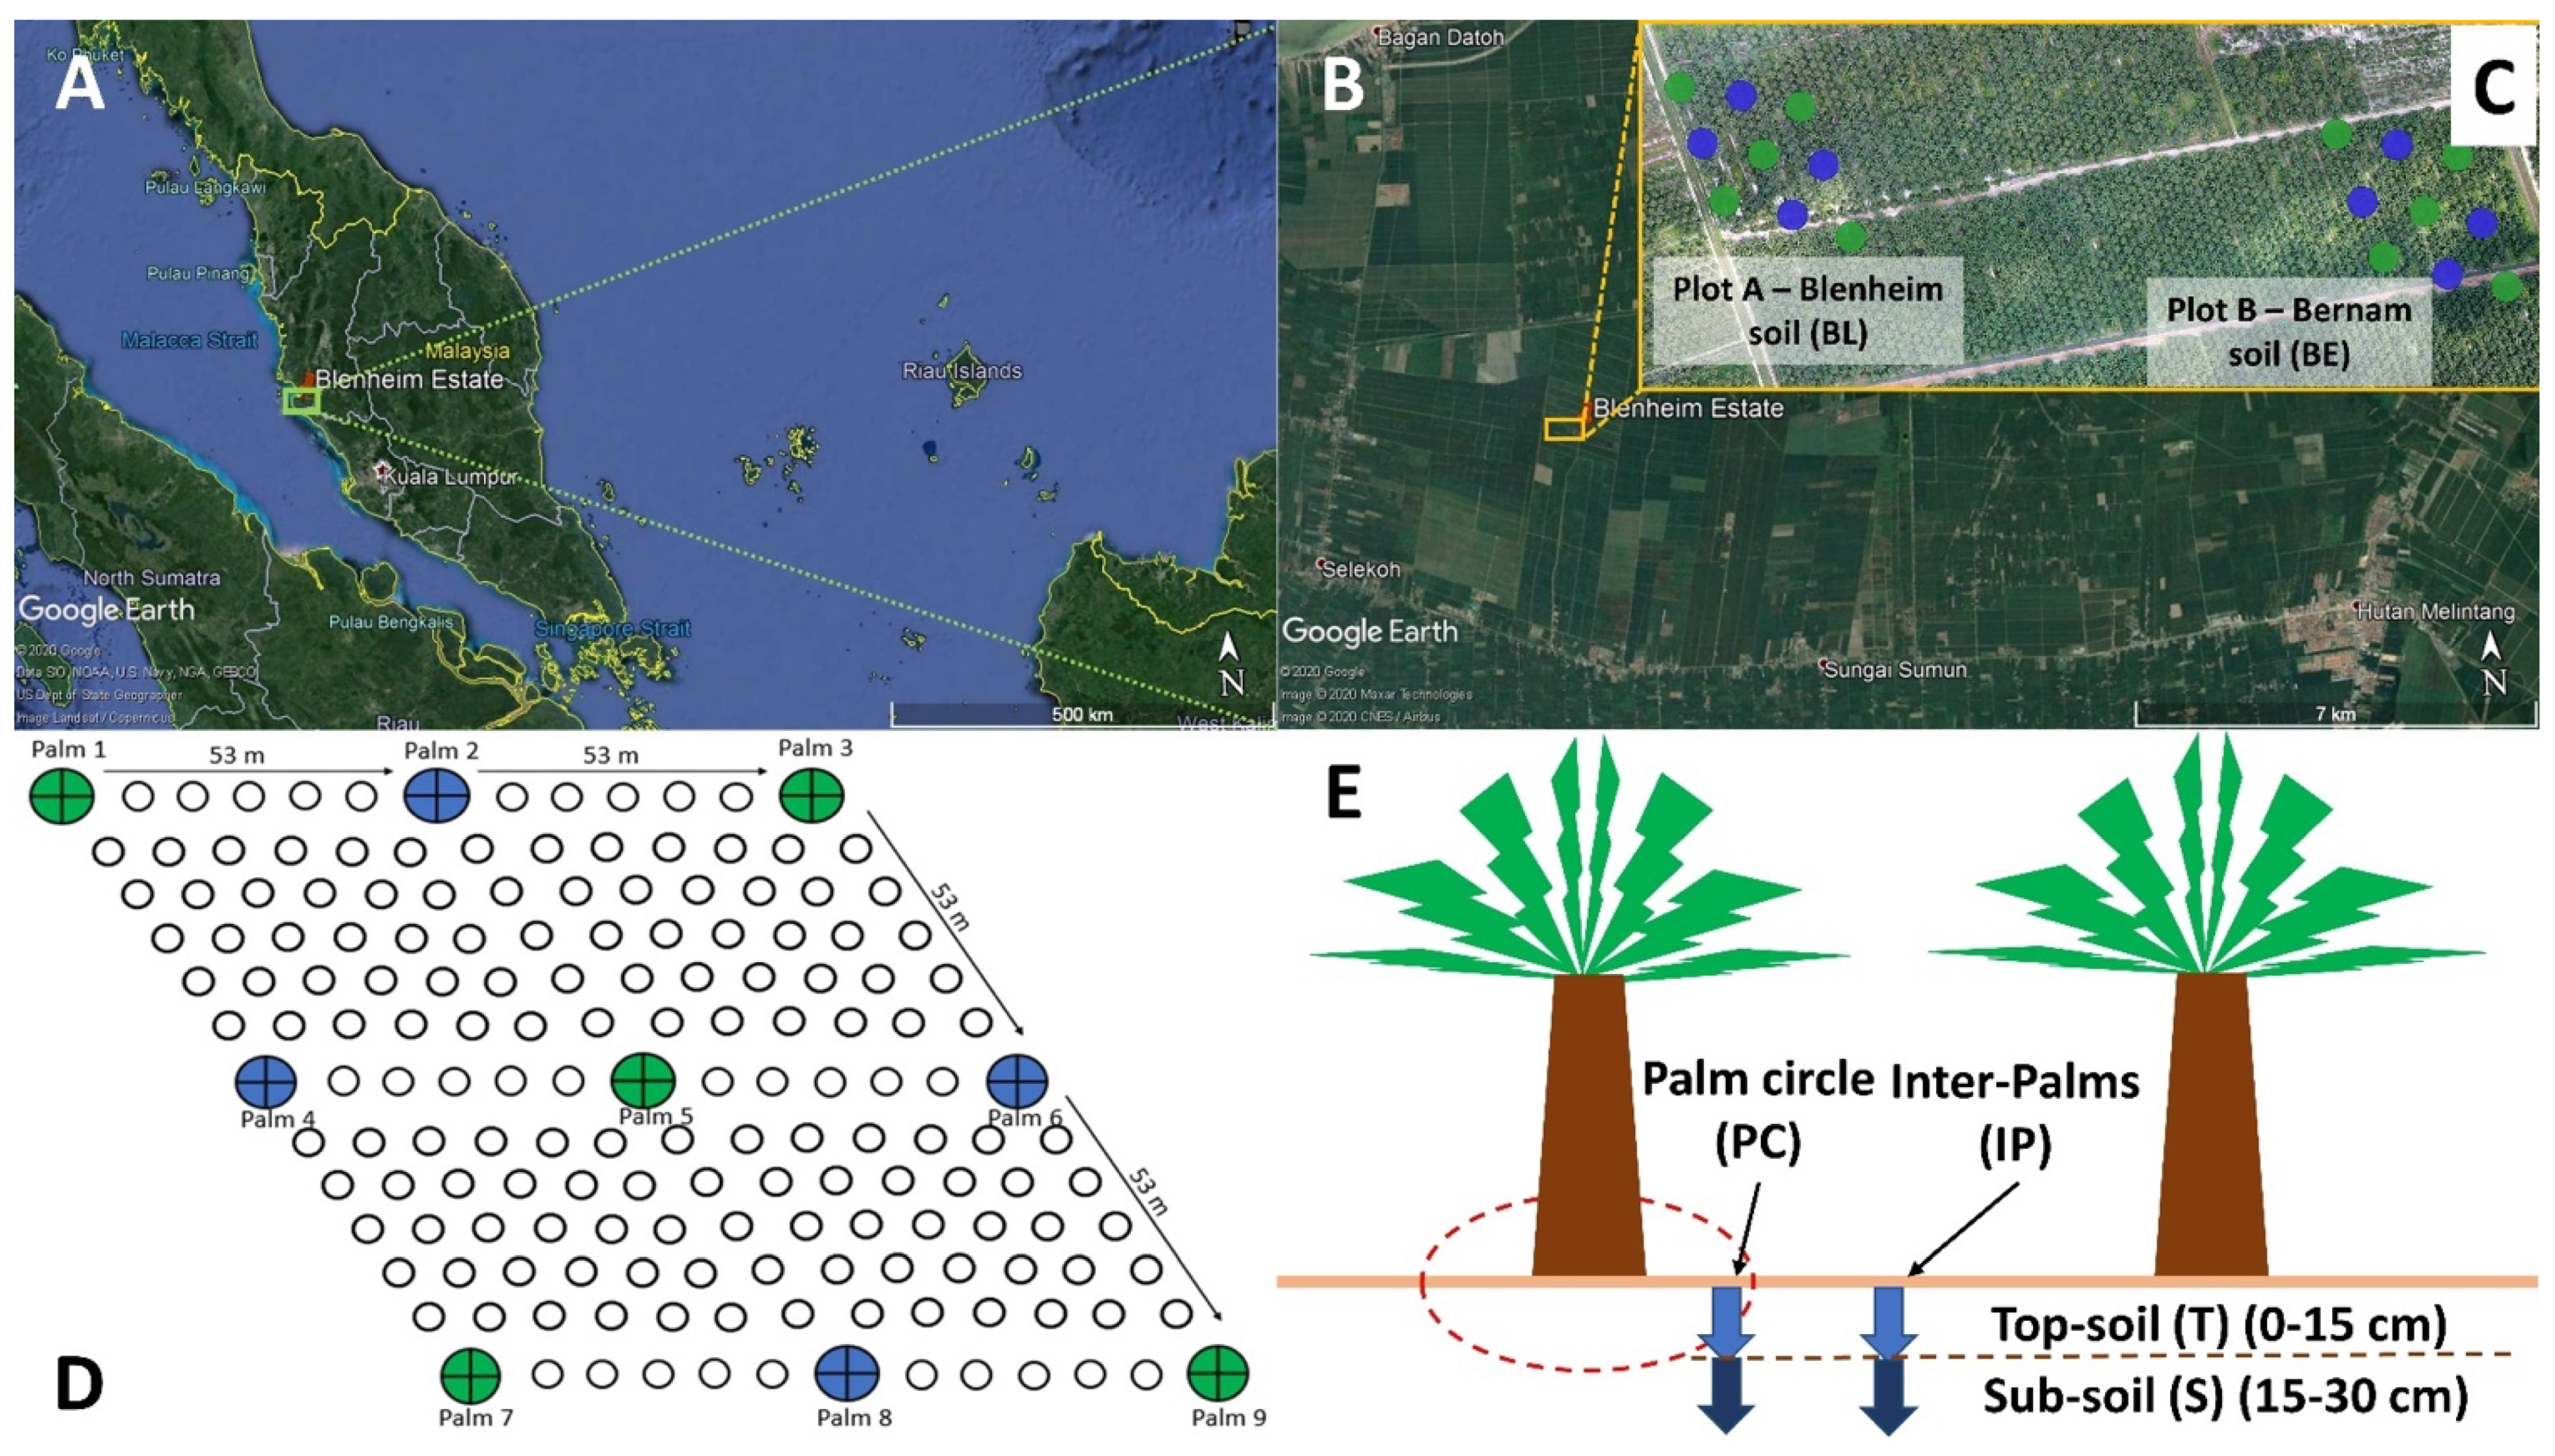
2.1. Site and Soil Collection

An oil palm estate in Perak, Malaysia (Figure 1A), which was planted in 1998 with Tenera (Dura × Pisifera) oil palms in an equilateral triangle planting system (planting distance of 8.80 × 8.80 × 8.80 m), was selected for this study. The estate experiences a tropical climate with annual precipitation ranging from 1700 to 2300 mm (Supplementary Materials Table S1). Two palm plots, approximately 1 km apart, were located on Blenheim (coordinates: 3°55′44.6″ N, 100°48′36.2″ E) (Plot A) and Bernam (coordinates: 3°55′33.4″ N, 100°48′51.7″ E) (Plot B) coastal soils, respectively (Figure 1B). These soils are classified as Typic Quartzipsamment and Typic Endoaquept, respectively, according to the classification systems by USDA [35,36]. These soil types were selected for the study due to their different susceptibility towards BSR disease despite their relatively close proximity, and were subjected to typical cultural management practices and fertilizer regimes (Supplementary Materials Table S2).
Soil sampling was conducted in May and December 2018 for soil physicochemical and microbiome analyses (Supplementary Materials Figure S1A,B). Sampling points were based on grid-line sections (intervals of 53 × 53 m), and a total of 9 sampling points of the respective soil types (within an area of 1.06 ha) were selected (Figure 1B,C). Soil samples from all the 9 palm points (9 replicates) (Figure 1B,C—green- and blue-colored solid circles) were collected from palm circle (PC) and inter-palm (IP) regions at depths of 0–15 (topsoil) and 15–30 (subsoil) cm (Figure 1D) using Dutch Auger, and sent to the Advanced Agriecological Research (AAR) Chemistry Laboratory for physicochemical analyses.
For soil microbiome analysis, only five out of nine palms were selected (Figure 1B,C—green-colored solid circles). At the respective sampling point, soil trenches were dug next to the auger point to collect soil samples from four separate microsites (Figure 1D). In May 2018, soil from ten selected palm points (five for Blenheim and five for Bernam) were analyzed. Four separate microsites were sampled across each of these palm points and pooled together for analysis (Figure S1A) (2 soil types × 1 composite of microsites × 5 sampling points = 10 soil samples). In December 2018, a modified sampling strategy was adopted in which forty soil samples (twenty from each soil type) were collected from four separate microsites (Supplementary Materials Figure S1B) of the respective sampling points (Figure 1B,C—green-colored solid circles) (2 soil types × 4 microsites × 5 sampling points = 40 soil samples). Microsites were sequenced separately only for December 2018 samples (Supplementary Materials Figure S1B) to determine whether there were any differences in the prokaryotic and eukaryotic communities between the different microsites for each soil type. Soils were transported back to the laboratory on ice. Soil samples were broken into small pieces and homogenized manually using a sterilized spatula [37]. Plant debris, intact shell debris, and roots were removed using sterilized forceps before sieving through a 2-mm sieve. The soils were then kept at −80 °C until DNA extraction.

2.2. Field BSR Disease Census

BSR disease incidence and severity were recorded every six months. Key indicators of BSR incidence were based on visual symptoms that were subsequently used to determine the disease index. Disease classes adopted for calculating disease severity index were described previously by Chen et al. [38], with slight modifications as follows: (a) Healthy (class 0); (b) Ganoderma fruiting body or basidiocarp (class 1); (c) rotten bole (class 2); (d) combination of Ganoderma fruiting body or basidiocarp and rotten bole (class 3); and (e) vacant point with sanitation (class 4). Disease incidence (DI) was determined using the formula outlined below [39], where n is the number of palms identified as diseased; and N is the total number of censused palms. DI refers to the percent of palms within the plots that demonstrated visual infection symptoms (disease classes 1 to 4).
DI = n N × 100 %
Disease severity index (DSI) was calculated based on the formula illustrated below [40], where N is the total number of censused palms, and ni refers to the number of palms categorized into category i (based on disease class 0 to 4). DSI indicates the level of disease severity for the infected palms within the plots.
DSI = ( i × n i ) ( 4 × N ) × 100

2.3. Soil Physicochemical Analyses

Soil pH was determined using 1 M potassium chloride (KCl) (2:5—soil to solution ratio) solution with IQ Scientific 150 pH meter (Spectrum Technologies, Plainfield, IL, USA) [41]. Electrical conductivity (EC) was assessed with an EC meter (S30, Mettler Toledo, Columbus, OH, USA) [42]. The percentage of soil organic matter was quantified using the loss-on-ignition method with muffle furnace (L9/11C6, Nabertherm, Lilienthal, Germany) [43]. Total nitrogen (N) (Gerhardt distiller, VAP45S, Cologne, Germany), available phosphorus (AP), and total P (TP) content of the soil were determined using micro-Kjeldahl, Bray-2, and 6 M HCl extraction methods, respectively [44,45,46]. AP and TP were quantified using a UV-Visible Spectrophotometer (Evolution 201, Thermo Scientific, Waltham, MA, USA). Cation exchange capacity (CEC) was quantified using 1 M ammonium acetate (pH 7.0), and the extracted soil leachates were quantified for exchangeable potassium (K) and sodium (Na) (with flame photometer) (M410, Sherwood Scientific, Cambridge, UK), and CEC and magnesium (Mg) (with atomic absorption spectrometer or AAS) (AA100, Pelkin Elmer, Shelton, CT, USA) [43,45,46,47]. Soil micronutrients, namely iron (Fe), manganese (Mn), zinc (Zn), copper (Cu), and calcium (Ca) were analyzed with AAS, and silica (Si) was determined with inductively coupled plasma-optical emission spectrometry (Optima 7300DV, Pelkin Elmer, Shelton, CT, USA) in accordance with the procedures outlined previously [43,48]. Soil physical properties were determined using hydrometer (Zeal, London, UK) [43].

2.4. Soil DNA Extraction, Library Preparation, Purification, and MiSeq Sequencing

A soil sample (0.3 g) was used for soil DNA extraction using the DNeasy PowerSoil Kit (Qiagen, Valencia, CA, USA) as per the manufacturer’s instruction. For each sample, three extractions were performed, and the extracted DNAs were pooled into one composite [49]. The hypervariable V3–V4 region of 16S rRNA gene was amplified using Bakt 341F (5′-CCT ACG GGN GGC WGC AG-3′) and Bakt 805R (5′-GAC TAC HVG GGT ATC TAA TCC-3′) primers comprising partial Illumina Nextera adapter at the 5′ end [50,51]. 1391F (5′-GTA CAC ACC GCC CGT C-3′) and EukBr (5′-TGA TCC TTC TGC AGG TTC ACC TAC-3′) primers [52,53] containing partial Illumina adapter at the 5′ end were used to target the hypervariable V9 region of the 18S rRNA gene [54]. Fragments of V3–V4 (16S rRNA) and V9 (18S rRNA) regions were amplified with the HotStar HiFidelity DNA Polymerase Kit (Qiagen, Valencia, CA, USA) [55] using Mastercycler® nexus GSX1 (Eppendorf, Hamburg, Germany), set to the PCR (polymerase chain reaction) conditions described previously [56]. Amplified amplicons were purified with the Agencourt AMPure XP bead (Beckman Coulter, Brea, CA, USA) before indexing with Illumina Nextera XT Index i5 and i7 using the KAPA HiFi HotStart ReadyMix Kit (KAPA BioSystems, Woburn, MA, USA). Indexed 16S and 18S amplicons were purified and quantified using the Qubit® dsDNA HS assay with Qubit® 2.0 Fluorometer (Invitrogen, Carlsbad, CA, USA). The 16S and 18S libraries were further quantified, quality checked, normalized, and processed [57] prior to sequencing with the Illumina MiSeq (Illumina, San Diego, CA, USA) at the Monash University Malaysia Genomics Facility with a 2 × 250 bp run configuration.

2.5. Sequence Processing and Analyses

Trimmomatic was used to trim poor quality bases within 20 base pairs from 3′ end [58]. Primers targeting V3–V4 and V9 regions of 16S and 18S rRNA, respectively, were excised from the trimmed pair-end sequences using Cutadapt [59]. Trimmed forward and reverse sequences of 16S and 18S rRNA were merged using Usearch10 [60]. Microbiome bioinformatics for the merged 16S and 18S rRNA sequences were then analyzed using QIIME 2 2019.4 [61]. Merged reads were denoised using DADA2 (with q2-dada2) [62]. All the observed features generated were aligned using mafft (with q2-alignment) [63], and fasttree2 (with q2-phylogeny) [64] was employed to construct a phylogenetic tree. Taxonomic assignment was performed with a q2-feature-classifier [65], which is a sklearn naïve Bayes taxonomy classifier trained [66] against the SILVA database (version 132—99% OTUs reference sequences). Observed features with no assignment were then re-classified against the SILVA SSU Ref database (version 132) using SINA 1.3.1 [67,68]. ASVs assigned to or identified as chloroplasts or mitochondria were removed from the representative sequences and feature table prior to subsequent analyses. Alpha-diversity (namely observed features and faith phylogenetic diversity (Faith PD) [69], as well as beta-diversity, in particular, weighted UniFrac [70,71]) metrics were determined using q2-diversity after normalization of all the samples to an equal sequencing depth (13,600 and 11,000 reads/sample for 16S and 18S rRNA, respectively). Observed features, Faith PD, and composition of the top 10 most abundant phyla and genera of the soil microbiomes were illustrated using the R ggplot2 package [72]. Raw sequences of 16S and 18S rRNA were submitted to the Sequence Read Archive (SRA) by the National Centre for Biotechnology Information (NCBI) with the BioProject accession number: PRJNA649668.

2.6. Statistical and Data Analyses

All soil physicochemical parameters of two coastal soils were analyzed with principal component analysis (PCA) in RStudio [73] to determine the variables that distinguished Blenheim from the Bernam soil types. A two-by-two chi-square test (at p-value ≤ 0.0025 after Bonferroni correction) was adopted to determine the differences in the number of infected and healthy palms planted on Blenheim and Bernam soil types.
Differences in alpha diversities (observed features and Faith PD) between soil types and across soil microsites for the respective soil types of 16S and 18S rRNA datasets were assessed using the Kruskal–Wallis test in QIIME 2 with a significance level at Benjamini–Hochberg q-value < 0.05 [74]. Principal coordinate analyses (PCoA) based on the weighted-UniFrac distance matrix were estimated with the ordination approach [70,75] and the PCoA plots were visualized in the R ggplot2 package. Non-parametric analysis of similarities (ANOSIM) incorporating the default number of permutations (999) (at Benjamini–Hochberg q-value of <0.05) was used to assess differences in soil microbial communities (beta diversity: weighted-UniFrac) between soil types and across soil microsites for the respective soil types of both 16S and 18S rRNA datasets in QIIME 2. Differential abundance of taxa between two soil types for 16S and 18S rRNA datasets was studied using analysis of composition of microbiomes (ANCOM) [76].

3. Results

3.1. Ganoderma Incidences in Blenheim and Bernam Soils

BSR disease incidence (DI) and disease severity index (DSI) in palms planted on Bernam soil was higher than Blenheim soil (Table 1). Both the DI and DSI recorded in the Bernam plot had increased significantly over the period of 18 months from May 2018 to December 2019. Palms assessed with the disease classes of 3 and 4 also increased in the Bernam plot. In addition, Bernam soil was also assessed with a significantly higher number of infected palms over healthy palms than Blenheim soil at all four census time points (two-by-two contingency table chi-square test p < 0.0001) (Table 2).

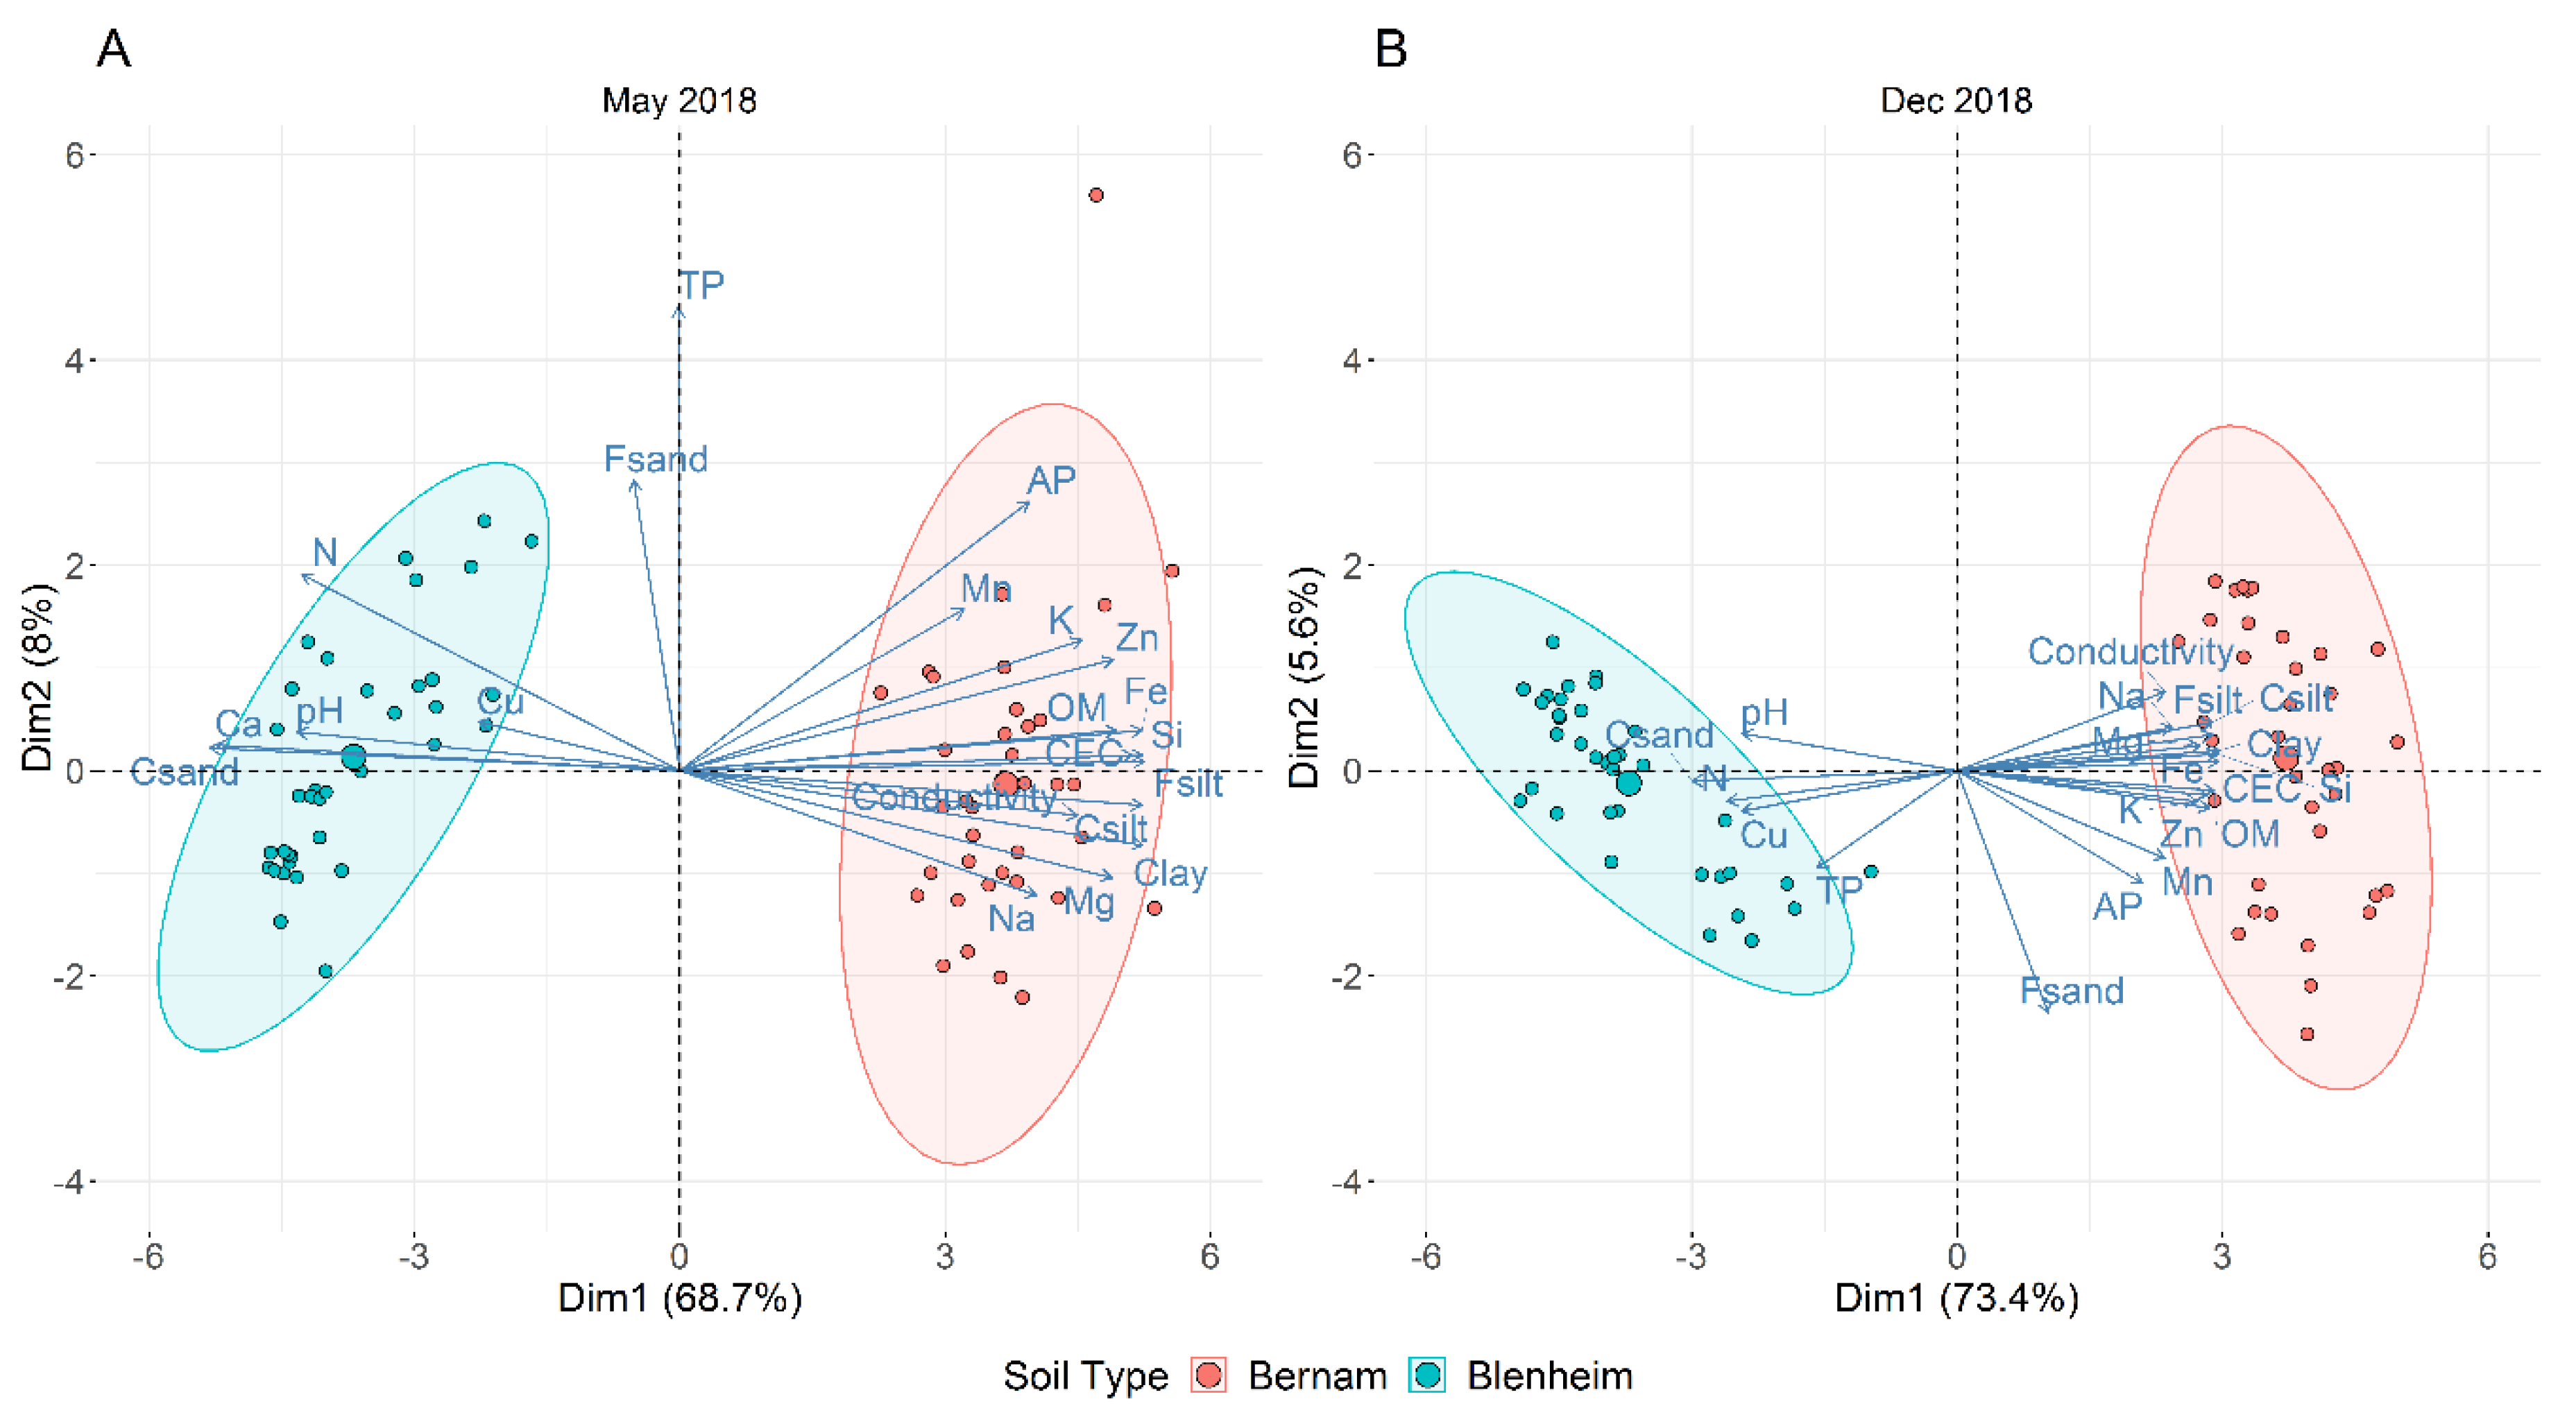
3.2. Physicochemical Analyses of Blenheim and Bernam Soils

Blenheim and Bernam soil samples of May and December 2018 have distinct physicochemical properties (Table 3 and Supplementary Materials Table S3). Principal component analysis (PCA) plots illustrated six soil physicochemical parameters, namely pH, N, Ca, Cu, TP, and coarse sand (CSand) (along the negative of x-axis), which distinguished Blenheim soil from Bernam soil, and the first component explained 67.4 to 74.5% of the variance, whereas component 2 explained 5.4 to 8.4% of the variance (Figure 2A,B).

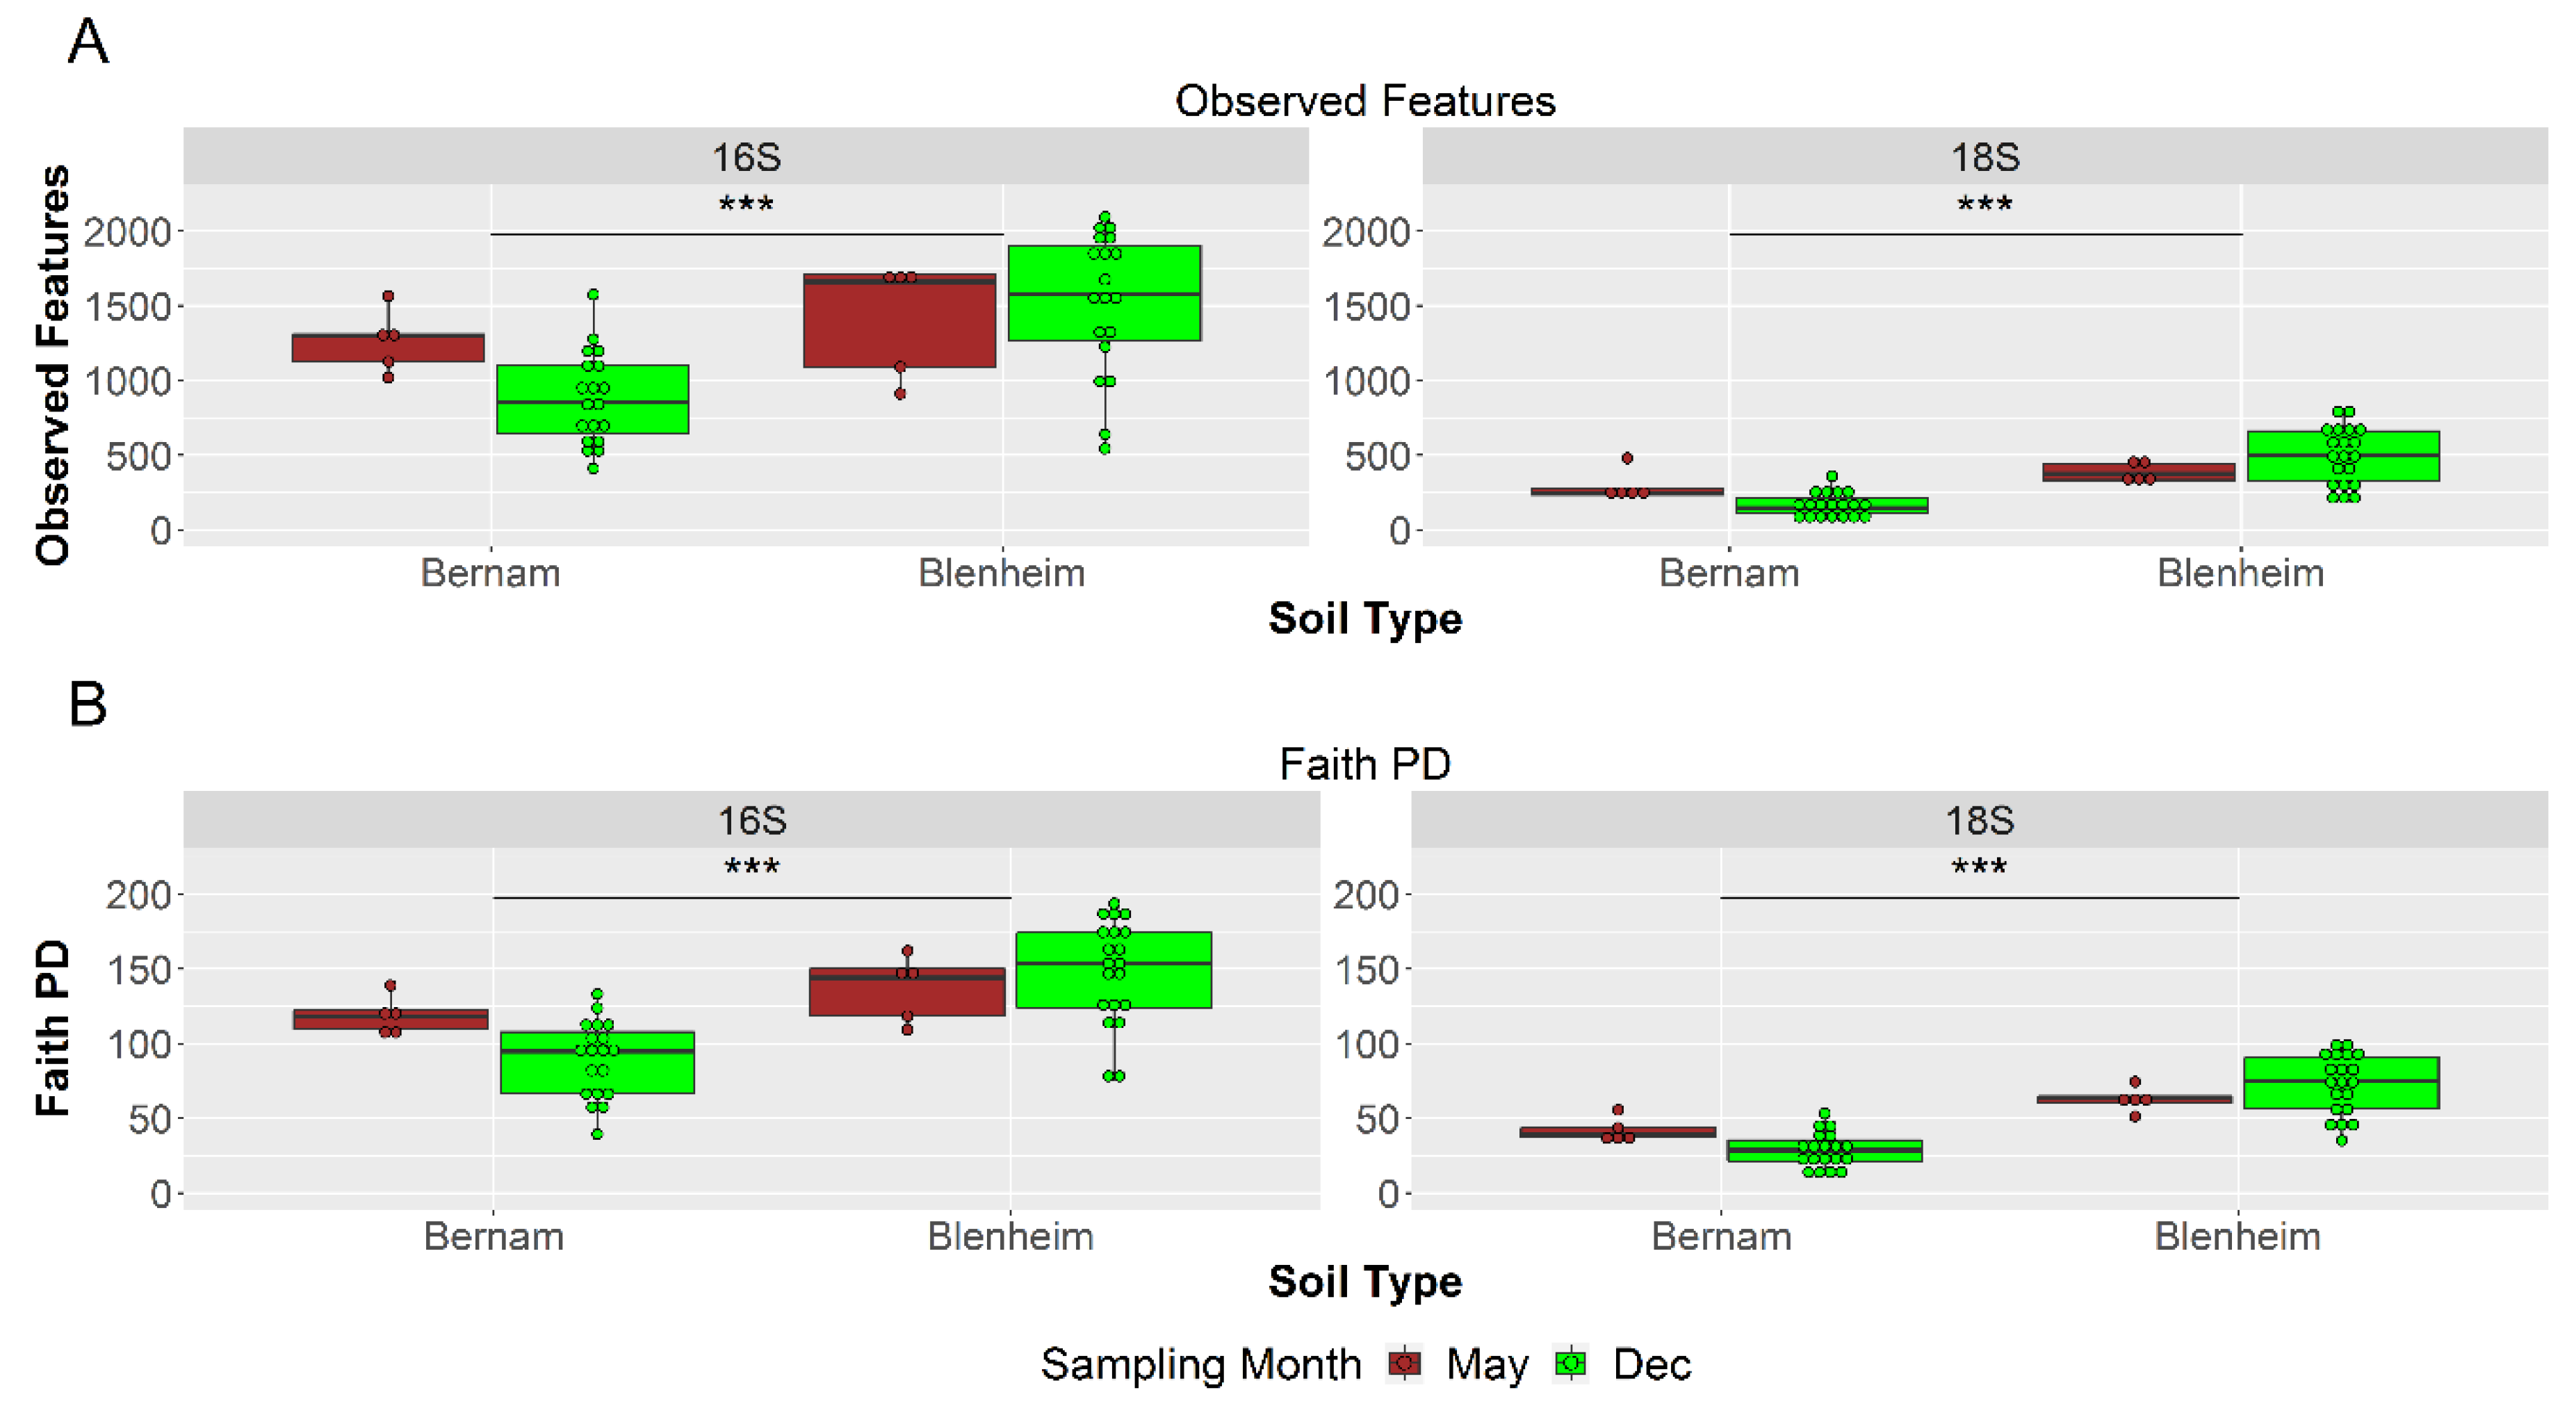
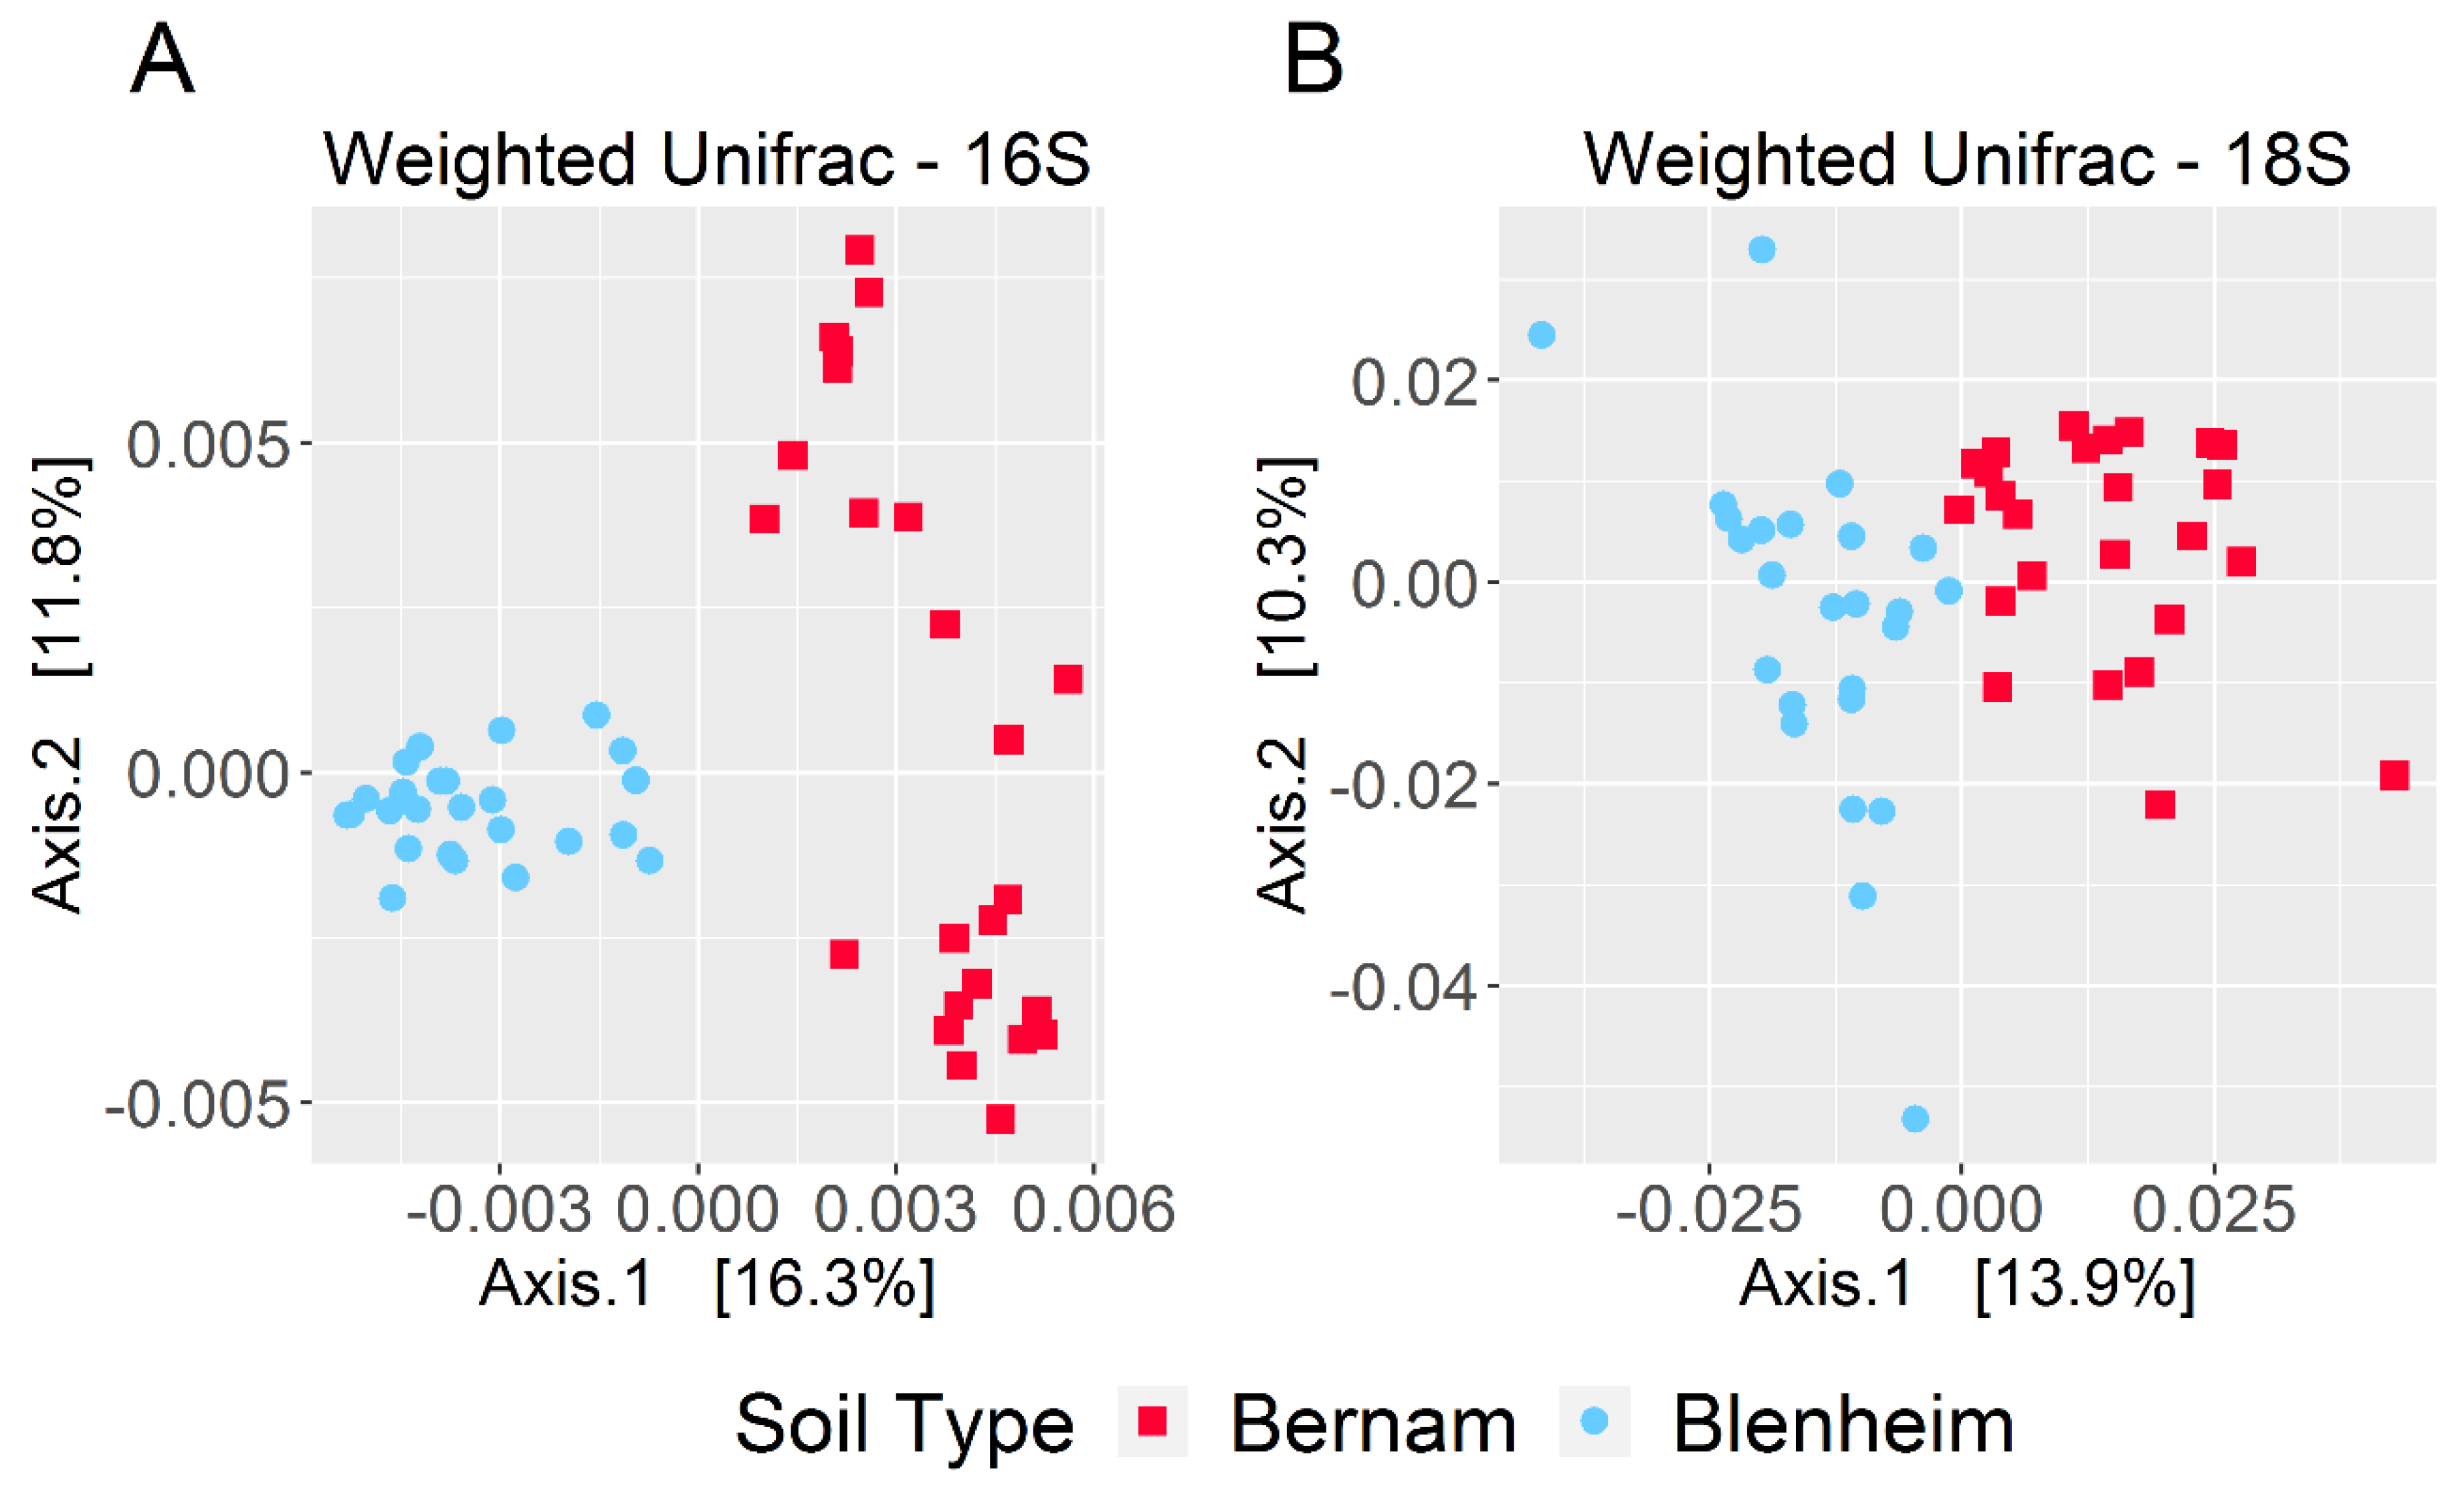
3.3. Prokaryotic and Eukaryotic Richness and Diversity in Blenheim and Bernam Soils

Bernam soil showed significantly lower richness and diversity (observed features and Faith PD) of prokaryotic and eukaryotic communities compared to Blenheim soil (p-value < 0.001; Kruskal–Wallis test) (Figure 3 and Supplementary Materials Figure S2). Comparison of richness and diversity between microsites of prokaryotic communities of Bernam soil or Blenheim soil (except for the Faith PD between top- and subsoils of inter-palms within Blenheim soil), as well as eukaryotic community of Bernam soil were not significantly different (q-value ≥ 0.05; Kruskal–Wallis test) (Supplementary Materials Figure S3A,B). However, richness and diversity of eukaryotic communities were significantly higher in the topsoil inter-palms (IPT) microsite of Blenheim soil compared to its subsoil inter-palms (IPS) (q-value = 0.02; Kruskal–Wallis test) (Supplementary Materials Figure S3A,B). In summary, Blenheim soil had a higher prokaryotic and eukaryotic richness and diversity compared to Bernam soil.

3.4. Prokaryotic Microbial Community at Phylum and Genus Levels

The majority of the reads from Blenheim and Bernam soils were taxonomically assigned to members from the top 10 dominant phyla, in particular Proteobacteria, Firmicutes, Acidobacteria, Chloroflexi, Bacteroidetes, Verrucomicrobia, Actinobacteria, Rokubacteria, Planctomycetes, and Nitrospirae (Supplementary Materials Figure S4A). Furthermore, the results also revealed that the ten most abundant genera from Blenheim and Bernam soils were MSBL7 (Proteobacteria, Desulfobulbaceae), Neisseria (Proteobacteria, Neisseriaceae), Paraliobacillus (Firmicutes, Bacillaceae), Acidovorax (Proteobacteria, Burkholderiaceae), Dysgonomonas (Bacteroidetes, Dysgonomonadaceae), Paenibacillus (Firmicutes, Paenibacillaceae), Mariprofundus (Proteobacteria, Mariprofundaceae), Nitrospira (Nitrospirae, Nitrospiraceae), Fulvivirga (Bacteroides, Flammeovirgaceae), and Candidatus Udaeobacter (Verrucomicrobia, Chthoniobacteraceae) (Supplementary Materials Figure S4B).
Based on weighted-UniFrac diversity, prokaryotic communities between Bernam and Blenheim soils were significantly different (ANOSIM test, 999 permutations, p-value = 0.001) (Figure 4A). At the phylum level, Calditrichaeota, Zixibacteria, GAL15, Omnitrophicaeota, and Rokubacteria were significantly more abundant in Blenheim soil compared to Bernam soil (with W stat = 37, 32, 30, 27, and 27, respectively) (Figure 5A). On the contrary, Chloroflexi phylum was significantly higher in Bernam soil compared to Blenheim soil (W stat = 29) (Figure 5A). At the genus level, relative abundances of AKYG587 (Planctomycetes), JdFR-76 (Deferribacteres), and Rubrobacter (Actinobacteria) genera were significantly higher in Blenheim soil compared to Bernam soil (with W-stat = 437, 434, and 401, respectively), whereas Acidothermus genus was significantly higher in Bernam soil (W-state = 441) (Figure 5B). The results showed that the abundance of a few unique phyla and genera were significantly higher in Blenheim soil compared to Bernam soil.

3.5. Eukaryotic Microbial Community Structure at Supergroup and Genus or Class Levels

The majority of the reads from Blenheim and Bernam soils were taxonomically assigned to members from the top nine supergroups of Eukaryota, in particularly Opisthokonta, SAR, Archaeplastida, Amoebozoa, Excavata, Cryptophyceae, Centrohelida, Incertae sedis Eukaryota, and Haptophyta (Supplementary Materials Figure S4C). In addition, the 10 most abundant eukaryotic genera, classes, or orders (Phylum) detected in Blenheim and Bernam soils were Cercomonas (Cercozoa), Acanthamoeba (Amoebozoa), Silicofilosea (Cercozoa), Conthreep (SAR), Platyamoeba (Amoebozoa), Sphaeropleales (Chlorophyta), Coccidia (Apicomplexa), Vannella (Amoebozoa), Gregarinasina (Apicomplexa), and Euglenida (Euglenozoa) (Supplementary Materials Figure S4D).
Eukaryotic communities of Blenheim and Bernam soils were significantly different (ANOSIM test, 999 permutations, p-value = 0.001) (Figure 4B). At the supergroup level, Archaeplastida and Opisthokonta were significantly higher in Bernam soil compared to Blenheim soil (with W-stat = 9) (Figure 5C). At the genus level, Cercomonas (Phylum: Cercozoa; order: Cercomonadida) was more dominant in Blenheim and Uronema (Phylum: Ciliophora; order: Conthreep) was more abundant in Bernam soil (W-stat = 628 and 683, respectively) (Figure 5D). The Calcarisporiella (Phylum: Zygomycota; order: Calcarisporiellales) genus was more prevalent in Blenheim soil. Mammal communities were more abundant in Bernam soil (W-state = 507) (Figure 5D).
Interestingly, there were no observed features assigned to the genus Ganoderma, with low observed features of the order Polyporales (Phylum: Basidiomycota) detected in the rarefied datasets. In the non-rarefied raw sequences, there were also low observed features of Ganoderma.

4. Discussion

Blenheim soil was identified with higher prokaryotic and eukaryotic richness and diversity, and both the prokaryotic and eukaryotic communities were different between two soils. It is postulated that the higher microbial diversity in Blenheim soil may have been attributed to their high soil pH (around 7 to 8), high calcium content (calcareous nature), and light textural class. These abiotic factors typically indicate microbial preference for near-neutral conditions, illustrating an increase of bacterial and eukaryotic diversity and richness, as well as microbial biomass [77,78,79]. Soil pH has always been implicated as one of the important soil abiotic elements influencing soil microbiota diversity and richness [80]. Bacterial diversity and relative abundance were greater in alkaline soil (pH 8) compared to acidic soil (pH 4) [81]. In addition, diversity of bacterial communities was also higher in the soil derived from calcareous parent material compared to soil originated from siliceous parent material, and bacterial compositions of the soils from two distinct parent materials were also significantly different [63]. Increasing evidence has elucidated the importance of high microbial diversity in reducing soil-borne diseases or contributing to soil suppressiveness [65,66,67,68] and high microbial diversity has been hypothesized to augment the functional diversity in the soil [69]. In addition, soil microbial diversity was proposed to correlate positively with pathogen resistance in plants [79]. A recent study in Sabah, Malaysia, showed that higher bacterial diversity was observed in disease-free soils compared to soils with high BSR incidence [13]. While this suggested that higher bacterial diversity may be associated with BSR disease suppression, more studies are required to ascertain their role and impact on disease suppression. Acidic or low soil pH with high concentration of aluminum ions are the major inherent characteristics of the marine alluvial Bernam soil type [82]. Low soil pH or acidic soil was observed to reduce rhizobia’s activity due to aluminum toxicity, affect the efficacy of siderophore-producing biocontrol bacteria, and decrease the growth, activity, and disease suppression by P. fluorescens and Bacillus cereus [83,84,85]. Low soil pH has also been reported to favor the growth and antagonistic activity of Trichoderma species compared to alkaline pH [86,87]. Unfortunately, acidic soil and low pH conditions also allow G. boninense to thrive and contribute to higher Ganoderma disease severity and incidences as compared to a more neutral pH 6 to 7 [88,89].
A few rare and unique phyla, such as Calditrichaeota, Zixibacteria, GAL15, Omnitrophicaeota, and Rokubacteria, distinguished Blenheim soil from Bernam soil. Rare Calditrichaeota, Zixibacteria, GAL15, Omnitrophicaeota, and Rokubacteria phyla were described as candidate phyla radiation (CPR) through culture-independent approaches, and are relatively less explored candidate divisions [90,91,92,93,94]. This study also presents the first observation of rare Calditrichaeota, Zixibacteria, Omnitrophicaeota, and Rokubacteria in shell deposit calcareous soil (Blenheim soil). Among five of the CPR observed in Blenheim soil, Zixibacteria and Rokubacteria phyla, the most explored CPR genomically were shown to be highly versatile in metabolism (e.g., iron reducing-oxidation and other metabolic pathways) and equipped with genes that encode for antimicrobial secondary metabolites or peptides (e.g., polyketide and non-ribosomal peptide synthetases), respectively [91,95]. Microbiomes with a high abundance of functional genes encoding for antimicrobial and antibiotic compound production are known to confer protection to plants, as observed in disease suppression towards Ralstonia solanacearum by Alphaproteobacteria, Firmicutes, and Cyanobacteria phyla, as well as Pseudomonas and Bacillus genera [24]. Furthermore, Calditrichaeota phylum was studied through a culture-independent and genomic approach and described to be a potential detrital protein degrader with exogenous peptidases [90]. Detection of significantly higher abundance of GAL15 and Omnitrophicaeota phyla, and JdFR-76 genus (Phylum: Calditrichaeota) in Blenheim soil, could be due to various environmental factors reported previously, namely poorer soil nutrient status or less fertile soil, soil originated from calcareous parent material, and high soil pH (around pH 7) [96,97,98,99,100].
Rubrobacter (Phylum: Actinobacteria), AKYG587 (Phylum: Planctomycetes), and JdFR-76 (Phylum: Calditrichaeota) genera were more abundant in Blenheim soil. Rubrobacter was reported as one of the more prevalent genera in both Fusarium wilt suppressive soil and strong Fusarium graminearum fungistatic natural soil [29,101,102,103]. AKYG587 was observed with higher relative abundance when either Pseudomonas or Bacillus biocontrol agents (BCA) were being inoculated [104,105]. AKYG587 could be a potential helper, symbiont, or mutualist for improving the efficacy of BCA in the soil. Further research is required to verify these associations. The existence of significantly higher relative abundances of rare and highly metabolic versatile bacterial CPR in Blenheim soil might improve Ganoderma disease suppressiveness. On the contrary, Chloroflexi dominated Bernam soil. Chloroflexi was illustrated as a tobacco disease-promoting bacterial phylum [106] and was more prevalent in disease-conducive soils [107,108]. Furthermore, the relative abundance of Chloroflexi was reduced with the introduction of BCA [104,105]. In addition, Bernam soil is also dominated with Acidothermus (Phylum: Actinobacteria) too. Acidothermus was found to be more dominant in disease-conducive soil [107] and also significantly higher in arbuscular mycorrhizal fungi suppressive soil [109]. The existence of significantly higher relative abundances of Chloroflexi phylum and Acidothermus genus in Bernam soil might lead to Ganoderma disease conduciveness and also affect the proliferation of beneficial microbes.
Cercomonas (Phylum: Cercozoa; order: Cercomonadida) and Calcarisporiella (Phylum: Zygomycota; order: Calcarisporiellales) were more abundant in Blenheim soil, whereas Uronema (Phylum: Ciliophora; order: Conthreep) was more prevalent in Bernam soil. Members from Cercomonas genus were found to feed selectively on non-toxic or less toxic bacteria and allowed the proliferation of highly toxic bacterial BCAs [110,111]. Cercomonas longicauda and Hartmannella vermiformis were the only two tested protozoa not inhibited by Pseudomonas fluorescens CHA0 strain [112,113]. This allowed both C. longicauda and H. vermiformis to grow among the highly potent BCAs and selectively consume the less toxic bacteria. The selection of highly toxic bacterial BCA through selective feeding behavior of Cercomonas can be useful in shaping soil to be suppressive toward plant pathogens. In the current study, the relative abundance of Acanthamoeba genus was slightly higher in Blenheim soil compared to Bernam soil; however, it was not significant (W-stat = 324, null hypothesis was not rejected). In a previous study by Müller et al. [114], the abundancy of the bacterial isolates with biocontrol genes encoded for the production of antifungal 2,4-diacetylphloroglucinol and hydrogen cyanide metabolites was augmented upon introduction of Acanthamoeba protozoan into the soil. This phenomenon has been proposed to enhance the biocontrol ability and antagonism activity of these bacterial isolates through production of antimicrobial secondary metabolites. Environmental factors, namely soil pH, were found to affect the relative abundance of protozoa. Buyer et al. [115], through fatty acid markers, showed that Galestown soil (pH 5.8 and 0.6% humic material) had higher protozoa and bacteria compared to Hatborough (pH 4.5 and 3.2% humic material) soil. On the contrary, Hatborough soil had higher fungi and eukaryotes. In addition, high pH conditions were reported previously to increase the relative abundance of Cercozoa and Ciliophora protists as well [77]. The relative abundance of Cercomonas in Blenheim soil was higher compared to Bernam soil and this could be due to high soil pH in the former soil.
Members of Calcarisporiella were more abundant in Blenheim soil. Calcarisporiella thermophila and Calcarisporiella-related species were isolated and described from coal spoil tip soil, pineapple field soil, and subsoil with warm and hot climates [116]. The tropical climate in Malaysia might have contributed to the growth of Calcarisporiella. Unfortunately, very limited information related to Calcarisporiella species in high pH and Ca soil, isolated from the shell deposit environment, as well as disease-suppressive soil, is available. On the other hand, members of Uronema, more prevalent in Bernam soil, have been reported as common opportunistic pathogens for fishes [117] and also bacterial feeders [118]. However, there is limited information on members of the Uronema genus in relation to the selection of bacterial BCAs with high biocontrol ability or genes, and agricultural aspects. Furthermore, salinity and sodium chloride concentration have been implicated to affect the growth of flagellate Cercomonas and ciliate Uronema species. Growth of Cercomonas species was suppressed at the salinity of 5 to 10 parts per thousands (ppt) [119]. Optimum growth for marine Uronema ciliates was in the range of 17–43 ppt salinity [120]. Mammalian communities were more prevalent in Bernam soil and this could be due to higher density and coverage of understory vegetation (namely various ferns), more complex habitat, and the presence of natural shelters [121,122]. Proliferation of understory vegetations, especially ferns, were observed to be better in Bernam soil (low pH), and this could be due to clayey soil with better water-holding capacity and also higher water table. Furthermore, invertebrates in tropical soils were reported as highly abundant and generally more tolerant towards lower pH (between 3.8 to 4.0) [123], and could be a promising food source for mammals too. Maintenance of understory vegetation increases the abundance of aboveground invertebrate and other macrofauna communities, and also establishes a more complex food web within the oil palm ecosystem [124]. A more detailed study across multiple soil types with a wide range of Ganoderma BSR incidences and a more diverse soil physicochemical parameters will improve our understanding on the effects of specific biotic and abiotic factors on Ganoderma BSR disease in oil palm.
Observation of extremely low observed features matching to the genus Ganoderma might also be due to low inoculum level in the sampled sites. Growth of Ganoderma may be influenced by the low organic matter present, namely the palm circle (1 m from the palm base) and inter-palms (approximately 30 to 50 cm from the frond heap). Furthermore, Ganoderma boninense was shown to be a weak competitor and unable to grow well in soils with low or no organic matter [6]. Basidiomycetous G. boninense was also proposed to survive better only on wood debris/substrates and other organic matters compared to soil medium [6]. In a most recent study, G. boninense was found to be incapable of thriving and spreading out from the inoculation site into the soil medium [125]. We hypothesized that the absence of the features assigned to the Ganoderma genus could also be due to a low number of basidiospores present at the sampling points (approximately 1 m from the palm base).

5. Conclusions

The composition and diversity of soil prokaryotic and eukaryotic communities were distinctly different between Blenheim soil and Bernam soil. Blenheim soil was observed to comprise higher prokaryotic and eukaryotic diversities compared to Bernam soil. Blenheim soil, with high soil pH and Ca, was also found to have higher abundance of rare metabolically diverse and versatile Candidate phyla radiation (CPR) bacteria (e.g., Rokubacteria and Zixibacteria), potential disease-suppressive bacterial taxa (e.g., Rubrobacter), bacterial taxa that increased with the introduction of biocontrol agents (e.g., AKYG587), and bacterivorous flagellates for the selection of highly toxic biocontrol bacteria (e.g., Cercomonas). On the contrary, Bernam soil harbored potential disease-inducible bacteria, particularly Chloroflexi and Acidothermus (Actinobacteria), which are associated with disease-conducive soil. The existence of Calditrichaeota, GAL15, Omnitrophicaeota, JdFR-76 (Calditrichaeota), and Calcarisporiella (Ascomycota) could potentially be due to the nature and properties of Blenheim soil. Detection of high-relative abundance of less explored and uncultured CPR in Blenheim soil warrants further research into their relationships with the soil physicochemical properties and low Ganoderma incidence. Soil pH, Ca, and other soil physicochemical parameters could shape or drive the differences in both prokaryotic and eukaryotic communities between two soils. High abundance of mammalian communities could be due to high density and coverage of understory vegetation (e.g., ferns), and presence of natural shelters in Bernam soil. In addition, low soil pH could potentially be promoting growth and activity of pathogenic G. boninense in the Bernam soil type. A combination of abiotic and biotic elements might be pivotal in driving disease-suppressive soil microbiome toward Ganoderma BSR in Blenheim soil.

Supplementary Materials

The following are available online at https://www.mdpi.com/2079-7737/9/12/424/s1, Figure S1: Soil sampling time points: (A) Samples collected on May 2018 from four separate microsites of Blenheim and Bernam plots; (B) samples collected on December 2018 from a composite of 4 microsites for Blenheim and Bernam plots. Abbreviations for the four microsites: PCT—Palm circle topsoil; PCS—Palm circle subsoil; IPT—Inter-palm topsoil; and IPS—Inter-palm subsoil, Figure S2: Rarefaction curves of the samples for 16S- (rarefied to sequences) and 18S- (rarefied to sequences) targeted amplicon sequencing: (A) Rarefaction curves constructed with observed features and (C) rarefaction curves constructed with phylogenetic distance (Faith’s PD tree) for prokaryotic dataset; (B) rarefaction curves constructed with observed features and (D) rarefaction curves constructed with Faith’s PD tree for the eukaryotic dataset. Error bars indicate the standard error, Figure S3: Alpha-diversities of prokaryotic and eukaryotic communities for soil samples collected from four different microsites for Bernam and Blenheim soil types: (A) Observed features; and (B) Faith PD, Figure S4: Taxaplots of the top 10 most abundant prokaryotic (A,B) and eukaryotic (C,D) taxa for all the sequenced samples from Blenheim (BL) and Bernam (BE) soils at phylum- (A,C) and genus- (B,D) levels. Samples labeled with BL or BE abbreviations only refer to the pooled samples from the four microsites: These samples were collected in May 2018. The remaining samples were collected in December 2018. Abbreviations for the four microsites: PCT—Palm circle topsoil; PCS—Palm circle subsoil; IPT—Inter-palm topsoil; and IPS—Inter-palm subsoil, Table S1: Rainfall records for the year 2017, 2018, and 2019 (monthly and total annual rainfalls) for Blenheim Estate, Table S2: Fertilizers input and information for the years 2018 and 2019, Table S3: Soil physical properties and texture of Blenheim and Bernam soil types collected from four different microsites in May and December 2018.

Author Contributions

Conceptualization, Y.K.G. (Yit Kheng Goh), Q.A., and A.S.Y.T.; methodology, Y.K.G. (Yit Kheng Goh), Q.A., and A.S.Y.T.; validation, Y.K.G. (Yit Kheng Goh), M.Z.H.M.Z., Q.A., and A.S.Y.T.; formal analysis and data curation, Y.K.G. (Yit Kheng Goh); bioinformatics investigation and visualization, M.Z.M.Z.H. and Y.K.G. (Yit Kheng Goh); writing—original draft preparation, Y.K.G. (Yit Kheng Goh); writing—review and editing, Y.K.G. (Yit Kheng Goh); M.Z.M.Z.H., Q.A., Y.K.G. (You Keng Goh), and A.S.Y.T.; funding acquisition, Y.K.G. (You Keng Goh) and A.S.Y.T.; supervision Q.A. and A.S.Y.T. All authors have read and agreed to the published version of the manuscript.

Funding

This research received funding from the Advanced Agriecological Research Sdn. Bhd.

Acknowledgments

The authors would like to thank AAR and AAR Principals, Boustead Plantations Berhad and Kuala Lumpur Kepong Berhad for funding this research, and their permission to publish the data in this paper. The funders played no role in the conceptualization, design, decision to publish, or preparation of the manuscript. M.Z.H.M.Z. was supported by Monash Malaysia R&D Sdn Bhd. Y.K.G. (Yit Kheng Goh) would like to thank Monash University Malaysia for the scholarship provided to support this study. Y.K.G. (Yit Kheng Goh) is in debt to Goh Kah Joo (ex-AAR Director of Research) and Tey Seng Heng (current AAR Director of Research) for the opportunity given to pursue his study and support of the project. We are grateful to the Monash University Malaysia Genomics Facility and the team for the provision of analytical and computational support. Y.K.G. (Yit Kheng Goh) would like to thank Lim Shu Yong for molecular and library preparation guidance. We are also indebted to the estate management team, Poh Syee Wha, for granting access to the selected oil palm plots for this research and information sharing throughout the project. The authors would like to thank AAR Chemistry Laboratory for the provision of soil physicochemical analytical services. Last but not least, we would also like to thank the staff from AAR Crop Protection Laboratory for their valuable assistance during the experiment.

Conflicts of Interest

The authors declare that there are no competing interests.

References

  1. Murphy, D.J. The future of oil palm as a major global crop: Opportunities and challenges. J. Oil Palm Res. 2014, 26, 1–24. [Google Scholar]
  2. Woittiez, L.S.; van Wijk, M.T.; Slingerland, M.; van Noordwijk, M.; Giller, K.E. Yield gaps in oil palm: A quantitative review of contributing factors. Eur. J. Agron. 2017, 83, 57–77. [Google Scholar] [CrossRef]
  3. MPOB. Malaysian Oil Palm Statistics 2018, 38th ed.; Malaysian Palm Oil Board: Bangi, Malaysia, 2019.
  4. Kushairi, A.; Ong-Abdullah, M.; Nambiappan, B.; Hishamuddin, E.; Bidin, M.N.I.Z.; Ghazalia, R.; Subramaniam, V.; Sundram, S.; Parveez, G.K.A. Oil palm economic performance in Malaysia and R&D progress in 2018. J. Oil Palm Res. 2019, 31, 165–194. [Google Scholar] [CrossRef] [Green Version]
  5. Corley, R.H.V.; Tinker, P.B. The Oil Palm, 5th ed.; Blackwell Publishing: Oxford, UK, 2016. [Google Scholar]
  6. Rees, R.W.; Flood, J.; Hasan, Y.; Wills, M.A.; Cooper, R.M. Ganoderma boninense basidiospores in oil palm plantations: Evaluation of their possible role in stem rots of Elaeis guineensis. Plant Pathol. 2012, 61, 567–578. [Google Scholar] [CrossRef] [Green Version]
  7. Turner, P.D. Oil Palm Diseases and Disorders; Oxford University Press: Oxford, UK, 1981. [Google Scholar]
  8. Hushiarian, R.; Yusof, N.A.; Dutse, S.W. Detection and control of Ganoderma boninense: Strategies and perspectives. Springerplus 2013, 2, 555. [Google Scholar] [CrossRef] [Green Version]
  9. Cooper, R.M.; Flood, J.; Rees, R.W. Ganoderma boninense in oil palm plantations: Current thinking on epidemiology, resistance and pathology. Planter 2011, 87, 515–526. [Google Scholar]
  10. Ariffin, D.; Idris, A.S.; Singh, G. Status of Ganoderma in oil palm. In Ganoderma Diseases of Perennial Crops; Flood, J., Bridge, P.D., Holderness, M., Eds.; CABI Publishing: Wallingford, UK, 2000. [Google Scholar]
  11. Singh, G. Ganoderma-the scourge of oil palms in the coastal areas. Planter 1991, 67, 421–444. [Google Scholar]
  12. Naher, L.; Yusuf, U.K.; Ismail, A.; Tan, S.G.; Mondal, M.M.A. Ecological status of Ganoderma and basal stem rot disease of oil palms (Elaeis guineensis Jacq.). Aust. J. Crop Sci. 2013, 7, 1723–1727. [Google Scholar] [CrossRef]
  13. Chung, G.F. Management of Ganoderma diseases in oil palm plantations. Planter 2011, 87, 325–339. [Google Scholar]
  14. Norman, K.; Idris, A.S.; Mohd Mazmira, M.M. Prospects in sustainable control of oil palm pests and diseases through the enhancement of ecosystem services—The way forward. J. Oil Palm Res. 2019, 31, 381–393. [Google Scholar] [CrossRef]
  15. Susanto, A.; Sudharto, P.; Purba, R. Enhancing biological control of basal stem rot disease (Ganoderma boninense) in oil palm plantations. Mycopathologia 2005, 159, 153–157. [Google Scholar] [CrossRef] [PubMed]
  16. Sapak, Z.; Meon, S.; Ahmad, Z.M.A. Effect of endophytic bacteria on growth and suppression of Ganoderma infected in oil palm. Int. J. Agric. Biol. 2008, 10, 127–132. [Google Scholar]
  17. Muniroh, M.S.; Nusaibah, S.A.; Vadamalai, G.; Siddique, Y. Proficiency of biocontrol agents as plant growth promoters and hydrolytic enzyme producers in Ganoderma boninense infected oil palm seedlings. Curr. Plant Biol. 2019, 20, 100116. [Google Scholar] [CrossRef]
  18. Breton, F.; Hasan, Y.; Hariadi; Lubis, Z.; de Franqueville, H. Characterization of parameters for the development of an early screening test for basal stem rot tolerance in oil palm progenies. J. Oil Palm Res. 2006, 24–36. [Google Scholar]
  19. Idris, A.; Kushairi, A.; Ismail, S.; Ariffin, D. Selection for partial resistance in oil palm progenies to Ganoderma basal stem rot. J. Oil Palm Res. 2004, 16, 12–18. [Google Scholar]
  20. Durand-Gasselin, T.; Asmady, H.; Flori, A.; Jacquemard, J.C.; Hayun, Z.; Breton, F.; de Franqueville, H. Possible sources of genetic resistance in oil palm (Elaeis guineensis Jacq.) to basal stem rot caused by Ganoderma boninense—Prospects for future breeding. Mycopathologia 2005, 159, 93–100. [Google Scholar] [CrossRef]
  21. Chaparro, J.M.; Sheflin, A.M.; Manter, D.K.; Vivanco, J.M. Manipulating the soil microbiome to increase soil health and plant fertility. Biol. Fert. Soils 2012, 48, 489–499. [Google Scholar] [CrossRef]
  22. Tian, L.; Lin, X.; Tian, J.; Ji, L.; Chen, Y.; Tran, L.-S.P.; Tian, C. Research advances of beneficial microbiota associated with crop plants. Int. J. Mol. Sci. 2020, 21, 1792. [Google Scholar] [CrossRef] [Green Version]
  23. Trivedi, P.; Leach, J.E.; Tringe, S.G.; Sa, T.; Singh, B.K. Plant–microbiome interactions: From community assembly to plant health. Nat. Rev. Microbiol. 2020, 18, 607–621. [Google Scholar] [CrossRef]
  24. Wei, Z.; Gu, Y.; Friman, V.-P.; Kowalchuk, G.A.; Xu, Y.; Shen, Q.; Jousset, A. Initial soil microbiome composition and functioning predetermine future plant health. Sci. Adv. 2019, 5, eaaw0759. [Google Scholar] [CrossRef] [Green Version]
  25. Schlatter, D.; Kinkel, L.; Thomashow, L.; Weller, D.; Paulitz, T. Disease suppressive soils: New insights from the soil microbiome. Phytopathology 2017, 107, 1284–1297. [Google Scholar] [CrossRef] [PubMed] [Green Version]
  26. Janvier, C.; Villeneuve, F.; Alabouvette, C.; Edel-Hermann, V.; Mateille, T.; Steinberg, C. Soil health through soil disease suppression: Which strategy from descriptors to indicators? Soil Biol. Biochem. 2007, 39, 1–23. [Google Scholar] [CrossRef]
  27. Mendes, R.; Kruijt, M.; de Bruijn, I.; Dekkers, E.; van der Voort, M.; Schneider, J.H.M.; Piceno, Y.M.; DeSantis, T.Z.; Andersen, G.L.; Bakker, P.A.H.M.; et al. Deciphering the rhizosphere microbiome for disease-suppressive bacteria. Science 2011, 332, 1097. [Google Scholar] [CrossRef] [PubMed]
  28. Ros, M.; Almagro, M.; Fernández, J.A.; Egea-Gilabert, C.; Faz, Á.; Pascual, J.A. Approaches for the discrimination of suppressive soils for Pythium irregulare disease. Appl. Soil Ecol. 2020, 147, 103439. [Google Scholar] [CrossRef]
  29. Siegel-Hertz, K.; Edel-Hermann, V.; Chapelle, E.; Terrat, S.; Raaijmakers, J.M.; Steinberg, C. Comparative microbiome analysis of a Fusarium wilt suppressive soil and a Fusarium wilt conducive soil from the Châteaurenard region. Front. Microbiol. 2018, 9, 568. [Google Scholar] [CrossRef] [PubMed]
  30. Schulz, G.; Schneider, D.; Brinkmann, N.; Edy, N.; Daniel, R.; Polle, A.; Scheu, S.; Krashevska, V. Changes in trophic groups of protists with conversion of rainforest into rubber and oil palm plantations. Front. Microbiol. 2019, 10, 240. [Google Scholar] [CrossRef] [PubMed] [Green Version]
  31. Tin, H.S.; Palaniveloo, K.; Anilik, J.; Vickneswaran, M.; Tashiro, Y.; Vairappan, C.S.; Sakai, K. Impact of land-use change on vertical soil bacterial communities in Sabah. Microb. Ecol. 2018, 75, 459–467. [Google Scholar] [CrossRef]
  32. Tripathi, B.M.; Edwards, D.P.; Mendes, L.W.; Kim, M.; Dong, K.; Kim, H.; Adams, J.M. The impact of tropical forest logging and oil palm agriculture on the soil microbiome. Mol. Ecol. 2016, 25, 2244–2257. [Google Scholar] [CrossRef]
  33. Wood, S.A.; Gilbert, J.A.; Leff, J.W.; Fierer, N.; D’Angelo, H.; Bateman, C.; Gedallovich, S.M.; Gillikin, C.M.; Gradoville, M.R.; Mansor, P.; et al. Consequences of tropical forest conversion to oil palm on soil bacterial community and network structure. Soil Biol. Biochem. 2017, 112, 258–268. [Google Scholar] [CrossRef]
  34. Rao, V.; Lim, C.C.; Chia, C.C.; Teo, K.W. Studies on Ganoderma spread and control. Planter 2003, 79, 367–383. [Google Scholar]
  35. Paramananthan, S. Soils of Malaysia: Their Characteristics and Identification; Academy of Sciences Malaysia: Kuala Lumpur, Malaysia, 2000; Volume 1, p. 616. [Google Scholar]
  36. Soil Survey Staff. Keys to Soil Taxonomy—Twelfth Edition; Soil Conservation Service: Washington, DC, USA, 2014. [Google Scholar]
  37. Strohm, J.H.T. The Influence of Agricultural Tillage Practices on Soil Biodiversity. Master’s Thesis, The University of Guelph, Guelph, ON, Canada, 2015. [Google Scholar]
  38. Chen, Z.Y.; Goh, Y.K.; Goh, Y.K.; Goh, K.J. Life expectancy of oil palm (Elaeis guineensis) infected by Ganoderma boninense in coastal soils, Malaysia: A case study. Arch. Phytopathol. Pflanzenschutz 2017, 50, 598–612. [Google Scholar] [CrossRef]
  39. Campbell, C.L.; Madden, L.V. Introduction to Plant Disease Epidemiology; John Wiley & Sons: New York, NY, USA, 1990; p. 532. [Google Scholar]
  40. Murakami, H.; Tsushima, S.; Kuroyanagi, Y.; Shishido, Y. Reduction of resting spore density of Plasmodiophora brassicae and clubroot disease severity by liming. Soil Sci. Plant Nutr. 2002, 48, 685–691. [Google Scholar] [CrossRef] [Green Version]
  41. Kome, G.K.; Enang, R.K.; Yerima, B.P.K.; Lontsi, M.G.R. Models relating soil pH measurements in H2O, KCl and CaCl2 for volcanic ash soils of Cameroon. Geoderma Reg. 2018, 14, e00185. [Google Scholar] [CrossRef]
  42. Behera, S.K.; Suresh, K.; Rao, B.N.; Manoja, K.; Manorama, K. Soil nutrient status and leaf nutrient norms in oil palm (Elaeis guineensis Jacq.) plantations grown in the West Coastal area of India. Commun. Soil Sci. Plant Anal. 2015, 47, 255–262. [Google Scholar] [CrossRef]
  43. Jones, J.B.J. Laboratory Guide for Conducting Soil Tests and Plant Analysis; CRC Press: Boca Raton, FL, USA, 2001. [Google Scholar]
  44. Ng, P.H.C.; Gan, H.H.; Goh, K.J. Soil nutrient changes in Ultisols under oil palm in Johor, Malaysia. J. Oil Palm Environ. 2011, 2, 93–104. [Google Scholar] [CrossRef]
  45. Moris, N.; Mohinder, S.S. Manual of Laboratory Methods of Chemical Soil Analysis; Rubber Research Institute Malaysia (RRIM): Kuala Lumpur, Malaysia, 1980. [Google Scholar]
  46. Sharifuddin, H.A.H.; Fauziah, I.; Zaharah, A.R. Technique of soil testing and plant analysis and their utilization for crop production in malaysia. Commun. Soil Sci. Plant Anal. 1990, 21, 1959–1978. [Google Scholar] [CrossRef]
  47. Lim, H.K. Working Manual for Soil Analysis; Ministry of Agriculture: Kuala Lumpur, Malaysia, 1975. [Google Scholar]
  48. Burt, R. Soil Survey Laboratory Methods Manual: Soil Survey Investigations Report No. 42; United States Department of Agriculture (USDA)-Natural Resources Conservation Service (NRCS): Washington, DC, USA, 2004; p. 736. [Google Scholar]
  49. Courty, P.E.; Buée, M.; Tech, J.J.T.; Brulé, D.; Colin, Y.; Leveau, J.H.J.; Uroz, S. Impact of soil pedogenesis on the diversity and composition of fungal communities across the California soil chronosequence of Mendocino. Mycorrhiza 2018, 28, 343–356. [Google Scholar] [CrossRef]
  50. Herlemann, D.P.R.; Labrenz, M.; Jürgens, K.; Bertilsson, S.; Waniek, J.J.; Andersson, A.F. Transitions in bacterial communities along the 2000 km salinity gradient of the Baltic Sea. ISME J. 2011, 5, 1571–1579. [Google Scholar] [CrossRef] [Green Version]
  51. Klindworth, A.; Pruesse, E.; Schweer, T.; Peplies, J.; Quast, C.; Horn, M.; Glöckner, F.O. Evaluation of general 16S ribosomal RNA gene PCR primers for classical and next-generation sequencing-based diversity studies. Nucleic Acids Res. 2012, 41, e1. [Google Scholar] [CrossRef]
  52. Lane, D.J. 16S/23S sequencing. In Nucleic Acid Technologies in Bacterial Systematic; Stackebrant, E., Goodfellow, M., Eds.; Wiley: New York, NY, USA, 1991; pp. 115–175. [Google Scholar]
  53. Medlin, L.; Elwood, H.J.; Stickel, S.; Sogin, M.L. The characterization of enzymatically amplified eukaryotic 16S-like rRNA-coding regions. Gene 1988, 71, 491–499. [Google Scholar] [CrossRef] [Green Version]
  54. Amaral-Zettler, L.A.; McCliment, E.A.; Ducklow, H.W.; Huse, S.M. A method for studying protistan diversity using massively parallel sequencing of V9 hypervariable regions of small-subunit ribosomal RNA genes. PLoS ONE 2009, 4, e6372. [Google Scholar] [CrossRef]
  55. Ong, S.H.; Kukkillaya, V.U.; Wilm, A.; Lay, C.; Ho, E.X.P.; Low, L.; Hibberd, M.L.; Nagarajan, N. Species identification and profiling of complex microbial communities using shotgun Illumina sequencing of 16S rRNA amplicon sequences. PLoS ONE 2013, 8, e60811. [Google Scholar] [CrossRef] [PubMed] [Green Version]
  56. Watts, M.P.; Spurr, L.P.; Gan, H.M.; Moreau, J.W. Characterization of an autotrophic bioreactor microbial consortium degrading thiocyanate. Appl. Microbiol. Biotechnol. 2017, 101, 5889–5901. [Google Scholar] [CrossRef] [PubMed]
  57. Md Zoqratt, M.Z.H.; Eng, W.W.H.; Thai, B.T.; Austin, C.M.; Gan, H.M. Microbiome analysis of Pacific white shrimp gut and rearing water from Malaysia and Vietnam: Implications for aquaculture research and management. Peer J. 2018, 6, e5826. [Google Scholar] [CrossRef] [PubMed]
  58. Bolger, A.M.; Lohse, M.; Usadel, B. Trimmomatic: A flexible trimmer for Illumina sequence data. Bioinformatics 2014, 30, 2114–2120. [Google Scholar] [CrossRef] [Green Version]
  59. Martin, M. Cutadapt removes adapter sequences from high-throughput sequencing reads. EMBnet J. 2011, 17, 10–12. [Google Scholar] [CrossRef]
  60. Edgar, R.C. Search and clustering orders of magnitude faster than BLAST. Bioinformatics 2010, 26, 2460–2461. [Google Scholar] [CrossRef] [Green Version]
  61. Bolyen, E.; Rideout, J.R.; Dillon, M.R.; Bokulich, N.A.; Abnet, C.C.; Al-Ghalith, G.A.; Alexander, H.; Alm, E.J.; Arumugam, M.; Asnicar, F.; et al. Reproducible, interactive, scalable and extensible microbiome data science using QIIME 2. Nat. Biotechnol. 2019, 37, 852–857. [Google Scholar] [CrossRef]
  62. Callahan, B.J.; McMurdie, P.J.; Rosen, M.J.; Han, A.W.; Johnson, A.J.A.; Holmes, S.P. DADA2: High-resolution sample inference from Illumina amplicon data. Nat. Methods 2016, 13, 581–583. [Google Scholar] [CrossRef] [Green Version]
  63. Katoh, K.; Misawa, K.; Kuma, K.-i.; Miyata, T. MAFFT: A novel method for rapid multiple sequence alignment based on fast Fourier transform. Nucleic Acids Res. 2002, 30, 3059–3066. [Google Scholar] [CrossRef] [Green Version]
  64. Price, M.N.; Dehal, P.S.; Arkin, A.P. FastTree 2—Approximately maximum-likelihood trees for large alignments. PLoS ONE 2010, 5, e9490. [Google Scholar] [CrossRef] [PubMed]
  65. Bokulich, N.A.; Kaehler, B.D.; Rideout, J.R.; Dillon, M.; Bolyen, E.; Knight, R.; Huttley, G.A.; Gregory Caporaso, J. Optimizing taxonomic classification of marker-gene amplicon sequences with QIIME 2′s q2-feature-classifier plugin. Microbiome 2018, 6, 90. [Google Scholar] [CrossRef] [PubMed]
  66. Pedregosa, F.; Varoquaux, G.; Gramfort, A.; Michel, V.; Thirion, B.; Grisel, O.; Blondel, M.; Prettenhofer, P.; Weiss, R.; Dubourg, V.; et al. Scikit-learn: Machine learning in python. J. Mach. Learn. Res. 2011, 12, 2825–2830. [Google Scholar] [CrossRef]
  67. Pruesse, E.; Peplies, J.; Glöckner, F.O. SINA: Accurate high-throughput multiple sequence alignment of ribosomal RNA genes. Bioinformatics 2012, 28, 1823–1829. [Google Scholar] [CrossRef] [PubMed]
  68. Pruesse, E.; Quast, C.; Knittel, K.; Fuchs, B.M.; Ludwig, W.; Peplies, J.; Glöckner, F.O. SILVA: A comprehensive online resource for quality checked and aligned ribosomal RNA sequence data compatible with ARB. Nucleic Acids Res. 2007, 35, 7188–7196. [Google Scholar] [CrossRef] [PubMed] [Green Version]
  69. Faith, D.P. Conservation evaluation and phylogenetic diversity. Biol. Conserv. 1992, 61, 1–10. [Google Scholar] [CrossRef]
  70. Lozupone, C.; Knight, R. UniFrac: A new phylogenetic method for comparing microbial communities. Appl. Environ. Microbiol. 2005, 71, 8228–8235. [Google Scholar] [CrossRef] [Green Version]
  71. Lozupone, C.A.; Hamady, M.; Kelley, S.T.; Knight, R. Quantitative and qualitative beta diversity measures lead to different insights into factors that structure microbial communities. Appl. Environ. Microbiol. 2007, 73, 1576–1585. [Google Scholar] [CrossRef] [Green Version]
  72. Wickham, H.; Wickham, M.H. The Ggplot Package. Available online: https://cran.r-project.org/web/packages/ggplot2/index.html (accessed on 16 March 2020).
  73. RStudio Team. RStudio: Integrated Development for R. Available online: http://www.rstudio.com/ (accessed on 16 March 2020).
  74. Benjamini, Y.; Hochberg, Y. Controlling the false discovery rate: A practical and powerful approach to multiple testing. J. R. Stat. Soc. Ser. B Methodol. 1995, 57, 289–300. [Google Scholar] [CrossRef]
  75. McMurdie, P.J.; Holmes, S. Phyloseq: An R package for reproducible interactive analysis and graphics of microbiome census data. PLoS ONE 2013, 8, e61217. [Google Scholar] [CrossRef] [Green Version]
  76. Mandal, S.; Van Treuren, W.; White, R.A.; Eggesbø, M.; Knight, R.; Peddada, S.D. Analysis of composition of microbiomes: A novel method for studying microbial composition. Microb. Ecol. Health Dis. 2015, 26, 27663. [Google Scholar] [CrossRef] [PubMed] [Green Version]
  77. Shen, C.; Liang, W.; Shi, Y.; Lin, X.; Zhang, H.; Wu, X.; Xie, G.; Chain, P.; Grogan, P.; Chu, H. Contrasting elevational diversity patterns between eukaryotic soil microbes and plants. Ecology 2014, 95, 3190–3202. [Google Scholar] [CrossRef] [Green Version]
  78. Zhalnina, K.; Dias, R.; de Quadros, P.D.; Davis-Richardson, A.; Camargo, F.A.O.; Clark, I.M.; McGrath, S.P.; Hirsch, P.R.; Triplett, E.W. Soil pH determines microbial diversity and composition in the park grass experiment. Microb. Ecol. 2015, 69, 395–406. [Google Scholar] [CrossRef] [PubMed]
  79. Wang, R.; Zhang, H.; Sun, L.; Qi, G.; Chen, S.; Zhao, X. Microbial community composition is related to soil biological and chemical properties and bacterial wilt outbreak. Sci. Rep. 2017, 7, 343. [Google Scholar] [CrossRef] [PubMed] [Green Version]
  80. Rousk, J.; Brookes, P.C.; Bååth, E. Contrasting soil pH effects on fungal and bacterial growth suggest functional redundancy in carbon mineralization. Appl. Environ. Microbiol. 2009, 75, 1589. [Google Scholar] [CrossRef] [Green Version]
  81. Rousk, J.; Bååth, E.; Brookes, P.C.; Lauber, C.L.; Lozupone, C.; Caporaso, J.G.; Knight, R.; Fierer, N. Soil bacterial and fungal communities across a pH gradient in an arable soil. ISME J. 2010, 4, 1340–1351. [Google Scholar] [CrossRef]
  82. Shamshuddin, J.; Paramananthan, S. Acidity and charge characteristics of marine alluvial soils from Carey Islands, Selangor. Pertanika 1988, 11, 15–23. [Google Scholar]
  83. Lynch, J.M. Microbial activity in acid soils. In Plant-Soil Interactions at Low pH: Principles and Management: Proceedings of the Third International Symposium on Plant-Soil Interactions at Low pH, Brisbane, Queensland, Australia, 12–16 September 1993; Date, R.A., Grundon, N.J., Rayment, G.E., Probert, M.E., Eds.; Springer: Dordrecht, The Netherlands, 1995; pp. 167–172. [Google Scholar] [CrossRef]
  84. Ownley, B.H.; Duffy, B.K.; Weller, D.M. Identification and manipulation of soil properties to improve the biological control performance of phenazine-producing Pseudomonas fluorescens. Appl. Environ. Microbiol. 2003, 69, 3333. [Google Scholar] [CrossRef] [Green Version]
  85. Li, S.; Liu, Y.; Wang, J.; Yang, L.; Zhang, S.; Xu, C.; Ding, W. Soil acidification aggravates the occurrence of bacterial wilt in South China. Front. Microbiol. 2017, 8, 703. [Google Scholar] [CrossRef] [Green Version]
  86. Duffy, B.K.; Ownley, B.H.; Weller, D.M. Soil chemical and physical properties associated with suppression of Take-all of wheat by Trichoderma koningii. Phytopathology 1997, 87, 1118–1124. [Google Scholar] [CrossRef] [Green Version]
  87. Kredics, L.; Antal, Z.; Manczinger, L.; Szekeres, A.; Kevei, F.; Nagy, E. Influence of environmental parameters on Trichoderma strains with biocontrol potential. Food Technol. Biotechnol. 2003, 41, 37–42. [Google Scholar]
  88. Rahman, K.A.; Othman, R. Influence of pH levels on disease development in oil palm seedling roots infected with Ganoderma boninense. Rhizosphere 2020, 13, 100181. [Google Scholar] [CrossRef]
  89. Nawawi, A.; Ho, Y.W. Effect of temperature and pH on growth pattern of Ganoderma boninense from oil palm in Peninsular Malaysia. Pertanika 1990, 13, 303–307. [Google Scholar]
  90. Marshall, I.P.G.; Starnawski, P.; Cupit, C.; Fernández Cáceres, E.; Ettema, T.J.G.; Schramm, A.; Kjeldsen, K.U. The novel bacterial phylum Calditrichaeota is diverse, widespread and abundant in marine sediments and has the capacity to degrade detrital proteins. Environ. Microbiol. Rep. 2017, 9, 397–403. [Google Scholar] [CrossRef] [PubMed]
  91. Castelle, C.J.; Hug, L.A.; Wrighton, K.C.; Thomas, B.C.; Williams, K.H.; Wu, D.; Tringe, S.G.; Singer, S.W.; Eisen, J.A.; Banfield, J.F. Extraordinary phylogenetic diversity and metabolic versatility in aquifer sediment. Nat. Commun. 2013, 4, 2120. [Google Scholar] [CrossRef] [PubMed] [Green Version]
  92. Lin, X.; Kennedy, D.; Fredrickson, J.; Bjornstad, B.; Konopka, A. Vertical stratification of subsurface microbial community composition across geological formations at the Hanford Site. Environ. Microbiol. 2012, 14, 414–425. [Google Scholar] [CrossRef]
  93. Goh, K.M.; Shahar, S.; Chan, K.-G.; Chong, C.S.; Amran, S.I.; Sani, M.H.; Zakaria, I.I.; Kahar, U.M. Current status and potential applications of underexplored prokaryotes. Microorganisms 2019, 7, 468. [Google Scholar] [CrossRef] [Green Version]
  94. Becraft, E.D.; Woyke, T.; Jarett, J.; Ivanova, N.; Godoy-Vitorino, F.; Poulton, N.; Brown, J.M.; Brown, J.; Lau, M.C.Y.; Onstott, T.; et al. Rokubacteria: Genomic giants among the uncultured bacterial phyla. Front. Microbiol. 2017, 8, 2264. [Google Scholar] [CrossRef]
  95. Crits-Christoph, A.; Diamond, S.; Butterfield, C.N.; Thomas, B.C.; Banfield, J.F. Novel soil bacteria possess diverse genes for secondary metabolite biosynthesis. Nature 2018, 558, 440–444. [Google Scholar] [CrossRef]
  96. Feng, H.; Guo, J.; Wang, W.; Song, X.; Yu, S. Soil depth determines the composition and diversity of bacterial and archaeal communities in a poplar plantation. Forests 2019, 10, 550. [Google Scholar] [CrossRef] [Green Version]
  97. Steger, K.; Kim, A.T.; Ganzert, L.; Grossart, H.-P.; Smart, D.R. Floodplain soil and its bacterial composition are strongly affected by depth. FEMS Microbiol. Ecol. 2019, 95, fiz014. [Google Scholar] [CrossRef] [PubMed]
  98. Fiedler, C.J.; Schönher, C.; Proksch, P.; Kerschbaumer, D.J.; Mayr, E.; Zunabovic-Pichler, M.; Domig, K.J.; Perfler, R. Assessment of microbial community dynamics in river bank filtrate using high-throughput sequencing and flow cytometry. Front. Microbiol. 2018, 9, 2887. [Google Scholar] [CrossRef] [PubMed]
  99. Gayner, N.J. River Bank Inducement Influence on a Shallow Groundwater Microbial Community and Its Effects on Aquifer Reactivity. Master’s Thesis, University of Wisconsin-Milwaukee, Milwaukee, WI, USA, 2018. [Google Scholar]
  100. Jungbluth, S.P.; Amend, J.P.; Rappé, M.S. Metagenome sequencing and 98 microbial genomes from Juan de Fuca Ridge flank subsurface fluids. Sci. Data 2017, 4, 170037. [Google Scholar] [CrossRef] [PubMed]
  101. Wu, M.; Zhang, H.; Li, X.; Zhang, Y.; Su, Z.; Zhang, C. Soil fungistasis and its relations to soil microbial composition and diversity: A case study of a series of soils with different fungistasis. J. Environ. Sci. 2008, 20, 871–877. [Google Scholar] [CrossRef]
  102. Lee, C.G.; Iida, T.; Inoue, Y.; Muramoto, Y.; Watanabe, H.; Nakaho, K.; Ohkuma, M. Prokaryotic communities at different depths between soils with and without tomato bacterial wilt but pathogen-present in a single greenhouse. Microbes Environ. 2017, 32, 118–124. [Google Scholar] [CrossRef] [PubMed] [Green Version]
  103. Lee, C.G.; Iida, T.; Uwagaki, Y.; Otani, Y.; Nakaho, K.; Ohkuma, M. Comparison of prokaryotic and eukaryotic communities in soil samples with and without tomato bacterial wilt collected from different fields. Microbes Environ. 2017, 32, 376–385. [Google Scholar] [CrossRef] [Green Version]
  104. He, Y.; Wu, Z.; Wang, W.; Liu, X.; Ye, B.-C. Bacterial community and phosphorus species changes in pepper rhizosphere soils after Pseudomonas putida Rs-198 inoculation. Rhizosphere 2019, 11, 100164. [Google Scholar] [CrossRef]
  105. Zhao, Y.; Zhang, M.; Yang, W.; Di, H.J.; Ma, L.; Liu, W.; Li, B. Effects of microbial inoculants on phosphorus and potassium availability, bacterial community composition, and chili pepper growth in a calcareous soil: A greenhouse study. J. Soils Sediments 2019, 19, 3597–3607. [Google Scholar] [CrossRef]
  106. Niu, J.; Rang, Z.; Zhang, C.; Chen, W.; Tian, F.; Yin, H.; Dai, L. The succession pattern of soil microbial communities and its relationship with tobacco bacterial wilt. BMC Microbiol. 2016, 16, 233. [Google Scholar] [CrossRef] [Green Version]
  107. Gao, L.; Wang, R.; Gao, J.; Li, F.; Huang, G.; Huo, G.; Liu, Z.; Tang, W.; Shen, G. Analysis of the structure of bacterial and fungal communities in disease suppressive and disease conducive tobacco-planting soils in China. Soil Res. 2019, 58, 35–40. [Google Scholar] [CrossRef]
  108. Kopecky, J.; Samkova, Z.; Sarikhani, E.; Kyselková, M.; Omelka, M.; Kristufek, V.; Divis, J.; Grundmann, G.G.; Moënne-Loccoz, Y.; Sagova-Mareckova, M. Bacterial, archaeal and micro-eukaryotic communities characterize a disease-suppressive or conducive soil and a cultivar resistant or susceptible to common scab. Sci. Rep. 2019, 9, 14883. [Google Scholar] [CrossRef] [PubMed]
  109. Svenningsen, N.B.; Watts-Williams, S.J.; Joner, E.J.; Battini, F.; Efthymiou, A.; Cruz-Paredes, C.; Nybroe, O.; Jakobsen, I. Suppression of the activity of arbuscular mycorrhizal fungi by the soil microbiota. ISME J. 2018, 12, 1296–1307. [Google Scholar] [CrossRef] [PubMed] [Green Version]
  110. Pedersen, A.L.; Nybroe, O.; Winding, A.; Ekelund, F.; Bjørnlund, L. Bacterial feeders, the nematode Caenorhabditis elegans and the flagellate Cercomonas longicauda, have different effects on outcome of competition among the Pseudomonas biocontrol strains CHA0 and DSS73. Microb. Ecol. 2009, 57, 501–509. [Google Scholar] [CrossRef] [PubMed]
  111. Rønn, R.; McCaig, A.E.; Griffiths, B.S.; Prosser, J.I. Impact of protozoan grazing on bacterial community structure in soil microcosms. Appl. Environ. Microbiol. 2002, 68, 6094. [Google Scholar] [CrossRef] [Green Version]
  112. Pedersen, A.L.; Ekelund, F.; Johansen, A.; Winding, A. Interaction of bacteria-feeding soil flagellates and Pseudomonas spp. Biol. Fert. Soils 2010, 46, 151–158. [Google Scholar] [CrossRef]
  113. Pedersen, A.L.; Winding, A.; Altenburger, A.; Ekelund, F. Protozoan growth rates on secondary-metabolite-producing Pseudomonas spp. correlate with high-level protozoan taxonomy. FEMS Microbiol. Lett. 2011, 316, 16–22. [Google Scholar] [CrossRef] [Green Version]
  114. Müller, M.S.; Scheu, S.; Jousset, A. Protozoa drive the dynamics of culturable biocontrol bacterial communities. PLoS ONE 2013, 8, e66200. [Google Scholar] [CrossRef] [Green Version]
  115. Buyer, J.S.; Roberts, D.P.; Russek-Cohen, E. Microbial community structure and function in the spermosphere as affected by soil and seed type. Can. J. Microbiol. 1999, 45, 138–144. [Google Scholar] [CrossRef]
  116. Hirose, D.; Degawa, Y.; Inaba, S.; Tokumasu, S. The anamorphic genus Calcarisporiella is a new member of the Mucoromycotina. Mycoscience 2012, 53, 256–260. [Google Scholar] [CrossRef]
  117. Du, G.; Qu, L.; Shang, K.; Sun, C.; Wang, C.; Gao, P. Ciliate Uronema marinum is the causative agent of scuticociliatosis in farm raised turbot Scophthalmus maximus. J. Oceanol. Limnol. 2019, 37, 1726–1735. [Google Scholar] [CrossRef]
  118. Ayo, B.; Latatu, A.; Artolozaga, I.; JÜRgens, K.; Iriberri, J. Factors affecting preference responses of the freshwater ciliate Uronema nigricans to bacterial prey. J. Eukaryot. Microbiol. 2009, 56, 188–193. [Google Scholar] [CrossRef] [PubMed]
  119. Ekelund, F. Tolerance of soil flagellates to increased NaCl levels. J. Eukaryot. Microbiol. 2002, 49, 324–328. [Google Scholar] [CrossRef] [PubMed]
  120. Hamilton, R.D.; Preslan, J.E. Cultural characteristics of a pelagic marine hymenostome ciliate, Uronema sp. J. Exp. Mar. Biol. Ecol. 1969, 4, 90–99. [Google Scholar] [CrossRef]
  121. Hood, A.S.C.; Aryawan, A.A.K.; Advento, A.D.; Purnomo, D.; Wahyuningsih, R.; Luke, S.H.; Ps, S.; Snaddon, J.L.; Foster, W.A.; Caliman, J.-P.; et al. Understory vegetation in oil palm plantations promotes leopard cat activity, but does not affect rats or rat damage. Front. For. Glob. Chang. 2019, 2, 51. [Google Scholar] [CrossRef]
  122. Azhar, B.; Lindenmayer, D.B.; Wood, J.; Fischer, J.; Zakaria, M. Ecological impacts of oil palm agriculture on forest mammals in plantation estates and smallholdings. Biodivers. Conserv. 2014, 23, 1175–1191. [Google Scholar] [CrossRef]
  123. Lavelle, P.; Chauvel, A.; Fragoso, C. Faunal activity in acid soils. In Plant-Soil Interactions at Low pH: Principles and Management: Proceedings of the Third International Symposium on Plant-Soil Interactions at Low pH, Brisbane, Queensland, Australia, 12–16 September 1993; Date, R.A., Grundon, N.J., Rayment, G.E., Probert, M.E., Eds.; Springer: Dordrecht, The Netherlands, 1995; pp. 201–211. [Google Scholar]
  124. Ashton-Butt, A.; Aryawan, A.A.K.; Hood, A.S.C.; Naim, M.; Purnomo, D.; Suhardi; Wahyuningsih, R.; Willcock, S.; Poppy, G.M.; Caliman, J.-P.; et al. Understory vegetation in oil palm plantations benefits soil biodiversity and decomposition rates. Front. For. Glob. Change 2018, 1, 10. [Google Scholar] [CrossRef]
  125. Gorea, E.A.; Godwin, I.D.; Mudge, A.M. Ganoderma infection of oil palm—A persistent problem in Papua New Guinea and Solomon Islands. Australas. Plant Pathol. 2019, 49, 1–9. [Google Scholar] [CrossRef]
Figure 1. Location of Blenheim oil palm-coconut estate in northern peninsular Malaysia. (A) Geographic location. (B) Aerial view of experimental plots. (C) Plots A and B refer to selected blocks with Blenheim and Bernam soils, respectively. Soil sampling points are shown along the 53 × 53 m grid-line section. (D) Sample collection sites in each plot. Green- and blue-colored dots represent palm points that were selected for soil physicochemical analyses (n = 9). Only green-colored palm points were used for microbiome analyses (n = 5). (E) Four different microsites (topsoil (0–15 cm from soil surface) and subsoil (>15–30 cm from soil surface) from palm circles (PC) and inter-palms (IP)) were selected for soil sampling. Abbreviations: T—Topsoil and S—Subsoil.
Biology 09 00424 g001
Figure 2. Principal component analysis (PCA) plot based on all the tested soil physicochemical parameters for Blenheim (BL) and Bernam (BE) soil samples collected in May (A) and December (B) 2018. Abbreviations of different physicochemical parameters: pH (pH measured in 1 M potassium chloride); OM (organic matters by loss-on-ignition), N (nitrogen), Fe (iron), Si (silica), TP (total phosphorus), AP (available phosphorus), Mn (manganese), Zn (zinc), Cu (copper), K (exchangeable potassium), Ca (calcium), Mg (exchangeable magnesium), Na (exchangeable sodium), CEC (cation exchange capacity), EC (electrical conductivity), Coarse sand (Csand), Fine sand (Fsand), Coarse silt (Csilt), and Fine silt (Fsilt).
Biology 09 00424 g002
Figure 3. Alpha-diversity based on observed features (A) and Faith phylogenetic diversity (Faith’s PD) (B) of soil prokaryotic (16S) and eukaryotic (18S) communities for Blenheim and Bernam soils collected in May (brown-colored boxplot) and December (green-colored boxplot) 2018. Asterisk of *** denote significance between soil types at p < 0.001 after Kruskal–Wallis test.
Biology 09 00424 g003
Figure 4. Beta-diversity of prokaryotic and eukaryotic communities. Principal coordinates analysis (PCoA) plots based on weighted-UniFrac matrices for prokaryotic (A) and eukaryotic (B) microbiomes.
Biology 09 00424 g004
Figure 5. Relative abundances of significant prokaryotic (A,B) and eukaryotic (C,D) taxa for Blenheim and Bernam soils at phylum/supergroup (A,C) and genus (B,D) levels.
Biology 09 00424 g005
Table 1. Ganoderma disease scores in terms of disease incidence (%) and disease severity index on Blenheim and Bernam soils for 2018 and 2019 (May and December).
Disease Class § ScoringBlenheim (Typic Quartzipsamment)Bernam (Typic Endoaquept)
2018201920182019
MayDecMayDecMayDecMayDec
Healthy (%)098.798.798.798.175.273.572.466.9
FB (%)1000010.511.68.810.5
Rot (%)20000.61.11.11.71.1
Rot + FB (%)300005.55.57.711
Vacant + Sanitation (%)41.31.31.31.37.78.39.410.5
Total Palm Censused158158158158181181181181
Disease Incidence (%)1.31.31.31.924.926.527.633.1
Disease Severity Index1.271.271.271.5815.0615.8818.2321.96
§ Abbreviations for the disease classes: FB—Fruiting body; Rot—Rotten stem bole; Rot + FB—combination of both rotten stem bole and fruiting body; and vacant + sanitation—Vacant sanitized palm point (after toppling of the diseased palms).
Table 2. A two-by-two contingency table for determining the number of infected palms (with the disease scores of 1 to 4) over healthy palms (with the disease score of 0) between Blenheim and Bernam soils on four census time points is shown below.
YearCensus Time PointsSoil TypesStatus of the Palmsp-Value after Chi-Square Test
No. of Infected PalmsNo. of Healthy PalmsTotal Assessed Palms
2018MayBlenheim2156158<0.0001
Bernam45136181
DecemberBlenheim2156158<0.0001
Bernam48134181
2019MayBlenheim2156158<0.0001
Bernam50132181
DecemberBlenheim3155158<0.0001
Bernam60122181
Table 3. Soil chemical properties of Blenheim and Bernam soil series collected from four microsites in May and December 2018.
Chemical Parameters §Blenheim (Typic Quartzipsamment)Bernam (Typic Endoaquepts)
May 2018Dec 2018May 2018Dec 2018
PCT *PCS *IPT *IPS *PCTPCSIPTIPSPCTPCSIPTIPSPCTPCSIPTIPS
pH7.65 (0.05)7.67 (0.06)7.73 (0.07)7.66 (0.06)7.90 (0.08)8.05 (0.10)7.90 (0.08)7.96 (0.08)5.66 (0.42)5.83 (0.41)6.23 (0.23)5.99 (0.35)5.53 (0.48)5.73 (0.37)5.71 (0.43)5.44 (0.50)
OM (%)5.36 (0.57)5.53 (0.38)5.08 (0.66)5.29 (0.52)5.99 (0.85)4.70 (0.47)5.07 (0.70)4.36 (0.48)11.01 (0.26)11.44 (0.10)10.79 (0.28)11.17 (0.16)11.83 (0.28)11.61 (0.5210.80 (0.33)10.69 (0.19)
N (%)0.58 (0.05)0.61 (0.07)0.49 (0.04)0.53 (0.07)0.44 (0.03)0.35 (0.04)0.50 (0.03)0.41 (0.02)0.17 (0.01)0.18 (0.01)0.15 (0.01)0.14 (0.01)0.22 (0.01)0.17 (0.02)0.16 (0.01)0.20 (0.01)
Fe (%)0.41 (0.08)0.41 (0.09)0.36 (0.09)0.44 (0.12)0.27 (0.07)0.24 (0.07)0.30 (0.07)0.29 (0.08)1.26 (0.04)1.27 (0.04)1.15 (0.08)1.24 (0.05)1.35 (0.03)1.23 (0.05)1.23 (0.05)1.25 (0.05)
Si (%)0.75 (0.03)0.69 (0.02)0.75 (0.05)0.81 (0.05)0.72 (0.24)0.60 (0.17)0.93 (0.31)0.89 (0.39)4.61 (0.11)4.88 (0.25)4.65 (0.10)4.57 (0.18)4.53 (0.09)4.43 (0.10)4.47 (0.07)4.63 (0.08)
Ca (%)40.24 (2.76)38.69 (2.60)41.04 (2.83)37.46 (1.74) 1.07 (0.31)0.65 (0.13)0.68 (0.15)0.59 (0.09)
TP (mg/kg)1080.70 (180.49)933.56 (159.13)553.44 (65.13)583.44 (153.84)741.56 (144.85)457.56 (64.89)698.33 (115.76)540.56 (86.01)340.56 (25.78)414.36 (29.74)329.22 (34.53)275.44 (30.82)960 (232.79)428.33 (40.26)381.67 (41.53)443.11 (40.21)
AP (mg/kg)12.4 (6.20)7.12 (3.12)10.1 (4.79)5.42 (2.65)20.13 (3.66)10.42 (2.58)19.84 (5.13)15.56 (5.01)62.98 (11.15)81.54 (12.33)75.52 (21.82)43.01 (9.56)158.22 (15.59)85.87 (16.78)54.94 (9.80)67.93 (10.65)
Mn (mg/kg)140.44 (9.02)148.89 (10.84)143.44 (9.84)144.22 (11.72)145.33 (11.74)119.13 (9.48)161.22 (13.04)154.78 (16.80)237.11 (20.54)276.64 (16.56)231.11 (24.81)203.44 (17.94)199.67 (12.09)181.78 (11.77)225.11 (32.37)231.22 (14.54)
Zn (mg/kg)19.46 (2.47)21.70 (3.34)17.32 (1.90)19.49 (3.50)21.18 (2.03)18.16 (1.64)24.58 (2.88)23.19 (3.68)43.48 (0.93)47.35 (2.10)43.36 (2.48)42.72 (0.88)54.32 (2.01)55.32 (6.39)47.33 (1.67)48.08 (0.85)
Cu (mg/kg)12.52 (0.65)12.52 (0.64)12.52 (0.65)12.23 (0.64)11.80 (0.52)10.55 (0.56)11.84 (0.79)10.88 (0.55)7.83 (0.32)8.88 (0.44)8.19 (0.41)7.20 (0.58)9.73 (0.36)9.32 (0.67)10.29 (0.34)10.12 (0.13)
Exchangeable K (cmol(+)/kg)0.16 (0.05)0.12 (0.04)0.17 (0.05)0.13 (0.04)0.20 (0.05)0.15 (0.02)0.22 (0.06)0.18 (0.05)1.68 (0.15)1.71 (0.20)1.04 (0.11)1.33 (0.18)2.55 (0.28)2.17 (0.32)1.17 (0.15)1.70 (0.20)
Exchangeable Mg (cmol(+)/kg)0.23 (0.04)0.18 (0.03)0.21 (0.03)0.19 (0.04)0.44
(0.08)
0.33 (0.05)0.19 (0.02)0.17 (0.02)8.62 (0.73)7.91 (0.99)9.40 (0.90)10.27 (0.72)7.79 (0.67)9.87 (0.62)8.23 (1.04)6.63 (1.07)
Exchangeable Na (cmol(+)/kg)0.15 (0.01)0.13 (0.01)0.144 (0.01)0.16 (0.02)0.15 (0.01)0.15 (0.01)0.13 (0.01)0.13 (0.01)1.45 (0.19)2.23 (0.26)0.86 (0.12)1.26 (0.15)1.16 (0.17)2.24 (0.32)0.68 (0.12)1.14 (0.21)
CEC (cmol(+)/kg)6.94 (1.25)7.29 (0.99)7.57 (1.25)7.58 (1.33)8.12 (1.53)6.62 (1.14)8.28 (1.26)7.32 (1.31)29.64 (0.85)28.75 (1.05)29.49 (1.04)30.48 (0.94)26.40 (0.89)24.61 (0.98)25.03 (0.69)26.88 (0.82)
EC (μS/cm)128.67 (11.13)146.11 (10.02)129.00 (10.70)136.11 (10.64)157.44 (26.63)145.02 (23.83)137.88 (12.62)142.94 (21.15)728.22 (77.26)985.82 (126.43)502.89 (62.49)613.33 (97.83)596.78 (61.07)861.00 (116.47)486.56 (40.65)533.67 (61.37)
* PCT, PCS, IPT, and IPS microsites refer to palm circle topsoil (0–15 cm), palm circle subsoil (15–30 cm), inter-palm top soil (0–15 cm), and inter-palm subsoil (15–30 cm), respectively. All the numbers presented in the table were means of 9 replicates and the numbers in the bracket were standard error. § Abbreviations of different chemical parameters: pH (measured in 1 M potassium chloride), OM (organic matters by loss-on-ignition), N (nitrogen), Fe (iron), Si (silica), TP (total phosphorus), AP (available phosphorus), Mn (manganese), Zn (zinc), Cu (copper), K (potassium), Ca (calcium), Mg (magnesium), Na (sodium), CEC (cation exchange capacity), and EC (electrical conductivity).
Publisher’s Note: MDPI stays neutral with regard to jurisdictional claims in published maps and institutional affiliations.

