
Heart Rate and Acceleration Dynamics during Swim-Fitness and Stress Challenge Tests in Yellowtail Kingfish (Seriola lalandi)

 ,
,
Abstract
:Simple Summary
Abstract
1. Introduction
2. Materials and Methods
2.1. Ethical Approval
2.2. Experimental Fish and Conditions
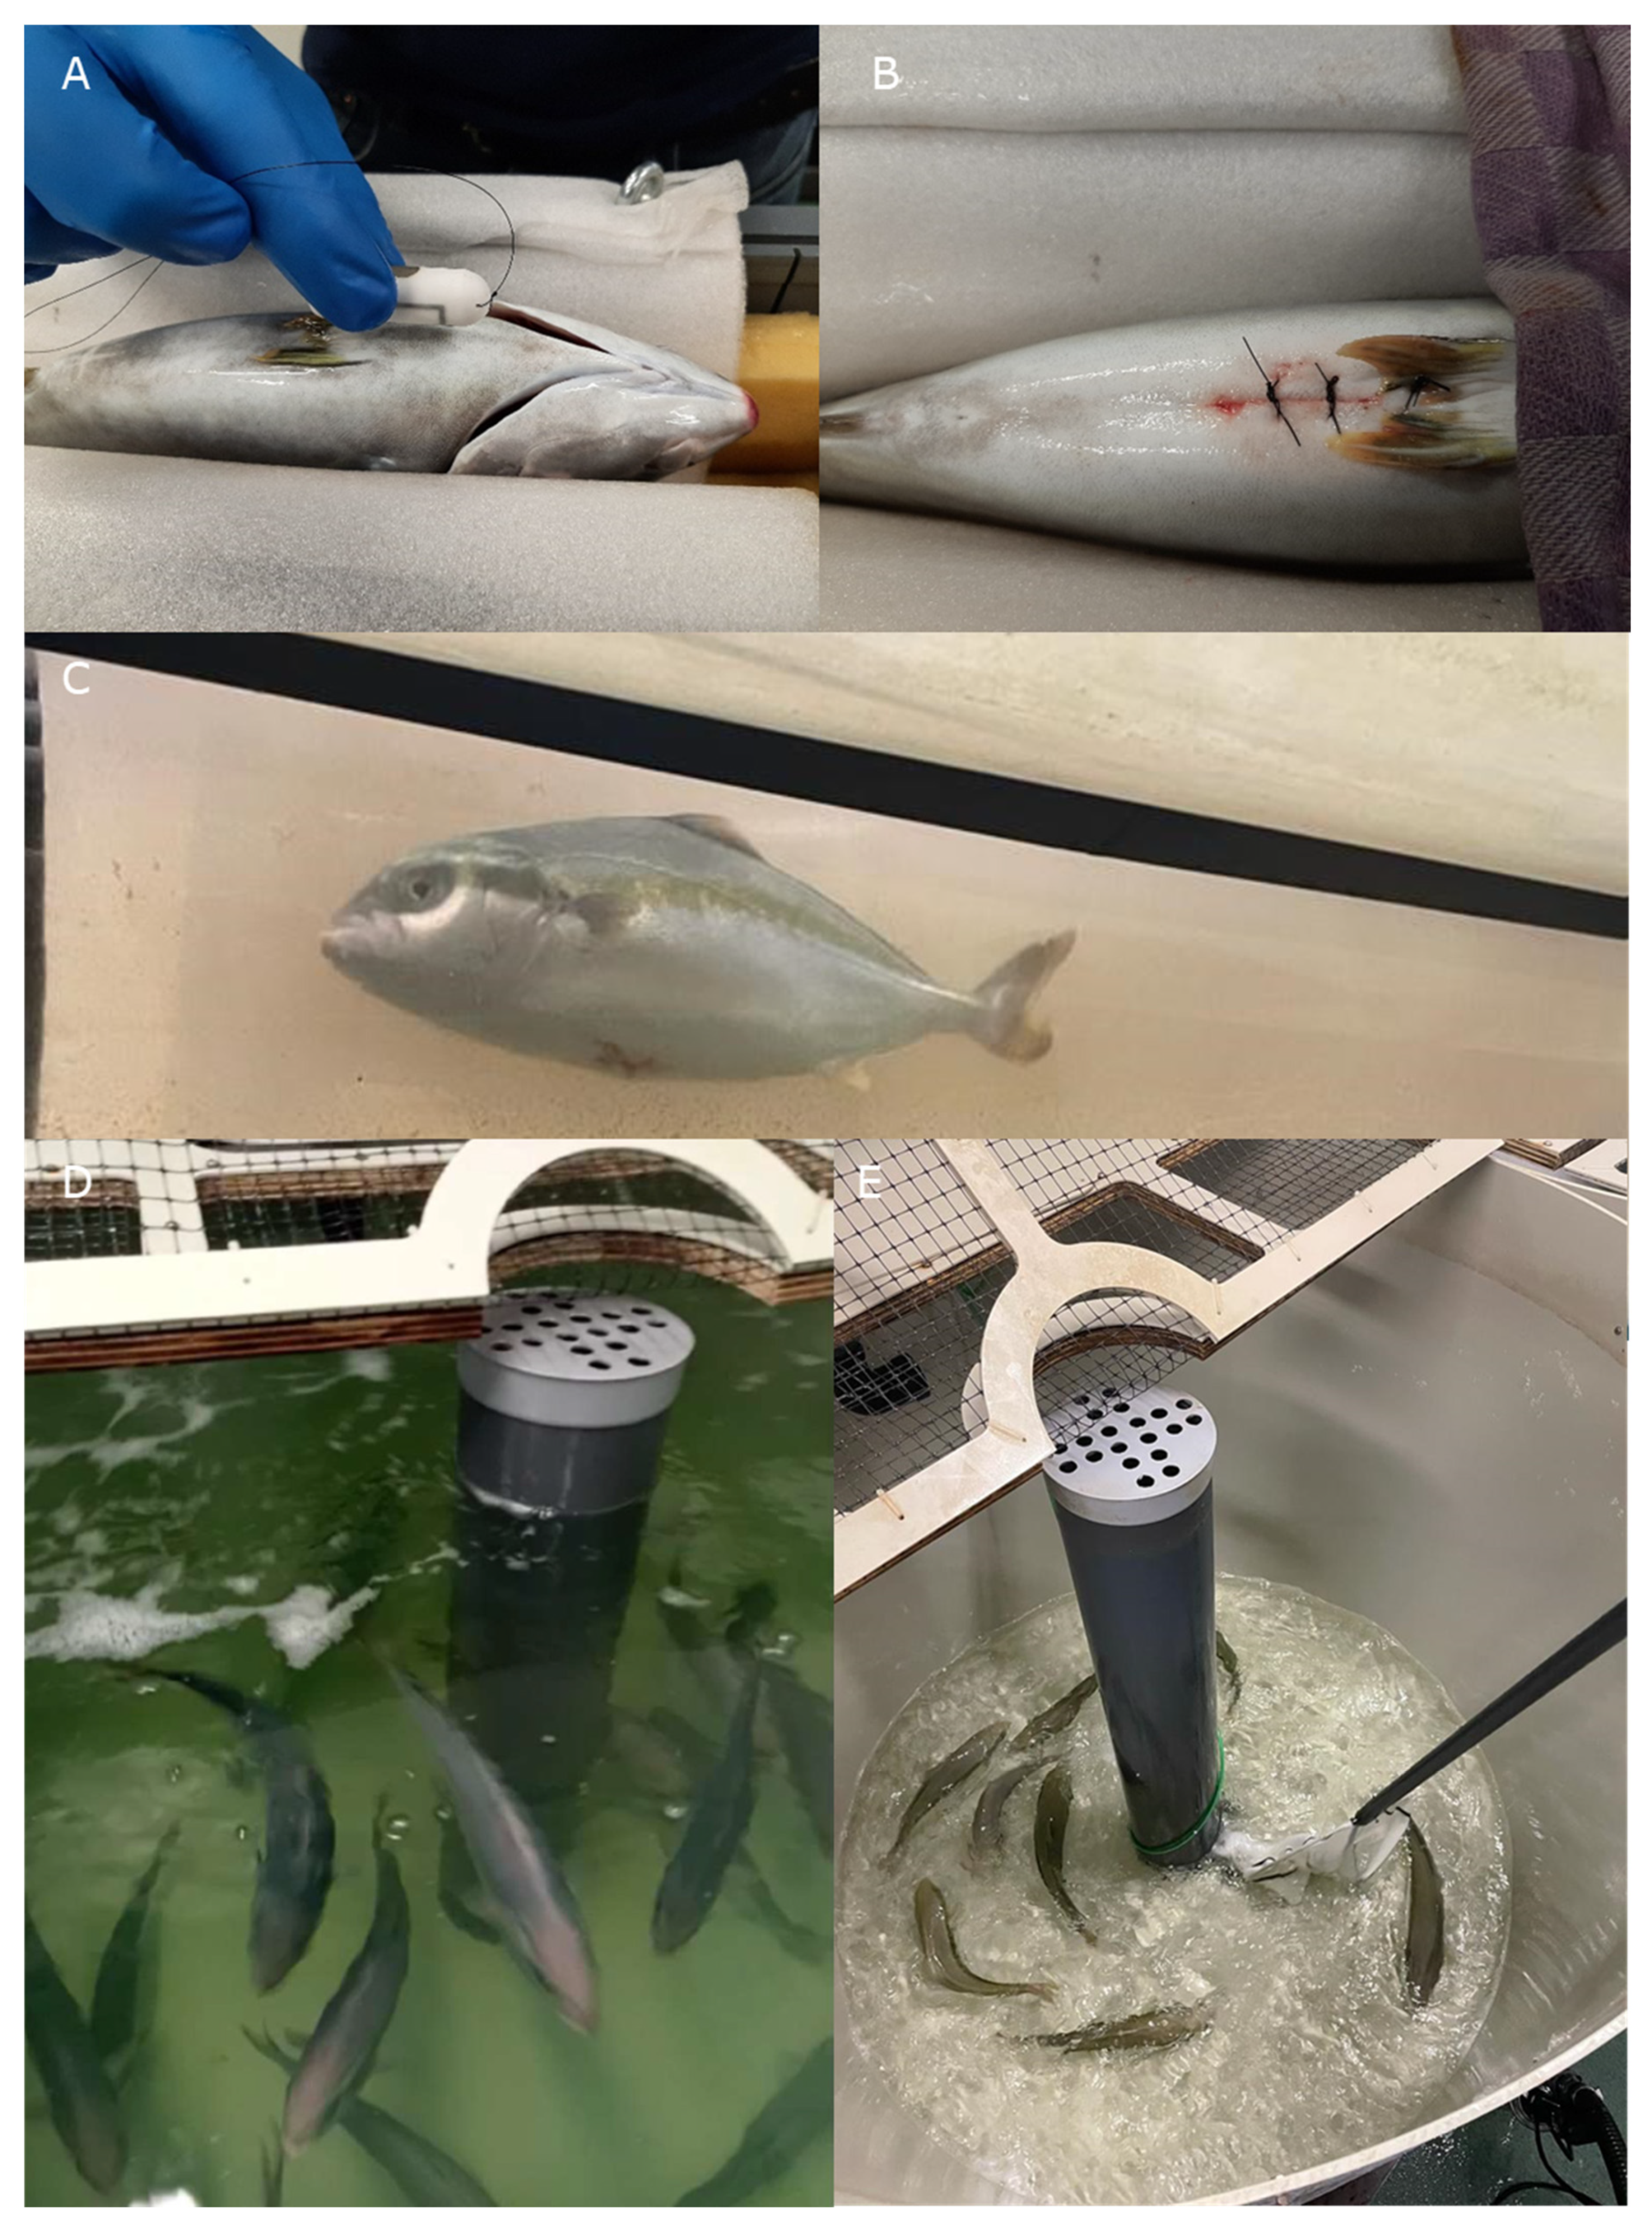
2.3. Heart Rate and Acceleration Loggers
2.4. Swim-Fitness Test and Respirometry
2.5. Locomotory Behavior during the Swim-Fitness Test
2.6. Stress Challenge Test and Cortisol
2.7. Ultrasound
2.8. Statistics
3. Results
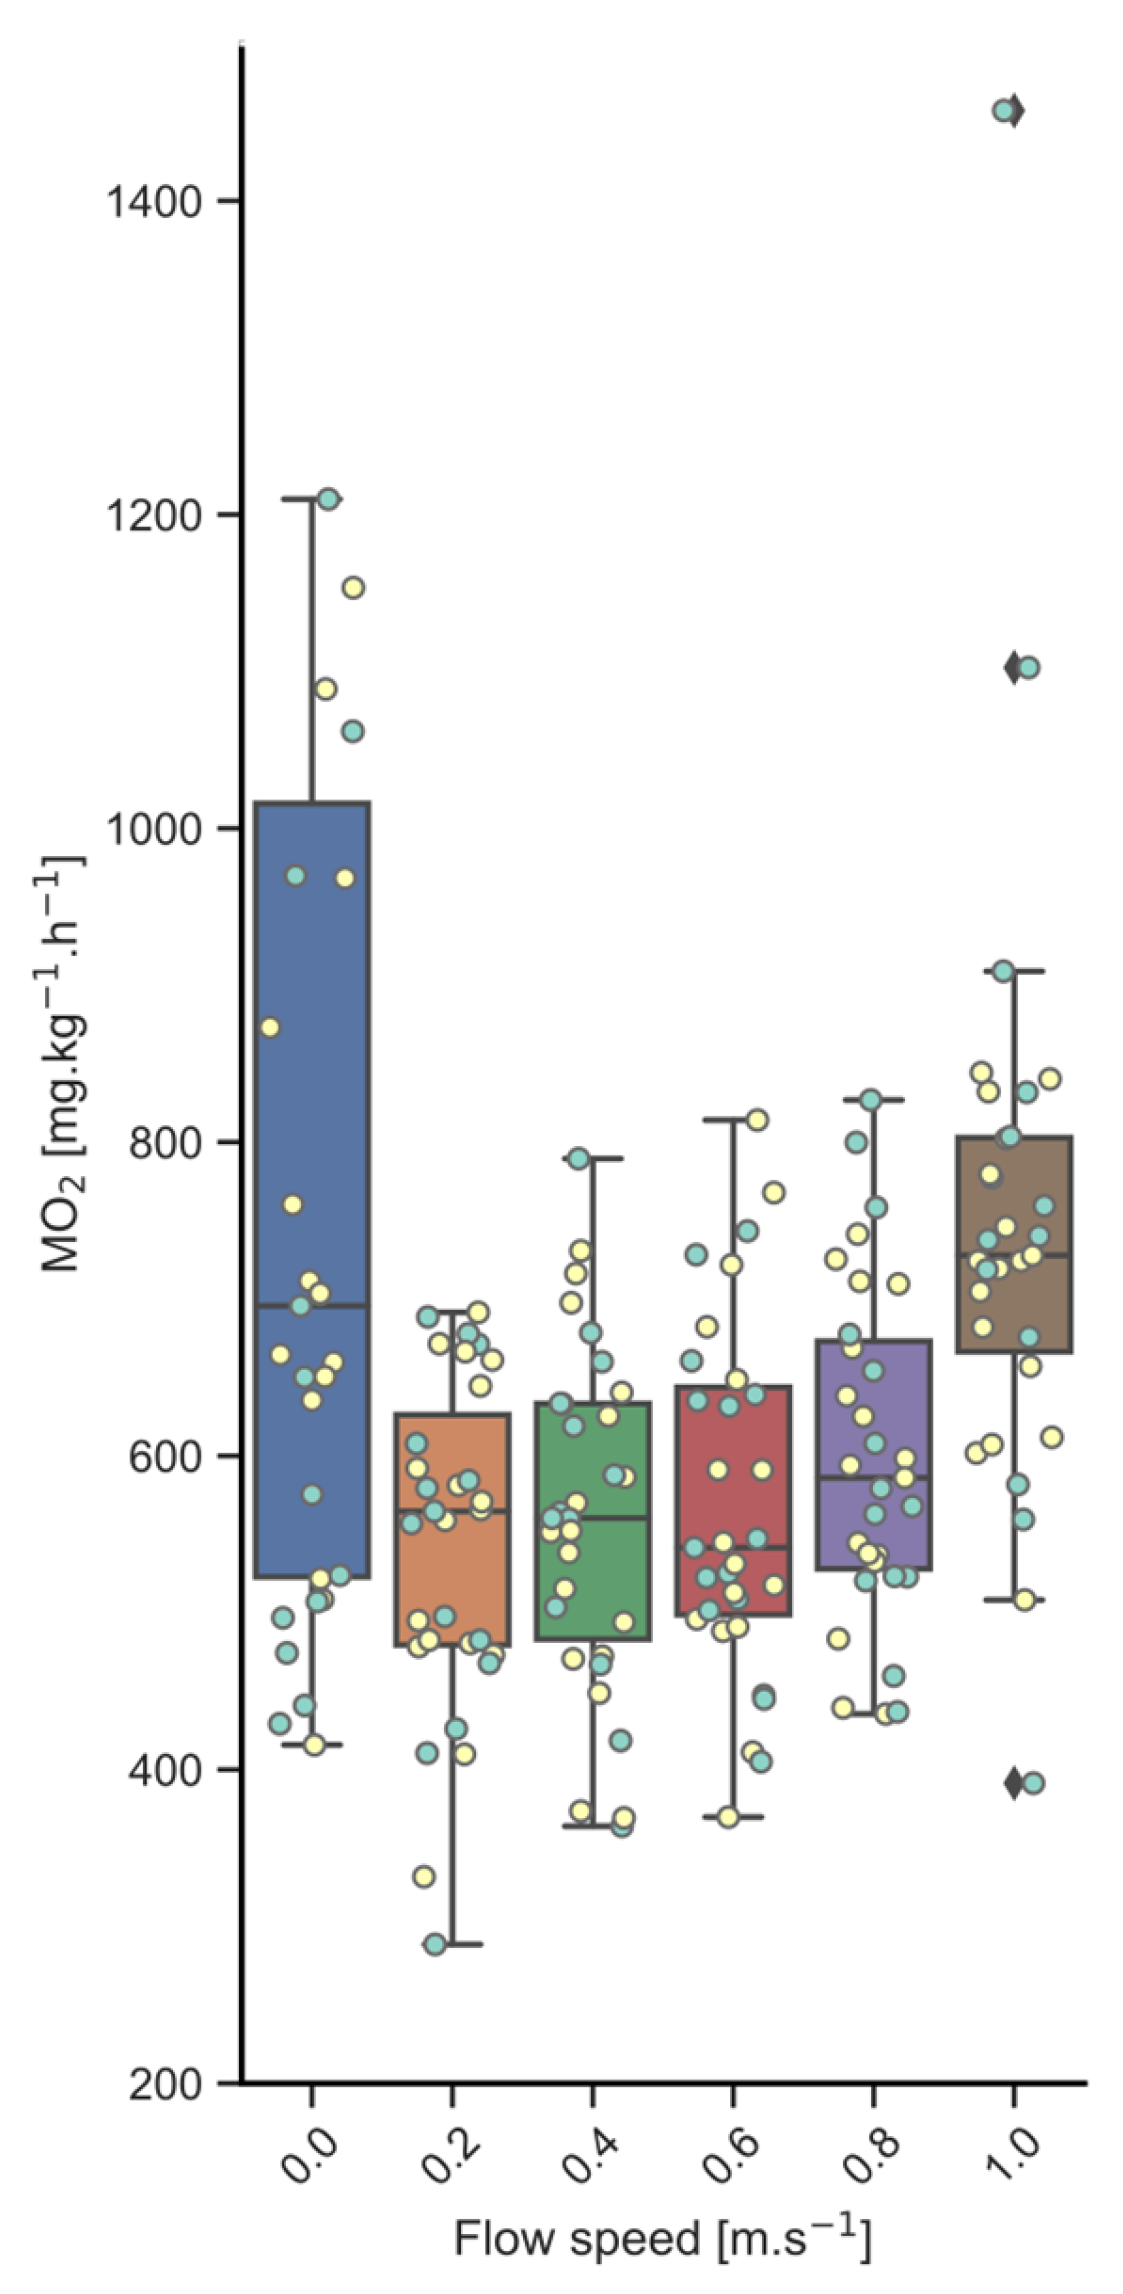
3.1. Swim-Fitness
- 550 ± 101 mg O2·kg−1·h−1 for implanted fish and 555 ± 93 mg O2·kg−1·h−1 for controls, when swimming at 0.2 m·s−1;
- 550 ± 109 mg O2·kg−1·h−1 for implanted fish and 573 ± 115 mg O2·kg−1·h−1 for controls, when swimming at 0.4 m·s−1;
- 566 ± 125 mg O2·kg−1·h−1 for implanted fish and 561 ± 92 mg O2·kg−1·h−1 for controls, when swimming at 0.6 m·s−1.
- At the higher swim speeds, MO2 levels increased up to:
- 595 ± 96 mg O2·kg−1·h−1 for implanted fish and 590 ± 108 mg O2·kg−1·h−1 for controls, when swimming at 0.8 m·s−1;
- 713 ± 94 mg O2·kg−1·h−1 for implanted fish and 786 ± 264 mg O2·kg−1·h−1 for controls, when swimming at 1.0 m·s−1.

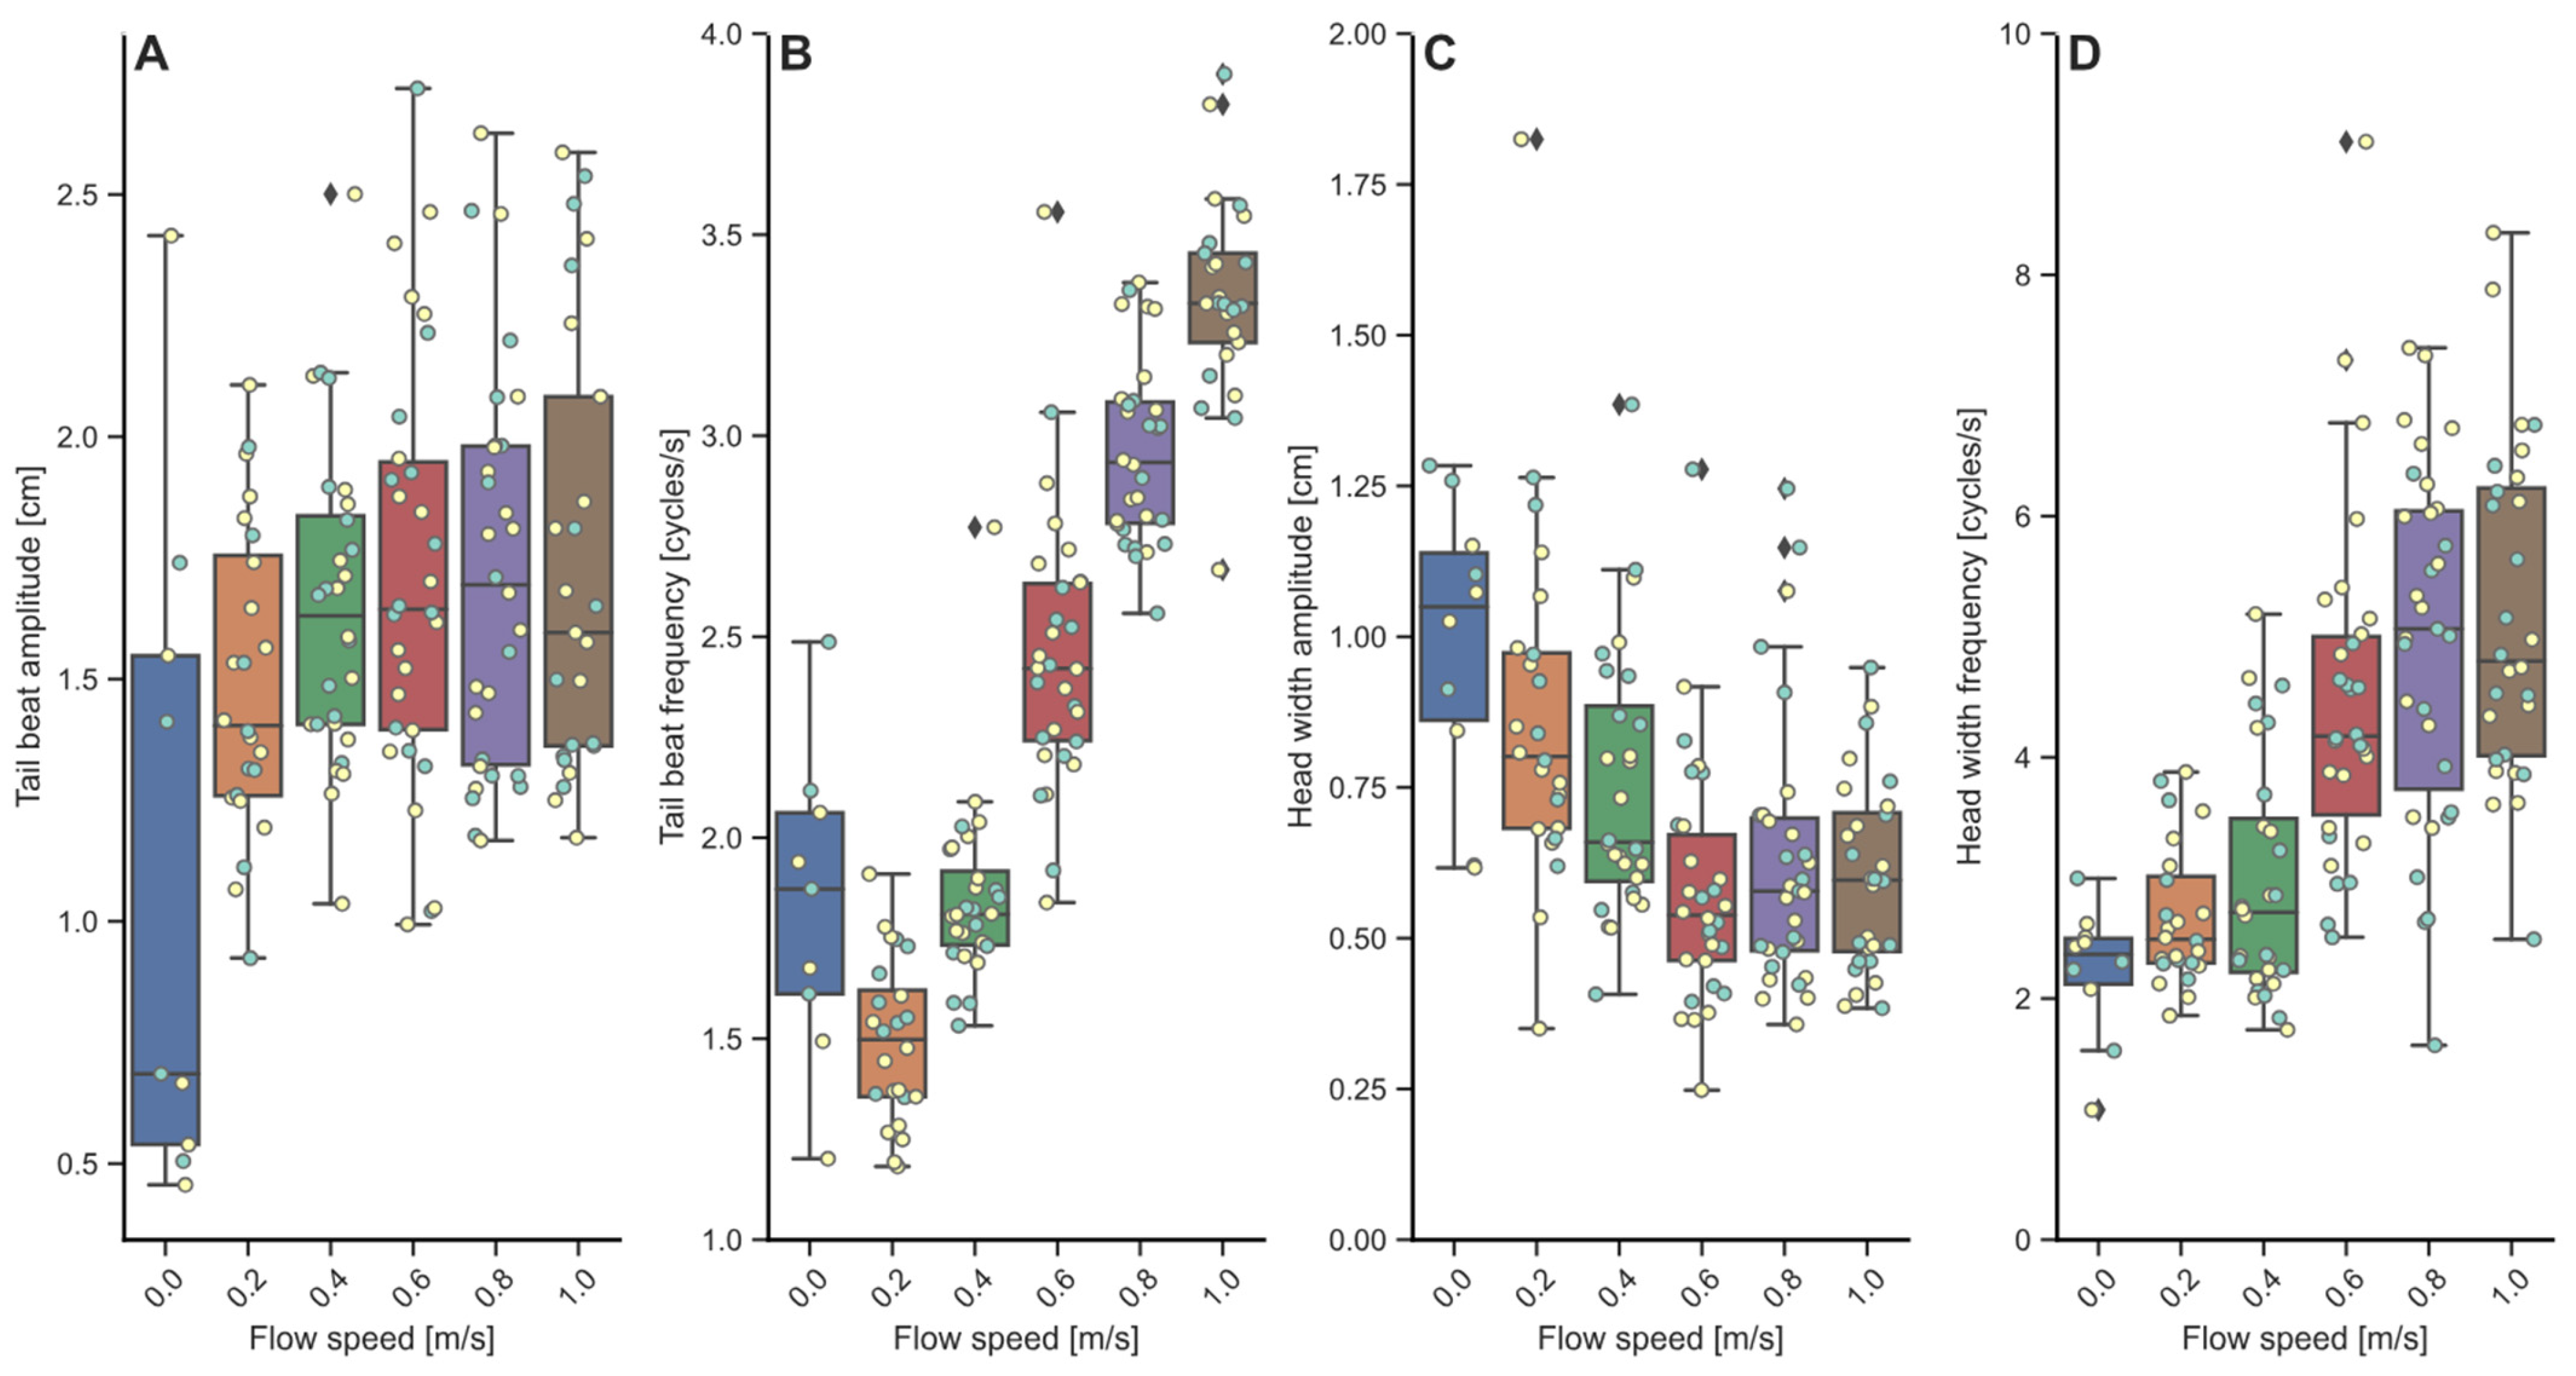
3.2. Locomotory Behavior
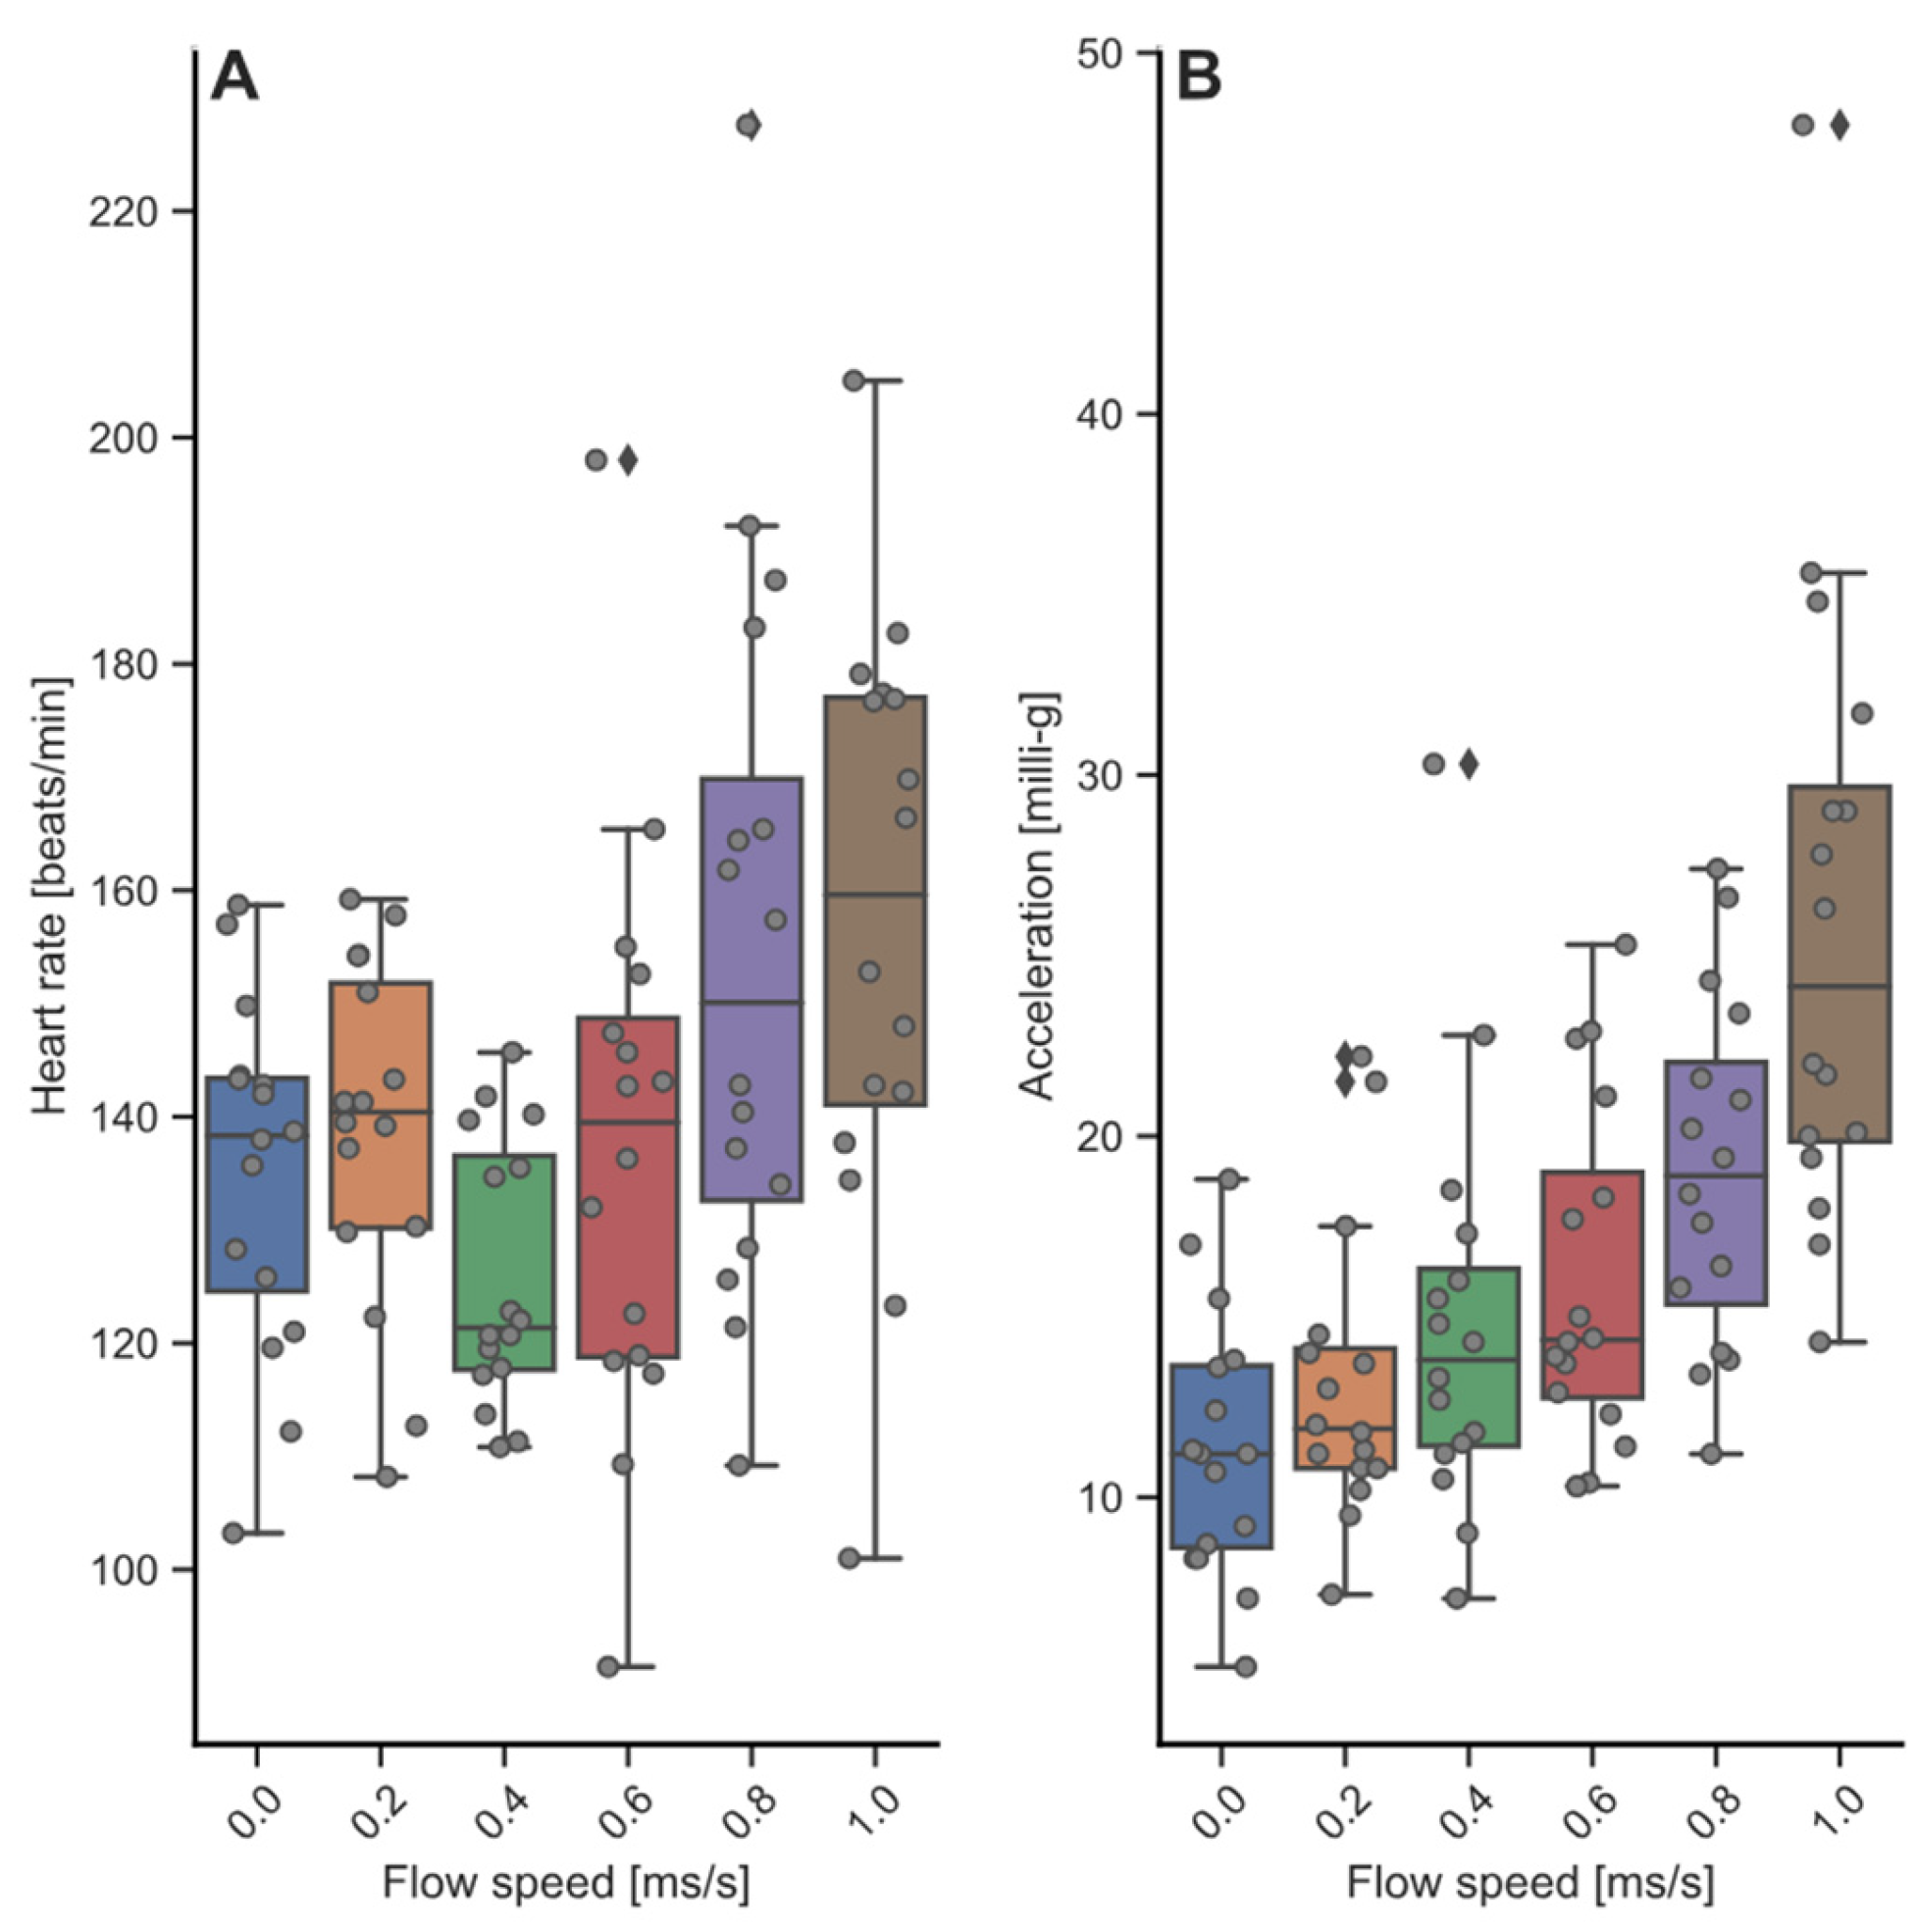
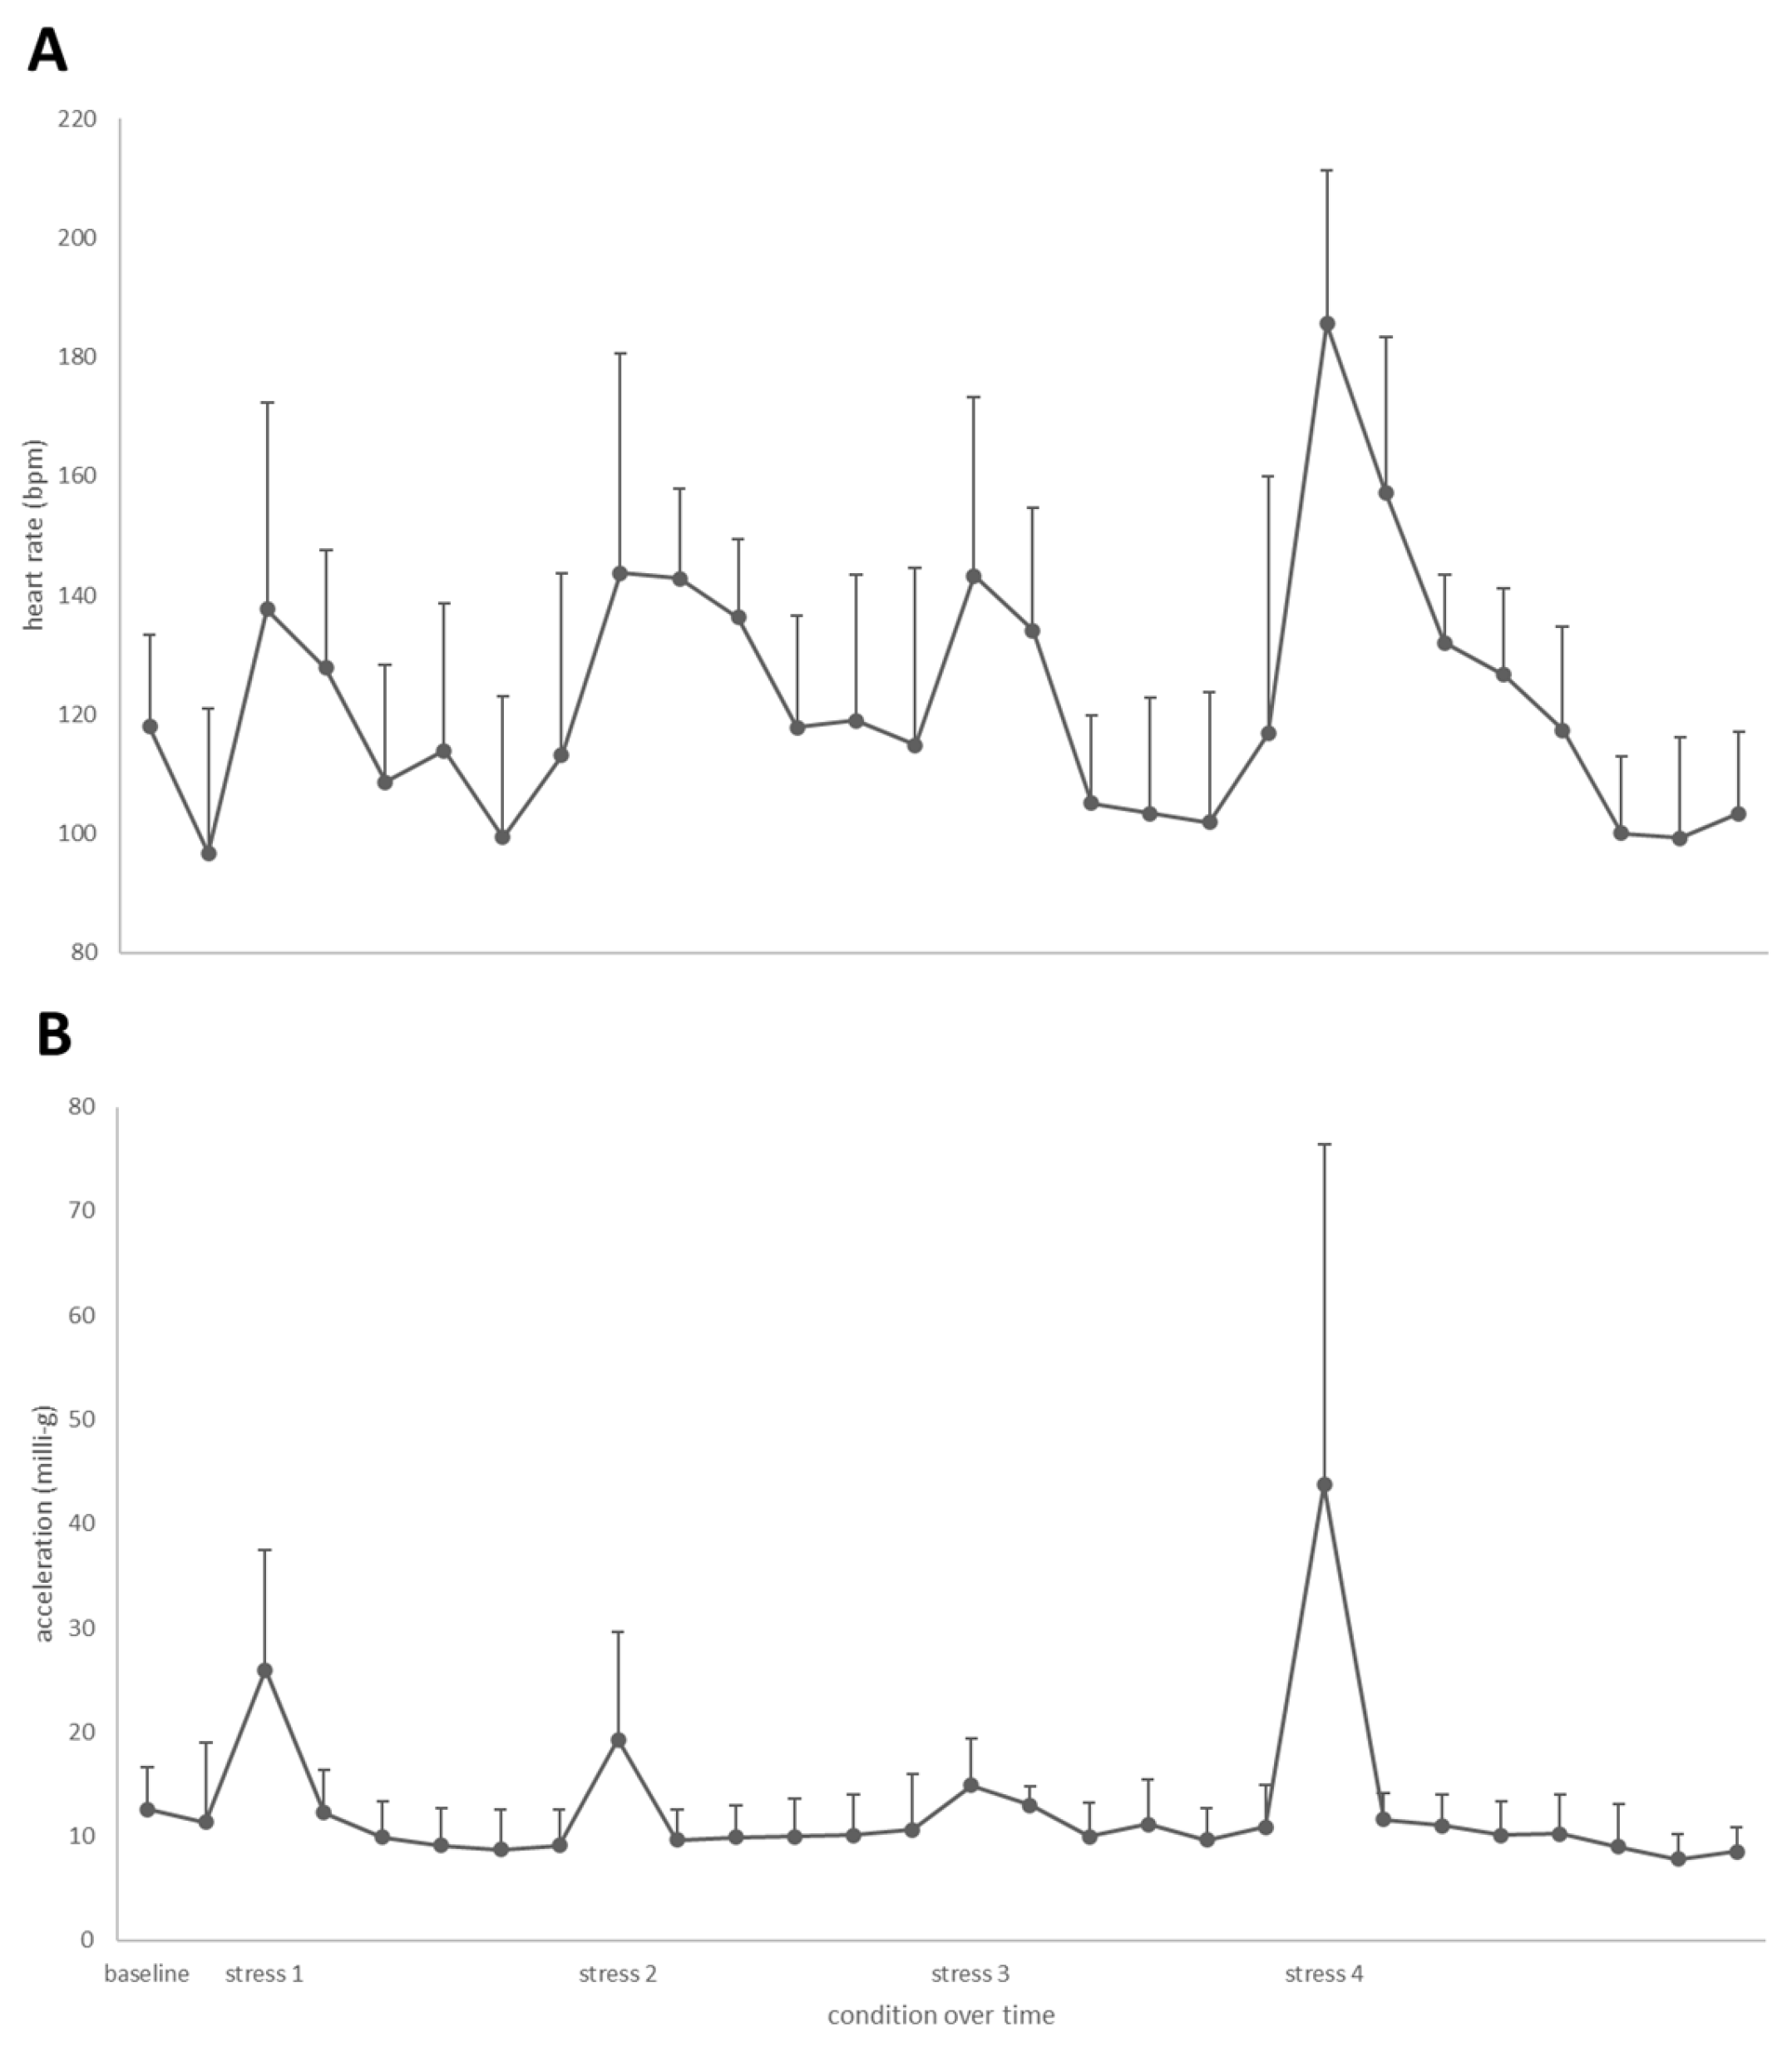
3.3. Heart Rate and Acceleration during Swim-Fitness and Stress Challenge Tests
3.4. Cortisol Concentrations during the Stepwise Stress Challenge Test
3.5. Correlations between Parameters during the Swim-Fitness Test
4. Discussion
5. Conclusions
Author Contributions
Funding
Institutional Review Board Statement
Informed Consent Statement
Data Availability Statement
Acknowledgments
Conflicts of Interest
References
- Gillanders, B.M.; Ferrell, D.J.; Andrew, N.L. Estimates of movement and life-history parameters of yellowtail kingfish (Seriola lalandi): How useful are data from a cooperative tagging programme? Mar. Freshw. Res. 2001, 52, 179–192. [Google Scholar] [CrossRef]
- Blanco Garcia, A.; Partridge, G.J.; Flik, G.; Roques, J.A.C.; Abbink, W. Ambient salinity and osmoregulation, energy metabolism and growth in juvenile yellowtail kingfish (Seriola lalandi Valenciennes 1833) in a recirculating aquaculture system. Aquac. Res. 2015, 46, 2789–2797. [Google Scholar] [CrossRef]
- Symonds, J.E.; Walker, S.P.; Pether, S.; Gublin, Y.; McQueen, D.; King, A.; Irvine, G.W.; Setiawan, A.N.; Forsythe, J.A.; Bruce, m. Developing yellowtail kingfish (Seriola lalandi) and hāpuku (Polyprion oxygeneios) for New Zealand aquaculture. N. Z. J. Mar. Fresh. 2014, 48, 371–384. [Google Scholar] [CrossRef]
- Palstra, A.P.; Planas, J.V. Fish under exercise. Fish Physiol. Biochem. 2011, 37, 259–272. [Google Scholar] [CrossRef]
- McKenzie, D.J.; Palstra, A.P.; Planas, J.; MacKenzie, S.; Bégout, M.-L.; Thorarensen, H.; Vandeputte, M.; Mes, D.; Rey, S.; De Boeck, G.; et al. Aerobic swimming in intensive aquaculture: Applications for production, mitigation and selection. Rev. Aquacult. 2020, 13, 138–155. [Google Scholar] [CrossRef]
- Palstra, A.P.; Mes, D.; Kusters, K.; Roques, J.A.C.; Flik, G.; Kloet, K.; Blonk, R.J.W. Forced sustained swimming exercise at optimal speed enhances growth of yellowtail kingfish (Seriola lalandi). Front. Physiol. 2015, 5, 506. [Google Scholar] [CrossRef]
- Palstra, A.; van Ginneken, V.; van den Thillart, G. Cost of transport and optimal swimming speeds in farmed and wild European silver eels (Anguilla anguilla). Comp. Biochem. Physiol. A 2008, 151, 37–44. [Google Scholar] [CrossRef]
- Palstra, A.P.; Tudorache, C.; Rovira, M.; Brittijn, B.; Burgerhout, E.; van den Thillart, G.E.E.J.M.; Spaink, H.P.; Planas, J.V. Establishing zebrafish (Danio rerio) as a novel exercise model: Swimming economy, swimming-enhanced growth and regulation of muscle growth marker gene expression. PLoS ONE 2010, 5, e14483. [Google Scholar] [CrossRef]
- Videler, J.J. Fish Swimming, 1st ed.; Chapman & Hall: London, UK, 1993. [Google Scholar]
- Arends, R.J.; Mancera, J.M.; Munoz, J.L.; Bonga, S.W.; Flik, G. The stress response of the gilthead sea bream (Sparus aurata L.) to air exposure and confinement. J. Endocrinol. 1999, 163, 149–157. [Google Scholar] [CrossRef]
- Ganga, R.; Montero, D.; Gordon Bell, J.; Atalah, E.; Ganuza, E.; Vega-Orellana, O.; Tort, L.; Acerete, L.; Afonso, J.M.; Benitez-Sanatana, T.; et al. Stress response in sea bream (Sparus aurata) held under crowded conditions and fed diets containing linseed and/or soybean oil. Aquaculture 2011, 311, 215–223. [Google Scholar] [CrossRef]
- Einarsdóttir, I.E.; Nilssen, K.J. Stress responses of Atlantic salmon (Salmo salar L.) elicited by water level reduction in rearing tanks. Fish Physiol. Biochem. 1996, 15, 395–400. [Google Scholar] [CrossRef]
- Madaro, A.; Olsen, R.E.; Kristiansen, T.S.; Ebbesson, L.O.; Flik, G.; Gorissen, M. A comparative study of the response to repeated chasing stress in Atlantic salmon (Salmo salar L.) parr and post-smolts. Comp. Biochem. Physiol. A 2016, 192, 7–16. [Google Scholar] [CrossRef]
- Svendsen, E.; Føre, M.; Økland, F.; Gräns, A.; Hedger, R.D.; Alfredsen, J.A.; Uglem, I.; Rosten, C.M.; Frank, K.; Erikson, U.; et al. Heart rate and swimming activity as stress indicators for Atlantic salmon (Salmo salar). Aquaculture 2021, 531, 735804. [Google Scholar] [CrossRef]
- Wright, R.M.; Piper, A.T.; Aarestrup, K.; Azevedo, J.M.; Cowan, G.; Don, A.; Gollock, M.; Rodriguez Ramallo, S.; Velterop, R.; Walker, A.; et al. First direct evidence of adult European eels migrating to their breeding place in the Sargasso Sea. Sci. Rep. 2022, 12, 15362. [Google Scholar] [CrossRef]
- Birnie-Gauvin, K.; Thorstad, E.B.; Aarestrup, K. Overlooked aspects of the Salmo salar and Salmo trutta lifecycles. Rev. Fish Biol. Fisher. 2019, 29, 749–766. [Google Scholar] [CrossRef]
- Brevé, N.W.; Vis, H.; Houben, B.; Breukelaar, A.; Acolas, M.L. Outmigration pathways of stocked juvenile European sturgeon (Acipenser sturio L., 1758) in the Lower Rhine River, as revealed by telemetry. J. Appl. Ichthyol. 2019, 35, 61–68. [Google Scholar] [CrossRef]
- Block, B.A.; Whitlock, R.; Schallert, R.J.; Wilson, S.; Stokesbury, M.J.; Castleton, M.; Boustany, A. Estimating natural mortality of Atlantic bluefin tuna using acoustic telemetry. Sci. Rep. 2019, 9, 4918. [Google Scholar] [CrossRef]
- Araujo, G.; Agustines, A.; Tracey, B.; Snow, S.; Labaja, J.; Ponzo, A. Photo-ID and telemetry highlight a global whale shark hotspot in Palawan, Philippines. Sci. Rep. 2019, 9, 17209. [Google Scholar] [CrossRef]
- Kolarevic, J.; Aas-Hansen, Ø.; Espmark, Å.; Baeverfjord, G.; Terjesen, B.F.; Damsgård, B. The use of acoustic acceleration transmitter tags for monitoring of Atlantic salmon swimming activity in recirculating aquaculture systems (RAS). Aquacult. Eng. 2016, 72, 30–39. [Google Scholar] [CrossRef]
- Føre, M.; Frank, K.; Norton, T.; Svendsen, E.; Alfredsen, J.A.; Dempster, T.; Eguiraun, H.; Watson, W.; Stahl, A.; Sunde, L.M.; et al. Precision fish farming: A new framework to improve production in aquaculture. Biosyst. Eng. 2018, 173, 176–193. [Google Scholar] [CrossRef]
- Muñoz, L.; Aspillaga, E.; Palmer, M.; Saraiva, J.L.; Arechavala-Lopez, P. Acoustic telemetry: A tool to monitor fish swimming behavior in sea-cage aquaculture. Front. Mar. Sci. 2020, 7, 645. [Google Scholar] [CrossRef]
- Palstra, A.P.; Arechavala-Lopez, P.; Xue, Y.; Roque, A. Accelerometry of seabream in a sea-cage: Is acceleration a good proxy for activity? Front. Mar. Sci. 2021, 8, 144. [Google Scholar] [CrossRef]
- Arechavala-Lopez, P.; Lankheet, M.; Diaz-Gil, C.; Abbink, W.; Palstra, A.P. Swimming activity of gilthead seabream (Sparus aurata) in swim-tunnels: Acoustic accelerometry, oxygen consumption and body motion. Front. Anim. Sci. 2021, 2, 679848. [Google Scholar] [CrossRef]
- Martos-Sitcha, J.A.; Sosa, J.; Ramos-Valido, D.; Bravo, F.J.; Carmona-Duarte, C.; Gomes, H.L.; Calduch-Giner, J.À.; Cabruja, E.; Vega, A.; Ferrer, M.Á.; et al. Ultra-low power sensor devices for monitoring physical activity and respiratory frequency in farmed fish. Front. Physiol. 2019, 10, 667. [Google Scholar] [CrossRef]
- Endo, H.; Yonemori, Y.; Musiya, K.; Maita, M.; Shibuya, T.; Ren, H.; Hayashi, T.; Mitsubayashi, K. A needle-type optical enzyme sensor system for determining glucose levels in fish blood. Anal. Chim. Acta 2006, 573, 117–124. [Google Scholar] [CrossRef]
- Wu, H.; Shinoda, R.; Murata, M.; Matsumoto, H.; Ohnuki, H.; Endo, H. Real-time fish stress visualization came true: A novel multi-stage color-switching wireless biosensor system. Biosens. Bioelectron. 2019, 130, 360–366. [Google Scholar] [CrossRef]
- Svendsen, E.; Føre, M.; Randeberg, L.L.; Olsen, R.E.; Finstad, B.; Remen, M.; Bloecher, N.; Alfredsen, J.A. ECG augmented pulse oximetry in Atlantic salmon (Salmo salar)—A pilot study. Comput. Electron. Agr. 2023, 212, 108081. [Google Scholar] [CrossRef]
- Bjarnason, Á.; Gunnarsson, A.; Árnason, T.; Oddgeirsson, M.; Sigmarsson, A.B.; Gunnarsson, Á. Validation of ECG-derived heart rate recordings in Atlantic cod (Gadus morhua L.) with an implantable data logging system. Anim. Biotelemetry 2019, 7, 1–10. [Google Scholar] [CrossRef]
- Rouyer, T.; Bonhommeau, S.; Bernard, S.; Kerzerho, V.; Derridj, O.; Bjarnason, Á.; Allal, H.; Steffensen, J.F.; Deguara, S.; Wendling, B.; et al. A novel protocol for rapid deployment of heart rate data storage tags in Atlantic bluefin tuna Thunnus thynnus reveals cardiac responses to temperature and feeding. J. Fish Biol. 2023, 100, 1–11. [Google Scholar] [CrossRef]
- Van den Thillart, G.E.E.J.M.; Van Ginneken, V.; Körner, F.; Heijmans, R.; Van der Linden, R.; Gluvers, A. Endurance swimming of European eel. J. Fish Biol. 2004, 65, 312–318. [Google Scholar] [CrossRef]
- Bell, W.H.; Terhune, L.D.B. Water tunnel design for fisheries research. Fish. Res. Board. Can. Tech. Rep. 1970, 195, 1–69. [Google Scholar]
- Bates, D.; Mächler, M.; Bolker, B.M.; Walker, S.C. Fitting linear mixed-effects models using lme4. J. Stat. Softw. 2015, 67, 1–48. [Google Scholar] [CrossRef]
- Kuznetsova, A.; Brockhoff, P.B.; Christensen, R.H.B. lmerTest Package: Tests in Linear Mixed Effects Models. J. Stat. Softw. 2017, 82, 1–26. [Google Scholar] [CrossRef]
- Herbert, N.A.; Kadri, S.; Huntingford, F.A. A moving light stimulus elicits a sustained swimming response in farmed Atlantic salmon, Salmo salar L. Fish Physiol. Biochem. 2013, 37, 317–325. [Google Scholar] [CrossRef]
- Clark, T.D.; Seymour, R.S. Cardiorespiratory physiology and swimming energetics of a high-energy-demand teleost, the yellowtail kingfish (Seriola lalandi). J. Exp. Biol. 2006, 209, 3940–3951. [Google Scholar] [CrossRef]
- Brett, J.R. The metabolic demand for oxygen in fish, particularly salmonids, and a comparison with other vertebrates. Resp. Physiol. 1972, 14, 151–170. [Google Scholar] [CrossRef]
- Brill, R.W.; Bushnell, P.G. Metabolic and cardiac scope of high energy demand teleosts-the tunas. Can. J. Zool. 1991, 69, 2002–2009. [Google Scholar] [CrossRef]
- Brill, R.W.; Bushnell, P.G. The cardiovascular system of tunas. Fish Physiol. 2001, 19, 79–120. [Google Scholar]
- Lillywhite, H.B.; Zippel, K.C.; Farrell, A.P. Resting and maximal heart rates in ectothermic vertebrates. Comp. Biochem. Physiol. A 1999, 124, 369–382. [Google Scholar] [CrossRef]
- Farrell, A.P. Features heightening cardiovascular performance in fishes, with special reference to tunas. Comp. Biochem. Physiol. A 1996, 113, 61–67. [Google Scholar] [CrossRef]
- Bushnell, P.G.; Brill, R.W. Oxygen transport and cardiovascular responses in skipjack tuna (Kutsuwonas pelamis) and yellowfin tuna (Thunnus albacores) exposed to acute hypoxia. J. Comp. Physiol. 1992, B162, 131–143. [Google Scholar] [CrossRef]
- Morgenroth, D.; McArley, T.; Danielo, Q.; Harford, A.; Hickey, A.J.; Khan, J.; Sandblom, E. Kingfish (Seriola lalandi) adjust to low salinity with only subtle effects to cardiorespiratory and growth performance. Aquaculture 2022, 556, 738268. [Google Scholar] [CrossRef]
- Sandrelli, R.M.; Gamperl, A.K. The upper temperature and hypoxia limits of Atlantic salmon (Salmo salar) depend greatly on the method utilized. J. Exp. Biol. 2023, 226, jeb246227. [Google Scholar] [CrossRef]
- Mignucci, A.; Bourjea, J.; Forget, F.; Allal, H.; Dutto, G.; Gasset, E.; McKenzie, D.J. Cardiac and behavioural responses to hypoxia and warming in free-swimming gilthead seabream, Sparus aurata. J. Exp. Biol. 2021, 224, jeb242397. [Google Scholar] [CrossRef]
- Rantin, F.T.; Gesser, H.; Kalinin, A.L.; Guerra, C.D.R.; De Freitas, J.C.; Driedzic, W.R. Heart performance, Ca2+ regulation and energy metabolism at high temperatures in Bathygobius soporator, a tropical marine teleost. J. Therm. Biol. 1998, 23, 31–39. [Google Scholar] [CrossRef]
- Korsmeyer, K.E.; Lai, N.C.; Shadwick, R.E.; Graham, J.B. Heart rate and stroke volume contributions to cardiac output in swimming yellowfin tuna: Response to exercise and temperature. J. Exp. Biol. 1997, 200, 1975–1986. [Google Scholar] [CrossRef]
- Yousaf, M.N.; Røn, Ø.; Plebaniak Hagen, P.; McGurk, C. Monitoring fish welfare using heart rate bio-loggers in farmed Atlantic salmon (Salmo salar L.): An insight into the surgical recovery. Aquaculture 2022, 555, 738211. [Google Scholar] [CrossRef]
- Agbeti, W.E.K.; Palstra, A.P. Heart Rate and Acceleration Logging during Swim-Fitness and Stress Challenge Tests in Atlantic Salmon Salmo salar; Wageningen University and Research: Wageningen, The Netherlands, 2024; manuscript in preparation. [Google Scholar]
- Tomàs, J.; Palstra, A.P. Heart Rate and Acceleration Logging during Swim-Fitness and Stress Challenge Tests in European Seabass Dicentrarchus labrax; Wageningen University and Research: Wageningen, The Netherlands, 2024; manuscript in preparation. [Google Scholar]
- Brønstad, A. Good Anesthesia Practice for Fish and Other Aquatics. Biology 2022, 11, 1355. [Google Scholar] [CrossRef]
- Cotter, P.A.; Rodnick, K.J. Differential effects of anesthetics on electrical properties of the rainbow trout (Oncorhynchus mykiss) heart. Comp. Biochem. Physiol. A 2006, 145, 158–165. [Google Scholar] [CrossRef]
- Randall, D.J. Effect of an anaesthetic on the heart and respiration of teleost fish. Nature 1962, 195, 506. [Google Scholar] [CrossRef]
- Hill, J.V.; Davison, W.; Forster, M.E. The effects of fish anaesthetics (MS222, metomidate and AQUI-S) on heart ventricle, the cardiac vagus and branchial vessels from Chinook salmon (Oncorhynchus tshawytscha). Fish Physiol. Biochem. 2002, 27, 19–28. [Google Scholar] [CrossRef]
- Sadoul, B.; Geffroy, B. Measuring cortisol, the major stress hormone in fishes. J. Fish Biol. 2019, 94, 540–555. [Google Scholar] [CrossRef]
- Clark, T.D.; Sandblom, E.; Hinch, S.G.; Patterson, D.A.; Frappell, P.B.; Farrell, A.P. Simultaneous biologging of heart rate and acceleration, and their relationships with energy expenditure in free-swimming sockeye salmon (Oncorhynchus nerka). J. Comp. Physiol. B 2010, 180, 673–684. [Google Scholar] [CrossRef]
- Lucas, M.C. Heart rate as an indicator of metabolic rate and activity in adult Atlantic salmon, Salmo salar. J. Fish Biol. 1994, 44, 889–903. [Google Scholar] [CrossRef]
- Thorarensen, H.; Gallaugher, P.E.; Farrell, A.P. The limitations of heart rate as a predictor of metabolic rate in fish. J. Fish Biol. 1996, 49, 226–236. [Google Scholar] [CrossRef]
- Farrell, A.P.; Eliason, E.J.; Sandblom, E.; Clark, T.D. Fish cardiorespiratory physiology in an era of climate change. Can. J. Zool. 2009, 87, 835–851. [Google Scholar] [CrossRef]
- Perry, S.; Jonz, M.; Gilmour, K. Oxygen sensing and the hypoxic ventilatory response. Fish Physiol. 2009, 27, 193–253. [Google Scholar]
- Joyce, W.; Wang, T. Regulation of heart rate in vertebrates during hypoxia: A comparative overview. Acta Physiol. 2022, 234, e13779. [Google Scholar] [CrossRef]
- Morgenroth, D.; Kvaestad, B.; Økland, F.; Finstad, B.; Olsen, R.-E.; Svendsen, E.; Rosten, C.; Axelsson, M.; Bloecher, N.; Føre, M.; et al. Under the sea: How can we use heart rate and accelerometers to remotely assess fish welfare in salmon aquaculture? Aquaculture 2024, 579, 740144. [Google Scholar] [CrossRef]
- Cooke, S.J.; Brownscombe, J.W.; Raby, G.D.; Broell, F.; Hinch, S.G.; Clark, T.D.; Semmens, J.M. Remote bioenergetics measurements in wild fish: Opportunities and challenges. Comp. Biochem. Physiol. A 2016, 202, 23–37. [Google Scholar] [CrossRef]
- Sakaji, H.; Hamada, K.; Naito, Y. Identifying spawning events of greater amberjack using accelerometers. Mar. Biol. Res. 2018, 14, 637–641. [Google Scholar] [CrossRef]
- Clarke, T.M.; Whitmarsh, S.K.; Hounslow, J.L.; Gleiss, A.C.; Payne, N.L.; Huveneers, C. Using tri-axial accelerometer loggers to identify spawning behaviours of large pelagic fish. Movement Ecol. 2021, 9, 26. [Google Scholar] [CrossRef]
- Clarke, T.M.; Whitmarsh, S.K.; Jaine, F.R.; Taylor, M.D.; Brodie, S.; Payne, N.L.; Butcher, P.A.; Broadhurst, M.K.; Davey, J.; Huveneers, C. Environmental drivers of yellowtail kingfish, Seriola lalandi, activity inferred through a continental acoustic tracking network. Aquatic Conserv. Mar. Freshw. Ecosyst. 2023, 34, e4019. [Google Scholar] [CrossRef]


| Swimming Speed (m·s−1) | |||||||
|---|---|---|---|---|---|---|---|
| 0 | 0.2 | 0.4 | 0.6 | 0.8 | 1 | ||
| ACC | TBA | −0.960 | |||||
| ACC | TBF | 0.981 | |||||
| SL | HR | 0.615 | |||||
| HWA | HWF | −0.582 | −0.546 | −0.679 | −0.670 | −0.550 | |
| TL | TBF | −0.382 | −0.604 | ||||
| SL | TBA | 0.386 | 0.447 | 0.416 | |||
| MO2 | TBF | 0.502 | |||||
| HR | TBF | 0.716 | |||||
| MO2 | HR | 0.810 | 0.606 | ||||
| TL | TBA | 0.431 | 0.496 | ||||
| SL | TBF | −0.621 | |||||
| BW | TBF | −0.543 | |||||
| BW | TBA | 0.367 | 0.437 | ||||
| BW | HR | −0.529 | |||||
| ACC | HWA | −0.662 | |||||
Disclaimer/Publisher’s Note: The statements, opinions and data contained in all publications are solely those of the individual author(s) and contributor(s) and not of MDPI and/or the editor(s). MDPI and/or the editor(s) disclaim responsibility for any injury to people or property resulting from any ideas, methods, instructions or products referred to in the content. |
© 2024 by the authors. Licensee MDPI, Basel, Switzerland. This article is an open access article distributed under the terms and conditions of the Creative Commons Attribution (CC BY) license (https://creativecommons.org/licenses/by/4.0/).
Share and Cite
Palstra, A.P.; Abbink, W.; Agbeti, W.E.K.; Kruijt, L.; Jéhannet, P.; Lankheet, M.J. Heart Rate and Acceleration Dynamics during Swim-Fitness and Stress Challenge Tests in Yellowtail Kingfish (Seriola lalandi). Biology 2024, 13, 189. https://doi.org/10.3390/biology13030189
Palstra AP, Abbink W, Agbeti WEK, Kruijt L, Jéhannet P, Lankheet MJ. Heart Rate and Acceleration Dynamics during Swim-Fitness and Stress Challenge Tests in Yellowtail Kingfish (Seriola lalandi). Biology. 2024; 13(3):189. https://doi.org/10.3390/biology13030189
Chicago/Turabian StylePalstra, Arjan P., Wout Abbink, Wisdom E. K. Agbeti, Leo Kruijt, Pauline Jéhannet, and Martin J. Lankheet. 2024. "Heart Rate and Acceleration Dynamics during Swim-Fitness and Stress Challenge Tests in Yellowtail Kingfish (Seriola lalandi)" Biology 13, no. 3: 189. https://doi.org/10.3390/biology13030189