

A Study of Alternative TrkA Splicing Identifies TrkAIII as a Novel Potentially Targetable Participant in PitNET Progression
 , , , , , , , , , , , , , and
Abstract
:Simple Summary
Abstract
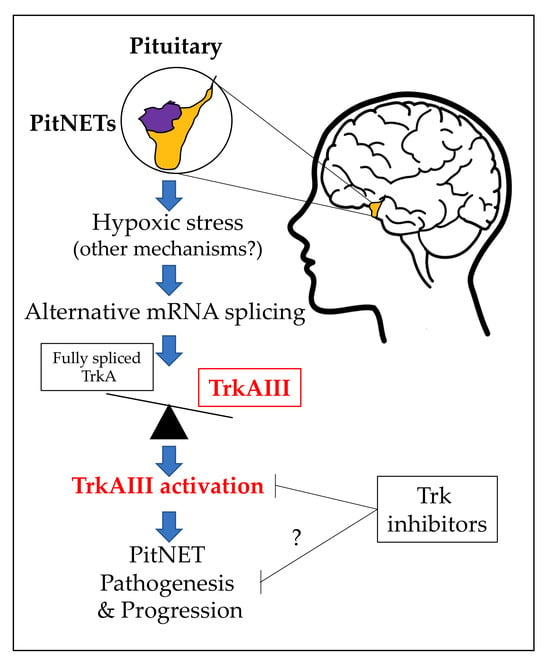
1. Introduction
2. Materials and Methods
2.1. Patients and Tumors
2.2. Antibodies and Reagents
2.3. RNA Extraction and Reverse Transcriptase Polymerase Chain Reaction
2.4. Tumor DNA Purification
2.5. DNA Sequencing
2.6. Indirect IF
2.7. Statistical Analysis
3. Results
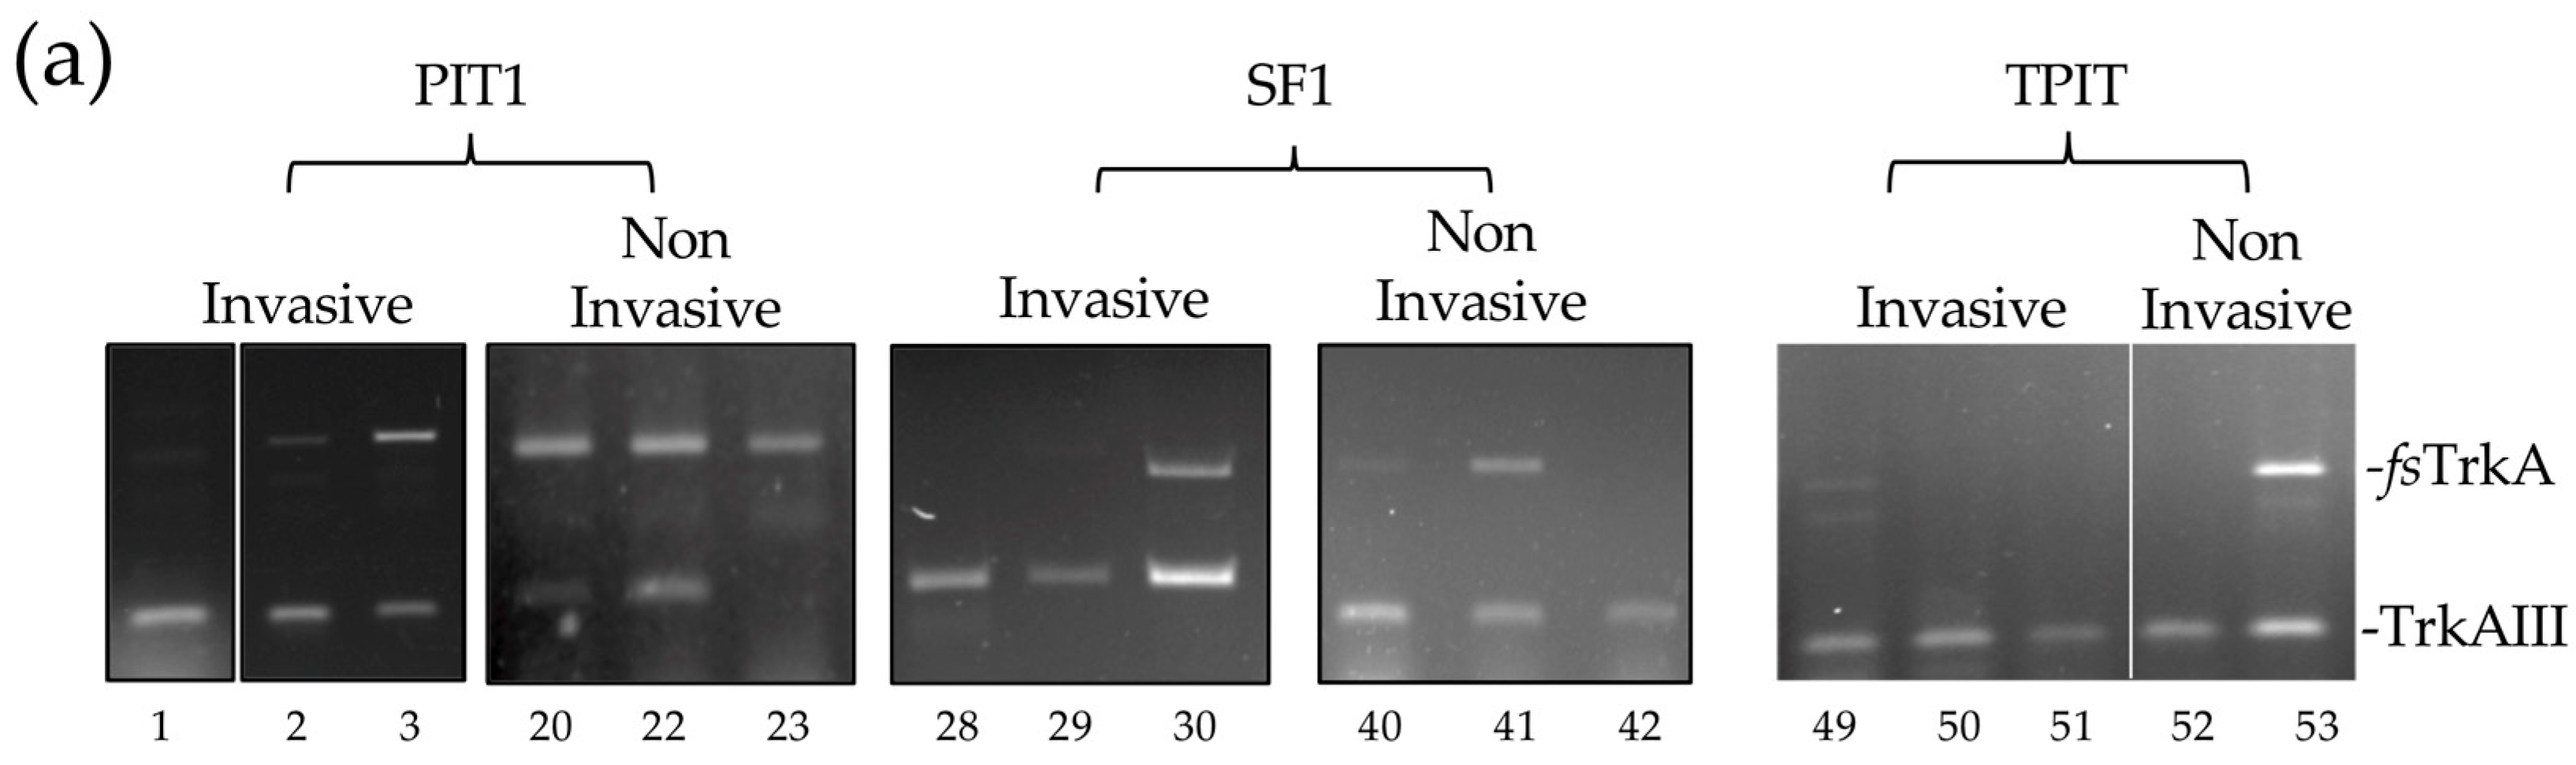
3.1. TrkAIII Was the Only in-Frame Alternative TrkA Splice Variant Expressed in PitNETs
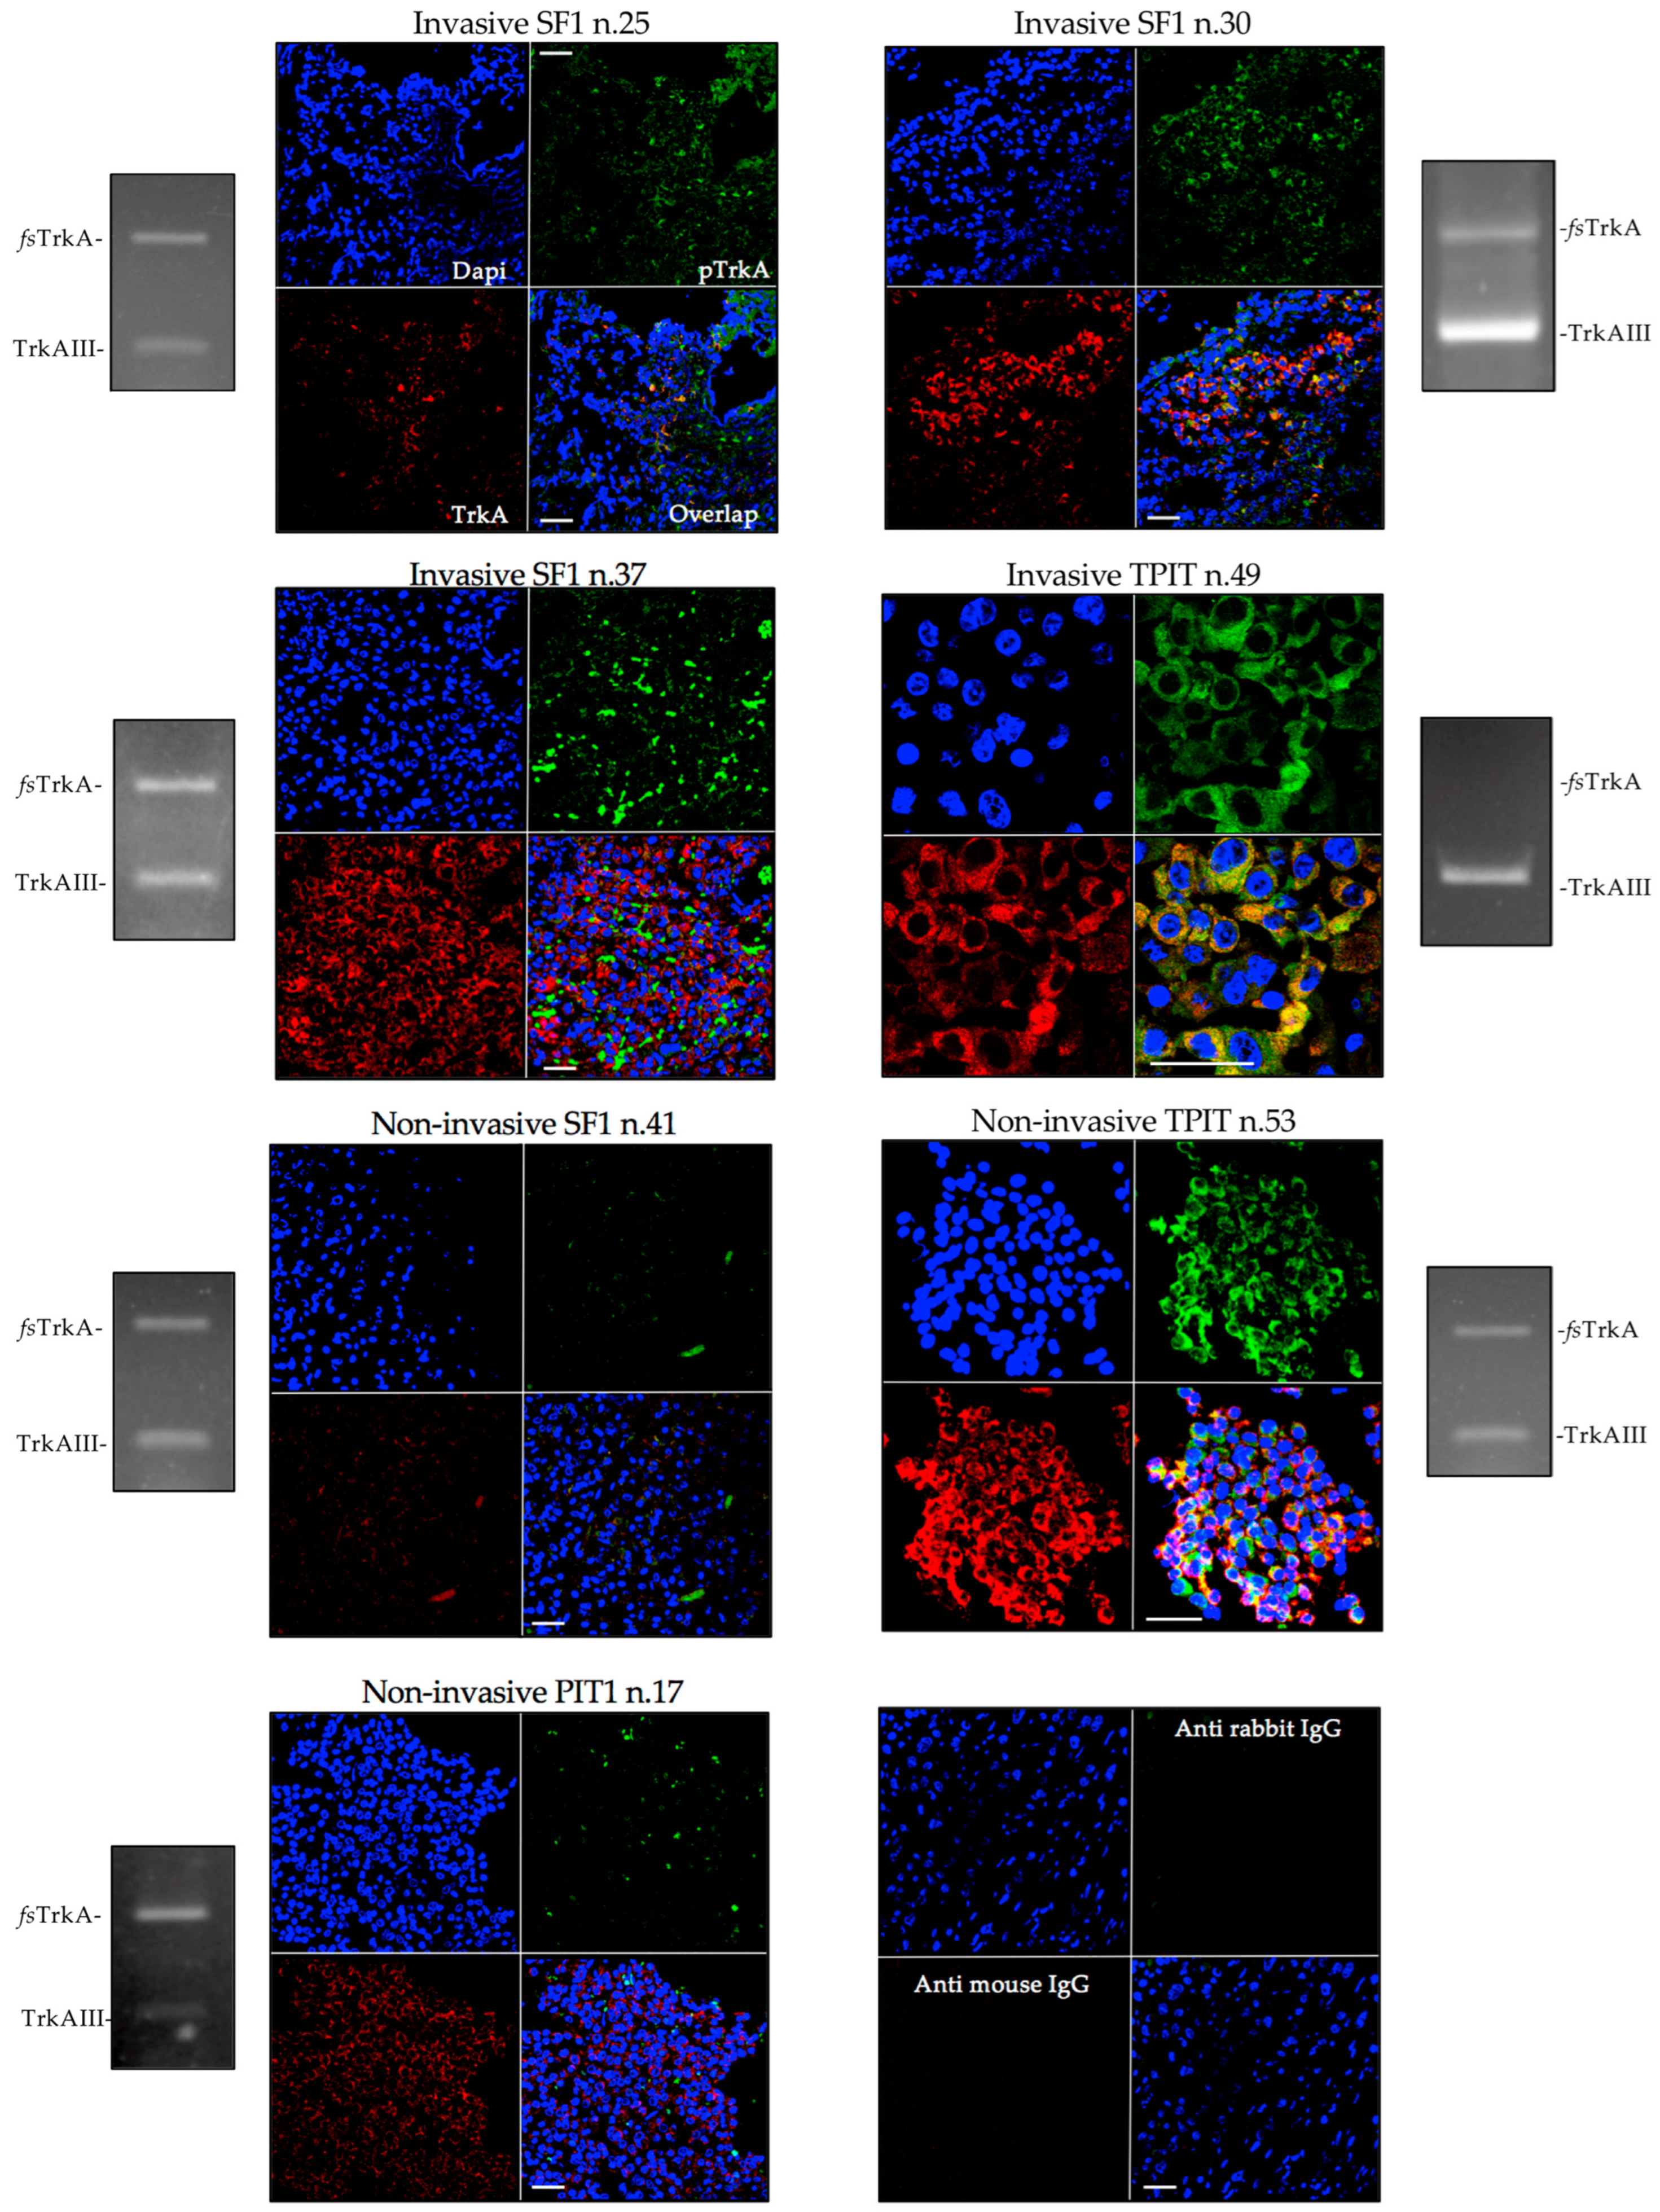
3.2. TrkAIII mRNA Expression Associates with IF Immunoreactivity Consistent with Intracellular TrkAIII Activation
3.3. Enhanced Alternative TrkAIII Splicing in Invasive PIT1 PitNETs Associates with Increased HIF2α mRNA Expression
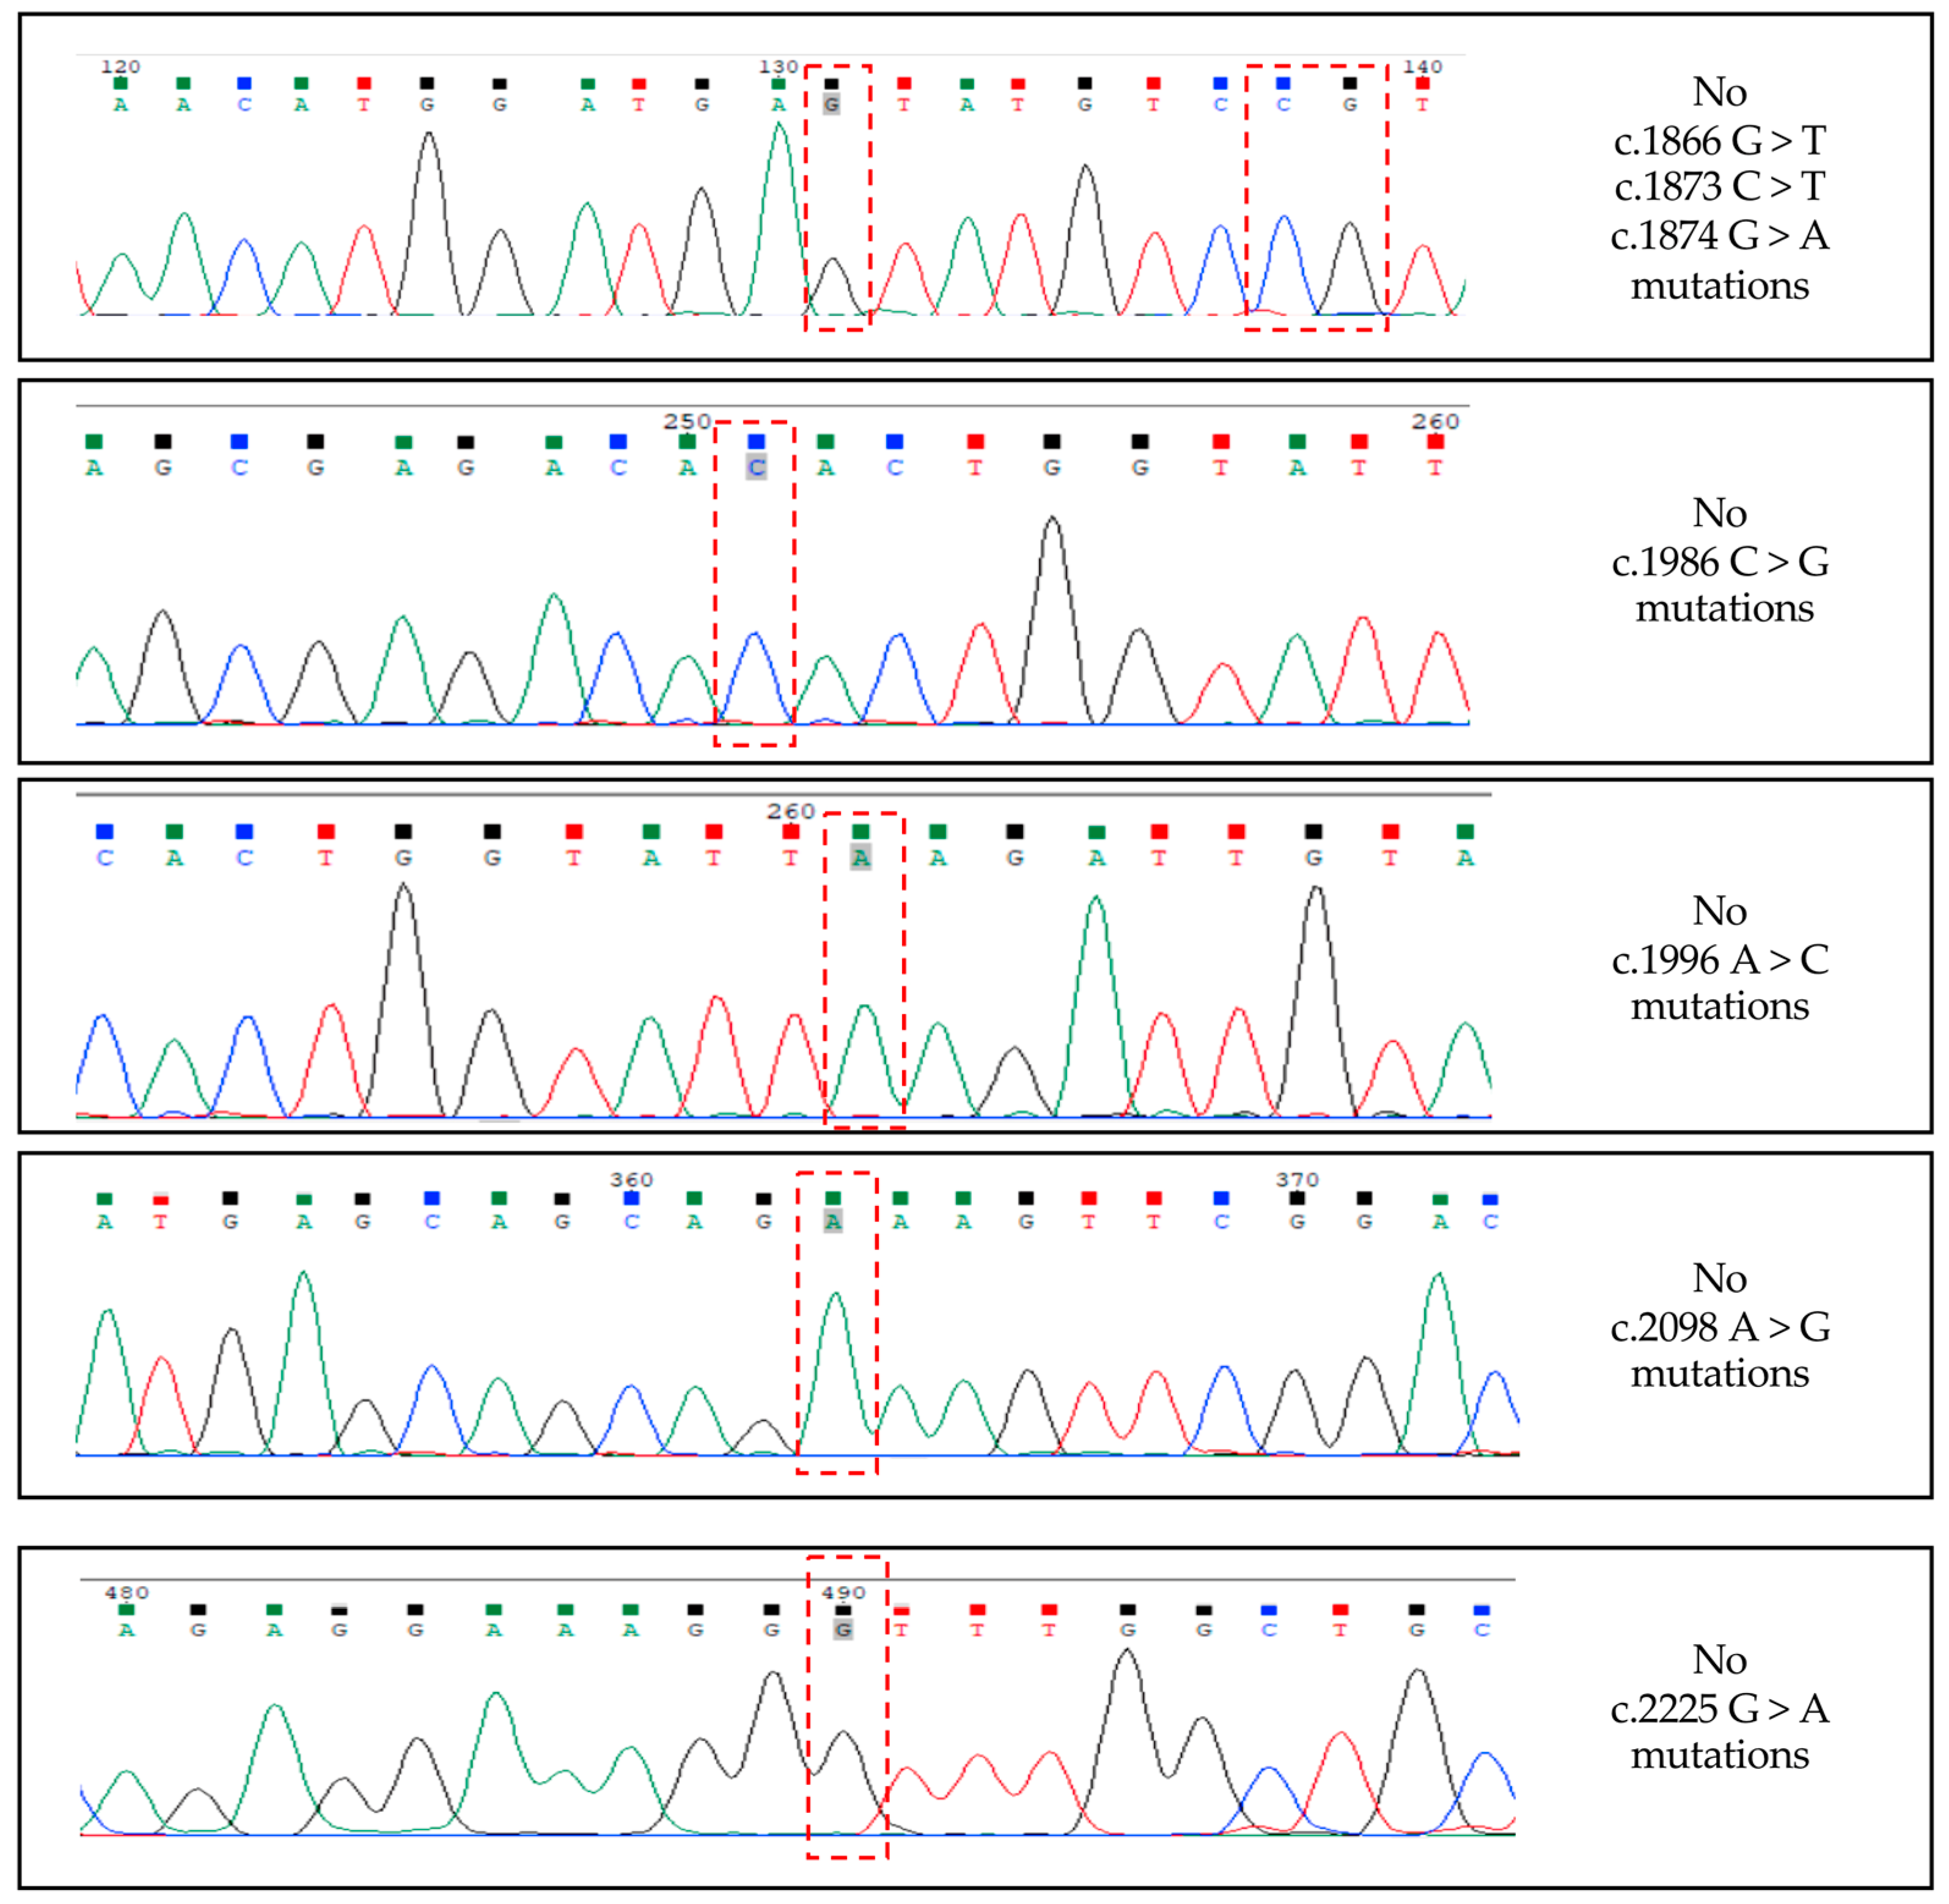
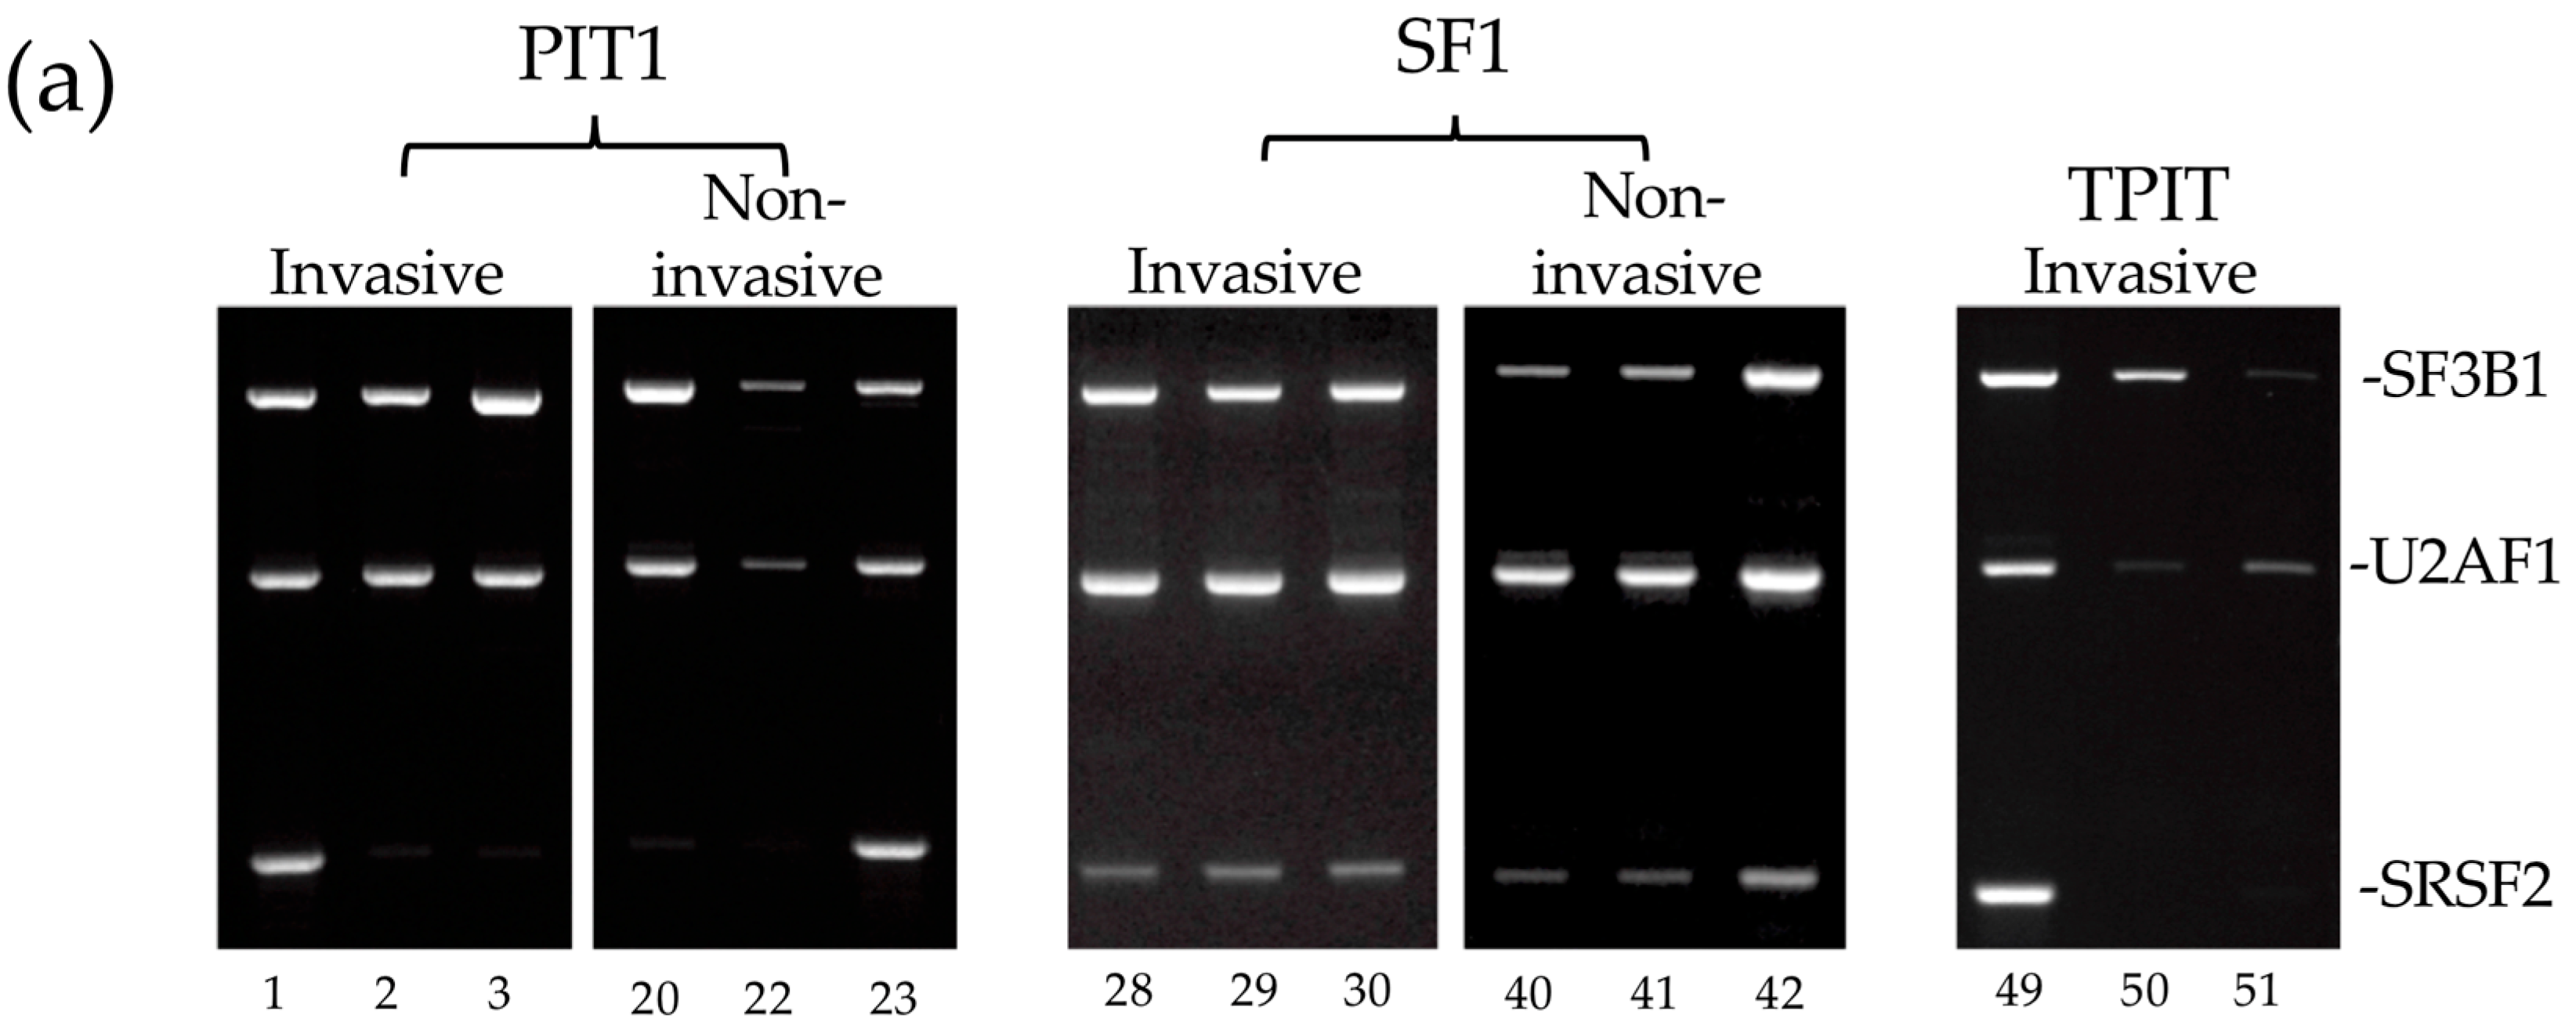
3.4. Alternative TrkAIII Splicing in PitNETs Does Not Associate with Hotspot SF3B1 Mutations or De-Regulated SF3B1, SRSF2, U2AF1 Expression
3.5. PitNET Alternative TrkAIII Splicing Does Not Associate with Unconventional Xbp1 Splicing or JCPyV Large T Antigen mRNA Expression
4. Discussion
5. Conclusions
Author Contributions
Funding
Institutional Review Board Statement
Informed Consent Statement
Data Availability Statement
Acknowledgments
Conflicts of Interest
References
- Osamura, R.Y.; Grossman, A.; Korbonits, M.; Kovacs, K.; Lopes, M.B.S.; Matsuno, A.; Trouillas, J. Pituitary adenoma. In WHO Classification of Tumours of Endocrine Organs; Lloyd, R.V., Osamura, R.Y., Koppel, G.R., Eds.; International Agency for Research on Cancer (IARC): Lyon, France, 2017; pp. 14–18. [Google Scholar]
- Trouillas, J.; Jaffrain-Rea, M.L.; Vasiljevic, A.; Raverot, G.; Rioncaroli, F.; Villa, C. How to classify pituitary neuroendocrine tumors (PitNET)s in 2020. Cancers 2020, 12, 514. [Google Scholar] [CrossRef] [PubMed]
- Asa, S.L.; Mete, O.; Perry, A.; Osamura, R.Y. Overview of the 2022 WHO Classification of Pituitary Tumors. Endocr. Pathol. 2022, 33, 6–26. [Google Scholar] [CrossRef] [PubMed]
- Tsukamoto, T.; Miki, Y. Imaging of pituitary tumors: An update with the 5th WHO classifications: Part 1. Pituitary neuroendocrine tumor (PitNET) pituitary adenoma. Jpn. J. Radiol. 2023, 41, 789–806. [Google Scholar] [CrossRef] [PubMed]
- Neou, M.; Villa, C.; Armignacco, R.; Jouinot, A.; Raffin-Sanson, M.L.; Septier, A.; Letoumeur, F.; Diry, S.; Diedisheim, M.; Izac, B.; et al. Pangenomic classification of pituitary neuroendocrine tumors. Cancer Cell 2020, 37, 123–134. [Google Scholar] [CrossRef] [PubMed]
- Raverot, G.; Ilie, M.D.; Lasolle, H.; Amodru, V.; Trouillas, J.; Castinetti, F.; Brue, T. Aggressive pituitary tumours and pituitary carcinomas. Nat. Rev. Endocrinol. 2021, 17, 671–684. [Google Scholar] [CrossRef] [PubMed]
- Burman, P.; Trouillas, J.; Losa, M.; McCormack, A.; Petersenn, S.; Popovic, V.; Theodoropoulou, M.; Raverot, G.; Dekkers, O.M. ESE survey collaborators. Aggressive pituitary tumours and carcinomas, characteristics and management of 171 patients. Eur. J. Endocrinol. 2022, 187, 593–605. [Google Scholar] [CrossRef]
- Trouillas, J.; Jaffrain-Rea, M.L.; Vasiljevic, A.; Dekkers, O.; Popovic, V.; Wierinckx, A.; McCormack, A.; Petersenn, S.; Burman, P.; Raverot, G.; et al. Are aggressive pituitary tumors and carcinomas two sides of the same coin? Pathologists reply to clinician’s questions. Rev. Endocr. Metab. Disord. 2020, 21, 243–251. [Google Scholar] [CrossRef]
- Guaraldi, F.; Morandi, L.; Zoli, M.; Mazzatenta, D.; Righi, A.; Evangelisti, S.; Ambrosi, F.; Tonon, C.; Giannini, C.; Lloyd, R.V.; et al. Epigenomic and somatic mutations in pituitary tumors with clinical and pathological correlations in 111 patients. Clin. Endocrinol. 2022, 97, 763–772. [Google Scholar] [CrossRef]
- Srirangam Nadhamuni, V.; Korbonits, M. Novel Insights into Pituitary Tumorigenesis: Genetic and Epigenetic Mechanisms. Endocr. Rev. 2020, 41, 821–846. [Google Scholar] [CrossRef]
- Melmed, S.; Kaiser, U.B.; Lopes, M.B.; Bertherat, J.; Syro, L.V.; Raverot, G.; Reincke, M.; Johannsson, G.; Beckers, A.; Fleseriu, M.; et al. Clinical Biology of the Pituitary Adenoma. Endocr. Rev. 2022, 43, 1003–1037. [Google Scholar] [CrossRef]
- Bao, Y.; Yoshida, D.; Morimoto, M.D.; Teramoto, A. Expression of laminin B2: A novel marker of hypoxia in pituitary adenomas. Endocr. Pathol. 2006, 17, 251–261. [Google Scholar] [CrossRef]
- Zhou, Y.; Zhang, A.; Fang, C.; Yuan, L.; Shao, A.; Xu, Y.; Zhou, D. Oxidative stress in pituitary neuroendocrine tumors: Affecting the tumor microenvironment and becoming a new target for pituitary neuroendocrine tumor therapy. CNS Neurosci. Ther. 2023, 29, 2744–2759. [Google Scholar] [CrossRef]
- Li, C.; Xie, W.; Rosenblum, J.S.; Zhou, J.; Guo, J.; Miao, Y.; Shen, Y.; Wang, H.; Gong, L.; Li, M.; et al. Somatic SF3B1 hotspot mutation in prolactinomas. Nat. Commun. 2020, 11, 2056. [Google Scholar] [CrossRef]
- Torres-Moran, M.; Franco-Alvarez, A.; Rebollar-Vega, R.G.; Hernandez-Ramirez, L.C. Hotspots of somatic genetic variation in pituitary neuroendocrine tumors. Cancers 2023, 15, 5685. [Google Scholar] [CrossRef] [PubMed]
- Simon, J.; Perez-Rivas, L.G.; Zhao, Y.; Chasseloup, F.; Lasolle, H.; Cortet, C.; Descotes, F.; Villa, C.; Baussart, B.; Burman, P.; et al. Prevalence and clinical correlations of SF3B1 variants in lactotroph tumours. Eur. J. Endocrinol. 2023, 189, 372–378. [Google Scholar] [CrossRef]
- Vazquez-Borrego, M.C.; Fuentes-Fayos, A.C.; Venegas-Moreno, E.; Rivero-Cortes, E.; Dios, E.; Moreno-Moreno, P.; Madrazo-Atutxa, A.; Remon, P.; Solivera, J.; Wildemberg, L.E.; et al. Splicing machinery is dysregulated in pituitary neuroendocrine tumors and is associated with aggressive features. Cancers 2019, 11, 1439. [Google Scholar] [CrossRef]
- Gordon, J.; Del Valle, L.; Otte, J.; Khalili, K. Pituitary neoplasia induced by expression of human neurotropic polyomavirus, JCV, early genome in transgenic mice. Oncogene 2000, 19, 4840–4846. [Google Scholar] [CrossRef]
- Del Valle, L.; Khalili, K. Induction of brain tumors by the archetypal strain of human neurotropic JCPyV in a transgenic mouse model. Viruses 2021, 13, 162. [Google Scholar] [CrossRef]
- Farina, A.R.; Cappabianca, L.; Sebastiano, M.; Zelli, V.; Guadagni, S.; Mackay, A.R. Hypoxia-induced alternative splicing: The 11th hallmark of cancer. J. Clin. Exp. Cancer Res. 2020, 39, 110. [Google Scholar] [CrossRef] [PubMed]
- Siddaway, R.; Milos, S.; Kumaran Anguraj Vadivel, A.; Dobson, T.H.W.; Swaminathan, J.; Ryall, S.; Pajovic, S.; Patel, P.G.; Nazarian, J.; Becher, O.; et al. Splicing is an alternative oncogenic pathway activation mechanism in glioma. Nat. Commun. 2022, 13, 588. [Google Scholar] [CrossRef] [PubMed]
- Bonomi, S.; Gallo, S.; Catillo, M.; Pignataro, D.; Biamonti, G.; Ghigna, C. Oncogenic alternative splicing switches: Role in cancer progression and prospects for therapy. Int. J. Cell Biol. 2013, 2013, 962038. [Google Scholar] [CrossRef] [PubMed]
- Patterson, J.C.; Childs, G.V. Nerve growth factor and its receptor in the anterior pituitary. Endocrinology 1994, 135, 1689–9166. [Google Scholar] [CrossRef] [PubMed]
- Assimakopoulou, M.; Zolota, V.; Chondrogianni, C.; Gatzounis, G.; Varakis, J. p75 and TrkC neurotrophin receptors demonstrate a different immunoreactivity profile in comparison to TrkA and TrkB receptors in human normal pituitary gland and adenomas. Neuroendocrinology 2008, 88, 127–134. [Google Scholar] [CrossRef]
- Tacconelli, A.; Farina, A.R.; Cappabianca, L.; DeSantis, G.; Tessitore, A.; Vetuschi, A.; Sferra, R.; Rucci, N.; Argenti, B.; Screpanti, I.; et al. TrkA alternative splicing: A regulated tumor-promoting switch in human neuroblastoma. Cancer Cell 2004, 6, 347–360. [Google Scholar] [CrossRef]
- Cappabianca, L.; Guadagni, S.; Maccarone, R.; Sebastiano, M.; Chiominto, A.; Farina, A.R.; Mackay, A.R. A pilot study of alternative TrkAIII splicing in Merkel cell carcinoma: A potential oncogenic mechanism and novel therapeutic target. J. Exp. Clin. Cancer Res. 2019, 38, 424. [Google Scholar] [CrossRef] [PubMed]
- Cappabianca, L.; Zelli, V.; Pellegrini, C.; Sebastiano, M.; Maccarone, R.; Clementi, M.; Chiominto, A.; Ruggeri, P.; Cardelli, L.; Ruggieri, M.; et al. The alternative TrkAIII splice variant, a targetable oncogenic participant in human cutaneous malignant melanoma. Cells 2023, 12, 237. [Google Scholar] [CrossRef]
- Schramm, A.; Schowe, B.; Fielitz, K.; Hweilman, M.; Martin, M.; Marschall, T.; Koster, J.; Vandenstompele, J.; Vermeulen, J.; de Pterter, K.; et al. Exon-level expression analyses identify MYCN and NTRK1 as major determinants of alternative exon usage and robustly predict primary neuroblastoma outcome. Br. J. Cancer 2012, 107, 1409–1417. [Google Scholar] [CrossRef]
- Lebedev, T.D.; Vagapova, E.R.; Popenko, V.I.; Leonova, O.G.; Spirin, P.V.; Prassolov, V.S. Two receptors, two isoforms, two cancers: Comprehensive analysis of KIT and TrkA expression in neuroblastoma and acute myeloid leukemia. Front. Oncol. 2019, 9, 1046. [Google Scholar] [CrossRef]
- Farina, A.R.; Di Ianni, N.; Cappabianca, L.; Ruggeri, P.; Gneo, L.; Pellegrini, C.; Fargnoli, M.C.; Mackay, A.R. The oncogenic neurotrophin receptor tropomyosin-related kinase variant, TrkAIII. J. Clin. Exp. Cancer Res. 2018, 37, 119. [Google Scholar] [CrossRef]
- Arevalo, J.C.; Conde, B.; Hempstead, B.L.; Chao, M.V.; Martin-Zanca, D.; Perez, P. TrkA immunoglobulin-like ligand binding domains inhibit spontaneous activation of the receptor. Mol. Cell. Biol. 2000, 20, 5908–5916. [Google Scholar] [CrossRef]
- Watson, F.L.; Porcionatto, M.A.; Battacharyya, A.; Stiles, C.D.; Segal, R.A. TrkA glycosylation regulates receptor localization and activity. J. Neurobiol. 1999, 39, 323–336. [Google Scholar] [CrossRef]
- Farina, A.R.; Cappabianca, L.; Ruggeri, P.; Gneo, L.; Maccarone, R.; Mackay, A.R. Retrograde TrkAIII transport from ERGIC to ER: A re-localization mechanism for oncogenic activity. Oncotarget 2015, 34, 35636–35651. [Google Scholar] [CrossRef]
- Farina, A.R.; Tacconelli, A.; Cappabianca, L.; Cea, G.; Panella, S.; Chioda, A.; Romanelli, A.; Pedone, C.; Gulino, A.; Mackay, A.R. The alternative TrkA splice variant targets the centrosome and promotes genetic instability. Mol. Cell. Biol. 2009, 17, 4812–4830. [Google Scholar] [CrossRef] [PubMed]
- Farina, A.R.; Cappabianca, L.; Gneo, L.; Ruggeri, P.; Mackay, A.R. TrkAIII signals endoplasmic reticulum stress to the mitochondria in neuroblastoma cells, resulting in glycolytic metabolic adaptation. Oncotarget 2017, 9, 8368–8390. [Google Scholar] [CrossRef]
- Cappabianca, L.; Sebastiano, M.; Ruggieri, M.; Sbaffone, M.; Zelli, V.; Farina, A.R.; Mackay, A.R. Doxorubicin-induced TrkAIII activation: A selection mechanism for resistant dormant neuroblastoma cells. Int. J. Mol. Sci. 2022, 18, 10895. [Google Scholar] [CrossRef] [PubMed]
- Shulman, D.S.; DuBois, S.G. The evolving diagnostic and treatment landscape of NTRK-fusion driven pediatric cancers. Pediatr. Drugs 2020, 22, 189–197. [Google Scholar] [CrossRef]
- Rohrberg, K.S.; Lassen, U. Detecting and targeting NTRK fusions in cancer in the era of tumor agnostic oncology. Drugs 2021, 81, 445–452. [Google Scholar] [CrossRef]
- Villa, C.; Vasiljevic, A.; Jaffrain-Rea, M.L.; Ansorge, O.; Asioli, S.; Barresi, V.; Chinezu, L.; Gardiman, M.P.; Lania, A.; Lapshina, A.M.; et al. A standardised diagnostic approach to pituitary neuroendocrine tumours (PitNETs): A European Pituitary Pathology Group (EPPG) proposal. Virchows Arch. 2019, 475, 687–692. [Google Scholar] [CrossRef] [PubMed]
- Singh, R.; Green, M.R. Sequence-specific binding of transfer RNA by glyceraldehyde-3-phosphate dehydrogenase. Science 1993, 259, 365–368. [Google Scholar] [CrossRef]
- Feola, T.; Carbonara, F.; Verrico, M.; Di Crescenzo, R.M.; Gianno, F.; Colonnese, C.; Arcella, A.; de Alcubierre, D.; Tomao, S.; Esposito, V.; et al. Immunotherapy for Aggressive and Metastatic Pituitary Neuroendocrine Tumors (PitNETs): State-of-the Art. Cancers 2022, 14, 4093. [Google Scholar] [CrossRef]
- Yoshida, H. Unconventional splicing of XBP-1 mRNA in the unfolded protein response. Antioxid. Redoc. Signal. 2007, 9, 2323–2333. [Google Scholar] [CrossRef]
- Yang, Q.; Li, X. Molecular Network Basis of Invasive Pituitary Adenoma: A Review. Front. Endocrinol. 2019, 10, 7. [Google Scholar] [CrossRef]
- Artico, M.; Bianchi, E.; Magliulo, G.; De Vincentiis, M.; De Santis, E.; Orlandi, A.; Santoro, A.; Pastore, F.S.; Giangaspero, F.; Caruso, R.; et al. Neurotrophins, their receptors and KI-67 in human GH-secreting pituitary adenomas: An immunohistochemical analysis. Int. J. Immunopathol. Pharmacol. 2012, 25, 117–125. [Google Scholar] [CrossRef] [PubMed]
- Gupta, P.; Dutta, P. Landscape of Molecular Events in Pituitary Apoplexy. Front. Endocrinol. 2018, 9, 107. [Google Scholar] [CrossRef]
- Tebani, A.; Jotanovic, J.; Hekmati, N.; Sivertsson, A.; Gudjonsson, O.; Engstrom, B.E.; Wikstrom, J.; Uhlen, M.; Casar-Borota, O.; Ponten, F. Annotation of pituitary neuroendocrine tumor with genome-wide expression analysis. Acta Neuropathol. Commun. 2021, 9, 181. [Google Scholar] [CrossRef] [PubMed]
- Lucia, K.; Wu, Y.; Garcia, J.M.; Barlier, A.; Buchfelder, M.; Saeger, W.; Renner, U.; Stalla, G.K.; Theodoropoulou, M. Hypoxia and the hypoxia inducible factor 1α activate protein kinase A by repressing RII beta subunit transcription. Oncogene 2020, 39, 3367–3380. [Google Scholar] [CrossRef]
- Albanese, A.; Daly, L.A.; Mennerich, D.; Kietzmann, T.; Sée, V. The Role of Hypoxia-Inducible Factor Post-Translational Modifications in Regulating Its Localisation, Stability, and Activity. Int. J. Mol. Sci. 2020, 22, 268. [Google Scholar] [CrossRef]
- Hamidian, A.; von Stedingk, K.; Thoren, M.M.; Mohlin, S.; Pahlman, S. Differential regulation of HIF-1α and HIF-2α in neuroblastoma, estrogen related receptor alpha (ERRa) regulates HIF2A transcription and correlates to poor outcome. Biochem. Biophys. Res. Commun. 2015, 461, 560–567. [Google Scholar] [CrossRef]
- Ferrand, R.; Pearse, A.G.E.; Polak, J.M.; Le Douarin, N.M. Immunohistochemical studies on the development of avian embryo pituitary corticotrophs under normal and experimental conditions. Histochemistry 1974, 38, 133–141. [Google Scholar] [CrossRef] [PubMed]
- Eagleson, G.W.; Jenks, B.G.; Van Overbeeke, A.P. The pituitary adrenocorticotropes originate from neural ridge tissue in Xenopus laevis. J. Embryol. Exp. Morph 1986, 95, 1–14. [Google Scholar] [CrossRef]
- Ueharu, H.; Yoshida, S.; Kikkawa, T.; Kanno, N.; Higuchi, M.; Kato, T.; Osumi, N.; Kato, Y. Gene tracing analysis reveals the contribution of neural crest-derived cells in pituitary development. J. Anat. 2017, 230, 373–380. [Google Scholar] [CrossRef] [PubMed]
- Ueharu, H.; Yoshida, S.; Kanno, N.; Horiguchi, K.; Nishimura, N.; Kato, T.; Kato, Y. SOX10-positive cells emerge in the rat pituitary gland during late embryogenesis and start to express S100β. Cell Tissue Res. 2018, 372, 77–90. [Google Scholar] [CrossRef] [PubMed]
- Duan, S.; Sawyer, T.W.; Sontz, R.A.; Wieland, B.A.; Diaz, A.F.; Merchant, J.L. GFAP-directed inactivation of men1 exploits glail cell plasticity in favor of neuroendocrine reprogramming. Cell. Mol. Gastroent. Hepatol. 2022, 14, 1025–1051. [Google Scholar] [CrossRef] [PubMed]
- Johnsen, J.I.; Dyberg, C.; Wickstrom, M. Neuroblastoma-a neural crest derived embryonal malignancy. Front. Mol. Neurosci. 2019, 12, 9. [Google Scholar] [CrossRef]
- Chipurupalli, S.; Kannan, E.; Tergaonkar, V.; D’Andrea, R.; Robinson, N. Hypoxia induced ER stress response as an adaptive mechanism in cancer. Int. J. Mol. Sci. 2019, 20, 749. [Google Scholar] [CrossRef]
- Cocco, E.; Scaltrtiti, M.; Drilon, A. NTRK fusion-positive cancers and TRK inhibitor therapy. Nat. Rev. Clin. Oncol. 2018, 15, 731–747. [Google Scholar] [CrossRef]
- Treis, D.; Umapathy, G.; Fransson, S.; Guan, J.; Mendoza-Garcia, P.; Siaw, J.T.; Wessman, S.; Gordon Murkes, L.; Stenman, J.J.E.; Djos, A.; et al. Sustained response to entrectinib in an infant with a germline ALKAL2 variant and refractory metastatic neuroblastoma with chromosomal 2p gain and anaplastic lymphoma kinase and tropomyosin receptor kinase activation. JCO Precis. Oncol. 2022, 6, e2100271. [Google Scholar] [CrossRef] [PubMed]


| PIT1 PitNETs | |||||||||||||
| INVASIVE (n = 11) | NON-INVASIVE (n = 13) | ||||||||||||
| Pt | Age | Sex | IHC | Clinical Status | Rec | Ki67 (%) | Pt | Age | Sex | IHC | Clinical Status | Rec | Ki67 (%) |
| 1 | 53 | F | PRL | F | Y(a) | ≥3 | 12 * | 37 | F | GH | F | N | ≥3 |
| 2 | 19 | M | GH | F | N | <3 | 13 | 52 | F | GH | F | N | <3 |
| 3 | 16 | M | PRL | NF | N | ≥3 | 14 | 52 | M | GH | F | N | <3 |
| 4 | 18 | F | GH | NF | N | ≥3 | 15 | 34 | F | PRL | F | N | n/a |
| 5 | 74 | M | TSH | F | N | ≥3 | 16 * | 49 | M | GH/PRL | F | N | <3 |
| 6 | 37 | M | TSH | F | N | ≥3 | 17 | 40 | F | GH/PRL | F | N | ≥3 |
| 7 | 25 | F | GH | F | N | ≥3 | 18 | 55 | M | GH/PRL | F | N | ≥3 |
| 8 | 21 | M | PRL | F | N | n/a | 19 | 36 | F | PRL | F | N | n/a |
| 9 | 76 | F | GH | F | N | <3 | 20 | 26 | M | PRL | F | N | n/a |
| 10 | 14 | M | GH/PRL | F | Y | ≥3 | 21 * | 50 | M | GH | F | N | ≥3 |
| 11 | 62 | M | Pit1 only | NF | Y(m) | ≥3 | 22 | 43 | F | GH/PRL | NF | N | <3 |
| 23 | 49 | M | PRL | F | N | n/a | |||||||
| 24 | 32 | F | GH | F | N | <3 | |||||||
| SF1 PitNETs | |||||||||||||
| INVASIVE (n = 12) | NON-INVASIVE (n = 12) | ||||||||||||
| Pt | Age | Sex | IHC | Clinical status | Rec | Ki67 (%) | Pt | Age | Sex | IHC | Clinical status | Rec | Ki67 (%) |
| 25 | 45 | M | FSH/LH | NF | N | ≥3 | 37 | 68 | M | FSH/LH | NF | N | ≥3 |
| 26 | 56 | M | FSH/LH | NF | N | ≥3 | 38 | 71 | F | SF1 only | NF | Y | <3 |
| 27 | 73 | F | FSH/LH | NF | N | ≥3 | 39 * | 71 | M | FSH/LH | NF | N | <3 |
| 28 | 49 | F | SF1 only | NF | N | ≥3 | 40 | 67 | M | SF1 only | NF | Y | ≥3 |
| 29 | 55 | F | SF1 only | NF | N | ≥3 | 41 | 61 | M | FSH/LH | NF | N | <3 |
| 30 | 48 | M | FSH/LH | NF | N | ≥3 | 42 | 46 | M | FSH/LH | NF | N | ≥3 |
| 31 | 53 | M | FSH/LH | NF | N | ≥3 | 43 | 75 | M | FSH/LH | NF | N | <3 |
| 32 | 47 | F | FSH/LH | NF | N | <3 | 44 | 74 | M | SF1 only | NF | N | <3 |
| 33 | 69 | M | FSH/LH | NF | Y | <3 | 45 | 66 | M | FSH/LH | NF | N | <3 |
| 34 | 70 | F | FSH/LH | NF | N | <3 | 46 | 39 | M | FSH/LH | NF | N | <3 |
| 35 | 55 | M | FSH/LH | NF | N | ≥3 | 47 | 46 | M | FSH/LH | NF | N | ≥3 |
| 36 | 73 | M | SF1 only | NF | N | ≥3 | 48 | 69 | F | FSH/LH | NF | N | <3 |
| TPIT PitNETs | |||||||||||||
| INVASIVE (n = 3) | NON-INVASIVE (n = 2) | ||||||||||||
| Pt | Age | Sex | IHC | Clinical status | Rec | Ki67 (%) | Pt | Age | Sex | IHC | Clinical status | Rec | Ki67 (%) |
| 49 | 57 | M | ACTH | F | Y(a) | ≥3 | 52 | 78 | F | ACTH | F | N | <3 |
| 50 | 52 | F | ACTH | NF | N | ≥3 | 53 | 36 | F | ACTH | F | N | ≥3 |
| 51 | 26 | F | ACTH | F | N | ≥3 | |||||||
| Target | Sequence | Denat | Ann | Ext | Amplicon |
|---|---|---|---|---|---|
| 18S rRNA **** | F: 5′-AAACGGCTACCACATCCAAG-3′ R: 5′-CCTCGAAAGAGTCCTGTATTG-3′ | 30 s 94 °C | 30 s 58 °C | 30 s 72 °C | 100 bp |
| TrkA ex 8-17 * | F: 5′-AACCCCTTCGGCCAGGCCTCC-3′ R: 5′-CTAGCCCAGGACATCCAGGTA-3′ | 1 m 94 °C | 30 s 65 °C | 1 m 72 °C | 1298 bp TrkA |
| TrkA ex 1-8 * | F: 5′-ATGCTGCGAGGCGGACGGCGC-3′ R: 5′-GGAGGCCTGGCCGAAGGGGTT-3′ | 1 m 94 °C | 30 s 68 °C | 1 m 72 °C | 1114 bp TrkA, 838 bp TrkAIII, 475 bp Δ2-7 TrkA |
| TrkA ex 5-8 * | F: 5′-AGAAGCTGCAGTGTCATGGG-3′ R: 5′-ATTGAGCACGGAGCCATTGA-3′ | 40 s 94 °C | 30 s 58 °C | 40 s 72 °C | 452 bp TrkA 176 bp TrkAIII |
| SRSF2 *** | F: 5′-CTCCCGATGTGGAGGGTATG-3′ R: 5′-GAGATCGGCTGCGAGACC-3′ | 40 s 94 °C | 30 s 58 °C | 40 s 72 °C | 408 bp |
| SF3B1 ** | F: 5′-TGTGCATAAGATCCTCGTGGT-3′ R: 5′-ACACCATCTGTCCCACAACA-3′ | 40 s 94 °C | 30 s 58 °C | 4 s 72 °C | 693 bp |
| SF3B1 (tDNA) | F: 5′-TAGGCTGCTGGTCTGGCTAC-3′ R: 5′-ATGGCACAGCCCATAAGAATAG-3′ | 30 s 95 °C | 30 s 60 °C | 1 m 72 °C | 233 bp |
| U2AF1 ** | F: 5′-CGGAGTATCTGGCCTCCATC-3′ R: 5′-GCAGCTCTCTGGAAATGGGCT-3′ | 40 s 94 °C | 30 s 60 °C | 40 s 72 °C | 606 bp |
| HIF-1α ** | F: 5′-TTCACCTGAGCCTAATAGTCC-3′ R: 5′-AAGTCTAAATCTGTGTCCTG-3′ | 30 s 94 °C | 30 s 50 °C | 30 s 72 °C | 150 bp |
| HIF-2α *** | F: 5′-AGCCTCCATCTGCCATCAGTC-3′ R: 5′-CTTGCCATGCCTGACACCTTG-3′ | 30 s 94 °C | 30 s 55 °C | 30 s 72 °C | 121 bp |
| JCPyV T-Ag * | F: 5′-ATATTATGACCCCCAAAACCATG-3′ R: 5′-GGTAGAAGACCCTAAGGACTTTCC-3′ | 40 s 94 °C | 30 s 58 °C | 40 s 68 °C | 189 bp |
Disclaimer/Publisher’s Note: The statements, opinions and data contained in all publications are solely those of the individual author(s) and contributor(s) and not of MDPI and/or the editor(s). MDPI and/or the editor(s) disclaim responsibility for any injury to people or property resulting from any ideas, methods, instructions or products referred to in the content. |
© 2024 by the authors. Licensee MDPI, Basel, Switzerland. This article is an open access article distributed under the terms and conditions of the Creative Commons Attribution (CC BY) license (https://creativecommons.org/licenses/by/4.0/).
Share and Cite
Sbaffone, M.; Jaffrain-Rea, M.-L.; Cappabianca, L.; Carbonara, F.; Gianno, F.; Feola, T.; Ruggieri, M.; Zelli, V.; Maccarone, R.; Guadagni, S.; et al. A Study of Alternative TrkA Splicing Identifies TrkAIII as a Novel Potentially Targetable Participant in PitNET Progression. Biology 2024, 13, 171. https://doi.org/10.3390/biology13030171
Sbaffone M, Jaffrain-Rea M-L, Cappabianca L, Carbonara F, Gianno F, Feola T, Ruggieri M, Zelli V, Maccarone R, Guadagni S, et al. A Study of Alternative TrkA Splicing Identifies TrkAIII as a Novel Potentially Targetable Participant in PitNET Progression. Biology. 2024; 13(3):171. https://doi.org/10.3390/biology13030171
Chicago/Turabian StyleSbaffone, Maddalena, Marie-Lise Jaffrain-Rea, Lucia Cappabianca, Francesca Carbonara, Francesca Gianno, Tiziana Feola, Marianna Ruggieri, Veronica Zelli, Rita Maccarone, Stefano Guadagni, and et al. 2024. "A Study of Alternative TrkA Splicing Identifies TrkAIII as a Novel Potentially Targetable Participant in PitNET Progression" Biology 13, no. 3: 171. https://doi.org/10.3390/biology13030171