Article

Transcriptome Responses to Different Environments in Intertidal Zones in the Peanut Worm Sipunculus nudus

1
South China Sea Fisheries Research Institute, Chinese Academy of Fishery Sciences, Guangzhou 510300, China
2
Guangdong Provincial Key Laboratory of Fishery Ecology and Environment, Guangzhou 510300, China
3
Institute of Biological and Medical Engineering, Guangdong Academy of Science, Guangzhou 510316, China
4
Corregene Biotechnology Co., Ltd., Beijing 102600, China
5
College of Animal Science, Inner Mongolia Agricultural University, Hohhot 010018, China
*
Authors to whom correspondence should be addressed.
Biology 2023, 12(9), 1182; https://doi.org/10.3390/biology12091182
Submission received: 31 May 2023 / Revised: 19 August 2023 / Accepted: 26 August 2023 / Published: 29 August 2023

Abstract

:

Simple Summary

Sipunculus nudus is a species of significant economic importance because of its high nutritional and medicinal value. It is widely distributed along coastlines worldwide, particularly in China, where a comprehensive industry exists encompassing breeding, farming, processing, and sale. Traditionally, S. nudus is cultured on sandy beaches without the need for artificial diets. The organisms rely on nutrients from the surface sediment, including microalgae and other organic matter. These worms inhabit both the intertidal and subtidal zones, enduring varying immersion periods throughout their growth process. As a result, they are exposed to different abiotic factors, such as varying irradiation times, oxygen availability, and others. In our study, we investigated the transcriptomic response of S. nudus across high, middle, and low tidal flats. We analyzed and compared the differential gene expression and relevant metabolic pathways in S. nudus from different habitats. This analysis aimed to shed light on the molecular mechanisms underpinning physiological responses to diverse environments in burrowing species. Interestingly, we observed that the differential gene expression of S. nudus primarily involved metabolic pathways associated with disease and immune responses rather than thermal stress, calcification, and pH regulation. This finding highlights the close relationship between gene expression and S. nudus’ unique living habits

Abstract

The peanut worm (Sipunculus nudus) is an important intertidal species worldwide. Species living in the same aquaculture area might suffer different environmental impacts. To increase knowledge of the molecular mechanisms underlying the response to environmental fluctuations, we performed a transcriptome analysis of S. nudus from different intertidal zones using a combination of the SMRT platform and the Illumina sequencing platform. (1) A total of 105,259 unigenes were assembled, and 23,063 unigenes were perfectly annotated. The results of the PacBio Iso-Seq and IIIumina RNA-Seq enriched the genetic database of S. nudus. (2) A total of 830 DEGs were detected in S. nudus from the different groups. In particular, 33 DEGs had differential expression in the top nine KEGG pathways related to pathogens, protein synthesis, and cellular immune response and signaling. The results indicate that S. nudus from different zones experience different environmental stresses. (3) Several DEGs (HSPA1, NFKBIA, eEF1A, etc.) in pathways related to pathogens (influenza A, legionellosis, measles, and toxoplasmosis) had higher expression in groups M and L. HSPA1 was clearly enriched in most of the pathways, followed by NFKBIA. The results show that the peanut worms from the M and L tidal flats might have suffered more severe environmental conditions. (4) Some DEGs (MKP, MRAS, and HSPB1) were upregulated in peanut worms from the H tidal flat, and these DEGs were mainly involved in the MAPK signaling pathway. These results indicate that the MAPK pathway may play a vital role in the immune response of the peanut worm to the effects of different intertidal flats. This study provides a valuable starting point for further studies to elucidate the molecular basis of the response to different environmental stresses in S. nudus.

1. Introduction

Intertidal zones are special zones affected by the sea and land, with distinctive ecological environments and valuable resources. Therefore, intertidal species must adapt to rapid changes in temperature, desiccation, seawater chemistry (salinity, pH, oxygen, etc.), and other factors. To confront highly dynamic and harsh habitats, intertidal species have evolved different physiological acclimation abilities [1,2]. Thus, intertidal species have become models for investigating the mechanisms underlying tolerance to extreme abiotic conditions [2]. Studies have shown that intertidal species undergo significant physiological changes in response to abiotic factors [3,4]. For instance, shellfish change their energy metabolism, energy stores, cellular stress mechanisms, and cardiac response during environmental fluctuations [5,6,7].
However, it is worth noting that biochemical or physiological changes in organisms are caused by gene expression changes under stressful environments [8]. Recent studies have shown that thermal stress induces the differential expression of heat shock protein-related genes in oysters [9]. The genes involved in calcification and pH regulation in sea urchins showed robust changes in response to ocean acidification [10]. Moreover, sea urchin populations from different sites showed the differential expression of genes involved in protein synthesis and biomineralization [11]. Compared to those from a moderate environment, mussels that experienced higher temperatures in rocky intertidal habitats showed the differential expression of genes (SQSTM1, HSPBP1, and CRYAA) that play a role in cellular response to unfolded proteins. Moreover, the description of how gene-expression patterns vary temporally and spatially in the marine rocky intertidal zone was provided [12]. With global climate change causing environmental upheaval, intertidal species have become the focus of a growing body of global change research [2]. Analyzing the molecular response mechanisms of intertidal organisms that underlie tolerance to highly dynamic and harsh habitats may inform predictions about how organisms will respond to global climate change.
Sipunculus nudus is a marine nonsegmented coelomic species found in tidal flats. S. nudus has been an important mariculture species in China because of its economic and nutritional value. It is high in amino acids, fatty acids, polysaccharides, and a variety of mineral elements [13,14]. It is known as the “cordyceps of the ocean” in coastal folk culture, and, notably, folk people use the worm for medicinal- and food-conditioning purposes. Modern medical research has demonstrated that the worm contains various active compounds that are useful for enhancing immunity and antifatigue purposes [15,16]. It has been reported that its production can reach approximately 20,000 tons each year in China [17]. Furthermore, it also plays an important role in sustaining ecological balance. It can bury itself down into the sandy sediment to approximately 50 cm, ingest organic matter including microbes from the surface sediment and excrete it in its holes [18], and the depth of ingestion and excretion mainly ranges from 20 to 30 cm [19]. S. nudus can utilize the sediment efficiently when present at a high density in the sediment because of their high transport capacity [20]. S. nudus is widely distributed along coasts worldwide. Typically, S. nudus is cultured along sand beaches without a supplemental artificial diet [17]. However, they can be found in intertidal zones and subtidal zones, where they will endure different immersion days during their growth process. This will affect other abiotic factors, such as different irradiation times, oxygen availability, and other abiotic factors [21]. Furthermore, some better growth characteristics, including stretch and contract ability, and vitality, are observed in high tidal flats. In the present study, we focused on the role of different gene expression patterns and pathways in the ecological adaptation of S. nudus to different environments in intertidal zones. We investigated the transcriptomic response of S. nudus in high, middle, and low tidal flats and analyzed and compared the differential gene expression and related metabolic pathways in S. nudus from different habitats, which is helpful in uncovering the molecular bases of physiological responses to different environments in burrowing species.

2. Materials and Methods

2.1. Experimental Animals and Sample Collection

S. nudus worms with no apparent injuries or symptoms of disease were collected from 3 sites with different immersion days in a farming zone in the Beibu Gulf, China. The farming area of the peanut worm was more than 1300 ha, and the sampling sites were labeled H (109°48′15” E, 21°21′19” N), M (109°48′17” E, 21°20′58” N), and L (109°48′11” E, 21°20′48” N). The sandy sediment at the H site was soft, and the sediment emerged from the water for 28~30 days each month. The M site had medium–soft sediment, and the sediments emerged from the water for 12~14 days. The L site had a hard bottom with a higher organic content, and the sediments emerged from the water for 4~6 days every month during the low tide. The same batch of juvenile individuals (0.8~1.0 g) of S. nudus were cultured in the intertidal flat in March and sampled in November (8~10 g). Three sample plots were designed in parallel in each zone, and 500 g sediment (depth: 0~30 cm) was collected in each plot. The sediment samples were used for the physiochemical analyses, such as the analysis of the salinity in the interstitial water. The total carbon (TOC), total nitrogen (TN), and total sulfur (TS) were measured in the sediment. The sediments in the H, M, and L zones had different environmental characteristics. The final weights of S. nudus are shown in Table 1.
Moreover, the body wall samples of S. nudus were collected from the middle third of the body wall and used for the Sirius staining. The treated procedures of the body wall samples included ethanol dehydration and paraffin embedding and sectioning. Then, the dewaxing followed: xylene I for 20 min, xylene II for 20 min, 100% ethanol I for 5 min, 100% ethanol II for 5 min, 75% ethanol for 5 min, and rinsing with tap water. Staining of the section with Sirius Red solution for 8 min, and then dehydration quickly with two or three cups of anhydrous ethanol. Xylene for 5 min, and sealing with neutral gum. The collagen fibers I (crude fiber) would be bright red, and the collagen fibers III (fine fiber) would be green. The area of the collagen fibers were observed using a microscope (Nikon eclipse E100 and Nikon DS-U3, Tokyo, Japan). The ratio of the collagen fibers was based on the histological index.

2.2. RNA Extraction, Library Construction, and Sequencing

S. nudus were collected from the sample plots in the H, M, and L zones. There were 3 replicates in each group, and a total of 9 individuals were used for the Illumina RNA-Seq and de novo assembly. The transcriptome sequencing and analysis were supported by Annoroad Gene Technology Co., Ltd., Beijing, China. Moreover, in order to obtain a higher quality transcript for reference and comparation, RNA from the 9 individuals were mixed into a sample for PacBio Iso-Sequencing. Body wall samples of S. nudus were collected and stored with RNA Safer Reagent, which blocks global transcription of the cells. Prior to the RNA extraction, samples were ground to a powder with a sterilized mortar and pestle in the presence of liquid nitrogen. Total RNA from nine individuals from three treatments was collected for PacBio SMRT (single-molecule real-time sequencing, SMRT) library generation. The RNA was treated with RNase-DNase to remove DNA contaminants. RNA integrity was assessed with an Agilent 2100 Bioanalyzer (Agilent Technologies, Palo Alto, CA, USA). The concentration of each RNA sample was determined using Qubit RNA BR in a Qubit 2.0 Fluorometer (Life Technologies, Carlsbad, CA, USA). For the PacBio Iso-Seq, 1 µg of each RNA sample was pooled together for cDNA library construction. For the Illumina RNA-Seq, an equal amount of total RNA was collected, and indexed cDNA libraries were then prepared for each S. nudus sample. The polyA containing mRNA was extracted using oligo-dT attached magnetic beads.

2.3. PacBio Iso-Seq Library Preparation and Sequencing

The PacBio Iso-Seq library was prepared according to the Pacific Biosciences protocol. Briefly, 1 µg of polyA mRNA was reverse transcribed into cDNA using the Clontech SMARTer PCR cDNA Synthesis Kit. The first strand cDNA was amplified using KAPA HiFi PCR Kits. The resulting cDNA libraries were purified using 0.40 × AMPure PB Beads, as specified by the supplier (Pacific Biosciences, Menlo Park, CA, USA). Libraries were then size-selected using the BluePippin or Size Selection System (Sage Science, Beverly, MA, USA) into two separate bins each: <4 kb and >4 kb. Each SMRTbell library was constructed using 500 ng size-selected cDNA with the Pacific Biosciences SMRTbell template prep kit 2.1. The binding of SMRTbell templates to polymerases was conducted using the DNA/Polymerase Binding Kit and primers. Sequencing was carried out on the Pacific Bioscience Sequel platform by Annoroad Gene Technology Company (Beijing, China).

2.4. Illumina RNA-Seq and De Novo Assembly

Equal amounts of body wall tissues from the three groups of S. nudus were used for RNA extraction. For Illumina RNA sequencing, 3 libraries were obtained in H, M, and L. The RNA was treated with RNase-DNase to remove DNA contaminants, and then the purified RNA quality and quantity were determined using an Agilent 2100RNA Bioanalyzer (Agilent Technologies, Santa Clara, CA, USA). Samples with Qubit BR results (A and B) were used to construct cDNA libraries, and the nine transcriptomic libraries were sequenced on the Illumina HiSeq 2500 platform to obtain 150 bp paired-end reads. For further analysis, the raw reads were filtered by removing the adaptor reads and low-quality reads or unknown nucleotides. The totality of the Illumina clean read mapped to the PacBio isoforms, and the unmapped reads from each library were merged together and then de novo assembled using Trinity Release v24.0 [22].

2.5. Transcriptome Assembly, Annotation, and Functional Enrichment

The raw reads underwent quality control (QC) processes, including the removal of linker sequences, adaptors, poly-N sequences, and low-quality reads. The criteria for QC involved eliminating adaptor sequences, retaining polymerase reads with a minimum length of 50 bp, and ensuring a minimum accuracy of 0.8 for polymerase reads. The SMRT Link Portal v9.0 was utilized for QC of the raw reads, followed by analysis using the Iso-Seq3.1.2 pipeline to obtain high-quality, full-length transcripts. To determine Iso-Seq isoform expression, RNA-Seq reads were aligned to the Iso-Seq isoforms derived from Cupcake scripts, using Kallisto. The full-length transcriptome, assembled using PacBio Iso-Sequence, served as the reference genome. Trinity software parameters were as follows: min kmer cov = 4, group pairs distance = 500, and the software was employed for the Illumina short-read assembly, which involved merging and extending the clean reads into longer fragments and transcripts. Subsequently, the merged collection of clean reads was assembled to generate the transcriptome data for S. nudus. To explore the biological functions of all unigenes, functional annotation was performed starting with ORF prediction. Complete ORFs with a length exceeding 300 bp were identified, and their corresponding protein sequences were predicted using TransDecoder software (TransDecoder Release v3.0.1). ORF annotation was conducted with Trinotate (v3.0.2) to achieve comprehensive annotation data. For annotation, the unigenes were aligned using BLAST programs against the NCBI nonredundant (NR) protein database, as well as the NT, PFAM, eggNOG, and KEGG databases at an E-value threshold of 1 × 10⁻⁵. Gene ontology (GO) terms were assigned using Blast2GO [23].

2.6. Differentially Expressed Genes and Enrichment Analysis

Mapping reads to the transcriptome assembly: The clean sequencing reads obtained from each of the three libraries (H, M, and L) were aligned back to the assembled transcriptome using Bowtie 2 software with the default parameters [24]. This alignment process allowed us to determine the origin of each read and associate it with specific genes. Identification of DEGs: The H–M, L–H, and M–L groups were compared using the RSEM software [25] to screen for differentially expressed sequences. RSEM was used to align the second-generation high-throughput sequencing data with the full-length transcripts and to quantify the transcripts. By comparing the expression levels of the genes among the different groups, we could identify the genes that showed significant differences in expression using DESeq2. To determine the DEGs, two criteria were applied: an adjusted p-value (FDR) threshold of less than 0.01 and a fold-change (FC) threshold of |log2(FC)| greater than 1. These criteria were set to define the significance of gene expression differences. The identified DEGs were subjected to functional and pathway enrichment analyses using the Gene Ontology (GO) database and the Kyoto Encyclopedia of Genes and Genomes (KEGG) database. To obtain the background gene set, the assembled full-length transcriptome was annotated using the closely related species database (Capitella teleta). After obtaining the background gene set and the gene list file, nonreference genome analysis could be performed by combining the internal function “enricher” of clusterProfiler. These analyses aimed to reveal the biological functions and pathways that were significantly enriched among the DEGs. By comparing the DEGs against known functional categories and pathways, we could gain insights into the potential roles and involvement of these genes in various biological processes. According to the trends in the DEGs’ expression in the H, M, and L regions, the DEGs’ expression in the three groups were clustered using the Mfuzz package in R, utilizing the fuzzy c-means algorithm [26]. This clustering analysis grouped the DEGs into different clusters based on their expression patterns. This helped in identifying subsets of the genes that exhibited similar expression profiles, potentially indicating coordinated regulation and functional relationships. In summary, the analysis involved mapping the reads, identifying DEGs, conducting functional and pathway enrichment analysis, and clustering the DEGs to gain a deeper understanding of the differentially expressed genes and their potential functional implications in S. nudus.

2.7. Quantitative Real-Time PCR Analysis

Total RNA was extracted from S. nudus in three different groups. To confirm the RNA-Seq results (of the selected DEGs), quantitative real-time PCR (qRT–PCR) was performed using AceQTMqPCR SYBR® Green Master Mix (Vazyme, Nanjing, China). Six genes (CGLTLL, HAHM, INFKBP, PBPAM1, AAMTTS, and OBNAALAD2) were selected from the common differentially expressed genes among the three comparisons of the H, M, and L sites for the qRT–PCR validation. Alpha-tubulin was used as an internal reference gene [27]. The primers for the quantitative real-time PCR were designed using Primer Premier 5.0 software, and gene-specific primers were used to detect the relative quantity of each gene. The reaction mixture’s total volume of 20 µL contained 10 µL of 2X SYBR Green PCR Master Mix, 2 µL of cDNA mix, 0.4 µL of each primer, and 7.2 µL of RNase free double-distilled H2O. The program for the RT-PCR was 95 °C for 5 min, followed by 45 cycles of 95 °C for 15 s and 60 °C for 60 s. A melting curve analysis was performed at the end of each PCR at 95 °C for 15 s, 60 °C for 60 s, and 95 °C for 15 s, continuously. The relative mRNA levels were calculated using the comparative delta-delta Ct method to normalize and calibrate the gene expression levels relative to the internal reference alpha-tubulin [28]. The genes and primer sequences can be found in Table S1.

3. Results

3.1. SMRT Sequencing, Illumina HiSeq Sequencing, and Assembly

Each library pool was sequenced independently on six SMRT cells of a Pacific Biosciences Sequel system generating a total of 21.72 Gbp of raw reads. Demultiplexing, stringent filtering, and quality control of the SMRT sequencing data were performed using SMRT Link. The PacBio Iso-Seq sequencing generated 501,988 polymerase reads, and 410,183 high-quality reads with a maximum length of 16.32 kbp and an N50 of 2.67 kbp were generated. The raw polymerase reads from the downstream machine were processed for sequencing junction removal and splitting to obtain the subreads, and 9,717,992 subreads_reads with an average_subreads length of 2192.14 bp and an N50 length of 2379 bp, and mean GC of 0.43 were generated. The full length nonchimeric reads including 5′ primer, 3′ primer, and polyA tail were further clustered into 21,154 consensus isoforms (single representatives of the expressed transcripts) and 21,020 high-quality isoforms with a mean length of 2578 bp. A total of 133 low-quality isoforms were obtained (Table 2).
We performed Illumina sequencing to evaluate the expression levels of genes in S. nudus to understand the molecular characteristics of the organisms in the different intertidal zones. Nine libraries containing three different experimental groups (H, M, and L) were built for the S. nudus transcriptome. The Illumina HiSeq sequencing generated 46,464,356 to 63,840,402 raw reads per library. After the trimming of the low-quality reads, final sets of 57,102,456 (H); 60,241,011 (M); and 53,687,205 (L) clean reads were obtained from each pool (Table 3). Among the clean reads, the Q30 percentages in each library were above 93%, which indicates high-sequencing quality. After assembly, the transcriptomes were represented by 105,259 unigenes with a minimum length of 201 bp and a maximum length of 35,077 bp. The transcriptome had an N50 of 1755 bp (Table 2).
The Benchmarking Universal Single-Copy Orthologs (BUSCOV3.0.1) evaluation resulted in a completeness score of 95.3%. This score was calculated by dividing the sum of complete and single-copy BUSCOs (S, 170) and the complete and duplicated BUSCOs (D, 119) by the total number of BUSCO groups searched (303).

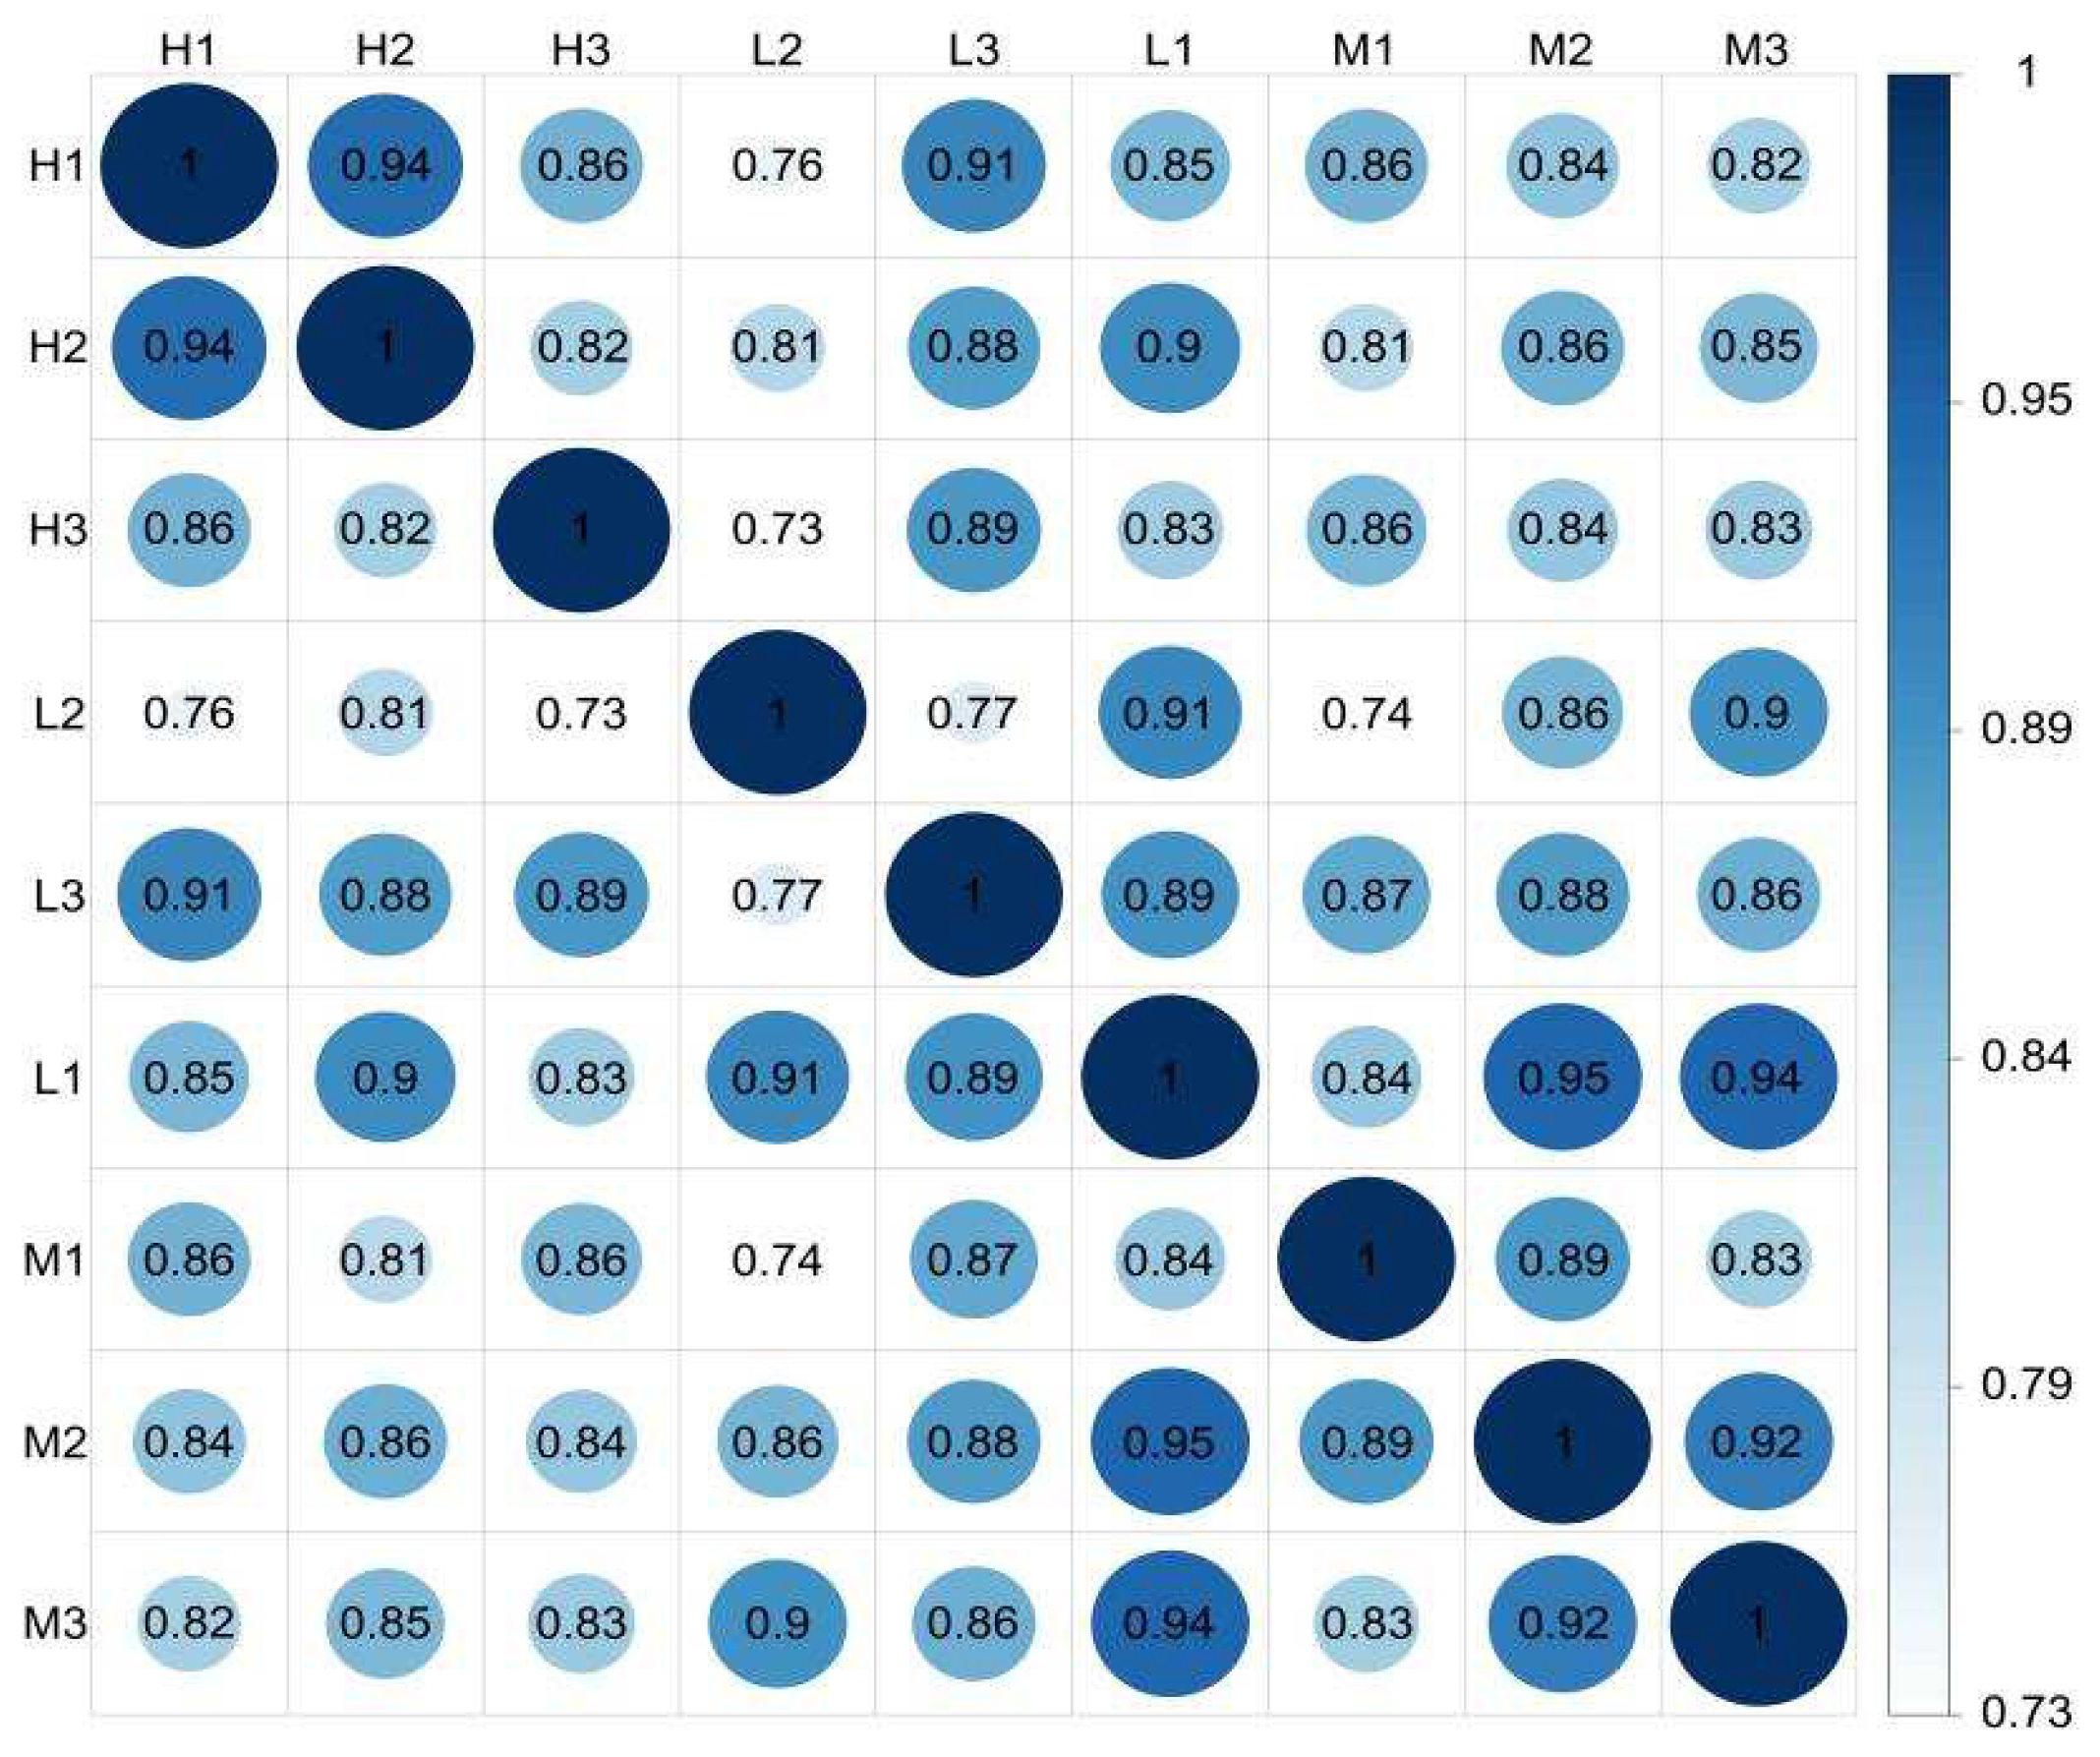
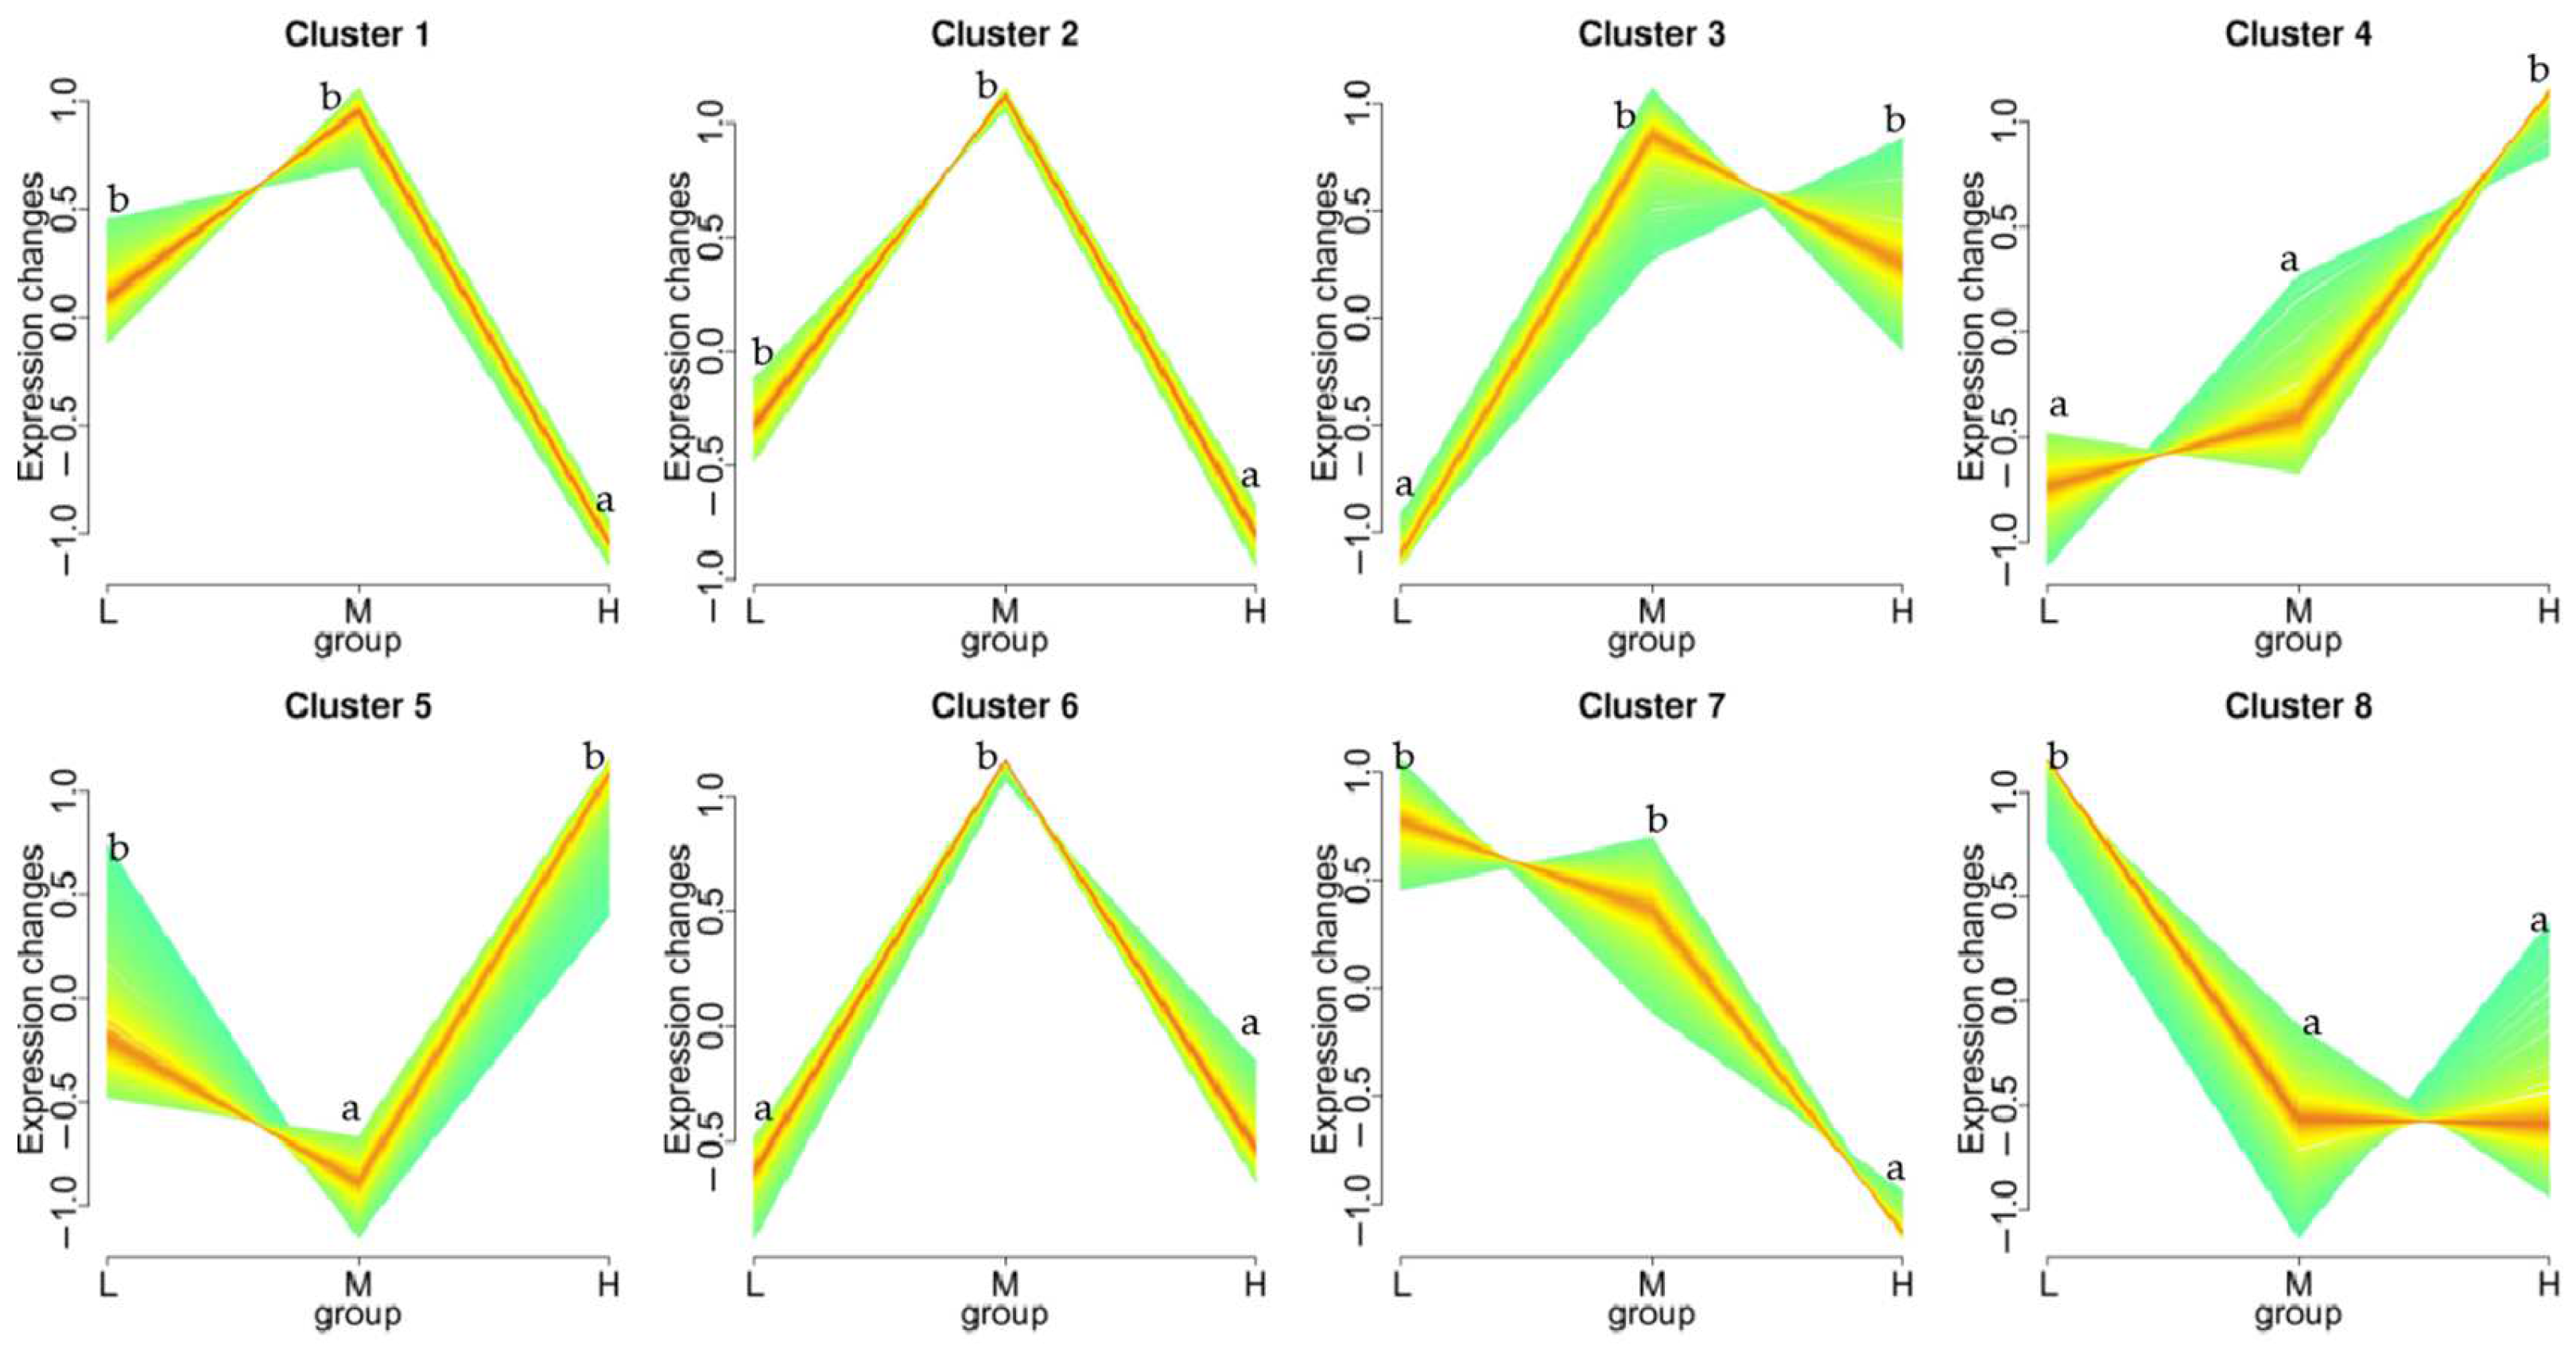
3.2. Expression Levels of Unigenes

The FPKM (fragments per kilobase of transcript sequence per millions base pairs sequenced) can be used to analyze the gene expression among different groups [29,30]. The FPKM correlation revealed that Sipunculus nudus from the three intertidal zones had the same gene expression profiles, and they belonged to the same species because most of the correlation coefficients were greater than 0.80 (p < 0.01). According to the gene expression levels of the unigenes, the correlations of the nine samples were analyzed (Figure 1). The FPKM density distribution is shown in Figure S1.

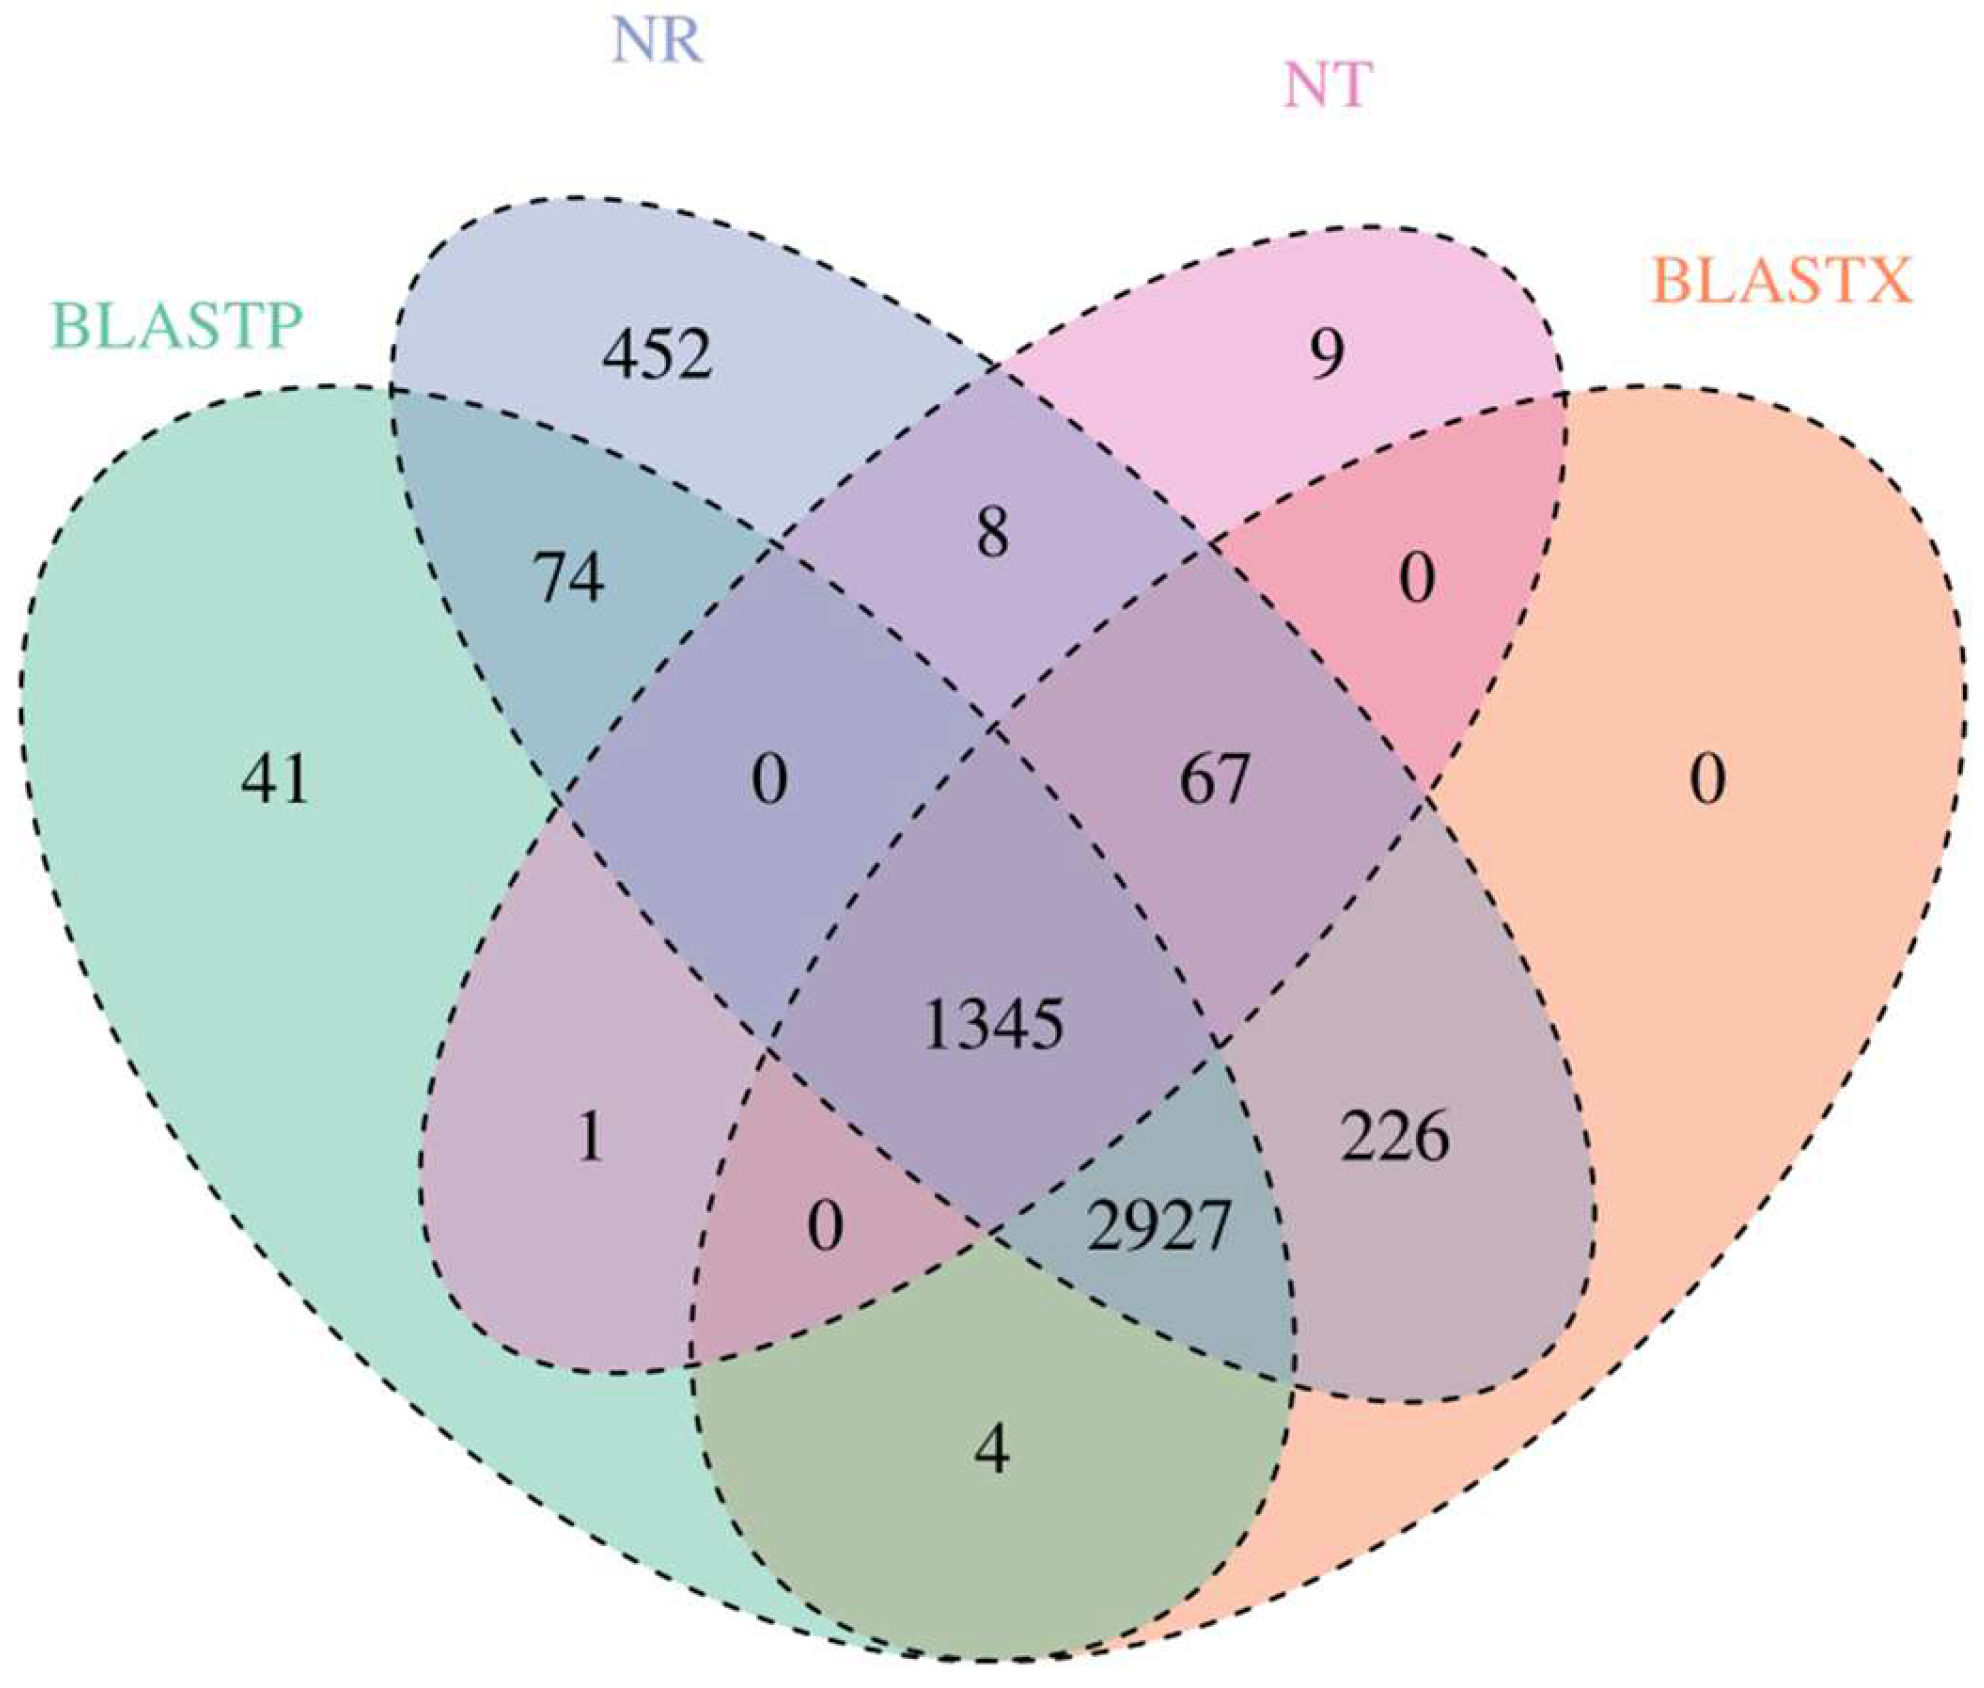
3.3. Gene Annotation and Function Classification

The BLAST algorithm was used to realign the high-quality isoforms with open reading frames against the NR, NT, BLASTP, and BLASTX databases. A total of 5099, 1430, 4392, and 4569 annotated unigenes were found in the NR, NT, BLASTP, and BLASTX groups, respectively (Figure 2). To further appraise the completeness of the RNA-Seq data, KOG classifications were performed with the annotated gene sequences, and most of the genes were classified into general function prediction only, signal transduction mechanisms and modification, protein turnover, and chaperones (Figure S2).
Between the H and M groups, GO terms were categorized into 49 subcategories in level 2, with 16 (32.65%) cellular component, 23 (46.94%) biological process, and 10 (20.41%) molecular function (Figure 3a). Between the L and H groups, GO terms were categorized into 47 subcategories in level 2, with 16 (34.04%) cellular component, 20 (42.55%) biological process, and 11 (23.40%) molecular function (Figure 3b). Within the “biological process” category in level 1, the “cellular process”, “metabolic process”, and “biological regulation” were the main subcategories in level 2. Within the “cellular component” category in level 1, the “cell part”, “organelle part”, and “organelle” were the main subcategories in level 2. Within the “molecular function” category in level 1, “binding”, “ion binding”, and “catalytic activity” were the main subcategories in level 2. In this study, 2553 genes, 3088 genes, and 260 genes were successfully matched to the GO database in the comparison groups H vs. M, L vs. H, and M vs. L, respectively. A total of 778 genes were upregulated and 1775 genes were downregulated for H vs. M, 1553 genes were upregulated and 1535 genes were downregulated for L vs. H, and 194 genes were upregulated and 66 genes were downregulated for M vs. L (Figure 3). However, there were no significant differences in the collagen fibers ratio among the groups (p > 0.05).

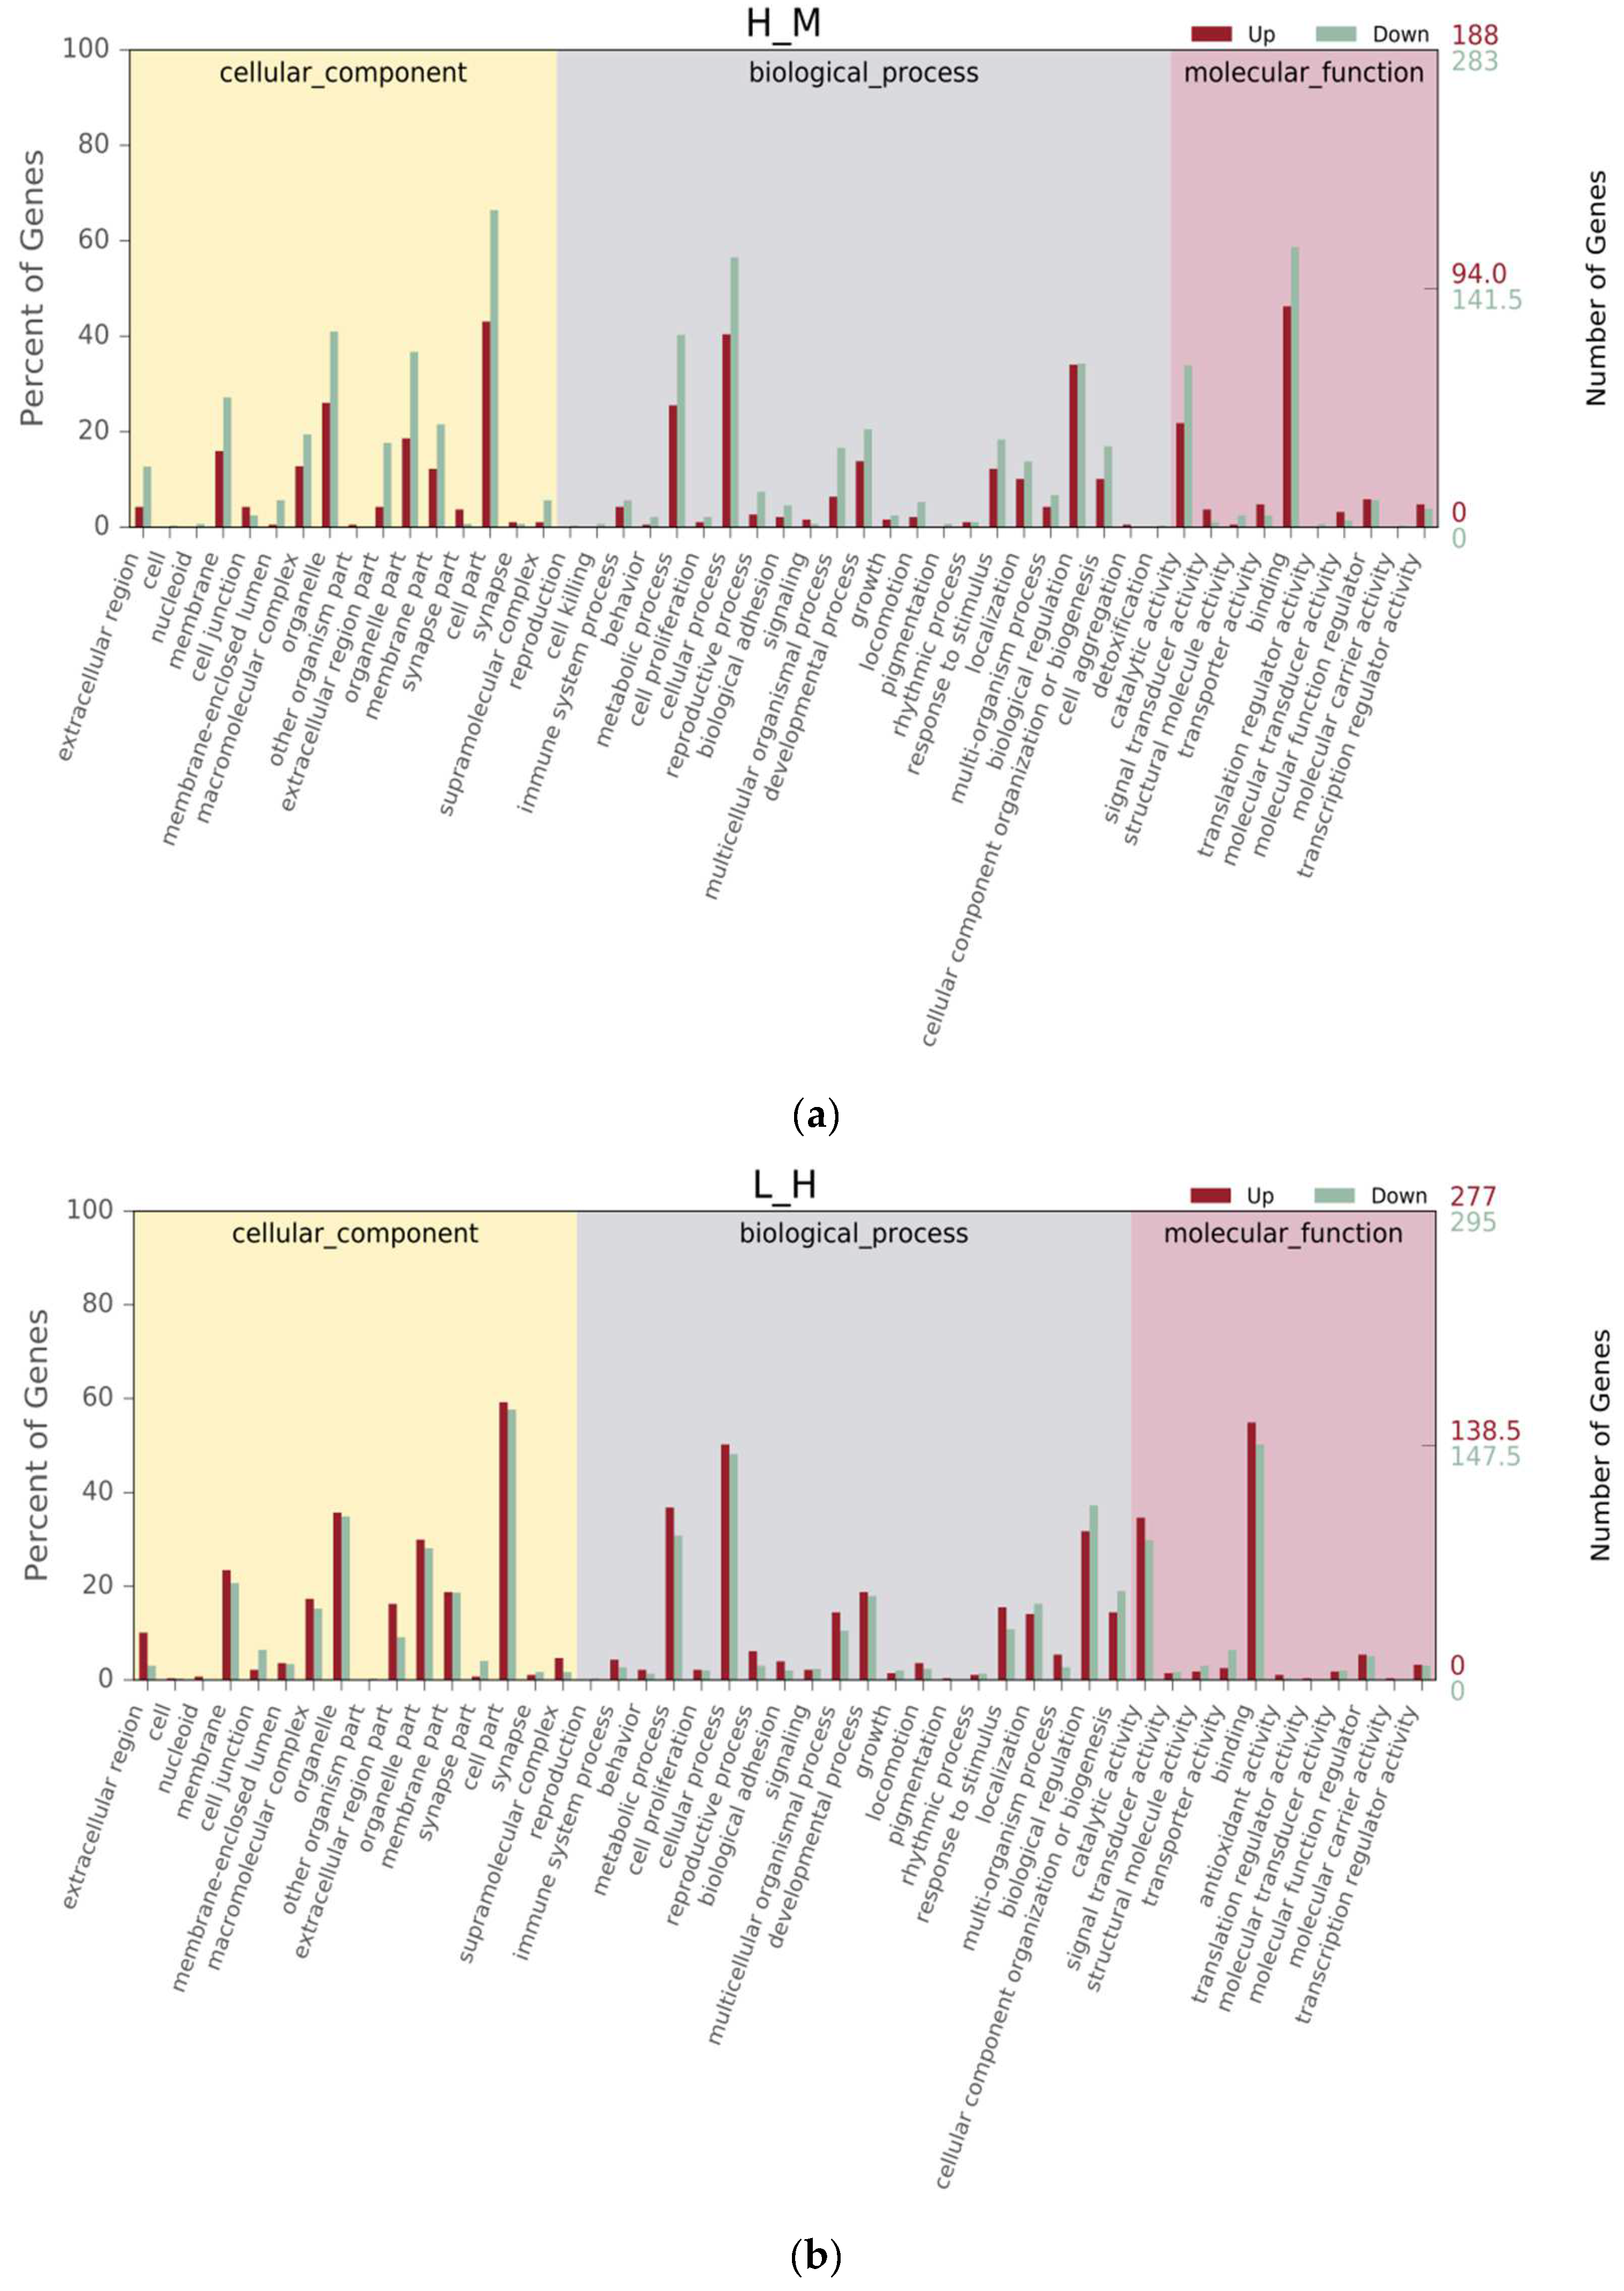
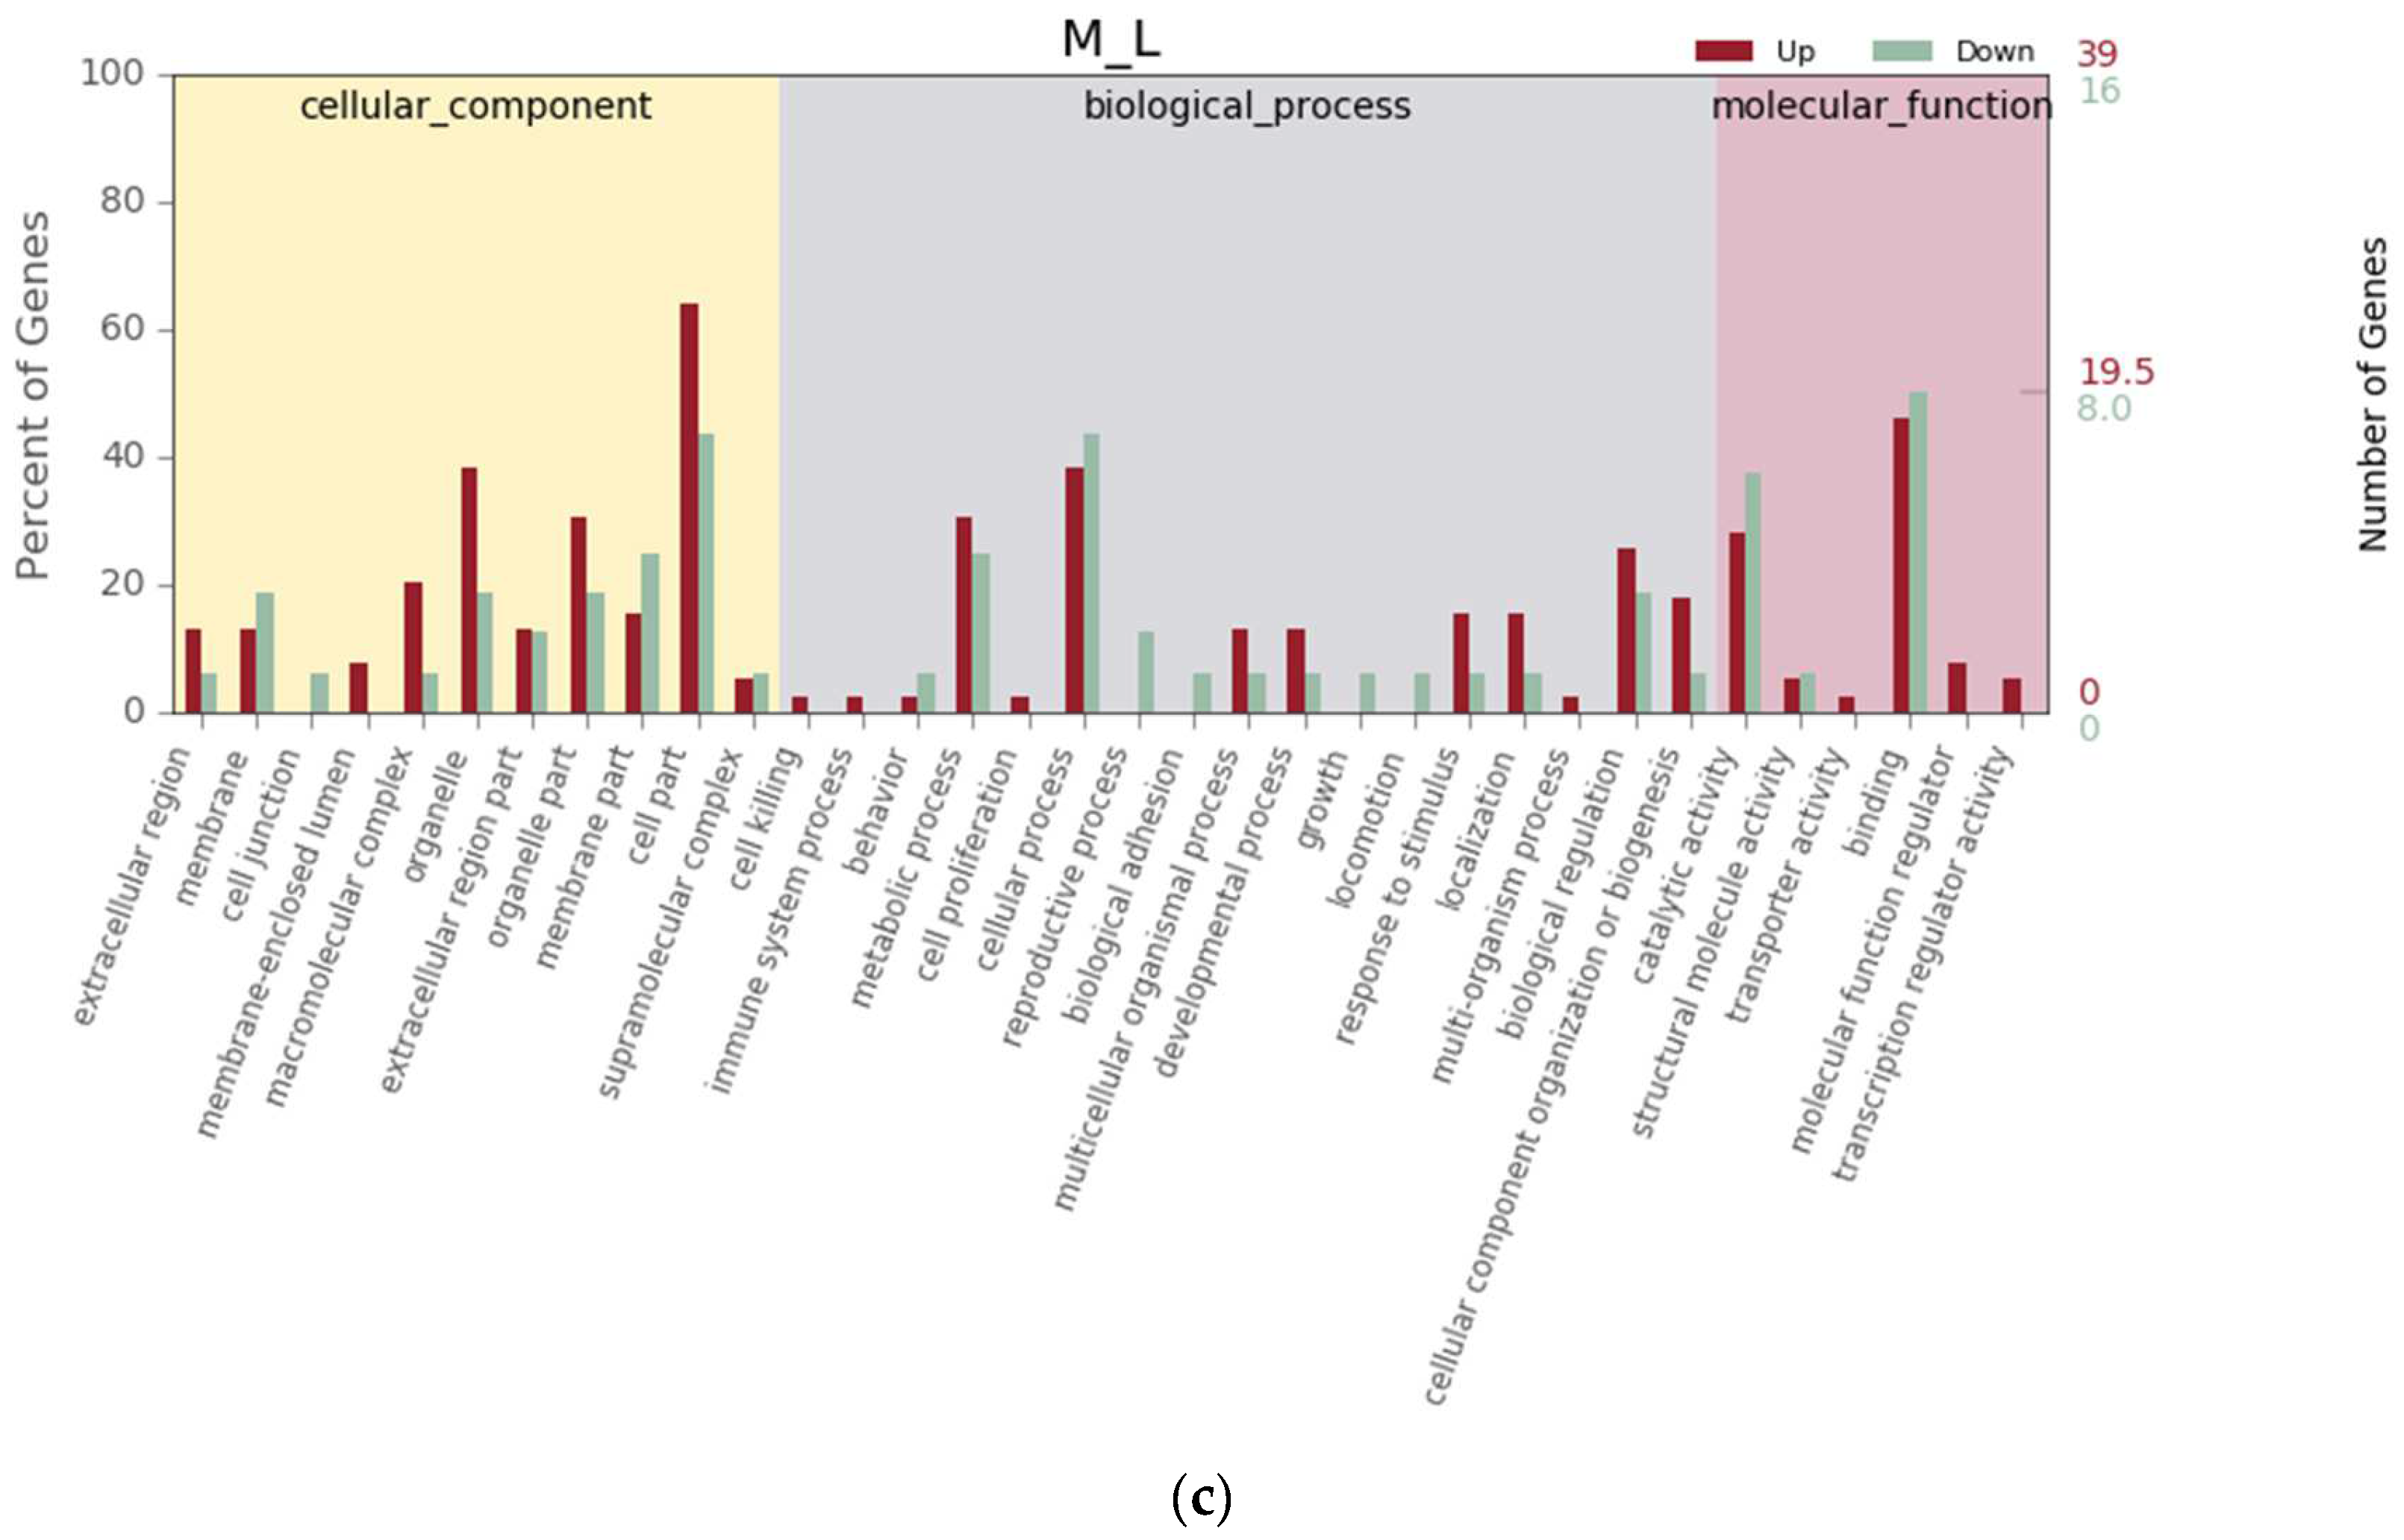
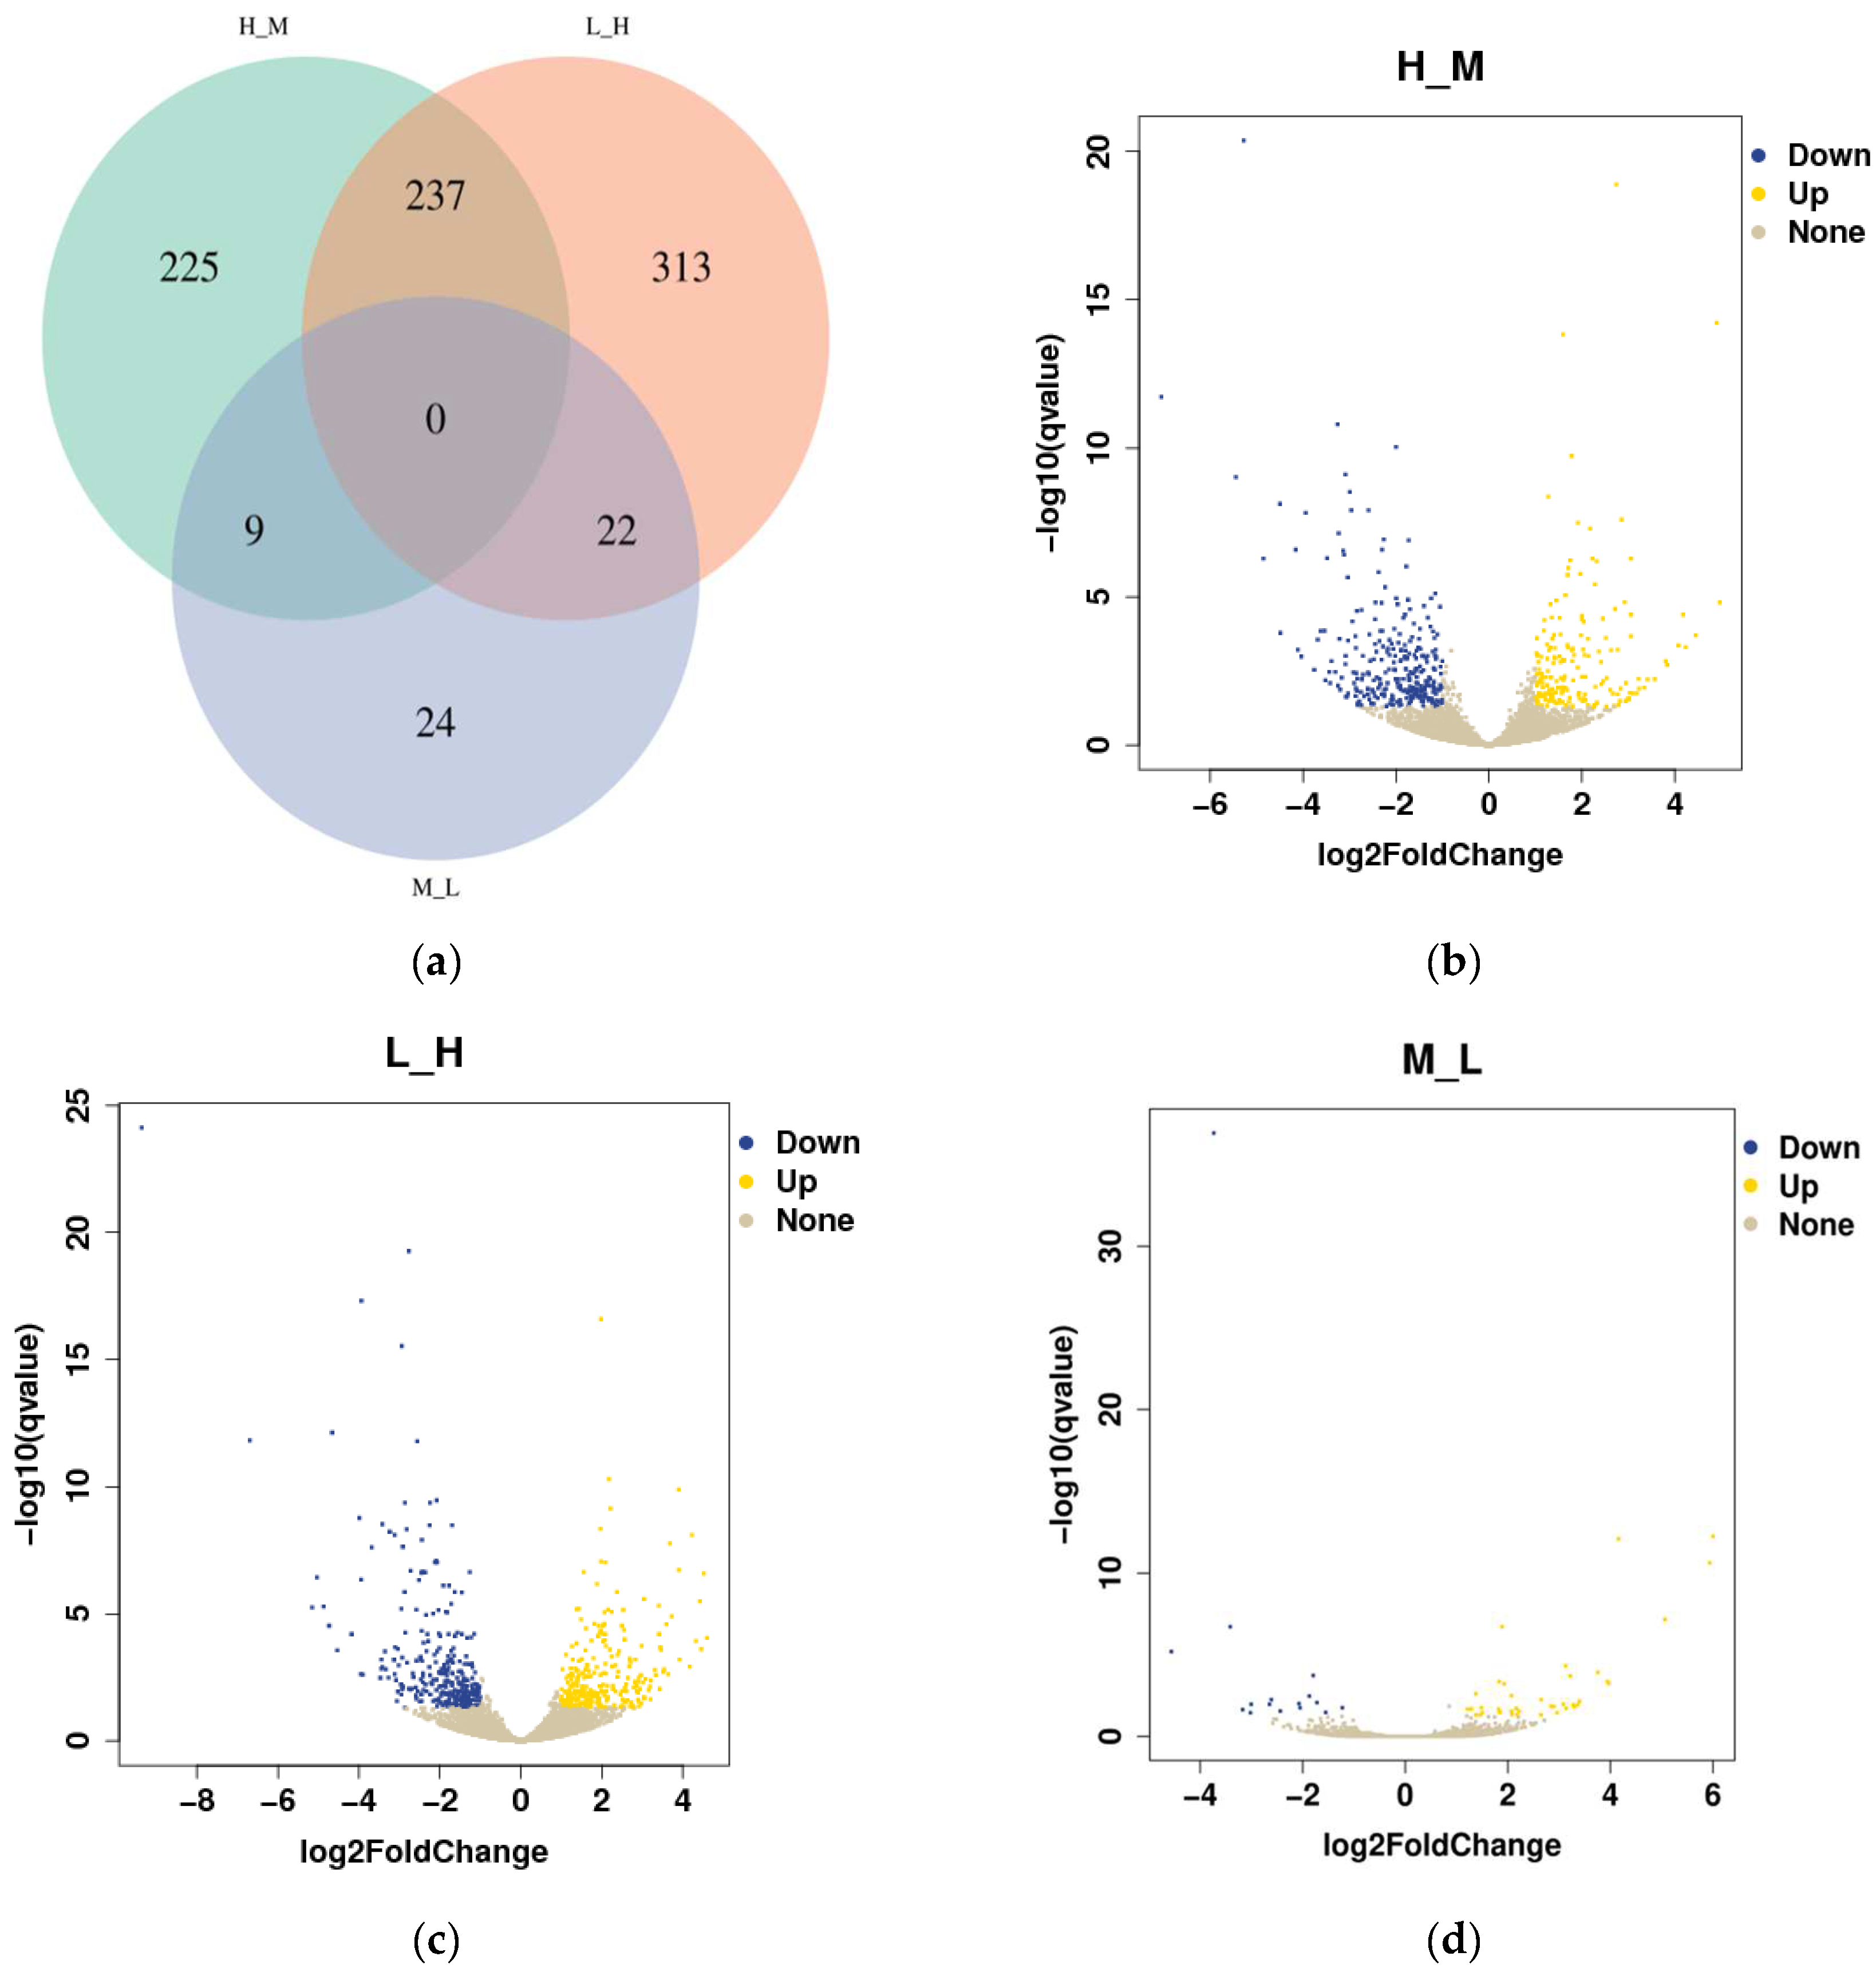
3.4. Differential Gene Expression Analysis

In this study, 45,625,705; 46,760,269; and 39,609,198 qualified reads were obtained from the different intertidal zones (H, M, and L). Setting q < 0.05 and |log 2 (fold change)| ≥ 1 as the cutoffs, the DEGs annotated in S. nudus from the different tidal flats were identified as upregulated or downregulated genes. As shown in the Venn diagram, a total of 830 DEGs were detected in S. nudus from the different tidal flats (Figure 4a). Of the DEGs, there were no shared differentially expressed genes among the three groups compared, while 237 genes were differentially expressed in both H vs. M and L vs. H. The number of up- and downregulated genes changed markedly between H and M (188 upregulated vs. 283 downregulated genes), while there was the same gene expression pattern between L and H (277 upregulated vs. 295 downregulated genes); however, there were fewer differential gene expressions between M and L (39 upregulated vs. 16 downregulated genes) (Figure 4b–d).
The trend analysis results show that the DEGs were grouped into eight gene expression patterns (Figure 5). In cluster 1 (78 genes) and 2 (15 genes), the DEGs were upregulated in groups L and M compared to group H, respectively. The DEGs were mainly related to tRNA ligase, elongation factor, heat shock protein 70, stress-70 protein, tubulin alpha-1 chain, and some hypothetical proteins that have been found in Capitella teleta. Moreover, there was an expression pattern with a significantly upregulated expression trend (cluster 7, 33 genes) with an increasing soaking time; however, there was no significant difference between the land M groups. The DEGs in cluster 7 were mainly related to the protein skeleton, low-density lipoprotein receptor, cytochrome, signal peptide, aldehyde dehydrogenase, and some hypothetical proteins (C. teleta). Cluster 4 (82 genes) was significantly upregulated in terms of an expression trend in groups L, M, and H with exposure time. The DEGs were mainly related to ubiquitin-protein ligase, galactosylceramide sulfotransferase, serine/threonine-protein phosphatase regulatory ankyrin, zinc finger protein, heat shock protein beta-1, Ras-related protein, dual-specificity MAP kinase phosphatase, AMP-activated protein kinase, and some hypothetical protein (C. teleta).

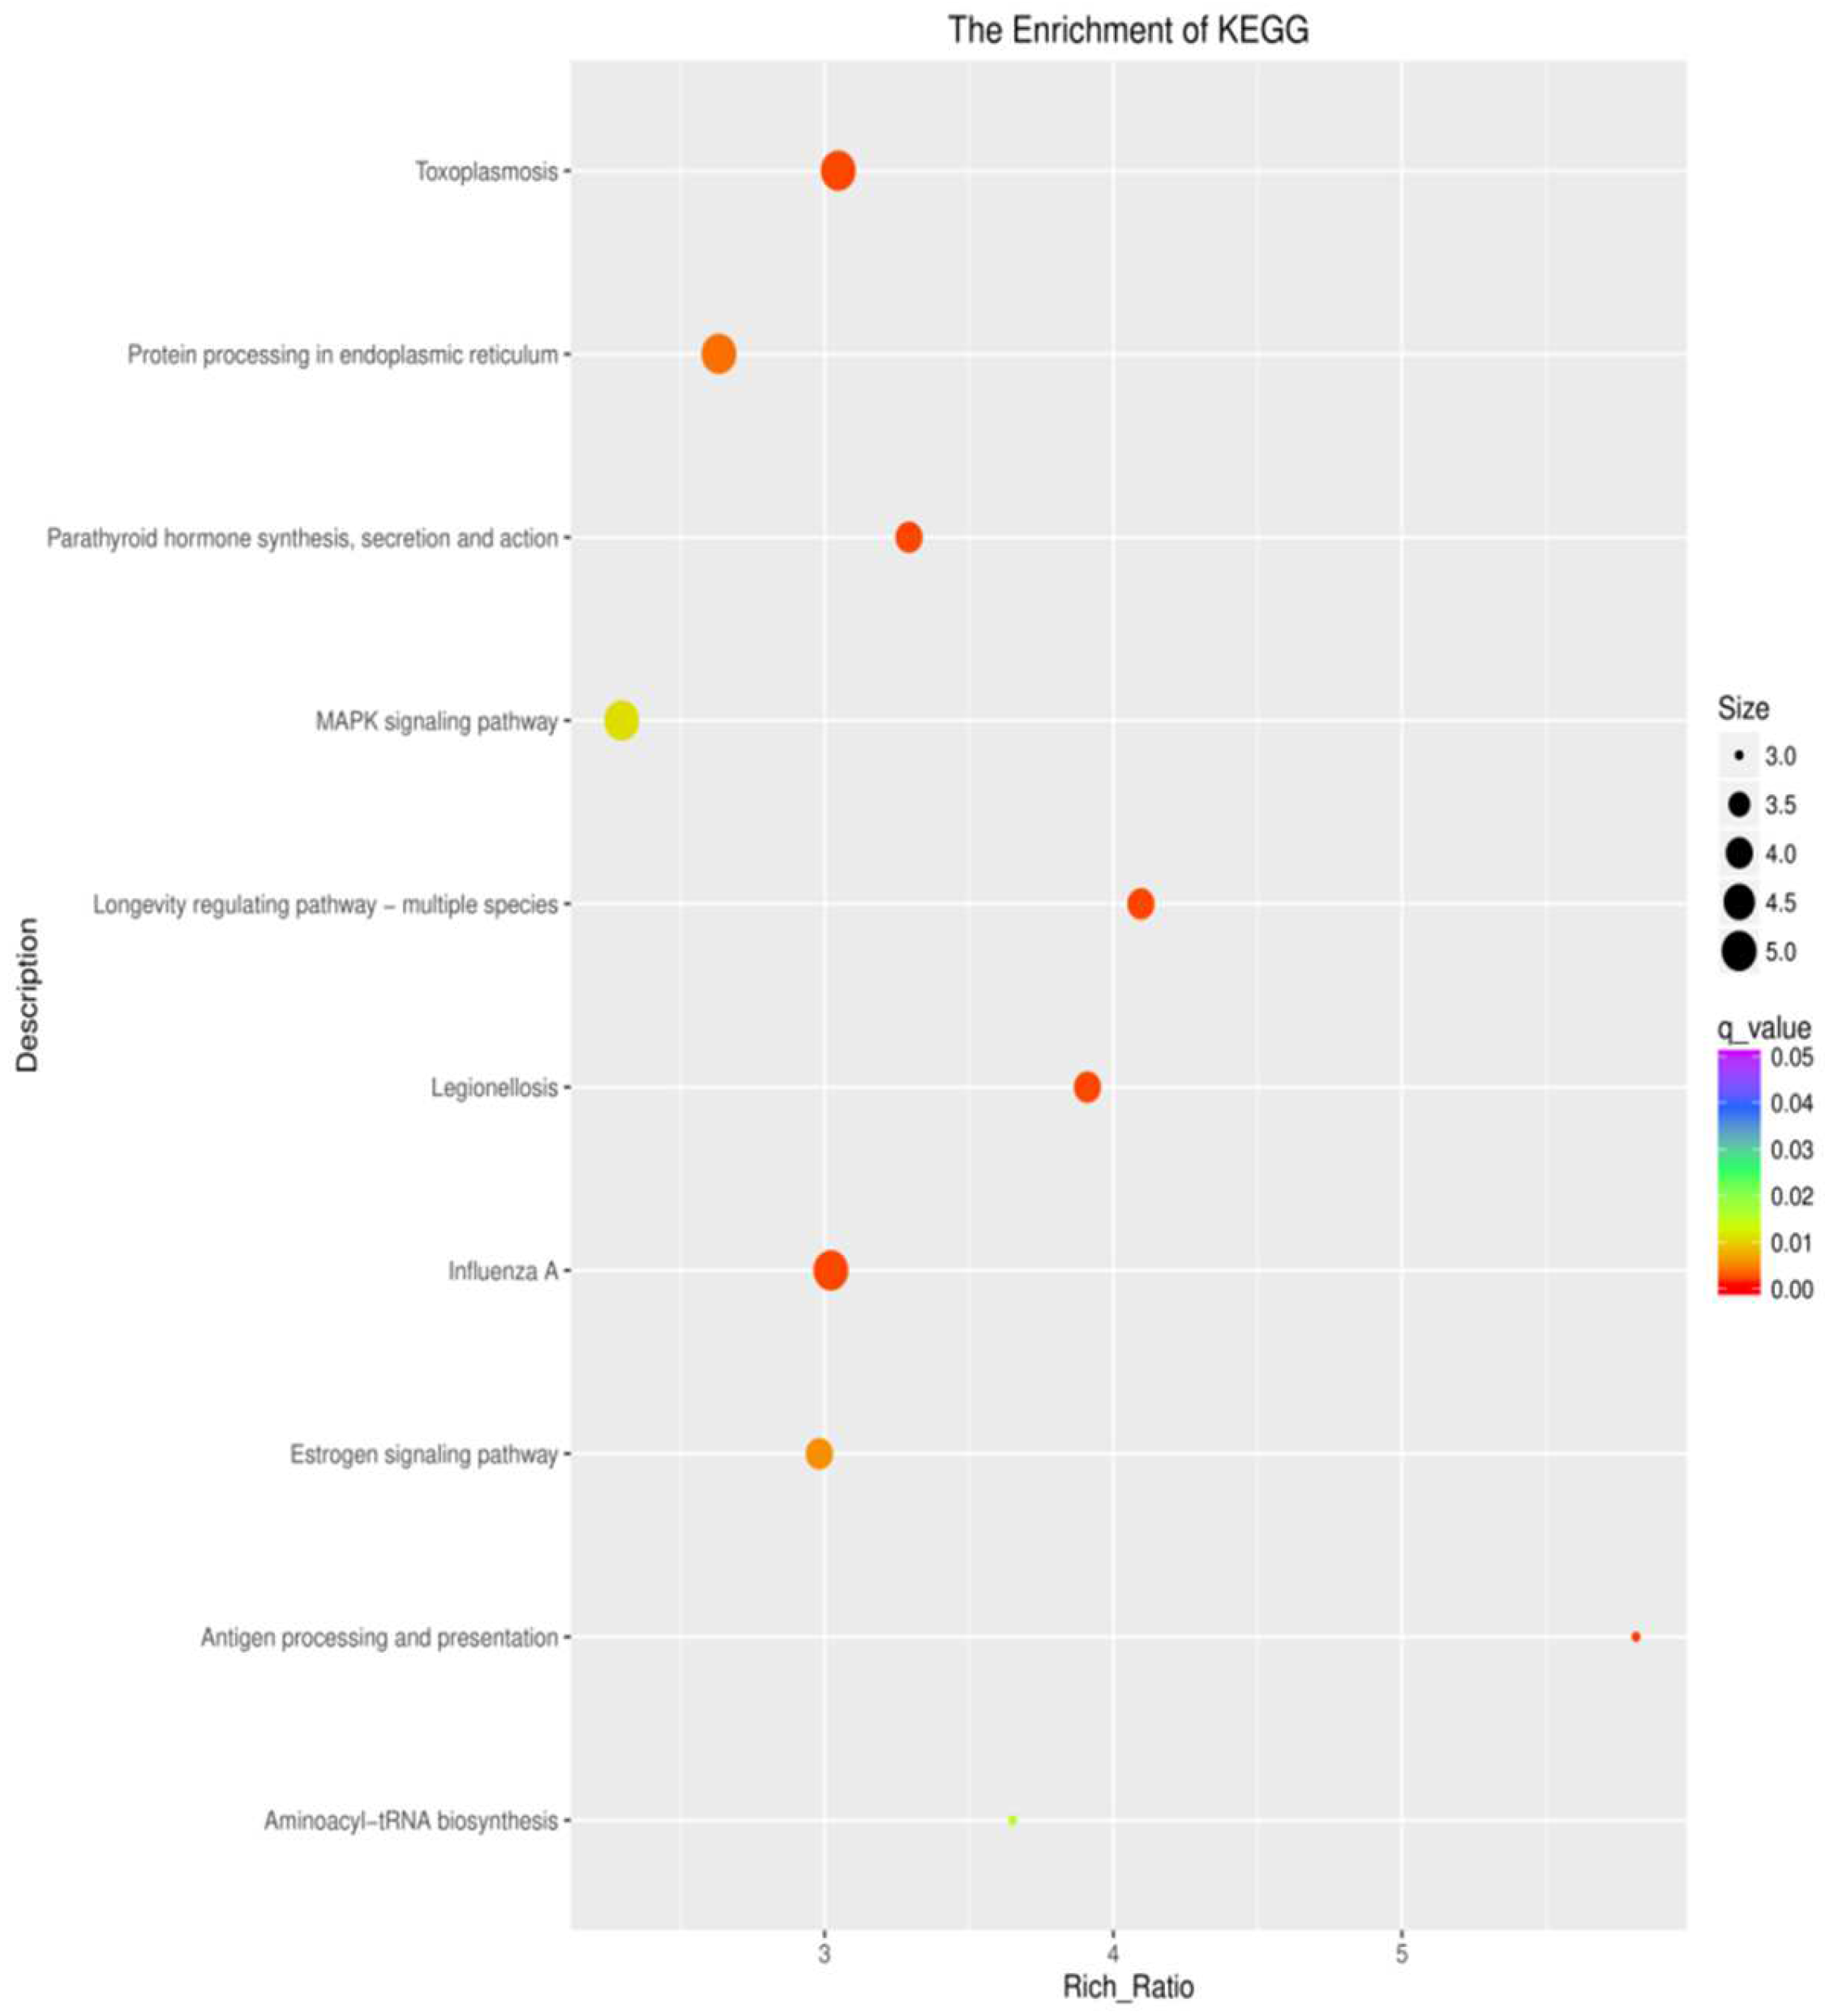
3.5. KEGG Pathway Enrichment Analysis of the Genes

To understand the regulation of the gene expression in response to the different intertidal zones, the DEGs were compared against the KEGG database for pathway enrichment in the comparison groups of H vs. M, L vs. H, and M vs. L. A total of 324 pathways were mapped. There were 25, 17, and 2 enriched pathways in the different comparison groups (H vs. M, L vs. H, and M vs. L) (p < 0.05), respectively. A number of immunity-related pathways were enriched in the H vs. M and L vs. H groups, such as pathways related to pathogens and protein synthesis, including legionellosis, influenza A, measles, toxoplasmosis, longevity-regulating pathway—multiple species, and aminocayl-tRNA biosynthesis. Pathways related to the cellular immune response and signaling, including antigen processing and presentation, and the MAPK signaling pathway were enriched in the H vs. M and L vs. H groups. Pathways related to hormones, including the estrogen pathway and oxytocin signaling pathway, were enriched in the H vs. M and L vs. H groups (Figure 6; Table S2). However, the above pathways were not enriched in the comparison group of M vs. L.
The DEGs in cluster 1 were mainly enriched in KEGG pathways related to disease, chemical damage, and immune responses (influenza A, legionellosis, antigen processing and presentation, aminocayl-tRNA biosynthesis, FoxO signaling pathway, longevity-regulating pathway—worm, protein processing in the endoplasmic reticulum, hippo signaling pathway, pathways in cancer, AMPK signaling pathway, RNA transport, tight junction, melanogenesis, RNA transport, and chemical carcinogenesis). The DEGs in cluster 2 were mainly enriched in KEGG pathways related to disease and immune responses (influenza A, legionellosis, antigen processing and presentation, measles, MAPK signaling pathway, FoxO signaling pathway, melanoma, toxoplasmosis, linoleic acid metabolism, estrogen signaling pathway, longevity-regulating pathway—multiple species, pathogenic Escherichia coli infection, Toll and Imd signaling pathway). The DEGs in cluster 7 were also mainly enriched in KEGG pathways related to disease and immune responses (legionellosis, influenza A, measles, toxoplasmosis, aminocayl-tRNA biosynthesis, Toll and Imd signaling pathway, NOD-like receptor signaling, and chemokine signaling pathway). However, the DEGs in cluster 4 were mainly enriched in KEGG pathways related to cell proliferation, differentiation and migration (MAPK signaling pathway, pathways in cancer, hippo signaling pathway, FoxO signaling pathway, chemokine signaling pathway, apelin signaling pathway, oxytocin signaling pathway, tight junction, bladder cancer, AMPK signaling pathway, linoleic acid metabolism, nonsmall cell lung cancer, and longevity-regulating pathway). The DEGs and function annotations are presented in Figure S4.
The legionellosis pathway was characterized by the presence of four differentially expressed genes (DEGs), namely, HSPA1, NFKBIA, eEF1A, and GroEL. These DEGs were found to be upregulated in both the M and L groups compared to the H group. In the influenza A pathway, the M and L groups exhibited the upregulation of seven DEGs (HSPA1, NFKBIA, UAP56, PRSS, MEK1, EIF2S1, and FURIN) and four DEGs (HSPA1, NFKBIA, UAP56, and PRSS), respectively. Regarding the measles pathway, the M group showed significant upregulation of three genes (HSPA1, NFKBIA, and EIF2S1), while the L group displayed upregulation of two genes (HSPA1 and NFKBIA). Similarly, in the toxoplasmosis pathway, the M and L groups exhibited upregulation of two genes (HSPA1 and NFKBIA), and one DEG (MAP3K7IP1) was found to be downregulated in the M tidal flat. In the longevity-regulating pathway—multiple species pathway, the M and L groups demonstrated upregulation of two DEGs (HSPA1 and HSP20) and two DEGs (HSPA1, SODC_PBCV1), respectively. Additionally, the M and L groups displayed downregulation of two DEGs (PRKAA and PRKAB) and three DEGs (PRKAA and AKTS1_HUMAN), respectively. In the aminoacyl-tRNA biosynthesis pathway, the M and L groups showed significant upregulation of six genes (QARS, TARS, SARS, RARS, KARS, and DARS) and five genes (QARS, TARS, SARS, RARS, and KARS) associated with tRNA synthetases, respectively. The antigen-processing and -presentation pathway exhibited significant upregulation of three genes (HSPA1, CANX, and HtpG) in both the M and L groups. In the MAPK signaling pathway, the M and L groups displayed significant upregulation of three genes (HSPA1, GADD45, and MEK1) and three genes (HSPA1, STMN1_CHICK, and ANGP4_BOVIN), respectively. Additionally, several DEGs (HSPB1, MKP, and MRAS) were significantly downregulated in the M group, while the L group showed downregulation of HSPB1, MKP, and MRAS. Within the estrogen pathway, the M group exhibited significant upregulation of four DEGs (HSPA1, HSP90A, MAP2K1, and FKBP4_5), and the L group showed upregulation of four DEGs (HSPA1, HSP90A, FKBP4_5, and CALL4_BOVIN). In the oxytocin signaling pathway, two genes (RHOA and MEK1) were significantly upregulated in the M group, while the L group showed upregulation of RHOA and CALL4_BOVIN. Several DEGs (PRKAG, PRKAB, EEF2K, and CAMK2) were significantly downregulated in the M group, and in the L group, the downregulated DEGs included PRKAG, EEF2K, CAMK2, CALM_CIOIN, RYR1_RAT, and ADCY9_MOUSE (Table S2). Among the DEGs, HSPA1, MEK1, NFKBIA, GADD45, HSP90A, and CANX, which belonged to clusters 1, 2, and 7, appeared most frequently in the comparison groups (H vs. M, M vs. L, and L vs. H). These DEGs are presented in Table S3.

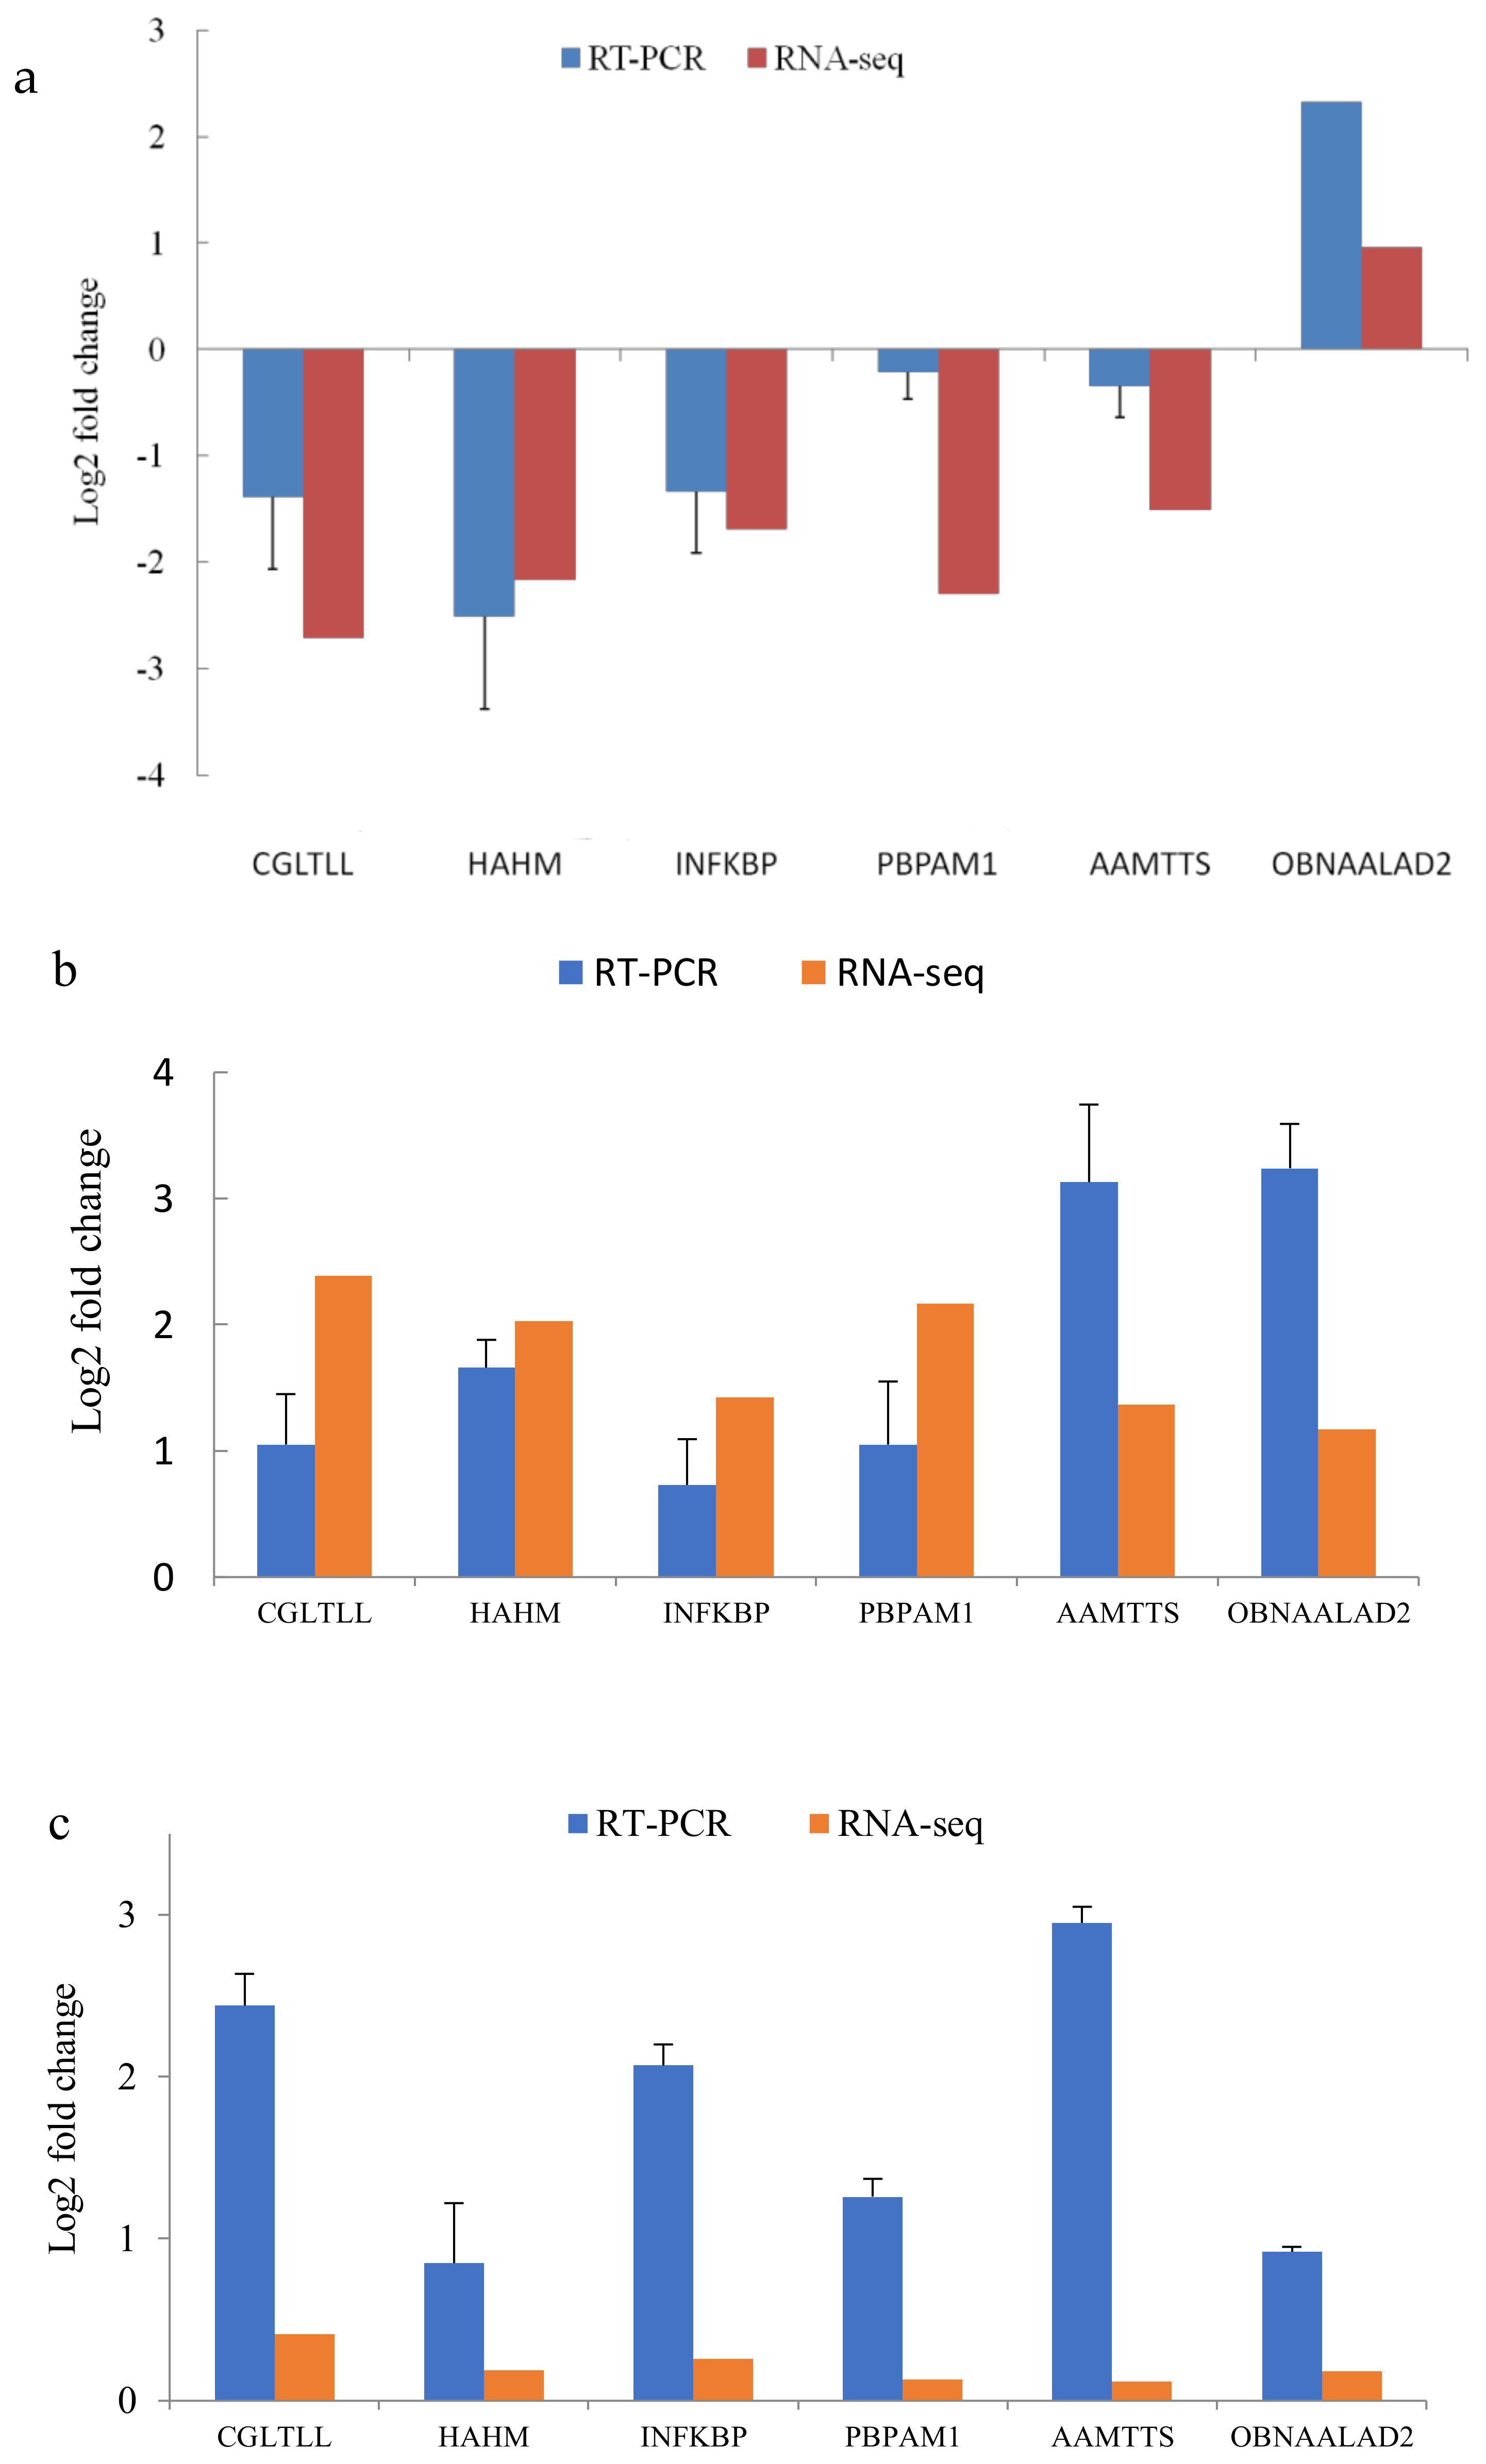
3.6. Validation of the Transcriptome with qRT–PCR

To verify the Illumina sequencing results, six genes were selected at random for further confirmation using qRT–PCR. In the selection process of these genes, the main aim was to verify the validity of the results. As shown in Figure 7, the verification results indicate that there was no deviation in the expression patterns among methods, as all tested genes were consistent with the data obtained from the transcriptome analysis with only slight variations in the expression levels.

4. Discussion

4.1. Transcriptomic Characteristics of Sipunculus nudus in Tidal Flats

Sipunculus nudus, similar to other intertidal organisms, lives in an environment that alternates between aquatic and terrestrial due to the rise and fall of the tide [17]. Moreover, peanut worms are widely distributed in intertidal flats, and they endure different habitats and different cycles of immersion and emersion during their growth process. Thus, there might be some changes at the genetic level in S. nudus from different intertidal environments. In the present study, the DEGs and KEGG pathways related to the immunity and growth of S. nudus from different intertidal zones were first analyzed using a combination of the SMRT platform of Pacific Biosciences and Illumina RNA-Seq. In total, we found 830 DEGs (upregulated genes and downregulated genes) in the body wall of S. nudus from different intertidal zones. The DEGs were further subjected to KEGG pathway enrichment analysis to assist in understanding the potential molecular mechanisms that underlie the response to different intertidal zones. Because of the similar environments of the M and L tidal flats, as well as the fewer DEGs found between the M and L groups, the results of the comparison groups of H vs. M and L vs. H were mainly analyzed. In the GO analysis, the DEGs were mainly involved in cell-related categories, which suggests that S. nudus from the M and L groups underwent relatively strong changes to enhance cell function and resist environmental changes. In the KEGG analysis, several pathways related to pathogens, protein synthesis, and cellular immunity were enriched in the comparison groups H vs. M and L vs. H (p < 0.05). Other studies have indicated that pathways related to influenza A, legionellosis, and other pathways related to disease or immunity in fish and shrimp could be induced by pathogens or heavy metals [31,32,33,34]. Influenza A, legionellosis, and measles are related to immune and infectious diseases, and these pathways can be activated by pathogen infections under acute thermal stress [35]. The above pathways were enriched in the present study, which indicates that these pathways might play an important role in the response of S. nudus to the different intertidal environments. However, enriched pathways related to muscle contraction were not observed in the present study. Moreover, there was no significant difference in the ratio of collagen fibers III among the three groups (Figure S3).
A previous study also showed that pathways related to legionellosis and influenza A were enriched in the larval period of S. nudus compared to the pelagospheric period [36]. Moreover, the enriched KEGG pathways, such as influenza A and measles, were found in R. philippinarum but not in Crassostrea gigas, Pinctada fucata, or Patinopecten yessoensis from their growth environment [37]. Perhaps shellfish living in sediment are more susceptible to the effects of pathogens than attached shellfish. Previous studies showed that there were multiple species of pathogens in estuarine or coastal sediment [38,39]. Sediments with greater organic matter content and lower porosity harbored greater numbers of nonculturable bacteria, and the abundance of bacteria confirms the role of sediments in the accumulation and persistence of fecal bacteria [40]. In the present study, the differentially expressed genes (DEGs) associated with disease-related pathways, such as influenza A, legionellosis, measles, and toxoplasmosis, exhibited upregulation in the M and L intertidal zones, and higher organic matter (Table 1) and lower light occurred in the sediments of the M and L zones than that in the H zone. The environmental situation may be responsible for the higher relative abundance of pathogens in the M and L zones.
Similar to other invertebrates, S. nudus depends on innate immune responses to deal with environmental stressors. MAPK pathways are highly conserved across animal taxa and occupy a central position in various fundamental biological processes [41,42], and these pathways are considered to play a vital role in the worm immune response because of their function in regulating bacterial infections, stress responses, and longevity [43]. In addition, the MAPK pathway can control germline aging, and it can be used to attenuate the rate of the decline in oogenesis quality [44]. In the present study, the HSPA1 gene in the MAPK signaling pathway was significantly upregulated in both the M and L groups. In addition, several DEGs (HSPB1, MKP, and MRAS) were downregulated in the M and L groups compared to group H. These results indicate that S. nudus may increase immune system activity by enhancing the MAPK signaling pathway in response to the threat of pathogens or the environment in the tidal flat. Another significantly enriched pathway is aminoacyl-tRNA synthesis; its function is to precisely match amino acids with the tRNA containing the corresponding anticodon [45]. A previous study found that the aminoacyl-tRNA biosynthesis pathway in gastric tissue was markedly upregulated in the pathogenic state [46]. In the present study, the DEGs upregulated in this pathway in the M and L groups indicate that S. nudus may increase physiological activity by enhancing the aminoacyl-tRNA synthesis pathway during the immune response.

4.2. Analysis of Differentially Expressed Genes in KEGG Pathways

Several genes (HSPA1, MEK1, NFKBIA, GADD45, HSP90A, and CANX) assigned to clusters 1, 2, and 7 appeared most frequently in the comparison groups. In the present study, HSPA1 was upregulated in the M and L groups compared to the H group, and it was differentially expressed in most of the top nine enriched pathways. HSPA1 belongs to the Hsp70 protein family, which has often been reported to be relevant for resisting harmful environments [32], and the expression level of HSPA1 increases when aquatic animals are subjected to bacterial infection, parasites (C. irritans), thermal stress, and heavy metal toxicity [31,33,34]. The expression level of Hsp70-binding protein (HSPBP1) increases when mussels experience higher temperatures in rocky intertidal habitats [12]. This study demonstrated that HSPA1 is sensitive in S. nudus and can be used to predict the conditions of the habitat or the survival state. The overexpression of HSPA1 showed that S. nudus living in the M and L tidal flats was exposed to more severe environments than S. nudus living in the H tidal flat. Similar results were found for the NFKBIA gene, which was enriched in the influenza A, legionellosis, measles, and toxoplasmosis pathways; moreover, it was also upregulated in the M and L groups compared with the H group. The NFKBIA gene encodes one piece (the alpha subunit) of the IKK protein complex, which is considered to correlate with the inflammation responding to Plesiomonas shigelloides in the southern catfish [47]. The gene was also found in connection with the pathogenesis of human cancer [48]. We speculate that the NFKBIA gene might be an important gene for the S. nudus response to severe environmental conditions or pathogen infection. Eukaryotic translation elongation factor 1A (eEF1A) is one of the most abundant protein synthesis factors. eEF1A is responsible for the delivery of all aminoacyl-tRNAs to the ribosome, except for initiator and selenocysteine tRNAs [49]. It has a well-defined role in protein synthesis, and it regulates HSP70 expression and thermotolerance [50]. Overexpression of eEF1A has been proposed to be related to cell proliferation and cancer development [51]. In the present study, eEF1A was upregulated in peanut worms from the M and L tidal flats. The results indicate that the worms might produce more protein in response to sedimentary environments that have lower porosity and greater organic matter or even a high abundance of pathogens. MEK1 and GADD are essential for the regulation of proliferation and apoptosis; MEK1 is activated by various environmental stresses and proinflammatory cytokines [52], and GADD is induced by various stimuli, including DNA damage and ER stress [53]. In the present study, MEK1 and GADD were upregulated in the M group compared to the H group, although they participated in different pathways. MEK1 was enriched in the influenza A, MAPK, FoxO signaling pathways, as well as the estrogen signaling pathway, and GADD was enriched in the MAPK and FoxO signaling pathways. According to the expression trends, the DEGs assigned to clusters 1, 2, and 7 were upregulated, and the DEGs responded to the unsuitable environment in the M and L tidal flats. In addition, some DEGs (PRSS, UAP56, FURIN, and EIF2S1) showed similar trends and were enriched in the influenza A pathway, and they were upregulated in the M tidal flat compared to the H tidal flat. The results indicate that S. nudus living in the M tidal flat might suffer from poor environmental conditions or exposure to pathogens. Furthermore, the higher abundances of legionellosis, Escherichia coli shigella, and Stenotrophomonas were found in the gut of S. nudus from the same tidal flat [54]. The tidal flat might be contaminated to some extent, and the gut provided more suitable conditions for these pathogens, and there might already be adaptation between S. nudus and pathogens.
Most of the DEGs were upregulated in the M or L tidal flat. However, some DEGs (MKP, MRAS, and HSPB1) were upregulated in S. nudus from the H tidal flat, and these DEGs were mainly differentially expressed in the MAPK signaling pathway. MKP (dual-specificity MAP kinase phosphatase) provides a complex negative regulatory network that shapes the duration, magnitude, and spatiotemporal profile of MAP kinase activities in response to both physiological and pathological stimuli [55]. Reactive oxygen species (ROS) can kill or inhibit biological cells [56]; moreover, ROS in moderation can improve the expression level of MKP-1 [57]. We speculated that S. nudus and the sediment from the H tidal flat were exposed to much more ROS than those in the M and L tidal flats because of prolonged exposure to ultraviolet rays. In the present study, the sandy sediment in the H zone was soft with good permeability, and the sediment had a longer exposure period in the open air. The above factors can increase the ROS in the H tidal flat. According to our findings, enhancing the soil porosity or utilizing more ROS may improve the physiological state of S. nudus, consequently boosting its growth performance.

5. Conclusions

The worms from the different tidal flat zones have different molecular bases of physiological responses to the different environmental conditions. The DEGs of S. nudus were mainly enriched in the KEGG pathways related to disease and immune responses rather than thermal stress, calcification, and pH regulation, which is closely related to their special living habitat. Because of the potential contamination from the sediments and the differences in the sediments itself, the DEGs related to tides and, consequently, the environmental consequences could not be accurately inferred. However, worms living in sediments (M and L) with lower porosity and greater organic matter content might encounter even more severe conditions than those in the high tidal flats (H) although situated within the same farming zone.

Supplementary Materials

The following supporting information can be downloaded at: https://www.mdpi.com/article/10.3390/biology12091182/s1, Figure S1: Violin diagram of the expression quantity of unigenes of S. nudus from groups H, M, and L (n = 3); Figure S2: KOG function classification of transcripts. Figure S3: Sirius staining of the musscle of S. nudus. Table S1: Names and primer sequences of genes used for quantitative real-time PCR analysis. Table S2: The enriched KEGG pathways and DEGs in the H vs. M and L vs. H groups. Table S3: Table S3. The annotated genes in the top 10 pathways from KEGG enrichment analysis. Table S4: The DEGs and function annotation present in clusters 1, 2 and 7.

Author Contributions

Conceptualization, J.L. and R.H.; Data curation, S.P.; Formal analysis, J.L., J.W. and B.S.; Investigation, J.L., C.Z. and T.L.; Funding acquisition: J.L., C.Z. and H.H.; Methodology, J.L. and S.P.; Writing—original draft, J.L.; Writing—review and editing, R.H., C.Z. and H.H. All the authors contributed to the manuscript and read and approved the submitted version. All authors have read and agreed to the published version of the manuscript.

Funding

This work was supported by the Natural Science Foundation of Guangdong Province (2021A1515010744); Research and Development Program in Key Areas of Guangdong Province (2020B0202010009); Natural Resources Affairs Special Fund Project of Guangdong Province (2023-199001); National Natural Science Foundation of China (41606137); Central Public-Interest Scientific Institution Basal Research Fund, South China Sea Fisheries Research Institute, CAFS (2022XK03); and Central Public-Interest Scientific Institution Basal Research Fund, CAFS (2020TD15).

Institutional Review Board Statement

Not applicable.

Informed Consent Statement

All work undertaken in this study complied with the Committee on Laboratory Animal Welfare and Ethics of South China Sea Fisheries Research Institute, Chinese Academy of Fishery Sciences (nhdf 2023-01). The worms in this study were treated with an alcoholic solution before dissection to reduce their pain depending on the 3Rs principle of animal welfare.

Data Availability Statement

Raw sequence data were submitted to the NCBI Sequence Read Archive with accession number: PRJNA916931.

Conflicts of Interest

The authors declare no conflict of interest.

References

  1. Zhang, G.; Fang, X.; Guo, X.; Li, L.; Luo, R.; Xu, F.; Yang, P.; Zhang, L.; Wang, X.; Qi, H.; et al. The oyster genome reveals stress adaptation and complexity of shell formation. Nature 2012, 490, 49–54. [Google Scholar] [CrossRef] [PubMed]
  2. Dong, Y.W.; Liao, M.L.; Meng, X.L.; Somero, G.N. Structural flexibility and protein adaptation to temperature: Molecular dynamics analysis of malate dehydrogenases of marine molluscs. Proc. Natl. Acad. Sci. USA 2018, 6, 1274–1279. [Google Scholar] [CrossRef]
  3. Fields, P.A.; Eraso, A. A year in the salt marsh: Seasonal changes in gill protein expression in the temperate intertidal mussel Geukensia demissa. Mar. Environ. Res. 2020, 161, 105088. [Google Scholar] [CrossRef] [PubMed]
  4. Liao, M.L.; Dong, Y.W.; Somero, G.N. Thermal adaptation of mRNA secondary structure: Stability versus lability. Proc. Natl. Acad. Sci. USA 2021, 45, e2113324118. [Google Scholar] [CrossRef]
  5. Nie, H.T.; Jiang, K.Y.; Li, N.; Li, D.D.; Yan, X.W. Transcriptomic analysis of Ruditapes philippinarum under aerial exposure and reimmersion reveals genes involved in stress response and recovery capacity of the Manila clam. Aquaculture 2020, 524, 735271. [Google Scholar] [CrossRef]
  6. Li, Q.; Gu, L.L.; Song, J.X.; Li, C.J.; Zhang, Y.H.; Pang, Y.Z.; Zhang, B. Physiological and transcriptome analyses highlight multiple pathways involved in drought stress in Medicago falcata. PLoS ONE 2022, 17, e0266542. [Google Scholar] [CrossRef]
  7. Nancollas, S.J.; Todgham, A.E. The influence of stochastic temperature fluctuations in shaping the physiological performance of the California mussel, Mytilus californianus. J. Exp. Biol. 2022, 14, 243729. [Google Scholar] [CrossRef]
  8. Rivera, H.E.; Aichelman, H.E.; Fifer, J.E.; Kriefall, N.G.; Wuitchik, D.M.; Wuitchik, S.J.S.; Davies, S.W.A. A framework for understanding gene expression plasticity and its influence on stress tolerance. Mol. Ecol. 2022, 6, 1381–1397. [Google Scholar] [CrossRef]
  9. Liu, Y.L.; Li, L.; Huang, B.Y.; Wang, W.; Zhang, G.F. RNAi based transcriptome suggests genes potentially regulated by HSF1 in the Pacific oyster Crassostrea gigas under thermal stress. BMC Genom. 2019, 20, 639. [Google Scholar] [CrossRef]
  10. Evans, T.G.; Chan, F.; Menge, B.A.; Hofmann, G.E. Transcriptomic responses to ocean acidification in larval sea urchins from a naturally variable pH environment. Mol. Ecol. 2013, 22, 1609–1625. [Google Scholar] [CrossRef]
  11. Pespeni, M.H.; Barney, B.T.; Palumbi, S.R. Differences in the regulation of growth and biomineralization genes revealed through long-termcommon-garden acclimation and experimentalgenomics in the purple sea urchin. Evolution 2013, 67, 1901–1914. [Google Scholar] [CrossRef]
  12. Gracey, A.Y.; Chaney, M.L.; Boomhower, J.P.; Tyburczy, W.R.; Connor, K.; Somero, G.N. Rhythms of gene expression in a fluctuating intertidal environment. Curr. Biol. 2008, 18, 1501–1507. [Google Scholar] [CrossRef] [PubMed]
  13. Shen, X.R.; Jiang, D.W.; Jia, F.X.; Chen, M.H. Study on anti-senescence effect of Sipunculus nudus preparation. Chin. J. Mar. Drugs 2004, 1, 30–32, (In Chinese with English abstract). [Google Scholar]
  14. Dong, L.F.; Zhang, Q.; Tong, T.; Xu, M.Z.; Chen, J.H. Amino acid composition of peanut worm Sipunculus nudus at different growth stages. South China Fish. Sci. 2012, 8, 60–65, (In Chinese with English abstract). [Google Scholar]
  15. Jiang, D.W.; Shen, X.R.; Jia, F.X.; Chu, Z.Y.; Li, S.L. Nutrient analysis and immune regulation study on extract of Sipunculidae. Chin. J. Biochem. Pharm. 2004, 25, 96–97, (In Chinese with English abstract). [Google Scholar]
  16. Li, J.W.; Guo, Y.J.; Hu, R.P.; Chen, S.W.; Xie, X.Y.; Zhu, C.B.; Li, T. Comparative analysis of nutritional composition of Sipunculus nudus Linnaeus in different aquaculture modes. South China Fish. Sci. 2018, 14, 80–87, (In Chinese with English abstract). [Google Scholar]
  17. Li, J.W.; Xie, X.Y.; Zhu, C.B.; Guo, Y.J.; Chen, S.W. Edible peanut worm (Sipunculus nudus) in the Beibu Gulf: Resource, aquaculture, ecological impact and counterplan. J. Ocean Univ. China Ocean. Coast. Sea Res. 2017, 5, 823–830. [Google Scholar] [CrossRef]
  18. Mark, A.S.; Monika, K. A deep burrowing sipunculan of ecological and geochemical importance. Deep-Sea Res. Part I 2009, 56, 2057–2064. [Google Scholar] [CrossRef]
  19. Li, J.W.; Hu, R.P.; Guo, Y.J.; Chen, S.W.; Xie, X.Y.; Qin, J.G.; Ma, Z.H.; Zhu, C.B. Bioturbation of peanut worms Sipunculus nudus on the composition of prokaryotic communities in a tidal flat as revealed by 16S rRNA gene sequences. Microbiol. Open 2019, 8, e802. [Google Scholar] [CrossRef]
  20. Li, J.W.; Zhu, C.B.; Guo, Y.J.; Xie, X.Y.; Huang, G.Q.; Chen, S.W. Experimental study of bioturbation by Sipunculus nudus in a polyculture system. Aquaculture 2015, 437, 175–181. [Google Scholar] [CrossRef]
  21. Helmuth, B.; Mieszkowska, N.; Moore, P.; Hawkins, S.J. Living on the edge of two changing worlds: Forecasting the responses of rocky intertidal ecosystems to climate change. Annu. Rev. Ecol. Evol. Syst. 2006, 37, 373–404. [Google Scholar] [CrossRef]
  22. Grabherr, M.G.; Haas, B.G.; Yassour, M.; Levin, J.Z.; Thompson, D.A.; Amit, I.; Adiconis, X.; Fan, L.; Raychowdhury, R.; Zeng, Q.D.; et al. Full-length transcriptome assembly from RNA-Seq data without a reference genome. Nat. Biotechnol. 2011, 29, 644–652. [Google Scholar] [CrossRef]
  23. Conesa, A.; Gotz, S.; Garcia-Gomez, J.M.; Terol, J.; Talon, M.; Robles, M. Blast2GO: A universal tool for annotation, visualization and analysis in functional genomics research. Bioinformatics 2005, 21, 3674–3676. [Google Scholar] [CrossRef]
  24. Langmead, B.; Salzberg, S.L. Fast gapped-read alignment with Bowtie 2. Nat. Methods 2012, 4, 357–359. [Google Scholar] [CrossRef]
  25. Li, B.; Dewey, C.N. RSEM: Accurate transcript quantification from RNA-Seq data with or without a reference genome. BMC Bioinform. 2011, 1, 323. [Google Scholar] [CrossRef]
  26. Kumar, L.; Futschik, M.E. Mfuzz: A software package for soft clustering of microarray data. Bioinformation 2007, 1, 5. [Google Scholar] [CrossRef]
  27. Wage, J.; Lerebours, A.; Hardege, J.D.; Rotchell, J.M. Exposure to low pH induces molecular level changes in the marine worm, Platynereis dumerilii. Ecotoxicol. Environ. Saf. 2016, 124, 105–110. [Google Scholar] [CrossRef]
  28. Livak, K.J.; Schmittgen, T.D. Analysis of relative gene expression data using real-time quantitative PCR and the 2(-Delta Delta C(T)) Method. Methods 2001, 4, 402–408. [Google Scholar] [CrossRef]
  29. Li, X.X.; Tan, Y.; Sun, Y.X.; Wang, J.; Dong, Y.W. Microhabitat temperature variation combines with physiological variation to enhance thermal resilience of the intertidal mussel Mytilisepta virgate. Funct. Ecol. 2022, 11, 2497–2507. [Google Scholar] [CrossRef]
  30. Tan, J.; Wang, X.; Wang, L.; Zhou, X.Q.; Liu, C.L.; Ge, J.L.; Bian, L.; Chen, S.Q. Transcriptomic responses to air exposure stress in coelomocytes of the sea cucumber, Apostichopus japonicus. Comp. Biochem. Physiol. Part D Genom. Proteom. 2022, 42, 100963. [Google Scholar] [CrossRef]
  31. Wang, P.P.; Wang, J.; Su, Y.Q.; Mao, Y.; Zhang, J.S.; Wu, C.W.; Ke, Q.Z.; Han, K.H.; Zheng, W.Q.; Xu, N.D. Transcriptome analysis of the Larimichthys crocea liver in response to Cryptocaryon irritans. Fish Shellfish Immun. 2016, 48, 1–11. [Google Scholar] [CrossRef] [PubMed]
  32. Liu, C.C.; Ho, L.P.; Yang, C.H.; Kao, T.Y.; Chou, H.Y.; Pai, T.W. Comparison of grouper infection with two different iridoviruses using transcriptome sequencing and multiple reference species selection. Fish Shellfish Immun. 2017, 71, 264–274. [Google Scholar] [CrossRef] [PubMed]
  33. Tang, D.; Shi, X.L.; Guo, H.Y.; Bai, Y.Z.; Shen, C.C.; Zhang, Y.P.; Wang, Z.F. Comparative transcriptome analysis of the gills of Procambarus clarkii provides novel insights into the immune-related mechanism of copper stress tolerance. Fish Shellfish Immun. 2020, 96, 32–40. [Google Scholar] [CrossRef] [PubMed]
  34. Yang, J.; Tian, T.; Xiao, K.; Zeng, Q.K.; Tan, C.; Du, H.J. Pathogenic infection and immune-related gene expression of Chinese sturgeon (Acipenser sinensis) challenged by Citrobacter freundii. Dev. Comp. Immun. 2021, 114, 103872. [Google Scholar] [CrossRef] [PubMed]
  35. Lyu, L.K.; Wen, H.S.; Li, Y.; Li, J.F.; Zhao, J.; Zhang, S.M. Deep transcriptomic analysis of black rockfish (Sebastes schlegelii) Provides new insights on responses to acute temperature stress. Sci. Rep. 2017, 8, 9113. [Google Scholar] [CrossRef]
  36. Cao, F.J.; Zhong, R.Z.; Yang, C.Y.; Hao, R.J.; Wang, Q.H.; Liao, Y.S.; Deng, Y.W. Transcriptmic analysis of differentially expressed genes in the larval settlement and metamorphosis of peanut worm Sipunculus nudus. Aquacult. Rep. 2020, 18, 100475. [Google Scholar] [CrossRef]
  37. Yan, X.W.; Nie, H.T.; Huo, Z.M.; Ding, J.F.; Li, Z.Z.; Yan, L.L.; Jiang, L.W.; Mu, Z.Q.; Wang, H.M.; Meng, X.Y.; et al. Clam genome sequence clarifies the molecular basis of Its benthic adaptation and extraordinary shell color diversity. iScience 2019, 19, 1225–1237. [Google Scholar] [CrossRef]
  38. Perkins, T.L.; Clements, K.; Baas, J.H.; Jago, C.F.; Jones, D.L.; Malham, S.K.; McDonald, J.E. Sediment composition influences spatial variation in the abundance of human pathogen indicator bacteria within an estuarine environment. PLoS ONE 2014, 11, e112951. [Google Scholar] [CrossRef]
  39. Bernáldez-Sarabia, J.; Lizárraga-Partida, M.L.; Hernández-López, E.L.; Gasperin-Bulbarela, J.; Licea-Navarro, A.F.; Guerrero, A.; Sánchez-Castrejón, E.; Franco-Moreno, A. Distribution of pathogenic vibrios and Vibrio spp. in the water column and sediment samples from the southern Gulf of Mexico. Mar. Pollut. Bull. 2021, 173B, 113116. [Google Scholar] [CrossRef]
  40. Hassard, F.; Andrew, A.; Jones, D.; Parsons, L.; Jones, V.; Cox, B.A.; Daldorph, P.; Brett, H.; McDonald, J.E.; Malham, S.K. Physicochemical factors influence the abundance and culturability of human enteric pathogen and fecal indicator organisms in estuarine water and sediment. Front. Microbiol. 2017, 8, 1996. [Google Scholar] [CrossRef]
  41. Dhillon, A.S.; Hagan, S.; Rath, O.; Kolch, W. MAP kinase signaling pathways in cancer. Oncogene 2007, 26, 3279–3290. [Google Scholar] [CrossRef] [PubMed]
  42. Kang, H.M.; Jeong, C.B.; Lee, Y.H.; Cui, Y.H.; Kim, D.H.; Lee, M.C.; Kim, H.S.; Han, J.; Hwang, D.S.; Lee, S.J. Cross-reactivities of mammalian MAPKs antibodies in rotifer and copepod: Application in mechanistic studies in aquatic ecotoxicology. Mar. Pollut. Bull. 2017, 2, 614–623. [Google Scholar] [CrossRef] [PubMed]
  43. Ermolaeva, M.A.; Schumacher, B. Insights from the worm: The C. elegans model for innate immunity. Semin. Immunol. 2014, 4, 303–309. [Google Scholar] [CrossRef] [PubMed]
  44. Achache, H.; Falk, R.; Lerner, N.; Beatus, T.; Tzur, Y.B. Oocyte aging is controlled by mitogen-activated protein kinase signaling. Aging Cell 2021, 6, e13386. [Google Scholar] [CrossRef] [PubMed]
  45. Ibba, M.; Soll, D. Aminoacyl-Trna Synthesis. Annu. Rev. Biochem. 2000, 69, 617–650. [Google Scholar] [CrossRef] [PubMed]
  46. Gao, X.L.; Guo, R.; Li, Y.H.; Kang, G.L.; Wu, Y.; Cheng, J.; Jia, J.; Wang, W.X.; Li, Z.H.; Wang, A.Q.; et al. Contribution of upregulated aminoacyl-tRNA biosynthesis to metabolic dysregulation in gastric cancer. J. Gastroenterol. Hepatol. 2021, 11, 3113–3126. [Google Scholar] [CrossRef]
  47. Wang, R.R.; Qian, J.M.; Ji, D.; Liu, X.Y.; Dong, R.R. Transcriptome Analysis Reveals Effect of Dietary Probiotics on Immune Response Mechanism in Southern Catfish (Silurus meridionalis) in Response to Plesiomonas shigelloides. Animals 2023, 13, 449. [Google Scholar] [CrossRef]
  48. Zhang, H.Y.; Deng, S.Y.; Zhang, J.Y.; Zhu, G.Q.; Zhou, J.; Ye, W.J.; Wang, Q.W.; Wang, Y.; Zou, B.W.; Zhang, P.; et al. Single nucleotide polymorphisms within NFKBIA are associated with nasopharyngeal carcinoma susceptibility in Chinese Han population. Cytokine 2021, 138, 155356. [Google Scholar] [CrossRef]
  49. Mateyak, M.K.; Kinzy, T.G. eEF1A: Thinking outside the ribosome. J. Biol. Chem. 2010, 28, 21209–21213. [Google Scholar] [CrossRef]
  50. Vera, M.; Pani, B.; Griffiths, L.A.; Muchardt, C.; Abbott, C.M.; Singer, R.H.; Nudler, E. The translation elongation factor eEF1A1 couples transcription to translation during heat shock response. eLife 2014, 3, e03164. [Google Scholar] [CrossRef]
  51. Scaggiante, B.; Dapas, B.; Cristiano, L.; Grassi, G. The Role of the Eef1A Family in Human Cancers. Oncogene Proteins: New Research; Chapter 6; Nova Science Publishers, Inc.: Hauppauge, NY, USA, 2008; pp. 177–184. [Google Scholar]
  52. Cargnello, M.; Roux, P.P. Activation and function of the MAPKs and their substrates, the MAPK-Activated Protein Kinases. Microbiol. Mol. Biol. Rev. 2011, 1, 50–83. [Google Scholar] [CrossRef] [PubMed]
  53. Chen, N.N.; Nishio, N.; Ito, S.; Tanaka, Y. Growth arrest and DNA damage-inducible protein (GADD34) enhanced liver inflammation and tumorigenesis in a diethylnitrosamine (DEN)-treated murine model. Cancer Immun. Immunother. 2015, 6, 777–789. [Google Scholar] [CrossRef]
  54. Li, J.W.; Chen, S.W.; Wu, P.; Zhu, C.B.; Hu, R.P.; Li, T.; Guo, Y.J. Insights into the relationship between intestinal microbiota of the aquaculture worm Sipunculus nudus and surrounding sediments. Fishes 2023, 8, 32. [Google Scholar] [CrossRef]
  55. Caunt, C.J.; Keyse, S.M. Dual-specificity MAP kinase phosphatases (MKPs) Shaping the outcome of MAP kinase signaling. FEBS J. 2013, 2, 489–504. [Google Scholar] [CrossRef] [PubMed]
  56. Morris, J.J.; Rose, A.L.; Lu, Z.Y. Reactive oxygen species in the world ocean and their impacts on marine ecosystems. Redox Biol. 2022, 52, 102285. [Google Scholar] [CrossRef]
  57. Lornejad-Schäfer, M.R.; Schäfer, C.; Schöffl, H.; Frank, J. Cytoprotective role of mitogen-activated protein kinase phosphatase-1 in light-damaged human retinal pigment epithelial cells. Photochem. Photobiol. 2009, 3, 834–842. [Google Scholar] [CrossRef]
Figure 1. FPKM correlation plot diagram of the expression levels of S. nudus from groups H, M, and L (n = 3). H: peanut worms from the high tidal flat; M: peanut worms from the middle tidal flat; L: peanut worms from the low tidal flat. The greater the correlation coefficients, the more similar the gene expression model. The correlation coefficients are greater than 0.92 under ideal conditions, and greater than 0.80 is a reasonable value. FPKM: fragments per kilobase of transcript sequence per millions base pairs sequenced.
Biology 12 01182 g001
Figure 2. Comparison of the numbers of genes from S. nudus annotated to the NR, NT, and UniProt databases. BLASTP represents the number of genes annotated against the UniProt database, and BLASTX represents the number of ORFs annotated against the UniProt database.
Biology 12 01182 g002
Figure 3. Histogram of Gene Ontology (GO) classification for up-/downregulated unigenes derived from S. nudus in the different tidal flats. H: peanut worms from the high tidal flat; M: peanut worms from the middle tidal flat; L: peanut worms from the low tidal flat. (ac) Unigenes upregulated or downregulated between H and M, L and H, and M and L, respectively.
Biology 12 01182 g003aBiology 12 01182 g003b
Figure 4. Comparison of the differentially expressed genes (DEGs): (a) Venn diagram of overlapping DEGs among the three comparison groups (H vs. M, L vs. H, and M vs. L); (b) volcano diagram of DEGs in the comparison group H vs. M; (c) volcano diagram of DEGs in comparison group L vs. H; (d) volcano diagram of DEGs in the comparison group M vs. L.
Biology 12 01182 g004
Figure 5. Trend analysis of DEGs in Sipunculus nudus responding to different tidal flats. Eight significant clusters are displayed as tidal flat plots of expression ratios. The number of genes assigned to each cluster is shown. The expression trend analysis is based on the resulting datasets identified as eight clusters of genes with characteristic transcription response profiles. Different lowercase letters (a, b) represent significant differences among the treatments (p < 0.05, Wilcoxon test).
Biology 12 01182 g005
Figure 6. KEGG enrichment analysis of the DEGs in S. nudus. The area of each colored circle is proportional to the number of genes involved in each pathway, the color indicates the q-value, and the x-axis is the Rich ratio.
Biology 12 01182 g006
Figure 7. Comparison of the relative fold changes between the qRT-PCR and RNA-Seq results for the following groups: (a) H vs. M; (b) M vs. L; (c) L vs. H. The expression levels of the selected genes were normalized to that of the α-tubulin gene. CGLTLL: Crassostrea gigas lysine-tRNA ligase-like; HAHM: Haliotis asinina Hsp90A mRNA; INFKBP: inhibitor of nuclear factor-kappaB protein; PBPAM1: Python bivittatus protein arginine methyltransferase 1; AAMTTS: Apteryx australis mantelli threonyl-tRNA synthetase; OBNAALAD2: Octopus bimaculoides N-acetylated-alpha-linked acidic dipeptidase 2-like.
Biology 12 01182 g007
Table 1. Environmental parameters of the sediment and body weight of S. nudus in the different tidal flats.
TN (%)TOC (%)TS (%)Salinity (‰)Body Weight (g)
H0.002 ± 0.0010.0586 ± 0.0050.600 ± 0.21124 ± 0.39.8 ± 1.4
M0.004 ± 0.0010.099 ± 0.00280.335 ± 0.07323 ± 0.28.6 ± 1.3
L0.011 ± 0.0010.2559 ± 0.0490.337 ± 0.10523 ± 0.57.8 ± 1.3
TN: total nitrogen; TOC: total organic carbon; TS: total sulfur.
Table 2. Summary of the transcriptome of S. nudus using PacBio Iso-Seq and Illumina RNA-Seq.
ParametersPacBio Iso-SeqIllumina RNA-Seq
Sequencing data
Number of subreads or raw reads9,717,99258,212,575
Number of CCS or clean reads410,18357,010,224
Full-length or assembled transcriptome
Number of transcripts21,154105,259
Number of nucleotide bases (Mb)54.67
GC content (%)43.8339.44
Mean length2584.71924.00
Minimum length (bp)209201
Maximum length (bp)11,92335,077
N5026731755
Length range of transcripts (bp)
<40010847,105
400–100067430,851
1000–2000583514,791
2000–300087226451
>300058156061
Table 3. Assembled quality of sequenced Sipunculus nudus transcriptomes.
SampleRaw ReadsClean ReadsLow-Quality Reads Rate (%)Clean Q30 Bases Rate
H158,231,23257,068,5400.5293.97
H256,276,30055,083,0320.594.19
H360,401,21659,155,7960.6393.88
M163,840,40262,436,0420.8793.09
M259,975,24258,780,8620.693.94
M360,770,11059,506,1280.5294.01
L146,464,35645,751,9160.5794.88
L254,854,17253,396,6140.5294.43
L363,100,14861,913,0860.594.19
H: peanut worms from the high tidal flat; M: peanut worms from the middle tidal flat; L: peanut worms from the low tidal flat.
Disclaimer/Publisher’s Note: The statements, opinions and data contained in all publications are solely those of the individual author(s) and contributor(s) and not of MDPI and/or the editor(s). MDPI and/or the editor(s) disclaim responsibility for any injury to people or property resulting from any ideas, methods, instructions or products referred to in the content.

