
Analysis of the Mitogenomes of Two Helotid Species Provides New Insights into the Phylogenetic Relationship of the Basal Cucujoidea (Insecta: Coleoptera)
 and
and
Abstract
:Simple Summary
Abstract
1. Introduction
2. Materials and Methods
2.1. Sampling and Genomic DNA Extraction
2.2. Mitochondrial Genome Sequencing and Assembly
2.3. Gene Analyses
2.4. Phylogenetic Analyses
3. Results
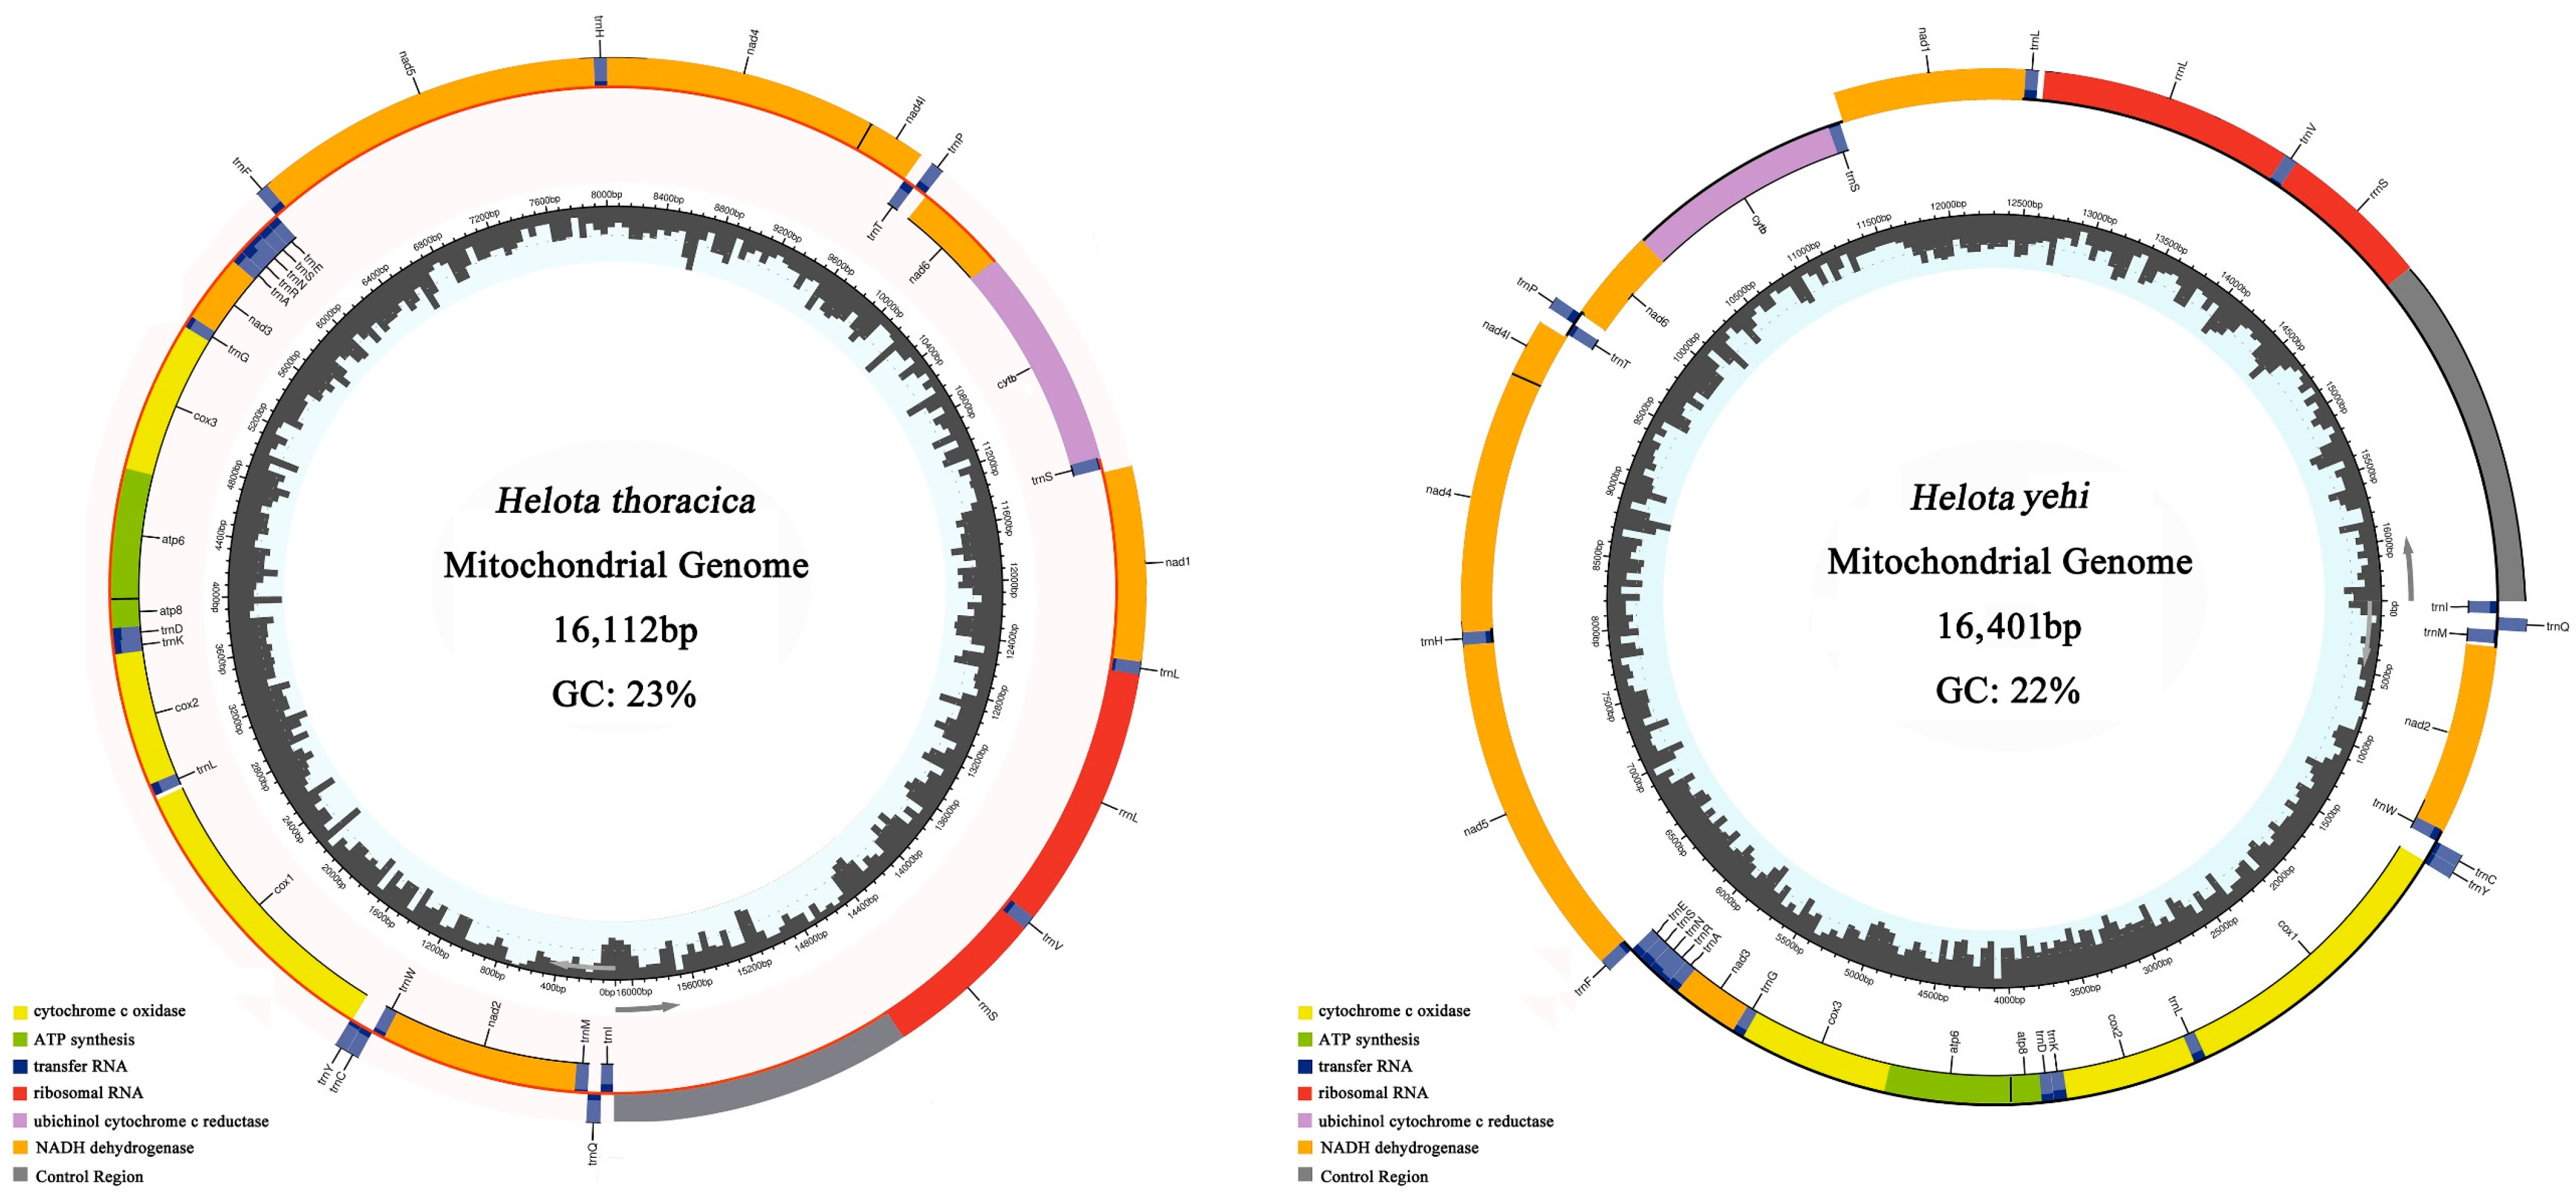
3.1. Genomic Organization and Base Compositions
3.2. Base Composition
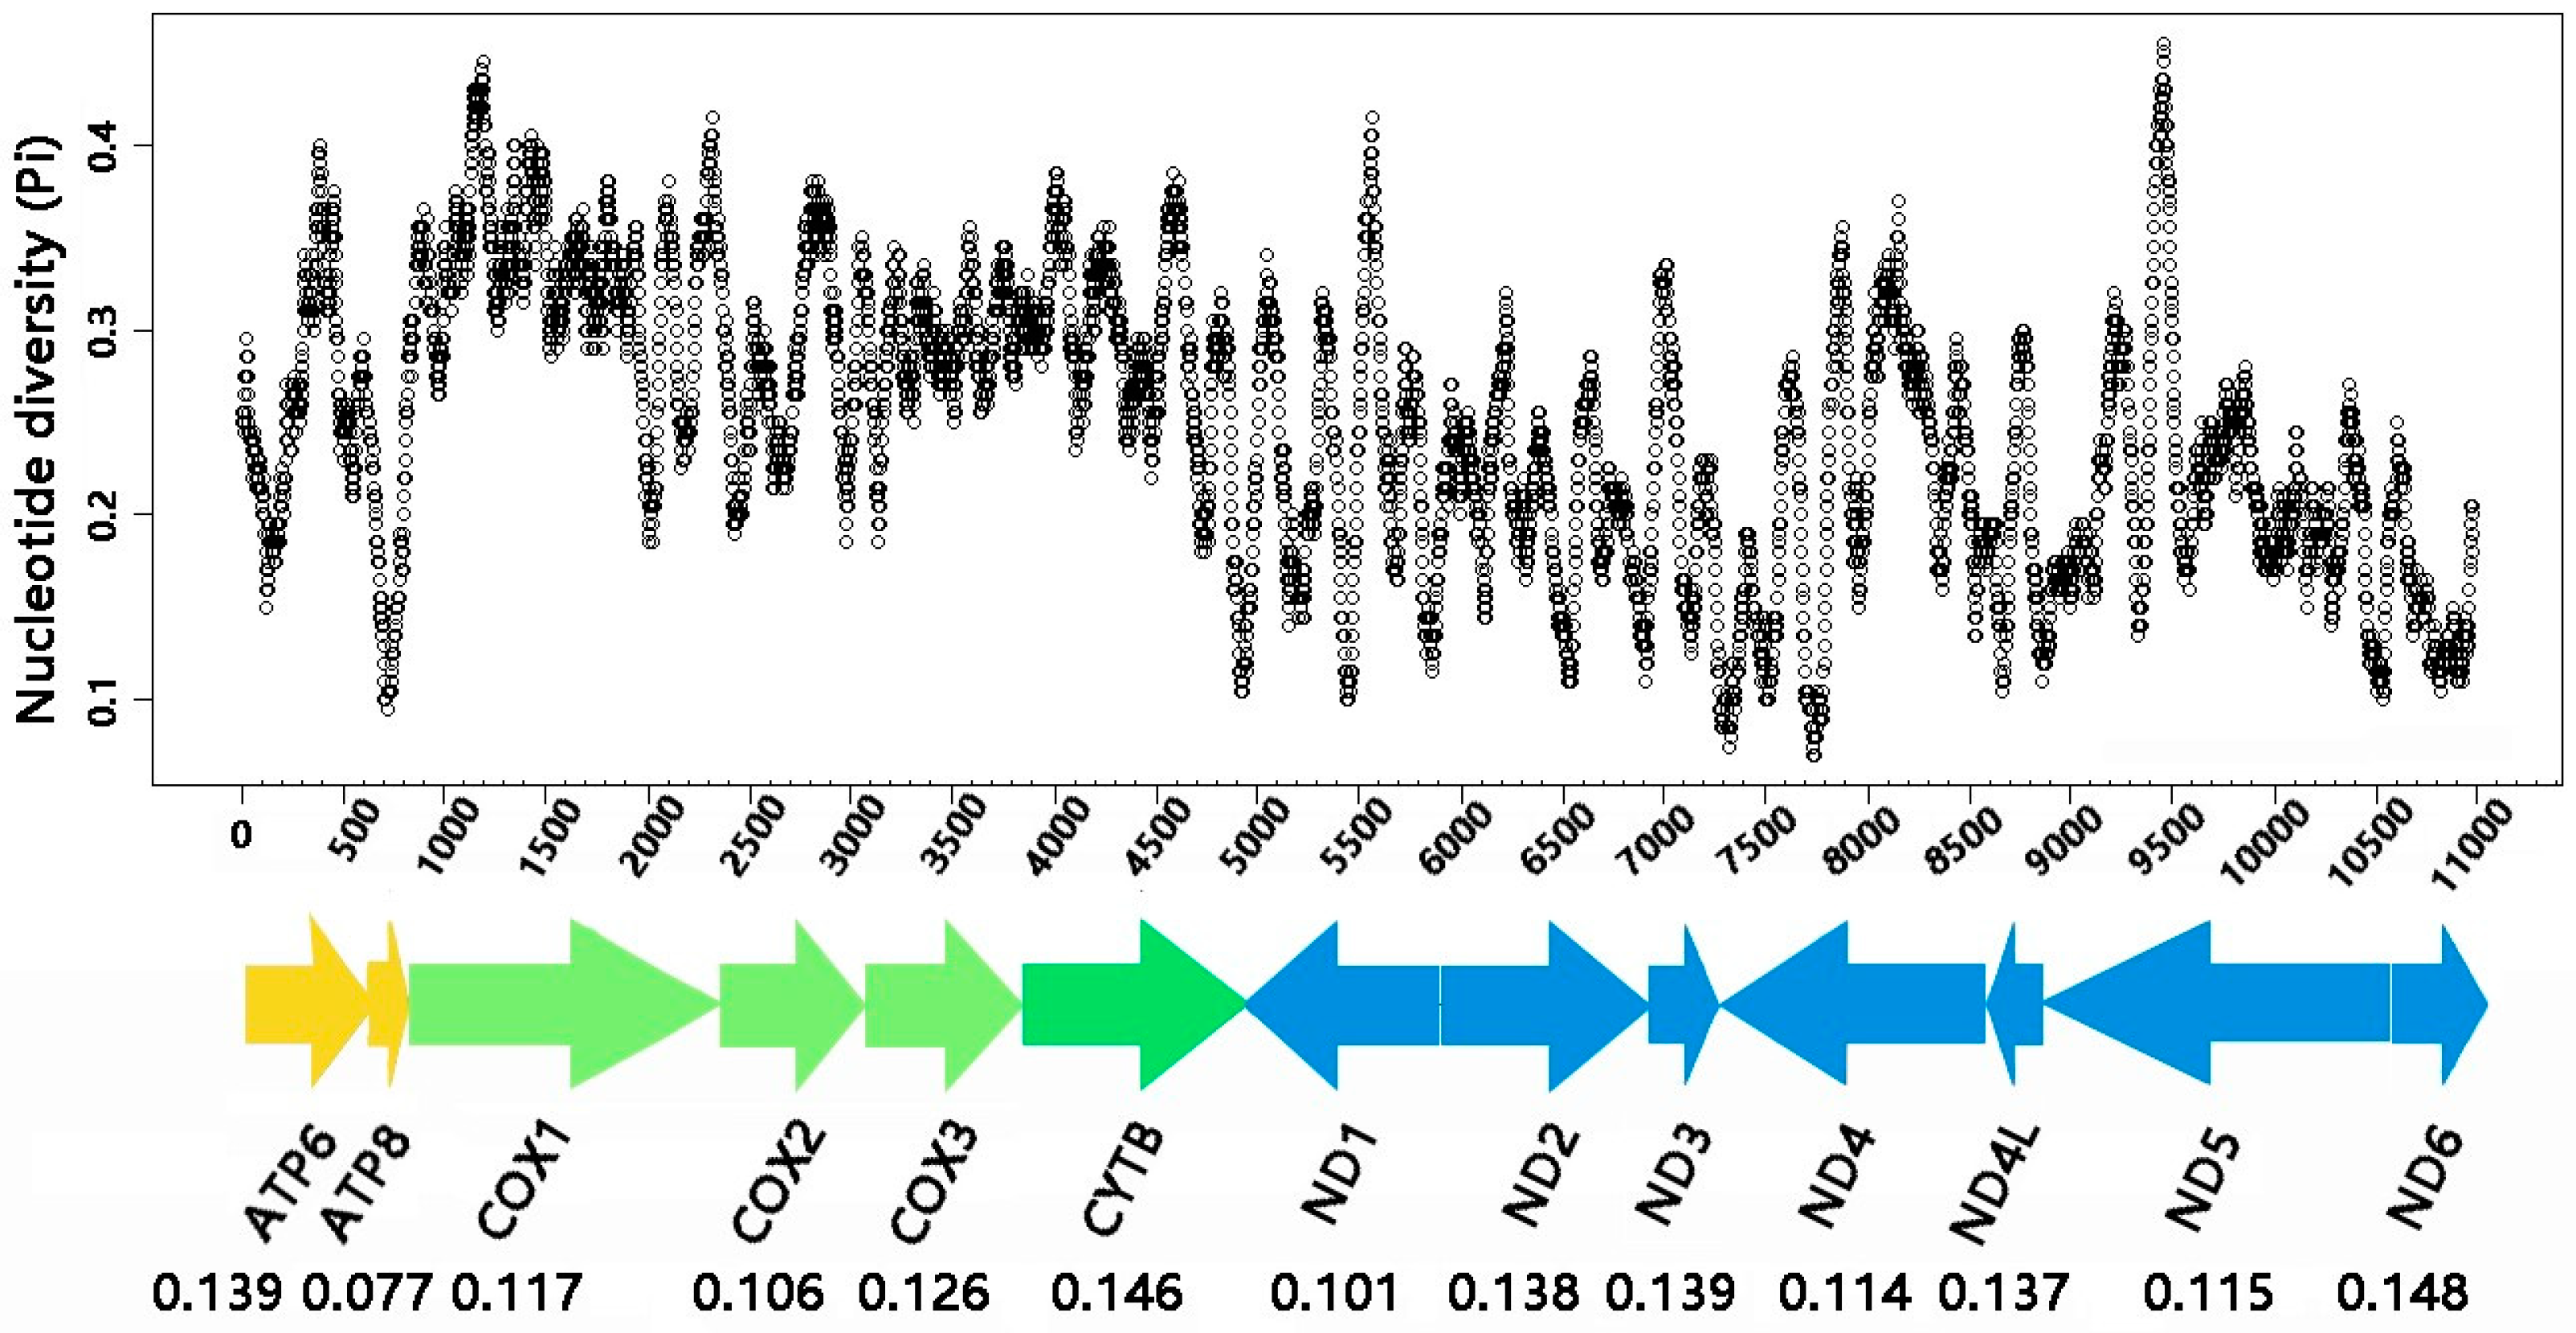
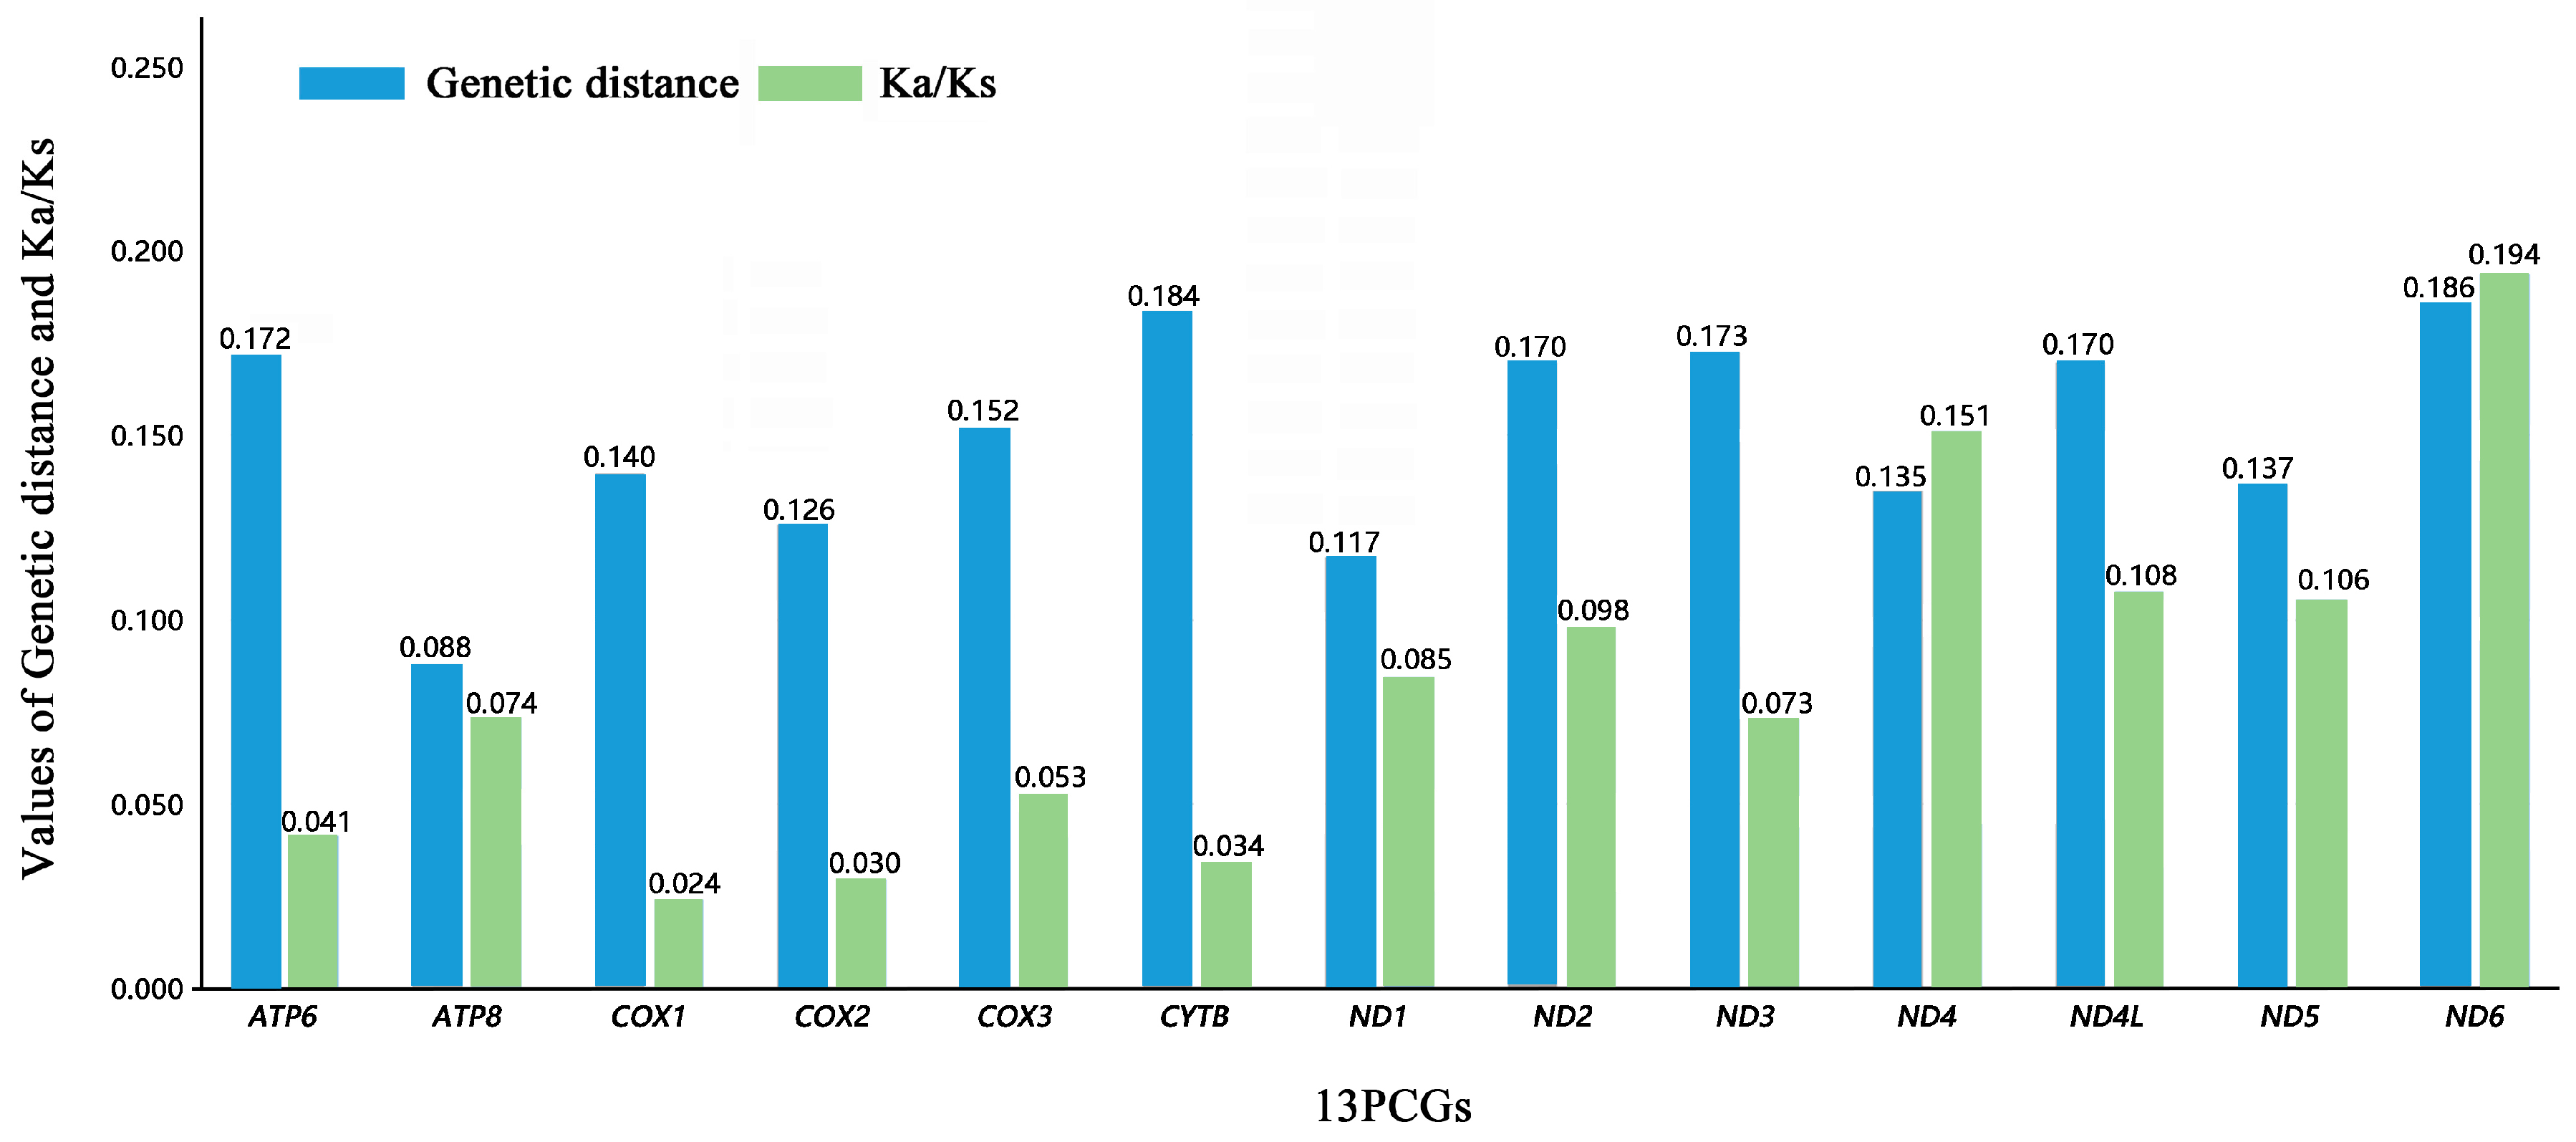
3.3. Protein-Coding Genes
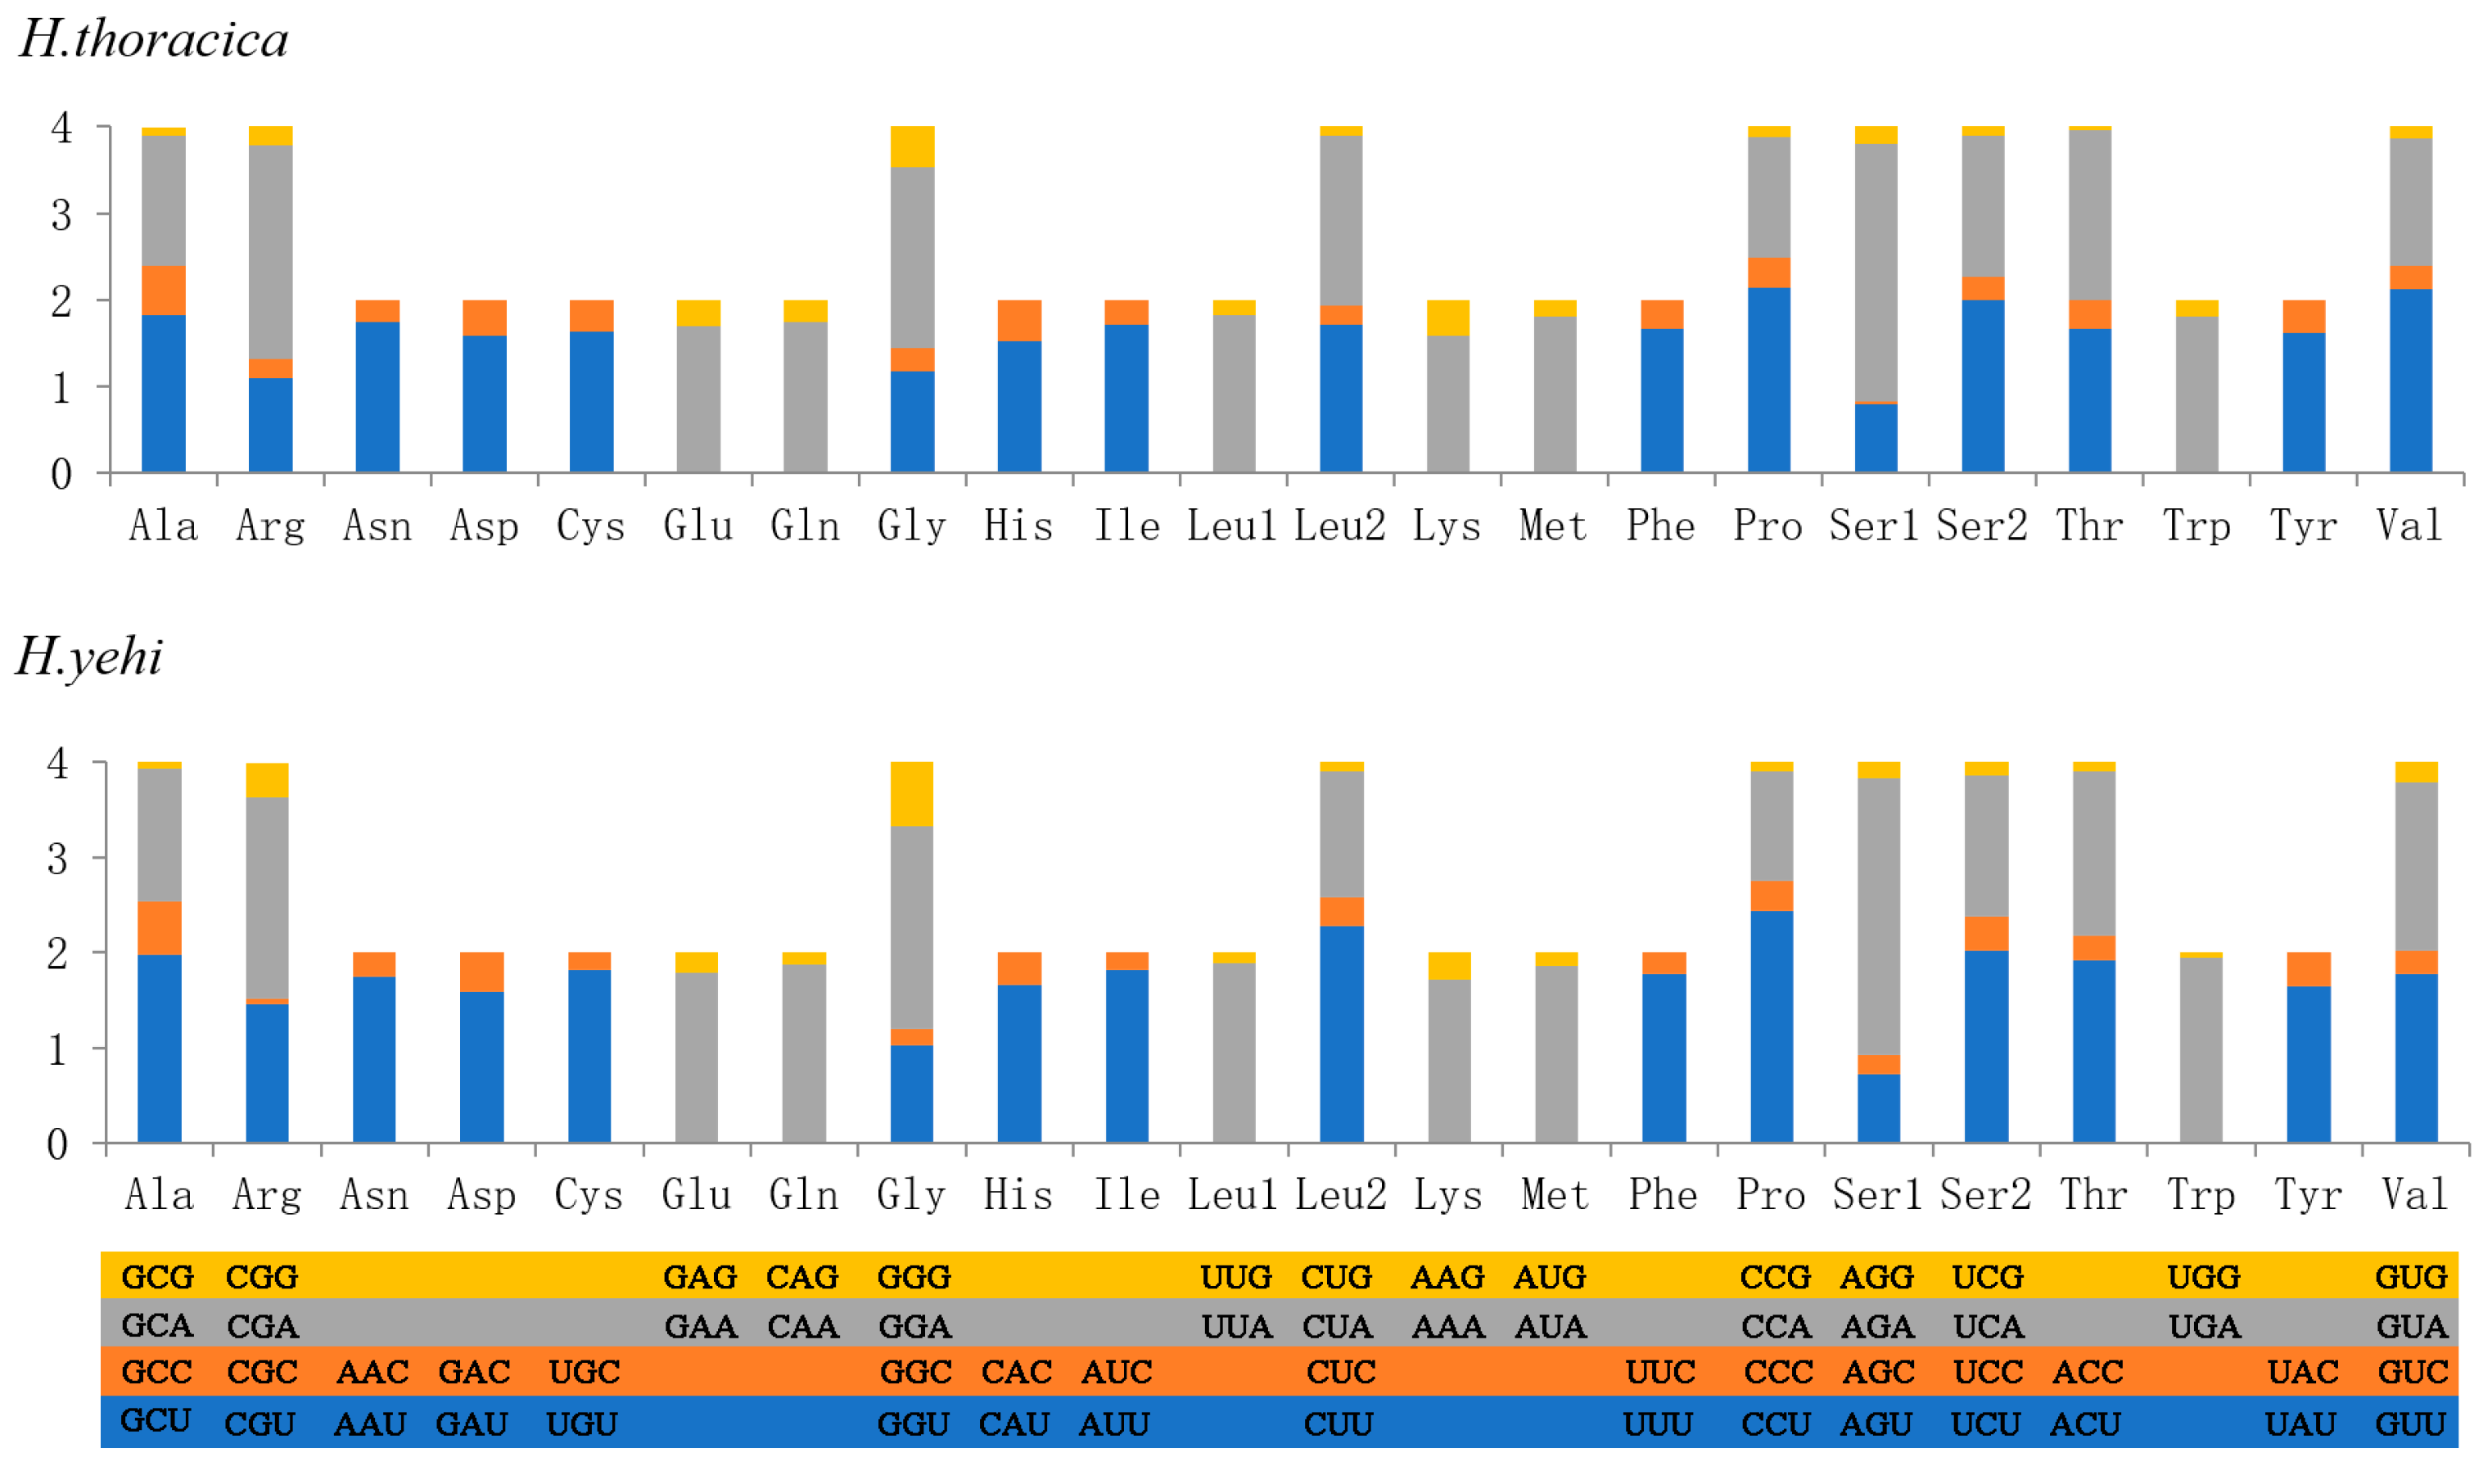
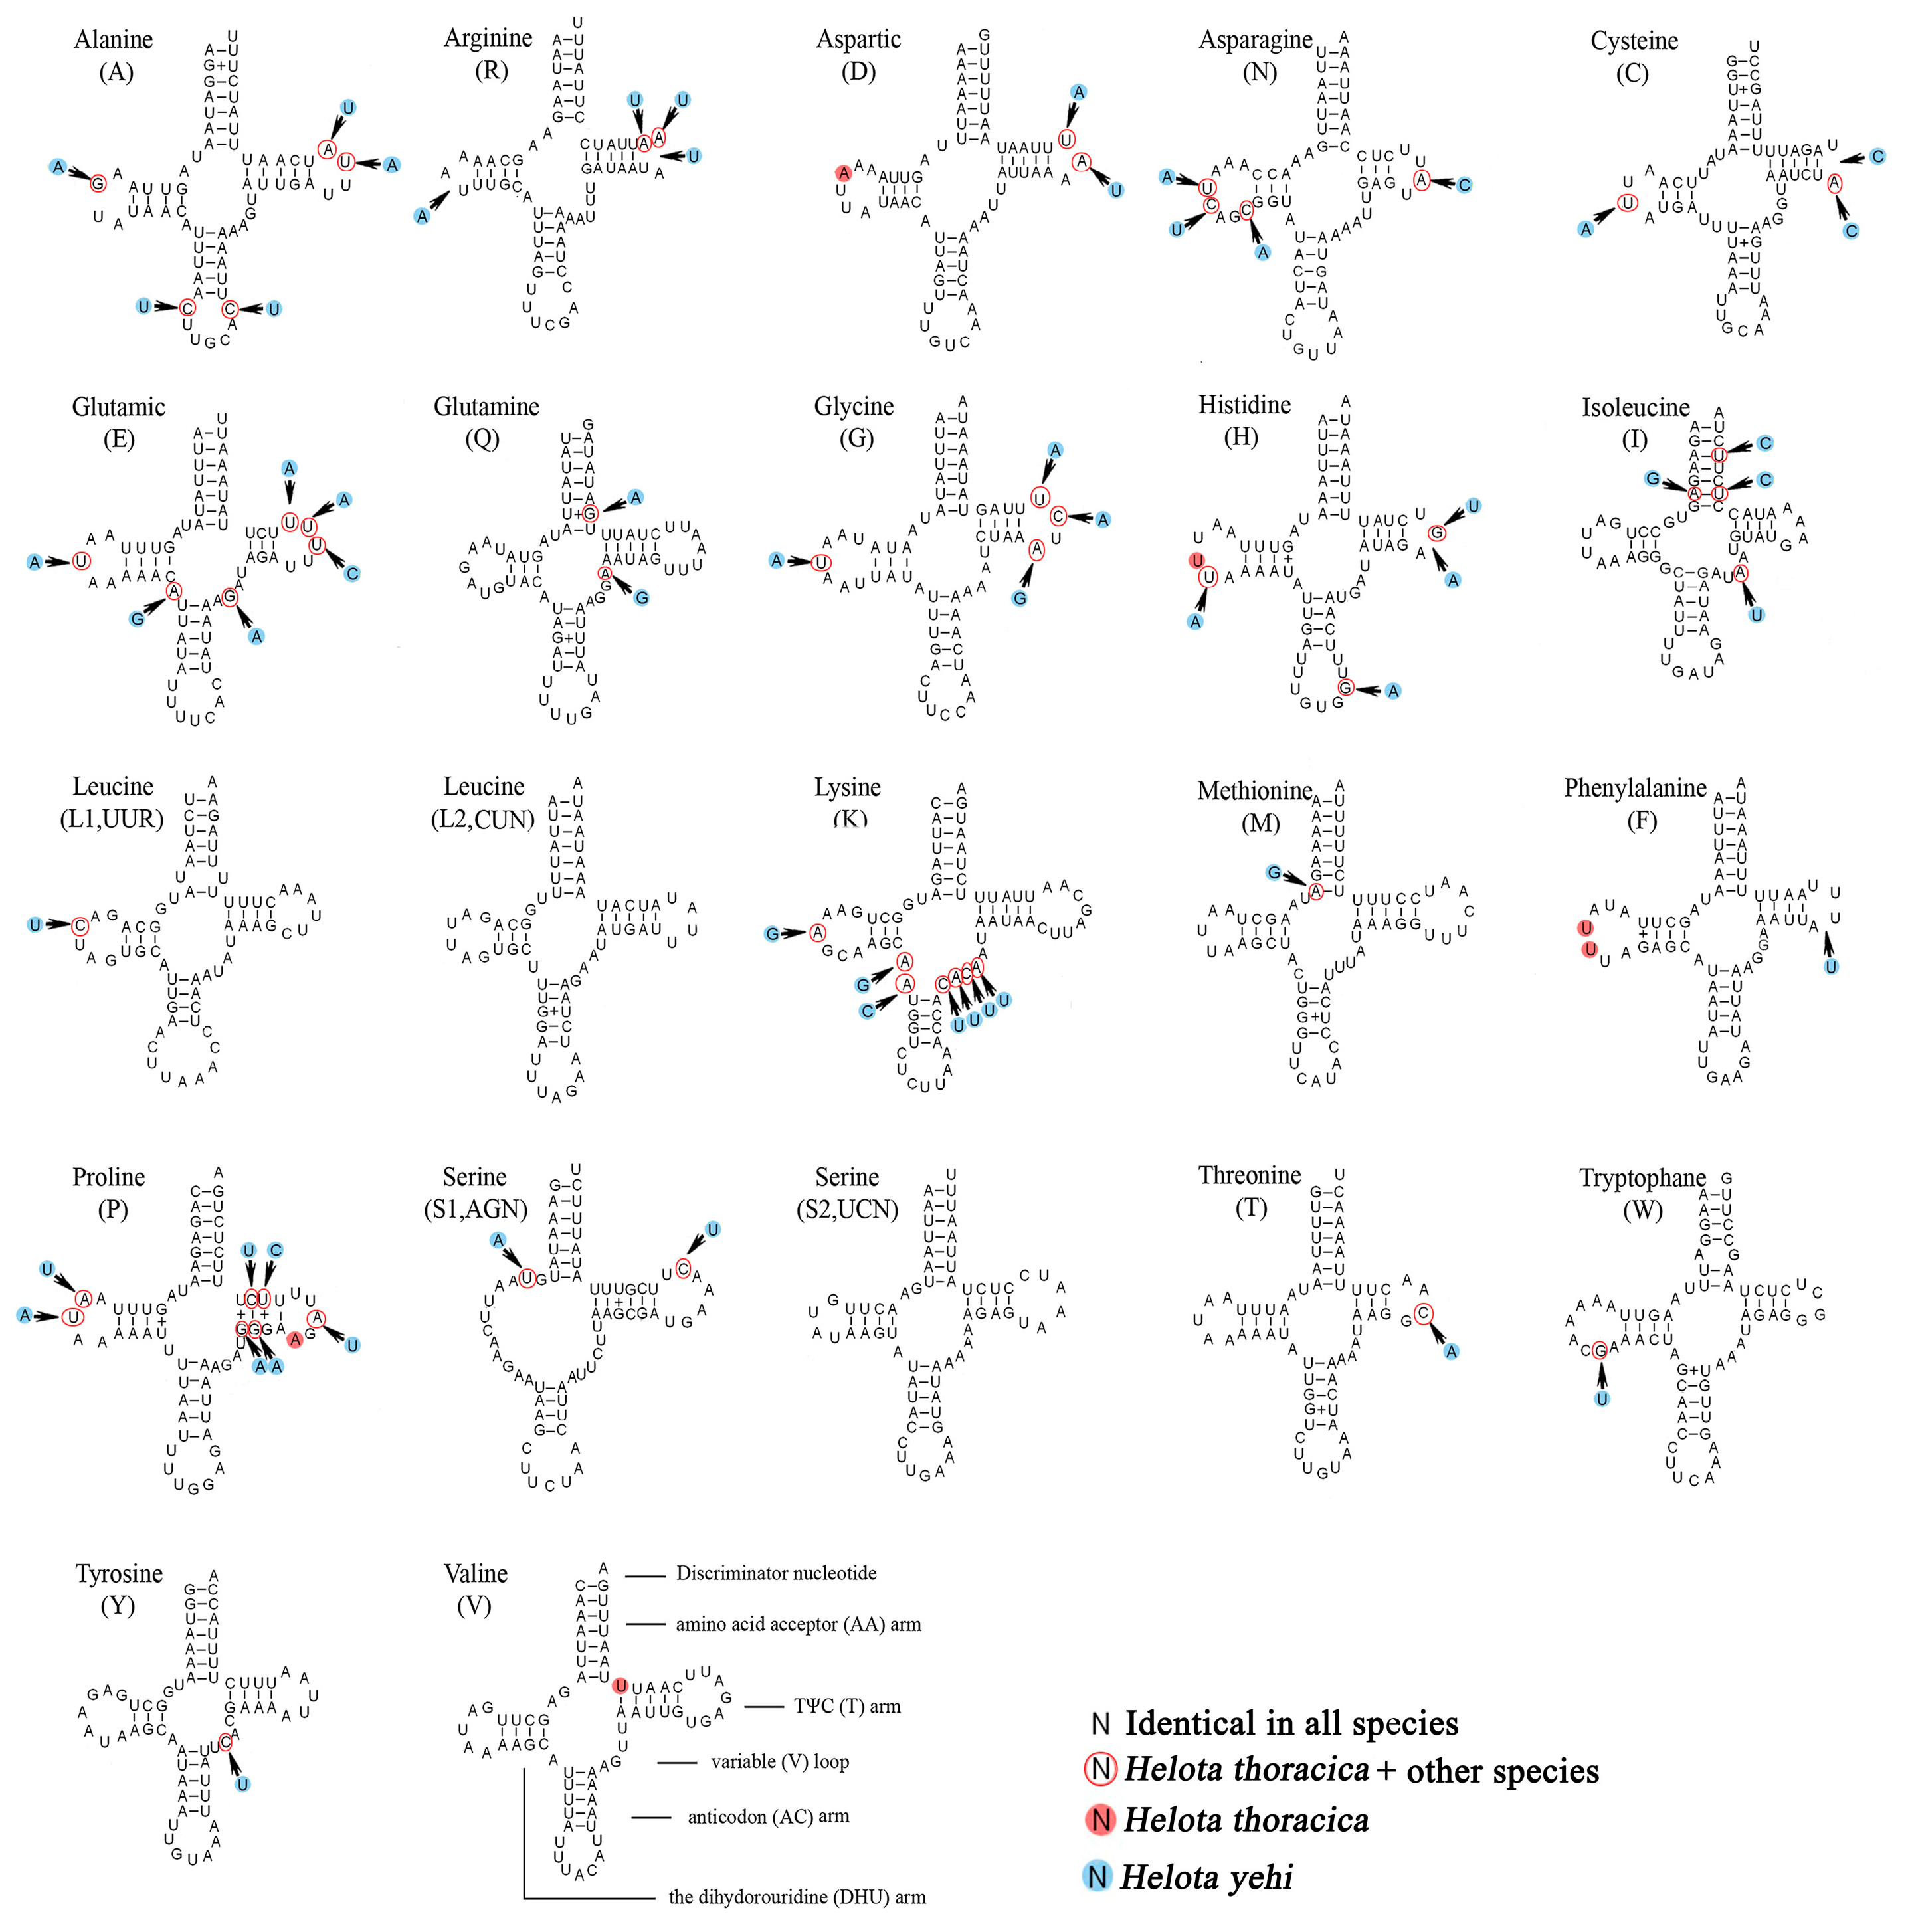
3.4. Transfer RNAs
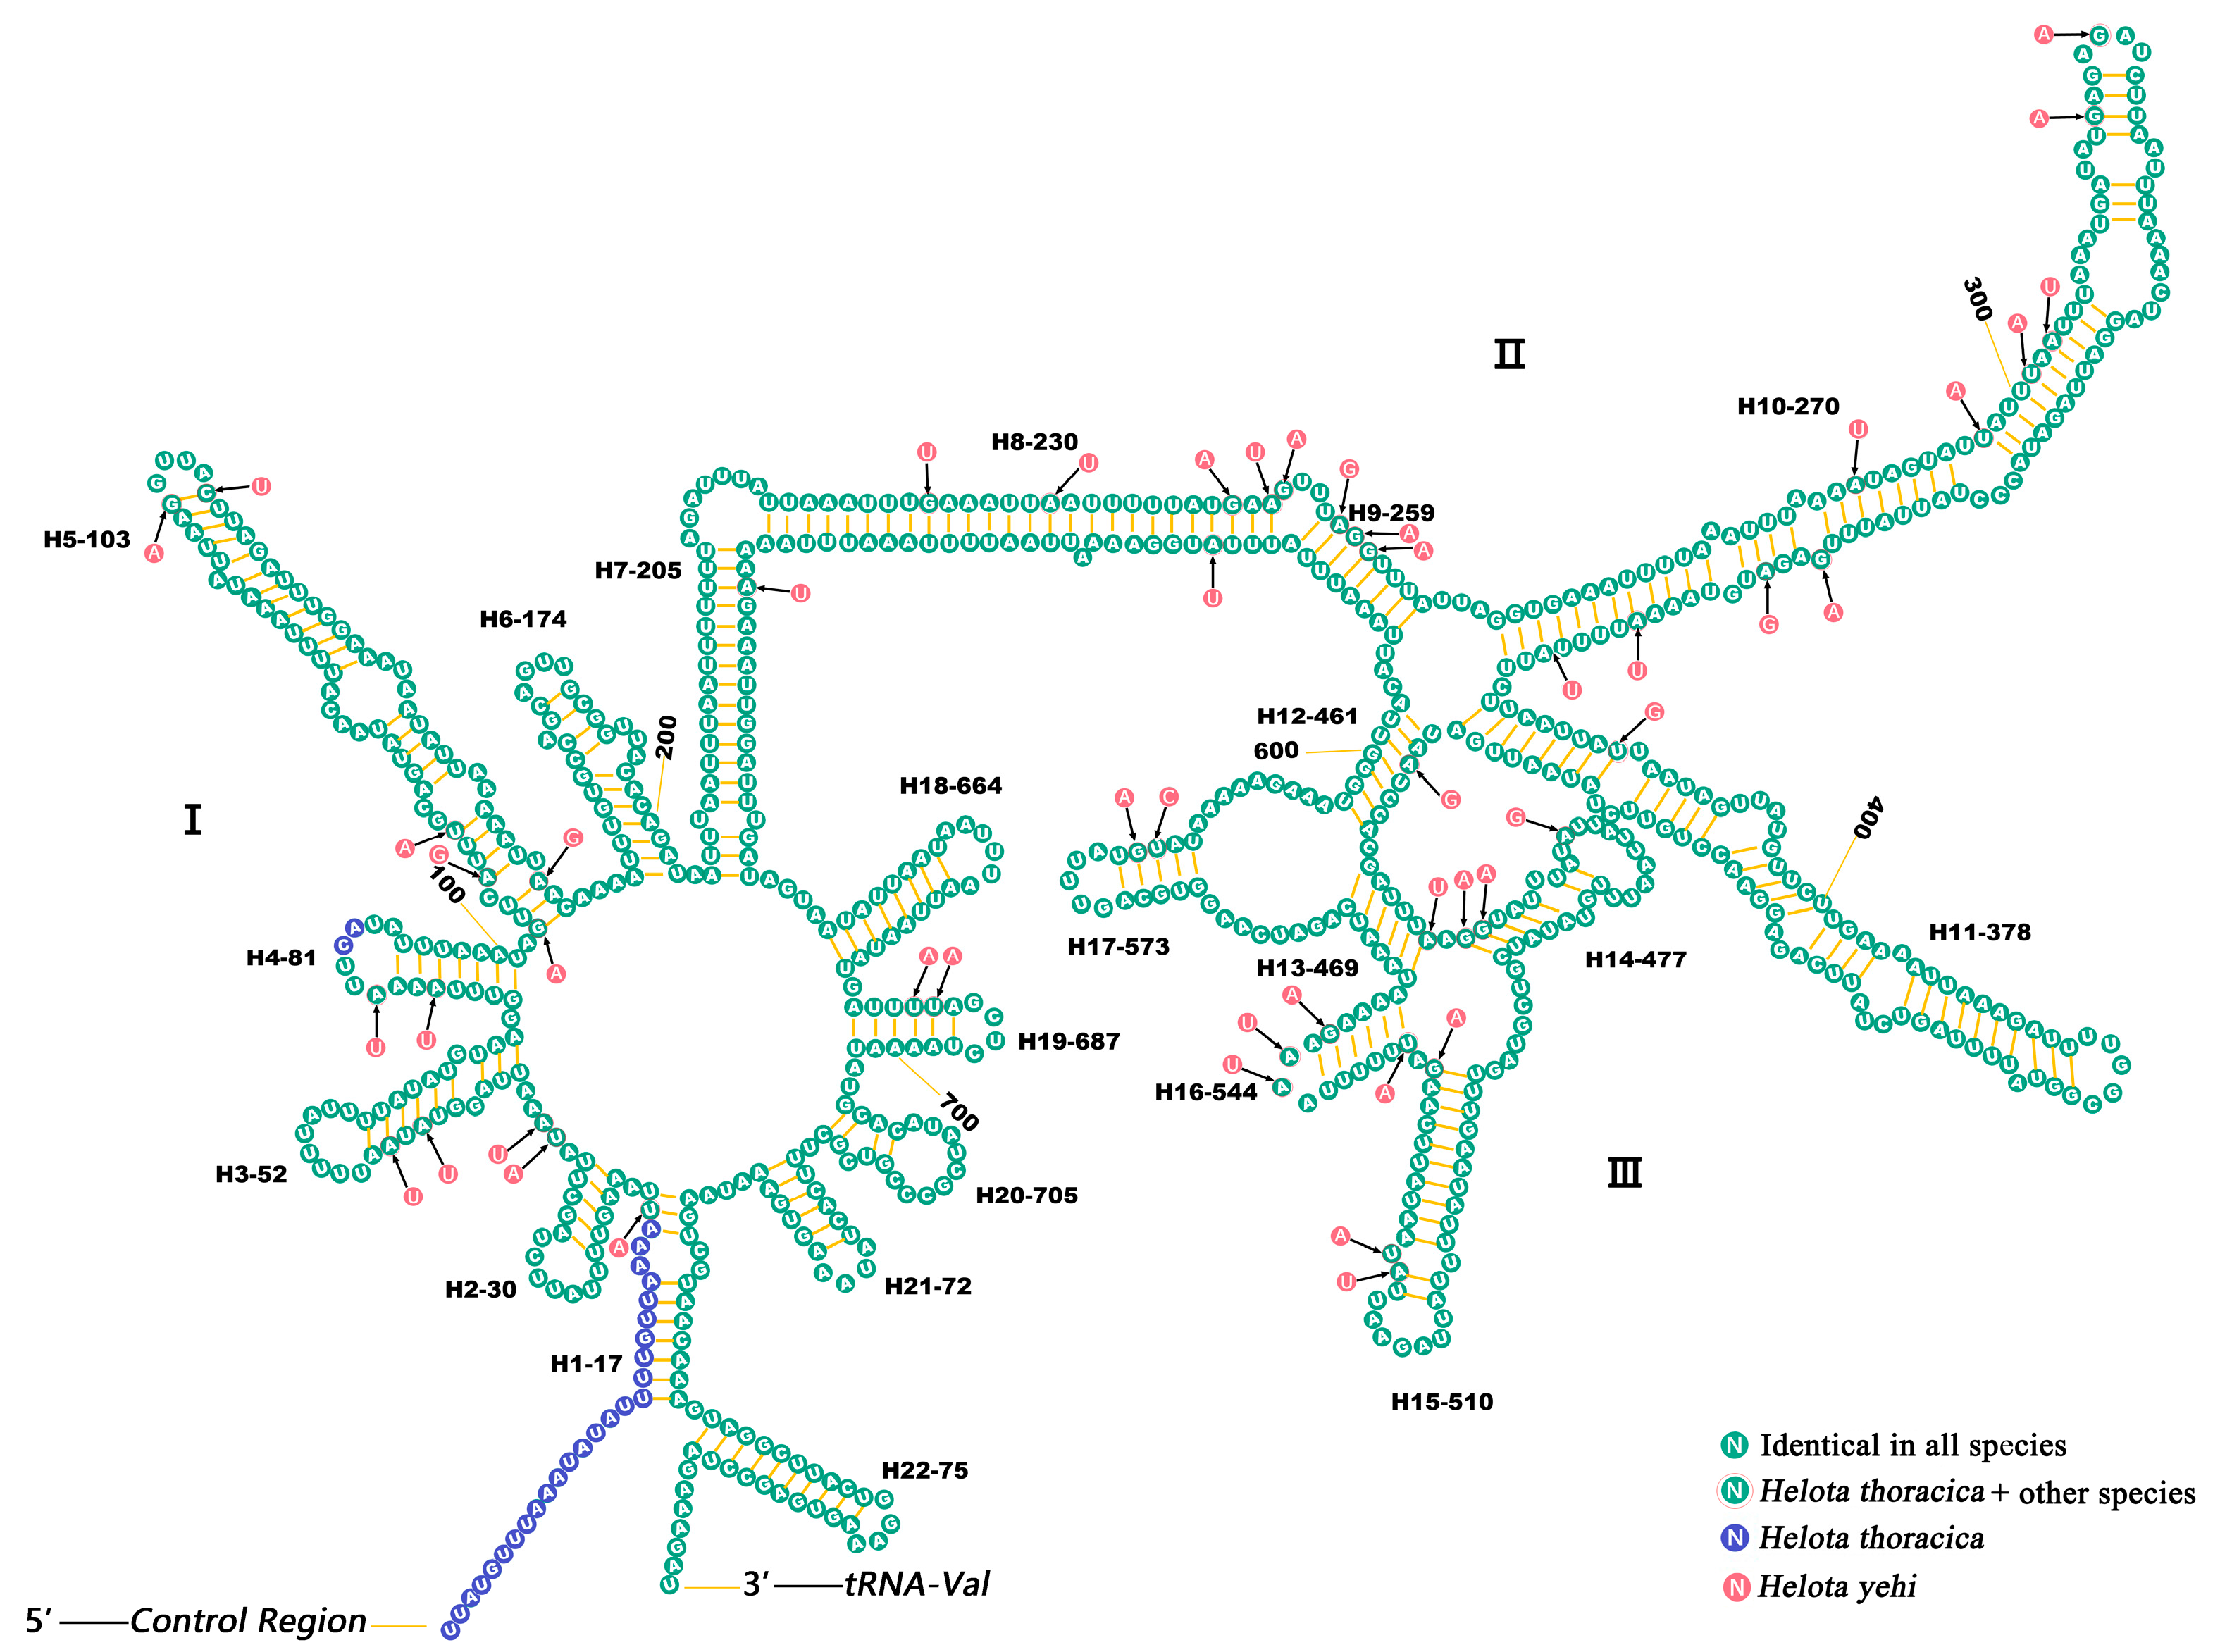
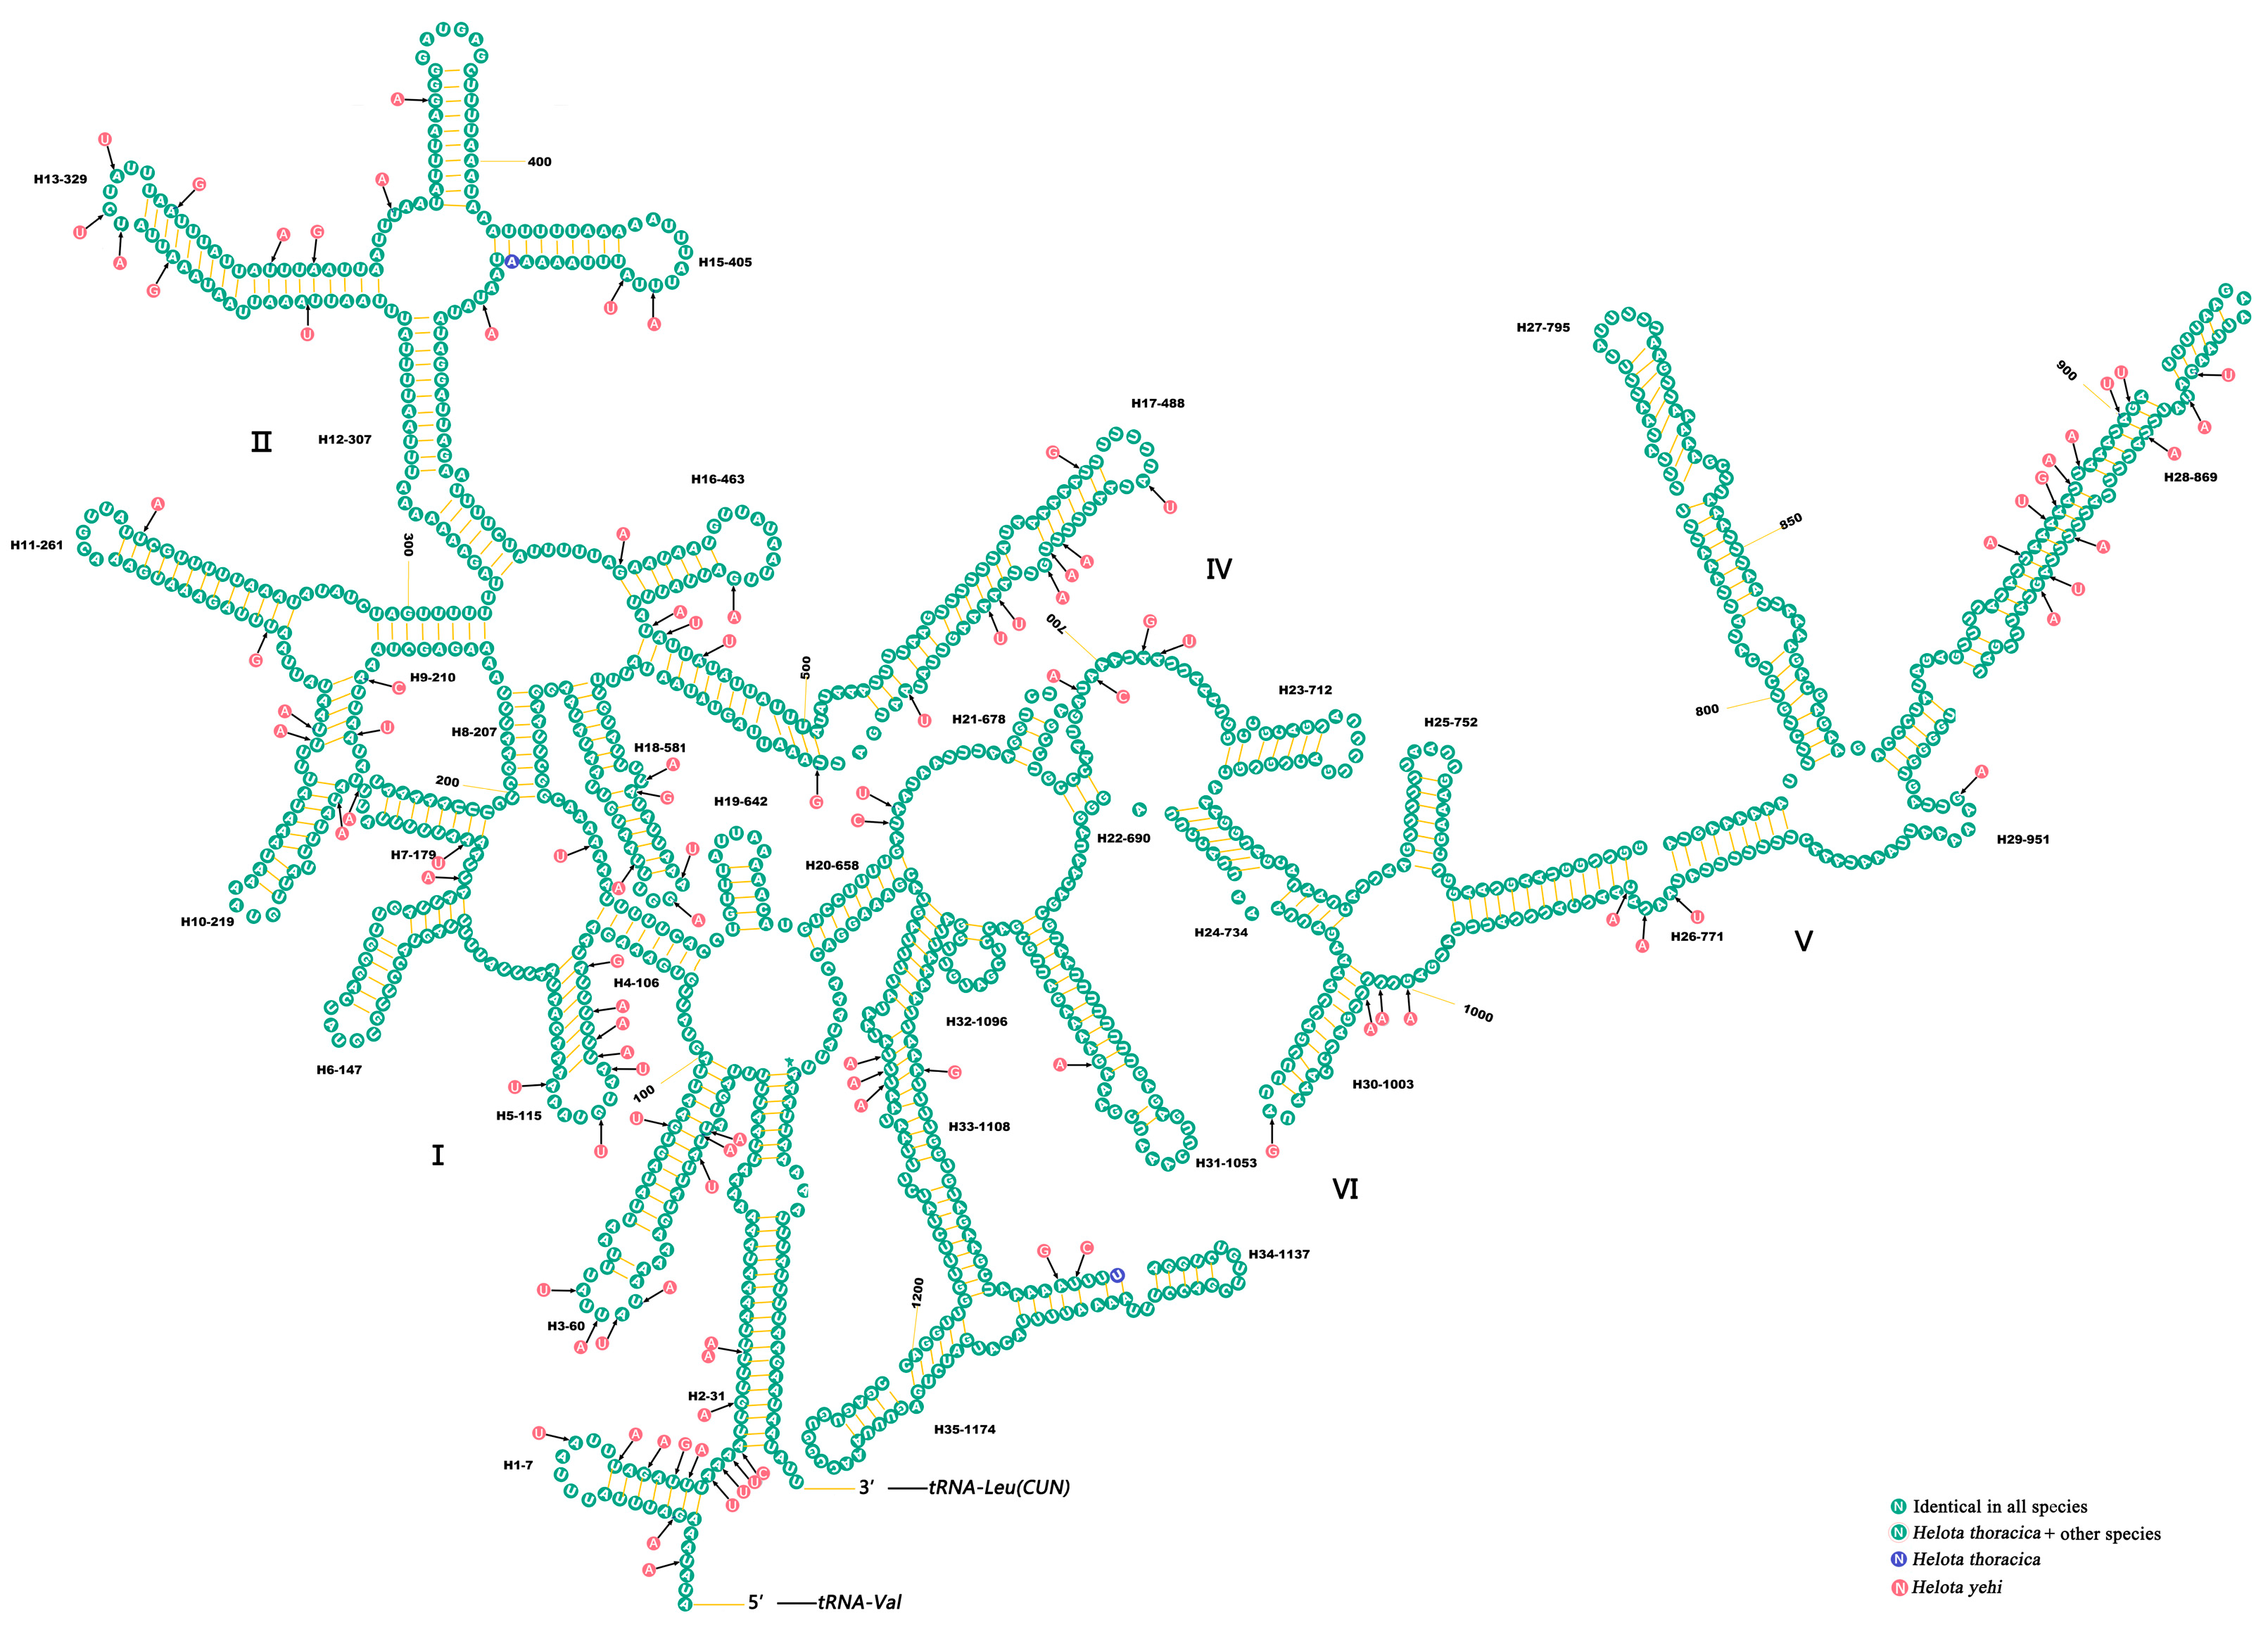
3.5. Ribosomal RNAs
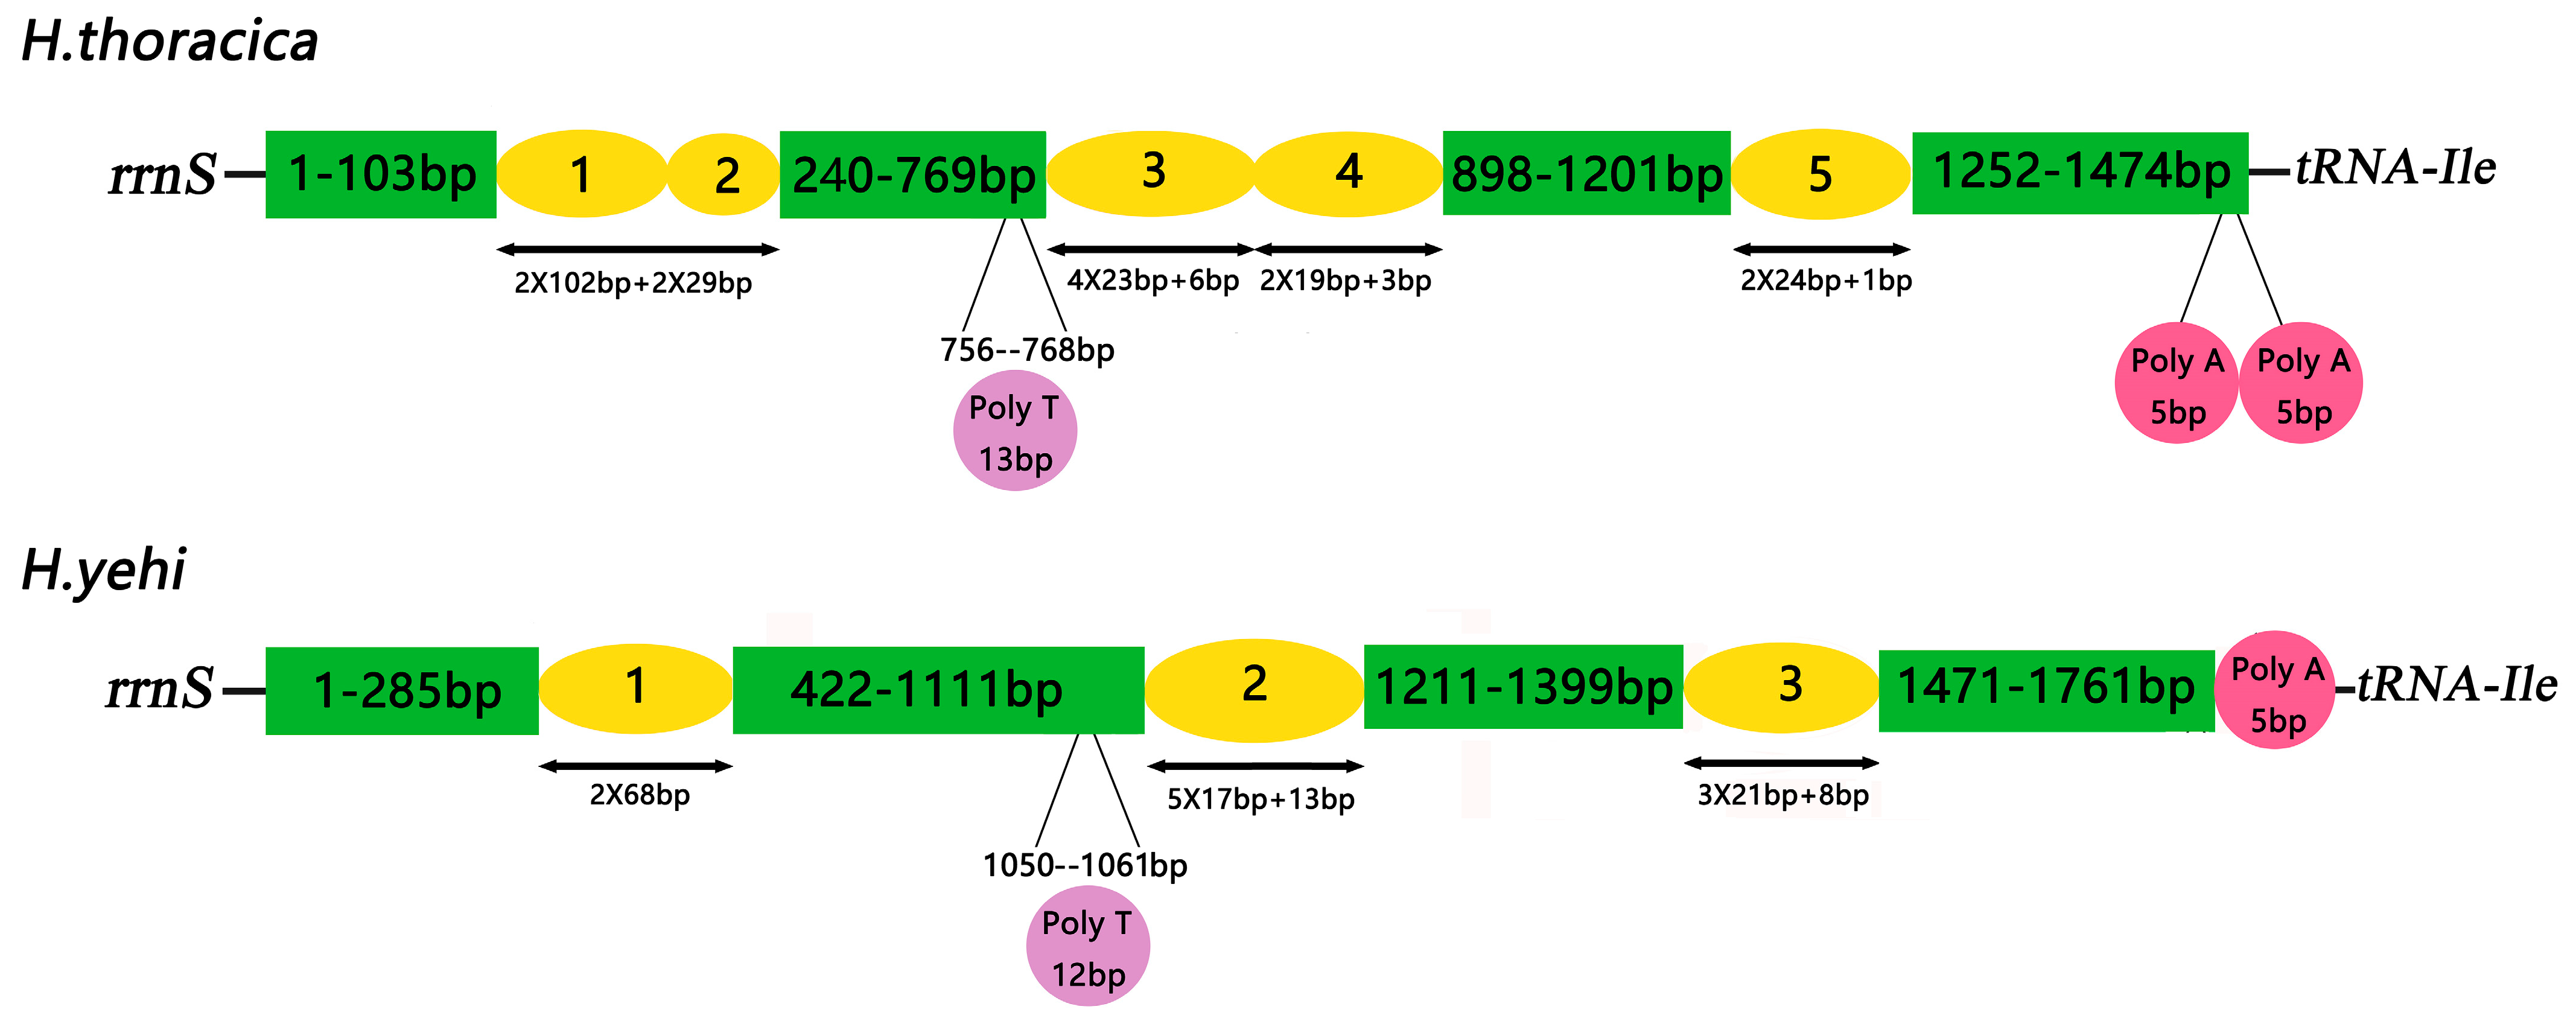
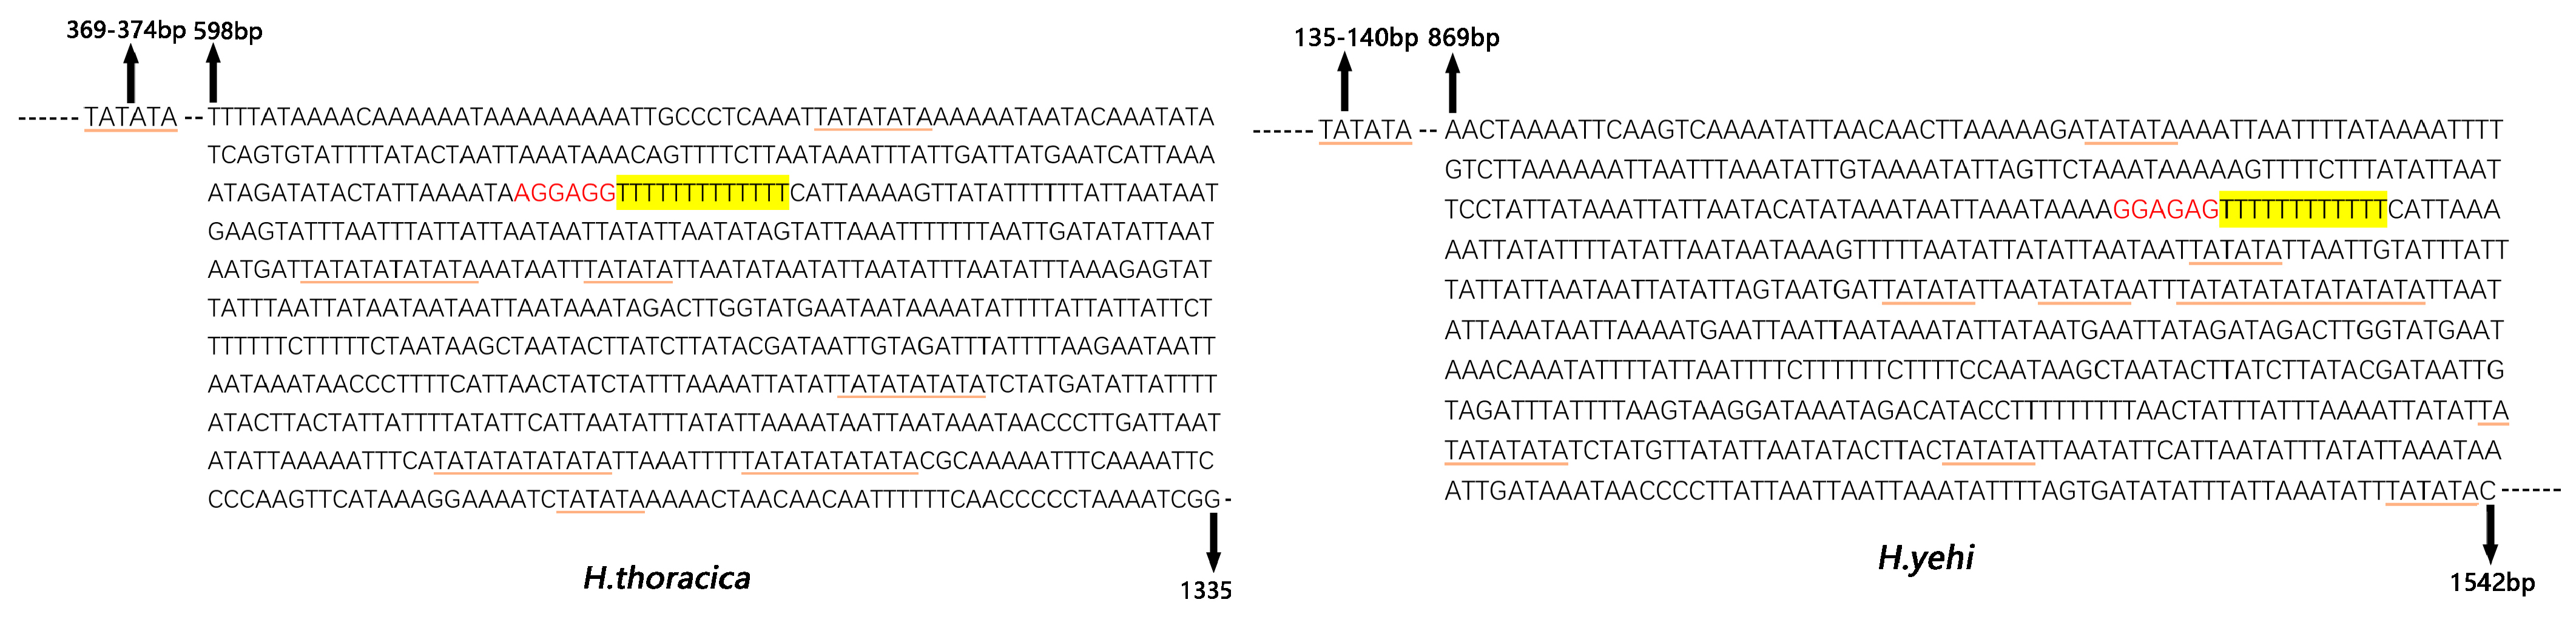
3.6. Control Region
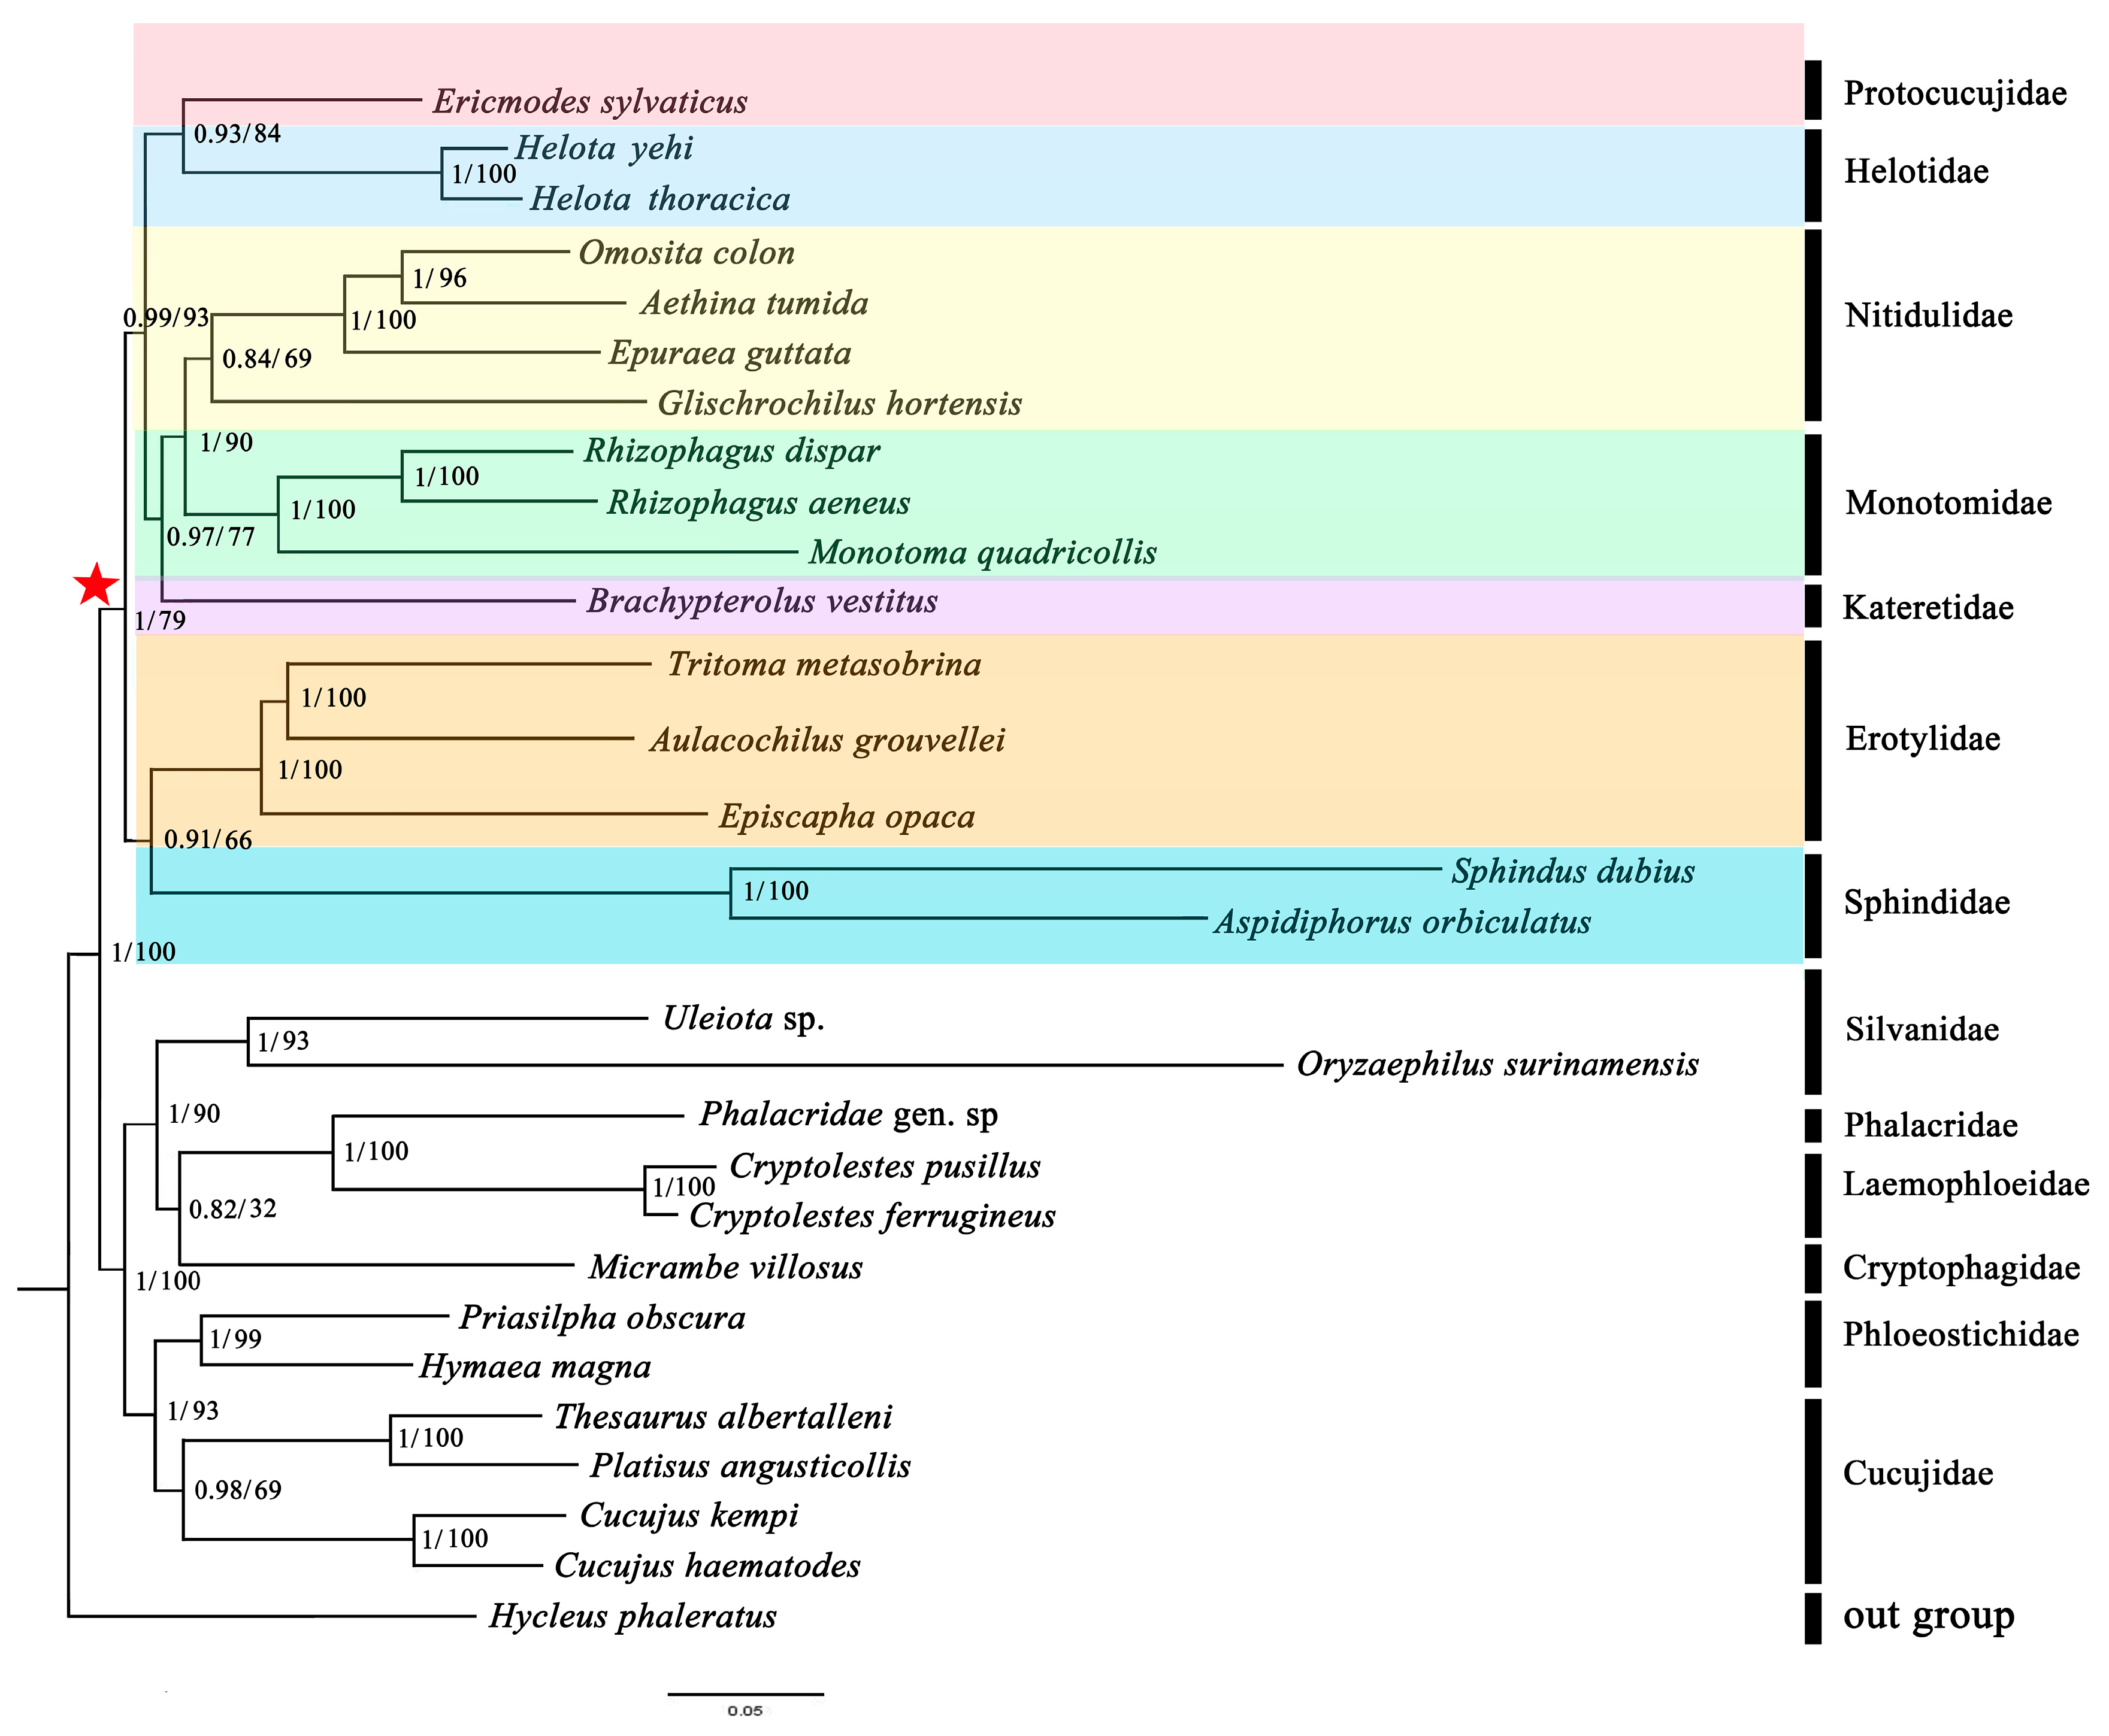
3.7. Phylogenetic Analyses
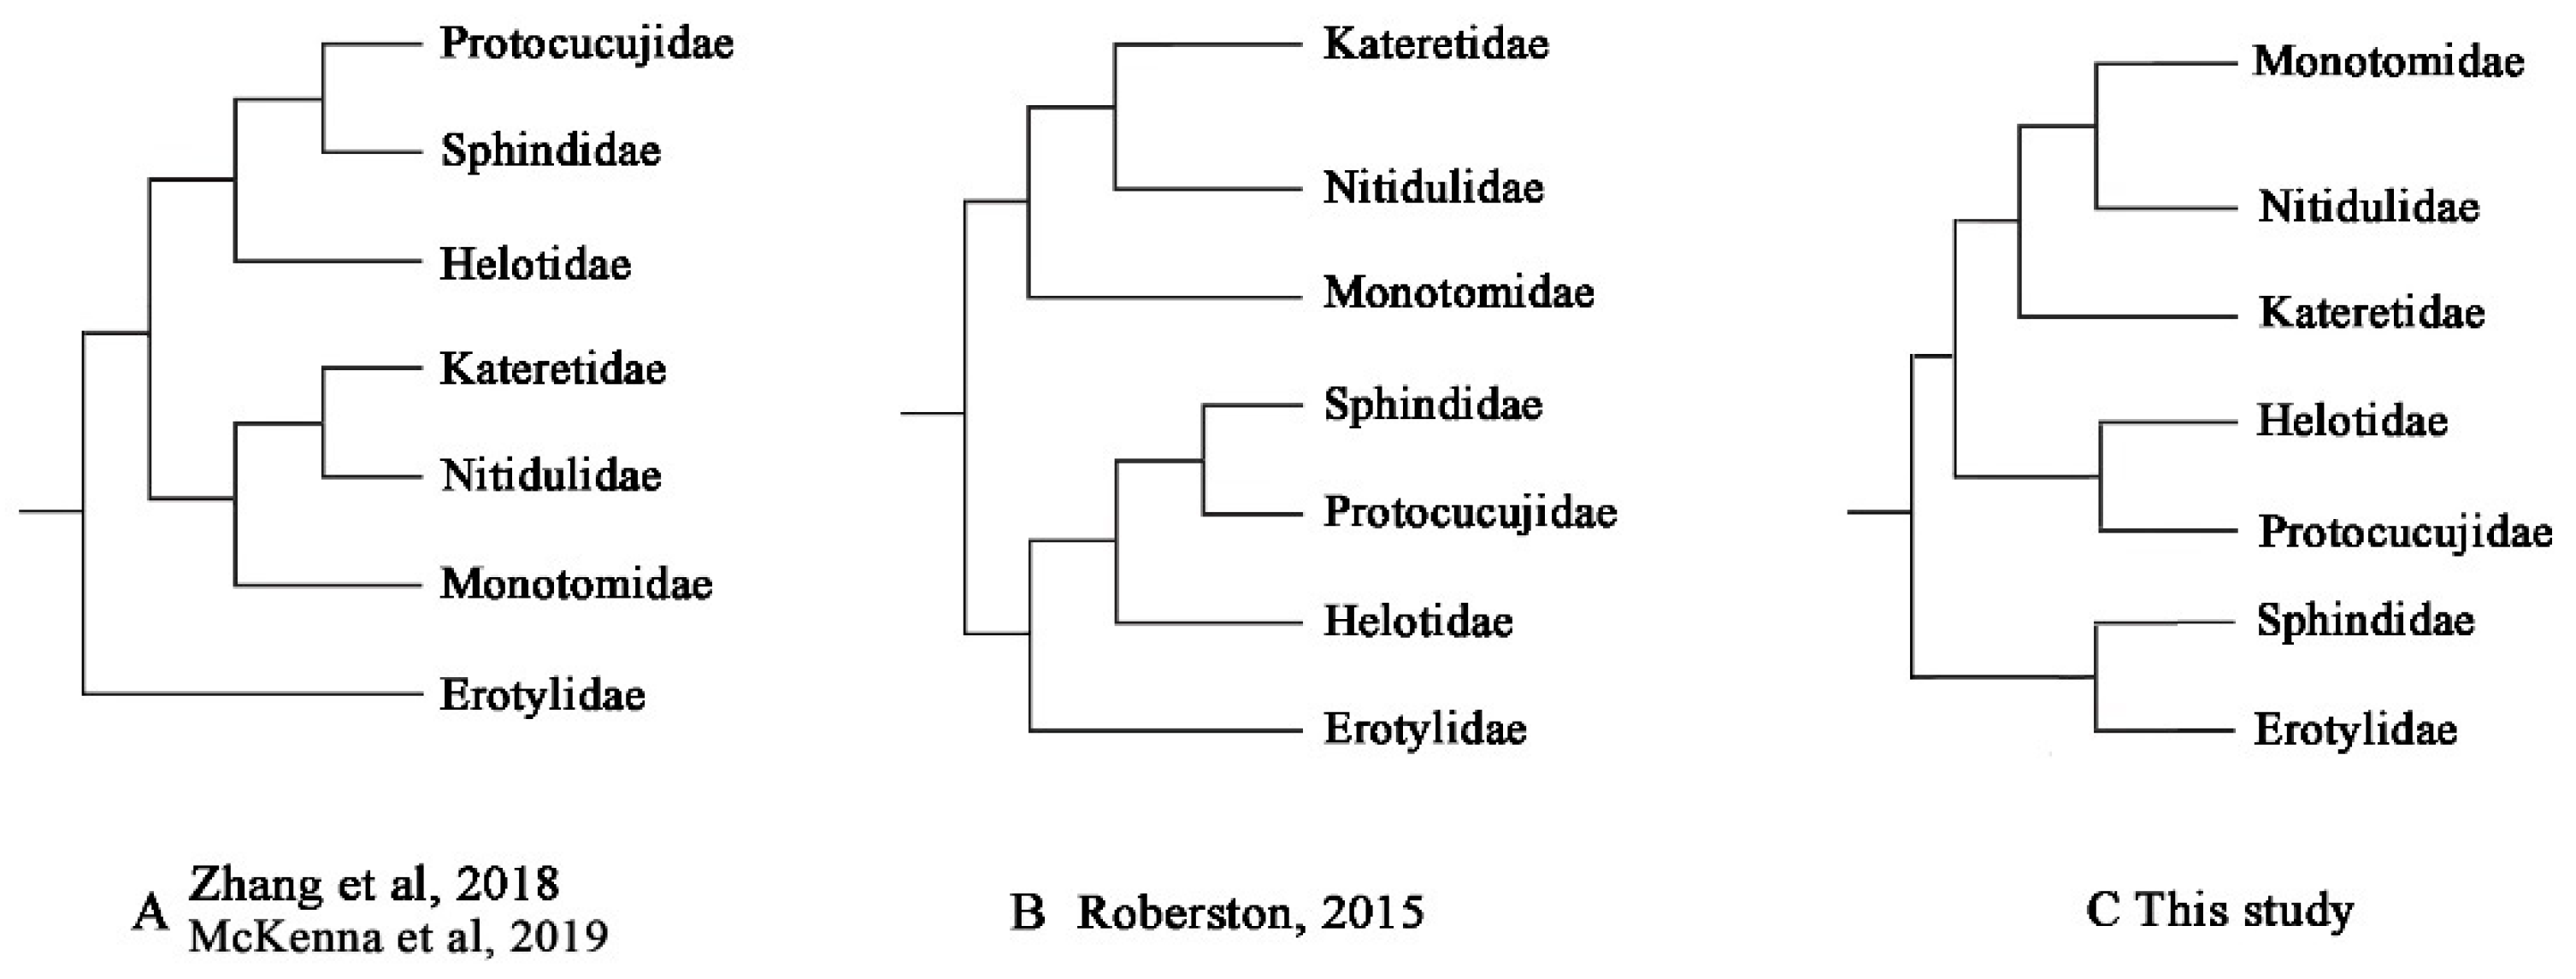
4. Discussion
4.1. Comparative Analysis of the Two Helotid Mitogenomes
4.2. Mitochondrial Phylogenomics Provides New Insights into Helotid Evolution
5. Conclusions
Supplementary Materials
Author Contributions
Funding
Institutional Review Board Statement
Informed Consent Statement
Data Availability Statement
Acknowledgments
Conflicts of Interest
References
- Wegrzynowicz, P. Catalogue of the Helotidae (Coleoptera: Cucujoidea). Zool. Meded. 2000, 73, 391–411. [Google Scholar] [CrossRef]
- Lee, C.F. Revision of family Helotidae (Coleoptera: Cucujoidea): I. Gemmata group of genus Helota. Ann. Entomol. Soc. Am. 2007, 5, 623–639. [Google Scholar] [CrossRef]
- Liu, Z.; Ślipiński, A.; Ren, D.; Pang, H. The first Mesozoic Helotidae (Coleoptera: Cucujoidea). Cretac. Res. 2019, 96, 113–119. [Google Scholar] [CrossRef]
- Lawrence, J.F.; Newton, A.F.J. Families and subfamilies of Coleoptera (with selected genera, notes, references and data on family-group names). Biol. Phylogeny Classif. Coleopt. 1995, 2, 779–1006. [Google Scholar]
- Crowson, R.A. The Natural Classification of the Families of Coleoptera; Nathaniel Lloyd: London, UK, 1955; p. 187. [Google Scholar]
- Lee, C.F.; Satô, M. The Helotidae of Taiwan (Coleoptera: Cucujoidea). Zool. Stud. 2006, 45, 529–552. [Google Scholar]
- MacLeay, W.S. Annulosa Javanica, or an Attempt to Illustrate the Natural Affinities and Analogies of the Insects Collected in Java by Thomas Horsfield; M. D. F. L & G. S. and Deposited by him in the Museum of the Honourable; East-India Company: London, UK, 1825. [Google Scholar]
- Reitter, E. Systematische Eintheilung der Trogositidae: (Familia Coleopterorum). Verh. Nat. Brünn 1876, 14, 3–66. [Google Scholar]
- Kirejtshuk, A.G. On the origin and early evolution of the superfamily Cucujoidea (Coleoptera: Polyphaga). Comments on the family Helotidae. Kharkov Entomol. 2000, 3, 7–38. [Google Scholar]
- Ohta, Y. Einigeneue Helotiden-und Coccinelliden Artenaus Formosa. Insecta Matsumurana 1929, 4, 66–70. [Google Scholar]
- Lee, C.F.; Petr, V. A revision of the family Helotidae (Coleoptera: Cucujoidea): VIII. The guerinii species-group of the genus Neohelota. Ann. Entomol. Soc. Am. 2013, 34, 269–308. [Google Scholar]
- Lee, C.F. Revision of the family Helotidae (Coleoptera: Cucujoidea) II: The Vigorsii group of the genus Helota. Ann. Entomol. Soc. Am. 2008, 101, 722–742. [Google Scholar] [CrossRef]
- Lee, C.F. Revision of the family Helotidae (Coleoptera: Cucujoidea): IV. The genus Metahelotella. Ann. Entomol. Soc. Am. 2009, 102, 785–796. [Google Scholar] [CrossRef] [Green Version]
- Lee, C.F. Revision of the family Helotidae (Coleoptera: Cucujoidea) III: The Thibetana group and a checklist of Helota MacLeay species. Ann. Entomol. Soc. Am. 2009, 102, 48–59. [Google Scholar] [CrossRef] [Green Version]
- Lee, C.F.; Petr, V. Revision of the family Helotidae (Coleoptera: Cucujoidea): IX. The Culta species group and a checklist of Neohelota species. Ann. Entomol. Soc. Am. 2014, 107, 315–338. [Google Scholar] [CrossRef]
- Sharp, D.; Muir, F. The comparative anatomy of the male genital tube in Coleoptera. Trans. R. Entomol. Soc. Lond. 1912, 3, 477 649, +78. [Google Scholar] [CrossRef]
- Leschen, R.A.B.; Lawrence, J.F.; Ślipiński, S.A. Classification of basal Cucujoidea (Coleoptera: Polyphaga): Cladistic analysis, keys and review of new families. Invertebr. Syst. 2005, 19, 17–73. [Google Scholar] [CrossRef]
- Bocak, L.; Barton, C.; Crampton-Platt, A.; Chesters, D.; Ahrens, D.; Vogler, A.P. Building the Coleoptera tree of life for >8000 species: Composition of public DNA data and fit with Linnaean classification. Syst. Entomol. 2014, 39, 97–110. [Google Scholar] [CrossRef]
- Hunt, T.; Bergsten, J.; Levkanicova, Z.; Papadopoulou, A.; John, O.S.; Wild, R.; Hammond, P.M.; Ahrens, D.; Balke, M.; Caterino, M.S.; et al. A comprehensive phylogeny of beetles reveals the evolutionary origins of a superradiation. Science 2007, 318, 1913–1916. [Google Scholar] [CrossRef]
- Robertson, J.A.; SLipiski, A.; Moulton, M.; Shockley, F.W.; Giorgi, A.; Lord, N.P.; McKenna, D.D.; Tomaszewska, W.; Forrester, J.; Miller, K.B.; et al. Phylogeny and classification of Cucujoidea and the recognition of a new superfamily Coccinelloidea (Coleoptera: Cucujiformia). Syst. Entomol. 2015, 40, 745–778. [Google Scholar] [CrossRef]
- McKenna, D.D. The beetle tree of life reveals that Coleoptera survived end-Permian mass extinction to diversify during the Cretaceous terrestrial revolution. Syst. Entomol. 2015, 40, 835–880. [Google Scholar] [CrossRef] [Green Version]
- Zhang, S.Q.; Che, L.H.; Li, Y.; Liang, D.; Pang, H.; Ślipiński, A.; Zhang, P. Evolutionary history of Coleoptera revealed by extensive sampling of genes and species. Nat. Commun. 2018, 9, 205. [Google Scholar] [CrossRef] [Green Version]
- Mckenna, D.D.; Shin, S.; Ahrens, D.; Balke, M.; Beza, C.; Clarke, D.J.; Donath, A.; Escalona, H.E.; Friedrich, F.; Letsch, H.; et al. The evolution and genomic basis of beetle diversity. Proc. Natl. Acad. Sci. USA 2019, 116, 24729–24737. [Google Scholar] [CrossRef] [PubMed] [Green Version]
- Cameron, S.L.; Lambkin, C.L.; Barker, S.C.; Whiting, M.F. A mitochondrial genome phylogeny of Diptera: Whole genome sequence data accurately resolve relationships over broad timescales with high precision. Syst. Entomol. 2017, 32, 40–59. [Google Scholar] [CrossRef]
- Crampton-Platt, A.; Yu, D.W.; Zhou, X.; Vogler, A.P. Mitochondrial metagenomics: Letting the genes out of the bottle. Giga Sci. 2016, 5, 15. [Google Scholar] [CrossRef] [PubMed] [Green Version]
- Nie, R.E.; Breeschoten, T.; Timmermans, M.J.; Nadein, K.; Xue, H.J.; Bai, M.; Huang, Y.; Yang, X.; Vogler, A.P. The phylogeny of Galerucinae (Coleoptera: Chrysomelidae) and the performance of mitochondrial genomes in phylogenetic inference compared to nuclear rRNA genes. Cladistics 2018, 34, 113–130. [Google Scholar] [CrossRef] [Green Version]
- Zhao, Y.; Jiang, M.; Wu, Y.; Song, F.; Cai, W.; Li, H. Mitochondrial genomes of three kissing bugs (Reduviidae: Triatominae) and their phylogenetic implications. Int. J. Biol. Macromol. 2019, 134, 36–42. [Google Scholar] [CrossRef]
- Mauro, D.S.; Gower, D.J.; Zardoya, R.; Wilkinson, M. A hotspot of gene order rearrangement by tandem duplication and random loss in the vertebrate mitochondrial genome. Mol. Biol. Evol. 2005, 23, 227–234. [Google Scholar] [CrossRef] [PubMed]
- Cameron, S.L.; Lo, N.; Bourguignon, T.; Svenson, G.J.; Evans, T. A mitochondrial genome phylogeny of termites (Blattodea:Termitoidae): Robust support for interfamilial relationships and molecular synapomorphies define major clades. Mol. Phylogenetics Evol. 2012, 65, 163–173. [Google Scholar] [CrossRef] [Green Version]
- Cameron, S.L. Insect mitochondrial genomics: Implications for evolution and phylogeny. Annu. Rev. Entomol. 2014, 59, 95–117. [Google Scholar] [CrossRef] [Green Version]
- Ritsema, C. A new species of the genus Helota from Thibet. Notes Leyden Mus. 1895, 17, 49–50. [Google Scholar]
- Lee, C.F.; Shih, S.Y.; Chen, C.M.; Ong, U.T. A new species of Helotidae from Taiwan (Coleoptera), with an updated checklist of Taiwanese species. Jpn. J. Syst. Entomol. 2017, 23, 175–179. [Google Scholar]
- Chen, S.; Zhou, Y.; Chen, Y.; Gu, J. fastp: An ultra-fast all-in-one FASTQ preprocessor. Bioinformatics 2018, 34, 884–890. [Google Scholar] [CrossRef] [PubMed]
- Bolger, A.M.; Lohse, M.; Usadel, B. Trimmomatic: A flexible trimmer for Illumina sequence data. Bioinformatics 2014, 30, 2114–2120. [Google Scholar] [CrossRef] [PubMed] [Green Version]
- Jian, J.J.; Yu, W.B.; Yang, J.B.; Song, Y.; Yi, T.S.; Li, D.Z. GetOrganelle: A fast and versatile toolkit for accurate de novo assembly of organelle genomes. Genome Biol. 2020, 21, 241. [Google Scholar] [CrossRef] [PubMed]
- Meng, G.; Li, Y.; Yang, C.; Liu, S. MitoZ: A toolkit for animal mitochondrial genome assembly, annotation and visualization. Nucleic Acids Res. 2019, 47, e63. [Google Scholar] [CrossRef] [Green Version]
- Kearse, M.; Moir, R.; Wilson, A.; Stones-Havas, S.; Cheung, M.; Sturrock, S.; Buxton, S.; Cooper, A.; Markowitz, S.; Duran, C.; et al. Geneious Basic: An integrated and extendable desktop software platform for the organization and analysis of sequence data. Bioinformatics 2012, 28, 1647–1649. [Google Scholar] [CrossRef] [Green Version]
- Bernt, M.; Donath, A.; Jühling, F.; Externbrink, F.; Florentz, C.; Fritzsch, G.; Pütz, J.; Middendorf, M.; Stadler, P.F. MITOS: Improved de novo Metazoan mitochondrial genome annotation. Mol. Phylogenetics Evol. 2013, 69, 313–319. [Google Scholar] [CrossRef]
- Kumar, S.; Stecher, G.; Tamura, K. Mega7: Molecular evolutionary genetics analysis version 7.0 for bigger datasets. Mol. Biol. Evol. 2016, 7, 1870. [Google Scholar] [CrossRef] [Green Version]
- Benson, G. Tandem repeats finder: A program to analyze DNA sequences. Nucleic Acids Res. 1999, 27, 573–580. [Google Scholar] [CrossRef]
- Schattner, P.; Brooks, A.N.; Lowe, T.M. The tRNA scan-SE, sno scan and sno GPS web servers for the detection of tRNAs and snoRNAs. Nucleic Acids Res. 2005, 33, 686–689. [Google Scholar] [CrossRef]
- Laslett, D.; Canbäck, B. ARWEN: A program to detect tRNA genes in metazoan mitochondrial nucleotide sequences. Bioinformatics 2008, 24, 172–175. [Google Scholar] [CrossRef] [Green Version]
- Stanislav, B.; Reuter, J.S.; Seetin, M.G.; Mathews, D.H. RNA structure: Web servers for RNA secondary structure prediction and analysis. Nucleic Acids Res. 2013, 41, 471–474. [Google Scholar] [CrossRef] [Green Version]
- Rozas, J.; Ferrer-Mata, A.; Sánchez-DelBarrio, J.C.; Guirao-Rico, S.; Librado, P.; Ramos-Onsins, S.E.; Sánchez-Gracia, A. DnaSP 6: DNA sequence polymorphism analysis of large datasets. Mol. Biol. Evol. 2017, 34, 3299–3302. [Google Scholar] [CrossRef]
- Brown, S.D.J.; Collins, R.A.; Boyer, S.; Lefort, M.C.; Malumbres, O.J.; Vink, C.J.; Cruickshank, R.H. SPIDER: An R package for the analysis of species identity and evolution, with particular reference to DNA barcoding. Mol. Ecol. Resour. 2012, 12, 562–565. [Google Scholar] [CrossRef]
- R Core Team. R: A Language and Environment for Statistical Computing; R Foundation for Statistical Computing: Vienna, Austria, 2020. [Google Scholar]
- Wang, D.; Zhang, Y.; Zhang, Z.; Zhu, J.; Yu, J. KaKs_Calculator 2.0: A toolkit incorporating Gamma-Series methods and sliding window strategies. Genom. Proteom. Bioinform. 2010, 8, 77–80. [Google Scholar] [CrossRef] [Green Version]
- Hurst, L.D. The Ka/Ks ratio: Diagnosing the form of sequence evolution. Trends Genet. 2002, 18, 486–487. [Google Scholar] [CrossRef] [PubMed]
- Thompson, J.D.; Gibson, T.J.; Plewniak, F.; Jeanmougin, F.; Higgins, D.G. The CLUSTAL_X windows interface: Flexible strategies for multiple sequence alignment aided by quality analysis tools. Nucleic Acids Res. 1997, 25, 4876–4882. [Google Scholar] [CrossRef] [Green Version]
- Nguyen, L.T.; Schmidt, H.A.; von Haeseler, A.; Minh, B.Q. IQ-TREE: A fast and effective stochastic algorithm for estimating maximum-likelihood phylogenies. Mol. Biol. Evol. 2015, 32, 268–274. [Google Scholar] [CrossRef]
- Kalyaanamoorthy, S.; Bui, Q.M.; Wong, T.K.F.; Haeseler, A.; Jermiin, L.S. ModelFinder: Fast model selection for accurate phylogenetic estimates. Nat. Methods 2017, 14, 587–589. [Google Scholar] [CrossRef]
- Minh, B.Q.; Nguyen, M.A.T.; Haeseler, A. Ultrafast approximation for phylogenetic Bootstrap. Mol. Biol. Evol. 2013, 30, 1188–1195. [Google Scholar] [CrossRef] [PubMed] [Green Version]
- Lartillot, N.; Lepage, T.; Blanquart, S. PhyloBayes 3: A Bayesian software package for phylogenetic reconstruction and molecular dating. Bioinformatics 2009, 25, 2286–2288. [Google Scholar] [CrossRef] [Green Version]
- Rambaut, A. FigTree v1.4.0: Tree Figure Drawing Tool. 2012. Available online: http://tree.bio.ed.ac.uk/software/figtree (accessed on 15 November 2022).
- Shimodaira, H.; Hasegawa, M. CONSEL: For assessing the confidence of phylogenetic tree selection. Bioinformatics 2001, 17, 1246–1247. [Google Scholar] [CrossRef] [PubMed] [Green Version]
- Shimodaira, H. An approximately unbiased test of phylogenetic tree selection. Syst. Biol. 2002, 51, 492–508. [Google Scholar] [CrossRef] [Green Version]
- Silvestro, D.; Michalak, I. raxml GUI: A graphical front-end for RAxML. Org. Divers. Evol. 2012, 12, 335–337. [Google Scholar] [CrossRef]
- Liu, J.; Wang, Y.Y.; Zhang, R.Y.; Shi, C.M.; Lu, W.C.; Li, J.; Bai, M. Three complete mitochondrial genomes of Erotylidae (Coleoptera: Cucujoidea) with higher phylogenetic analysis. Insects 2021, 12, 524. [Google Scholar] [CrossRef] [PubMed]
- Cannone, J.J.; Subramanian, S.; Schnare, M.N.; Collett, J.R.; D’Souza, L.M.; Du, Y.; Feng, B.; Lin, N.; Madabusi, L.V.; Muller, K.M. The comparative RNA Web (CRW) site: An online database of comparative sequence and structure information for ribosomal, intron, and other RNAs. BMC Bioinform. 2002, 3, 2. [Google Scholar] [CrossRef] [Green Version]
- Sun, T.Y.; Li, L.; Xin, T.; Wang, Y.; Xia, B. The complete mitochondrial genome of Cryptolestes ferrugineus (Stephens) (Coleoptera: Laemophloeidae). Mitochondrial DNA 2015, 27, 3676–3677. [Google Scholar] [CrossRef]
- Tang, J.; Huang, W.J.; Zhang, Y.L. The complete mitochondrial genome of four Hylicinae (Hemiptera: Cicadellidae): Structural features and phylogenetic implications. Insects 2020, 11, 869. [Google Scholar] [CrossRef]
- Zhao, W.Q.; Zhao, Q.; Li, M.; Wei, J.F.; Zhang, X.H.; Zhang, H.F. Comparative mitogenomic analysis of the Eurydema Genus in the context of representative pentatomidae (Hemiptera: Heteroptera) taxa. J. Insect Sci. 2019, 19, 20. [Google Scholar] [CrossRef]
- Li, R.; Lei, Z.M.; Li, W.j.; Zhang, W.; Zhou, C.F. Comparative mitogenomic analysis of Heptageniid Mayflies (Insecta: Ephemeroptera): Conserved intergenic spacer and tRNA gene duplication. Insects 2021, 12, 170. [Google Scholar] [CrossRef] [PubMed]
- McKenna, D.D. Molecular systematics of Coleoptera. In Handbook of Zoology; Arthropoda: Insecta. Coleoptera, beetles. Vol. 1: Morphology and systematics (Archostemata, Adephaga, Myxophaga, Polyphaga partim); Beutel, R.G., Leschen, R.A.B., Eds.; Walter De Gruyter: Berlin, Germany, 2016; pp. 23–34. [Google Scholar]
- Song, F.; Li, H.; Jiang, P.; Zhou, X.G.; Liu, J.P.; Sun, C.H.; Vogler, A.P.; Cai, W.Z. Capturing the phylogeny of holometabola with mitochondrial genome data and Bayesian site-heterogeneous mixture models. Genome Biol. Evol. 2016, 8, 1411–1426. [Google Scholar] [CrossRef]
- Pratlong, M.; Rancurel, C.; Pontarotti, P.; Aurelle, D. Monophyly of Anthozoa (Cnidaria): Why do nuclear and mitochondrial phylogenies disagree? Zool. Scr. 2017, 46, 363–371. [Google Scholar] [CrossRef]
- Sheffield, N.C.; Song, H.J.; Cameron, S.L.; Whiting, M.F. Nonstationary evolution and compositional heterogeneity in beetle mitochondrial phylogenomics. Syst. Biol. 2009, 58, 381–394. [Google Scholar] [CrossRef] [Green Version]
- Philippe, H.; Brinkmann, H.; Lavrov, D.V.; Littlewood, D.T.J.; Manuel, M.; Wörheide, G.; Baurain, D. Resolving difficult phylogenetic questions: Why more sequences are not enough. PLoS Biol. 2011, 9, e1000602. [Google Scholar] [CrossRef] [Green Version]
- Morgan, C.C.; Foster, P.G.; Webb, A.E.; Pisani, D.; McInerney, J.O.; O’Connell, M.J. Heterogeneous models place the root of the placental mammal phylogeny. Mol. Biol. Evol. 2013, 30, 2145–2156. [Google Scholar] [CrossRef] [Green Version]
- Li, H.; Shao, R.F.; Song, N.; Song, F.; Jiang, P.; Li, Z.H.; Cai, W.Z. Higher-level phylogeny of paraneopteran insects inferred from mitochondrial genome sequences. Sci. Rep. 2015, 5, 8527. [Google Scholar] [CrossRef] [Green Version]
- Kapli, P.; Flouri, T.; Telford, M.J. Systematic errors in phylogenetic trees. Curr. Biol. 2021, 31, 59–64. [Google Scholar] [CrossRef] [PubMed]
- Timmermans, M.J.T.N.; Barton, C.; Haran, J.; Ahrens, D.; Culverwell, L.; Ollikainen, A.; Dodsworth, S.; Foster, P.; Bocak, L.; Vogler, A.P. Family-level sampling of mitochondrial genomes in Coleoptera: Compositional heterogeneity and phylogenetics. Genome Biol. Evol. 2016, 38, 161–175. [Google Scholar] [CrossRef] [PubMed] [Green Version]
- Chang, B.S.W.; Campbell, D.L. Bias in phylogenetic reconstruction of vertebrate rhodopsin sequences. Mol. Biol. Evol. 2000, 17, 1220–1231. [Google Scholar] [CrossRef]
- Delsuc, F.; Philips, M.J.; Penny, D. Comment on ”Hexapod origins: Monophyletic or paraphyletic?”. Science 2003, 301, 1482e. [Google Scholar] [CrossRef]


| Family | Species | Gene Bank Accession No. | Size (bp) |
|---|---|---|---|
| Ingroups | |||
| Cryptophagidae | Micrambe villosus (Heer, 1841) | KX087317.1 | 17,907 |
| Cucujidae | Platisus angusticollis Reitter, 1879 | NC051936 | 15,921 |
| Cucujidae | Thesaurus albertalleni Jin and Pang, 2020 | MK614525 | 15,510 |
| Cucujidae | Cucujus kempi Grouvelle, 1913 | NC051939 | 15,492 |
| Cucujidae | Cucujus haematodes Erichson, 1845 | KX087268.1 | 16,120 |
| Kateretidae | Brachypterolus vestitus (Kiesenwetter, 1850) | KX087245.1 | 16,536 |
| Laemophloeidae | Cryptolestes ferrugineus (Stephens, 1831) | KT182067.1 | 15,511 |
| Laemophloeidae | Cryptolestes pusillus (Schénherr, 1817) | NC028204.1 | 15,502 |
| Monotomidae | Rhizophagus dispar (Paykull, 1800) | KX035133.1 | 13,423 |
| Monotomidae | Monotoma quadricollis Aubé, 1837 | NC036266.1 | 16,064 |
| Monotomidae | Rhizophagus aeneus Richter, 1820 | KX087340.1 | 16,454 |
| Nitidulidae | Epuraea guttata (Olivier, 1811) | KX087289.1 | 16,021 |
| Nitidulidae | Aethina tumida Murray, 1867 | NC036104.1 | 16,576 |
| Nitidulidae | Omosita colon (Linnaeus, 1758) | MW029385.1 | 16,544 |
| Nitidulidae | Glischrochilus hortensis (Geoffroy, 1785) | JX412778.1 | 10,677 |
| Silvanidae | Uleiota sp. | KX035149.1 | 14,967 |
| Silvanidae | Oryzaephilus surinamensis (Linnaeus, 1758) | MN535903.1 | 15,941 |
| Protocucujidae | Ericmodes sylvaticus (Philippi and Philippi, 1864) | KX035137.1 | 8404 |
| Sphindidae | Aspidiphorus orbiculatus (Gyllenhal, 1808) | KT780625.1 | 18,500 |
| Sphindidae | Sphindus dubius (Gyllenhal, 1808) | JX412803.1 | 10,509 |
| Phloeostichidae | Hymaea magna Sen Gupta and Crowson, 1966 | NC051933.1 | 16,888 |
| Phloeostichidae | Priasilpha obscura Broun, 1893 | EU877952.1 | 16,603 |
| Phalacridae | Phalacridae gen. sp | MK614530.1 | 15,938 |
| Erotylidae | Aulacochilus grouvellei Achard, 1923 | MW291531 | 15,607 |
| Erotylidae | Tritoma metasobrina Chûjȏ, 1941 | MZ014622 | 16,502 |
| Erotylidae | Episcapha opaca Heller, 1920 | MZ014623 | 15,581 |
| Helotidae | Helota thoracica (Ritsema, 1895) | OP964453 | 16,112 |
| Helotidae | Helota yehi Lee, 2017 | OP964454 | 16,401 |
| Outgroup | |||
| Meloidae | Hycleus phaleratus (Pallas, 1781) | MF491389.1 | 16,004 |
| Feature | A + T (%) | AT Skew | GC Skew | |||
|---|---|---|---|---|---|---|
| H. thoracica | H. yehi | H. thoracica | H. yehi | H. thoracica | H. yehi | |
| CG | 77.00 | 77.91 | 0.05 | −0.03 | −0.23 | 0.20 |
| PCGs | 74.97 | 75.84 | −0.13 | −0.14 | −0.04 | −0.03 |
| rRNA | 81.32 | 81.31 | −0.05 | −0.04 | 0.34 | 0.31 |
| rrnL | 82.50 | 82.11 | −0.06 | −0.04 | 0.35 | 0.32 |
| rrnS | 79.30 | 79.97 | −0.04 | −0.05 | 0.32 | 0.29 |
| tRNA | 78.22 | 78.57 | 0.02 | 0.02 | 0.12 | 0.13 |
| CR | 84.87 | 85.73 | 0.01 | 0.02 | −0.33 | −0.33 |
| Family-Level Phylogeny Hypothesis | AU | SH | KH | PP |
|---|---|---|---|---|
| A: Zhang et al., 2018 [22]; McKenna et al., 2019 [23] | 0.123 | 0.127 | 0.127 | 4 × 10⁻⁸ |
| B: Robertson et al., 2015 [20] | 0.124 | 0.127 | 0.127 | 4 × 10⁻⁸ |
| C: this study | 0.877 | 0.873 | 0.873 | 1.000 |
Disclaimer/Publisher’s Note: The statements, opinions and data contained in all publications are solely those of the individual author(s) and contributor(s) and not of MDPI and/or the editor(s). MDPI and/or the editor(s) disclaim responsibility for any injury to people or property resulting from any ideas, methods, instructions or products referred to in the content. |
© 2023 by the authors. Licensee MDPI, Basel, Switzerland. This article is an open access article distributed under the terms and conditions of the Creative Commons Attribution (CC BY) license (https://creativecommons.org/licenses/by/4.0/).
Share and Cite
Liu, J.; Yang, Y.; Yan, Z.; Wang, H.; Bai, M.; Shi, C.; Li, J. Analysis of the Mitogenomes of Two Helotid Species Provides New Insights into the Phylogenetic Relationship of the Basal Cucujoidea (Insecta: Coleoptera). Biology 2023, 12, 135. https://doi.org/10.3390/biology12010135
Liu J, Yang Y, Yan Z, Wang H, Bai M, Shi C, Li J. Analysis of the Mitogenomes of Two Helotid Species Provides New Insights into the Phylogenetic Relationship of the Basal Cucujoidea (Insecta: Coleoptera). Biology. 2023; 12(1):135. https://doi.org/10.3390/biology12010135
Chicago/Turabian StyleLiu, Jing, Yuhang Yang, Zihan Yan, Haishan Wang, Ming Bai, Chengmin Shi, and Jing Li. 2023. "Analysis of the Mitogenomes of Two Helotid Species Provides New Insights into the Phylogenetic Relationship of the Basal Cucujoidea (Insecta: Coleoptera)" Biology 12, no. 1: 135. https://doi.org/10.3390/biology12010135