
Temperature Response of Metabolic Activity of an Antarctic Nematode


Abstract
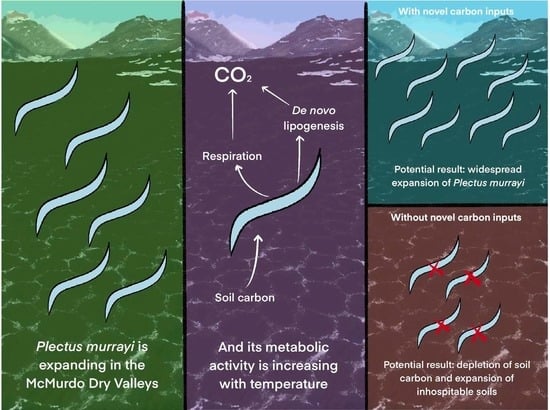
:Simple Summary
Abstract
1. Introduction
2. Materials and Methods
2.1. Nematode Isolation
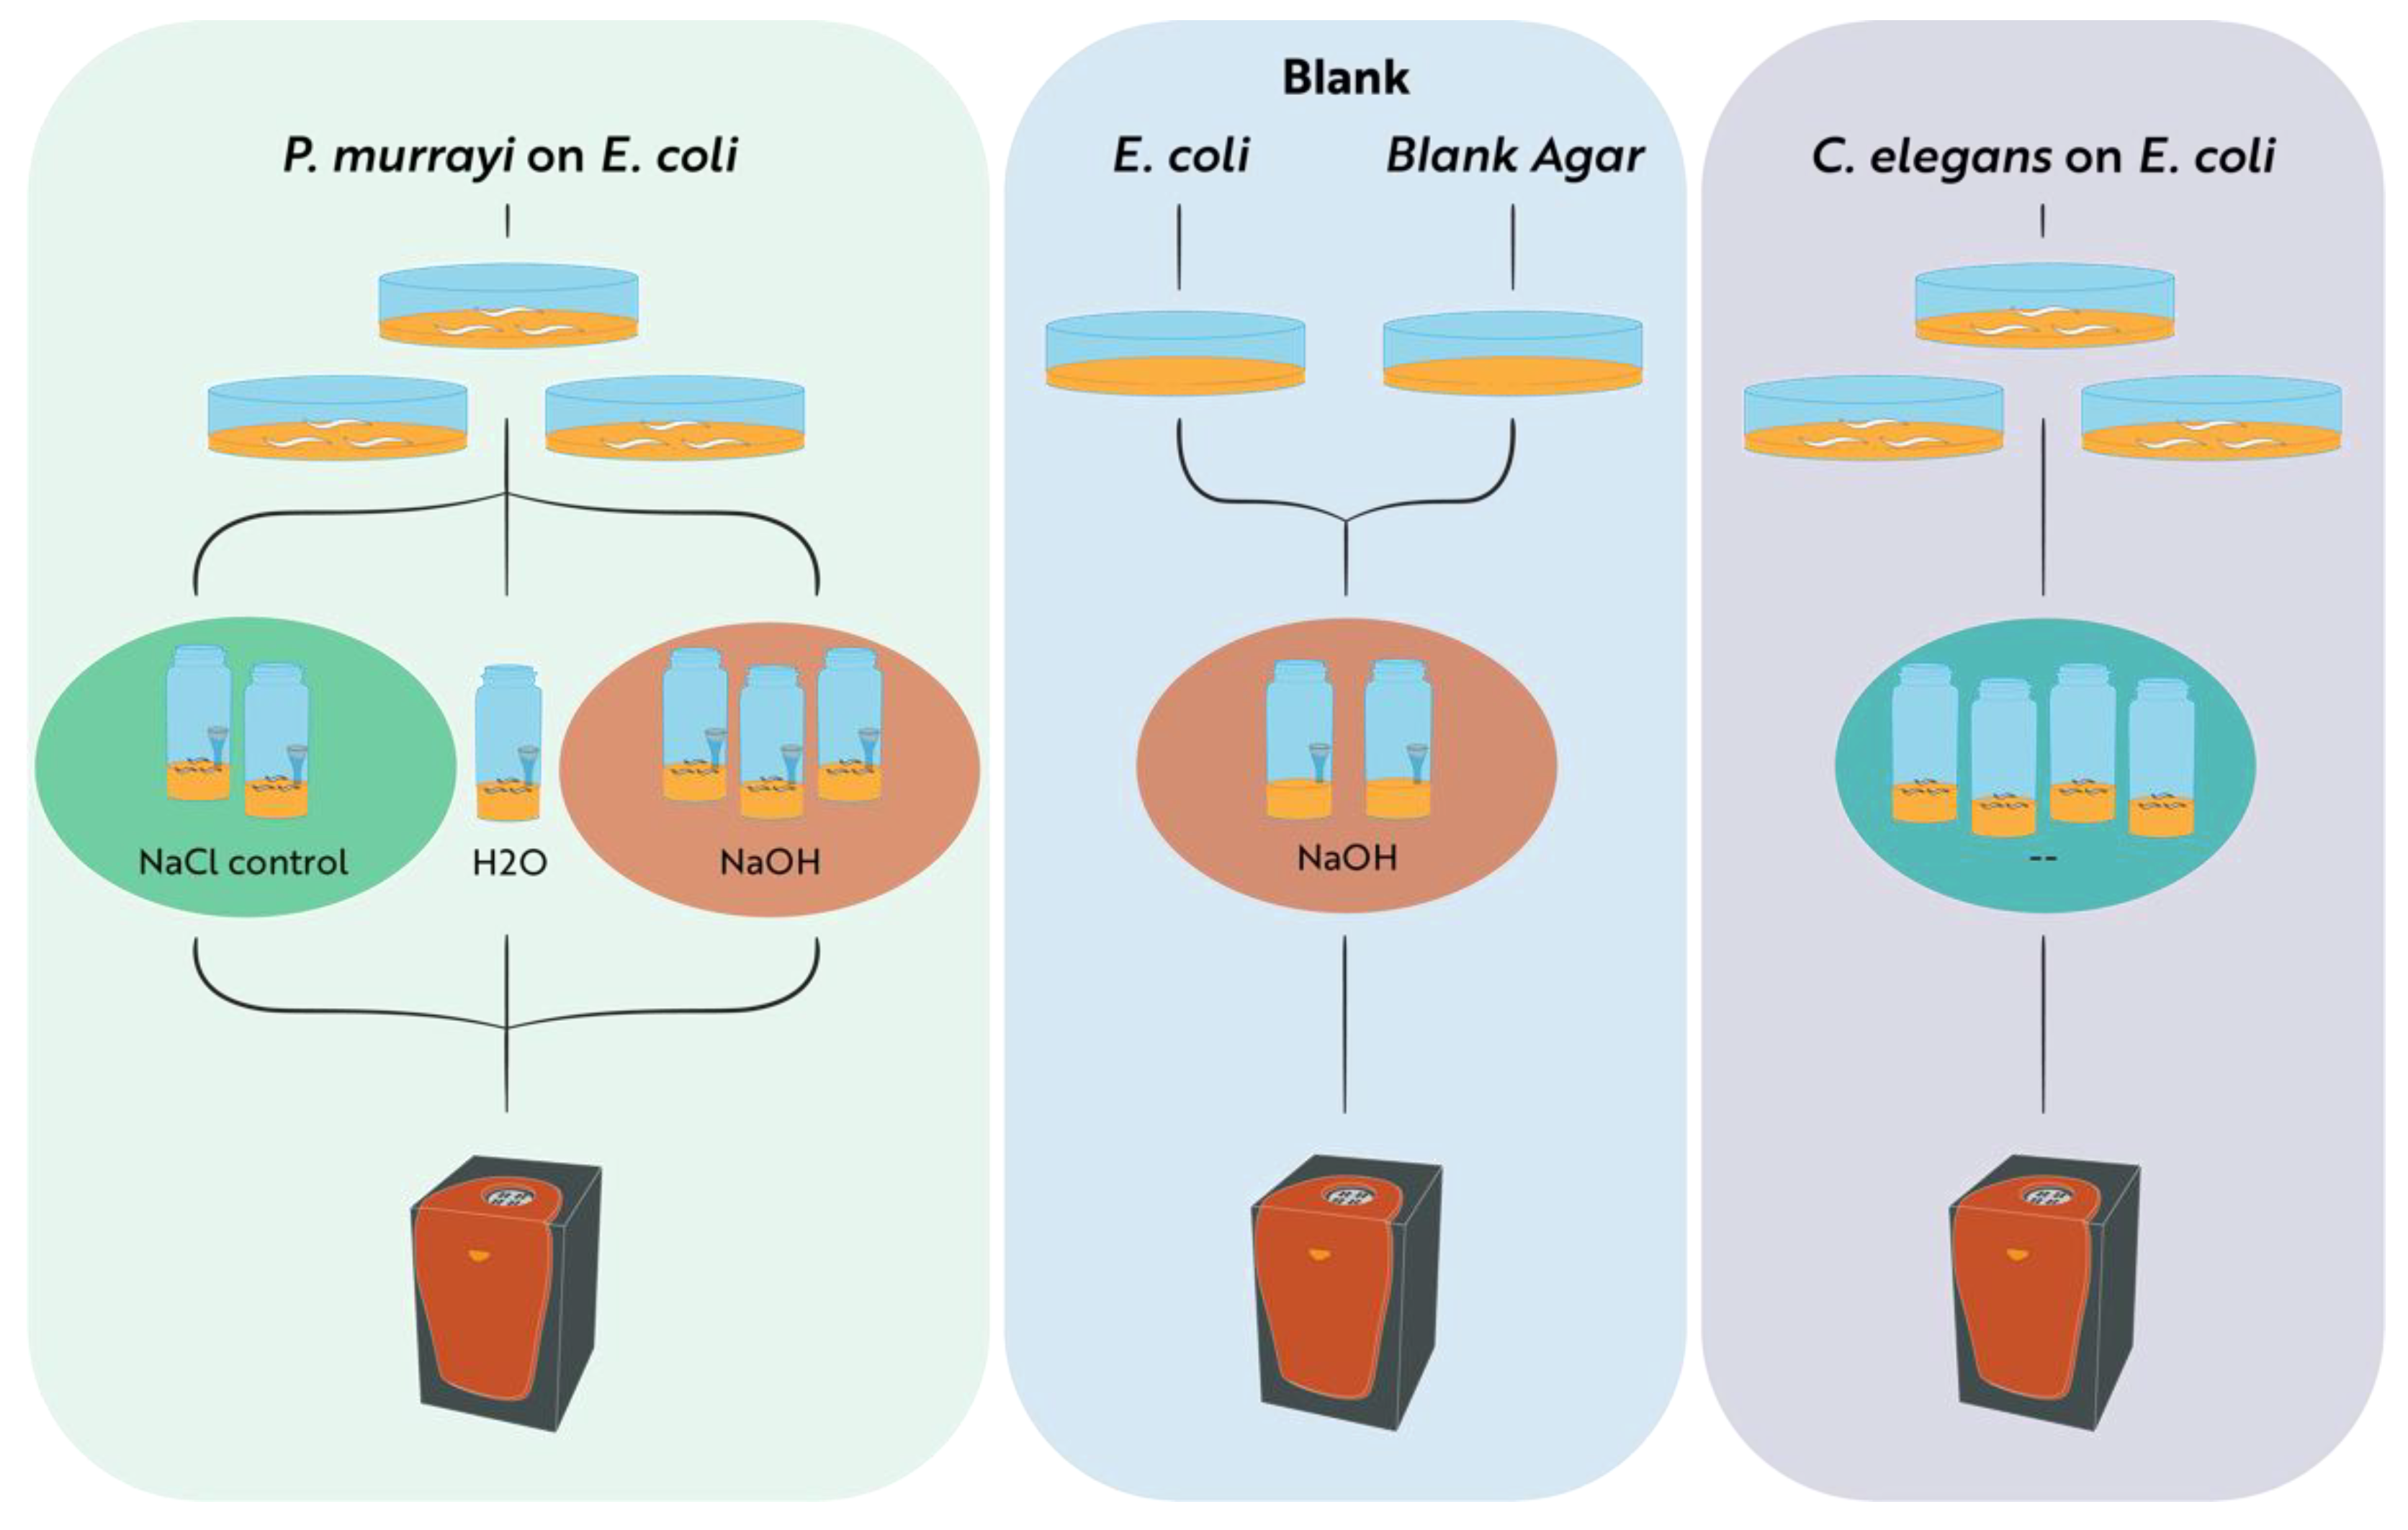
2.2. Microcalorimetric Measurements of Heat and CO2 Production Rates
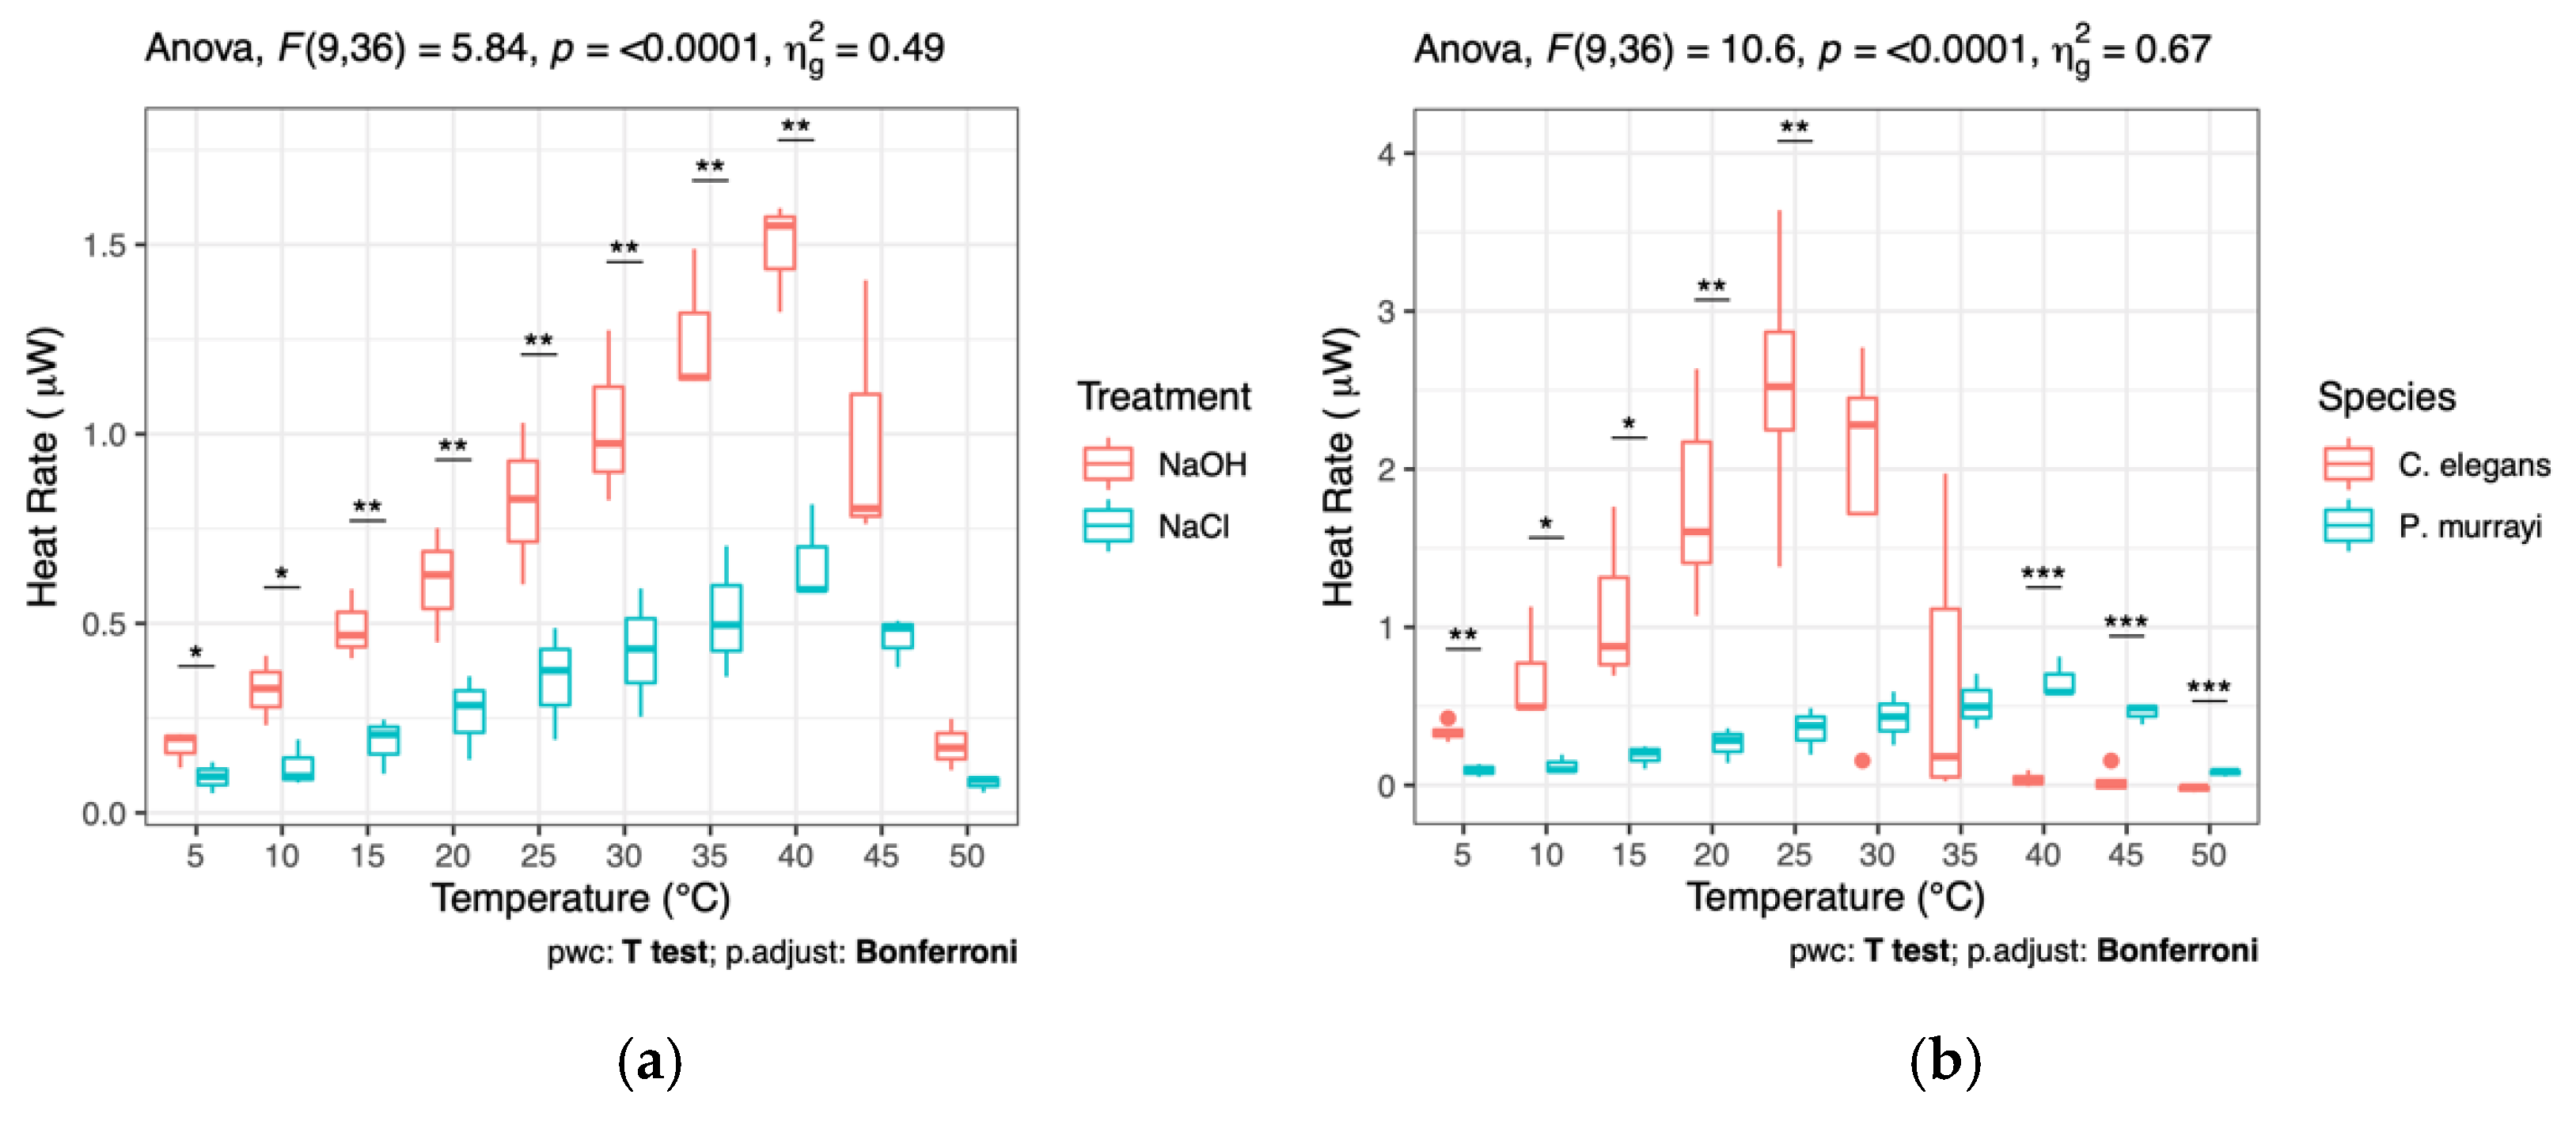
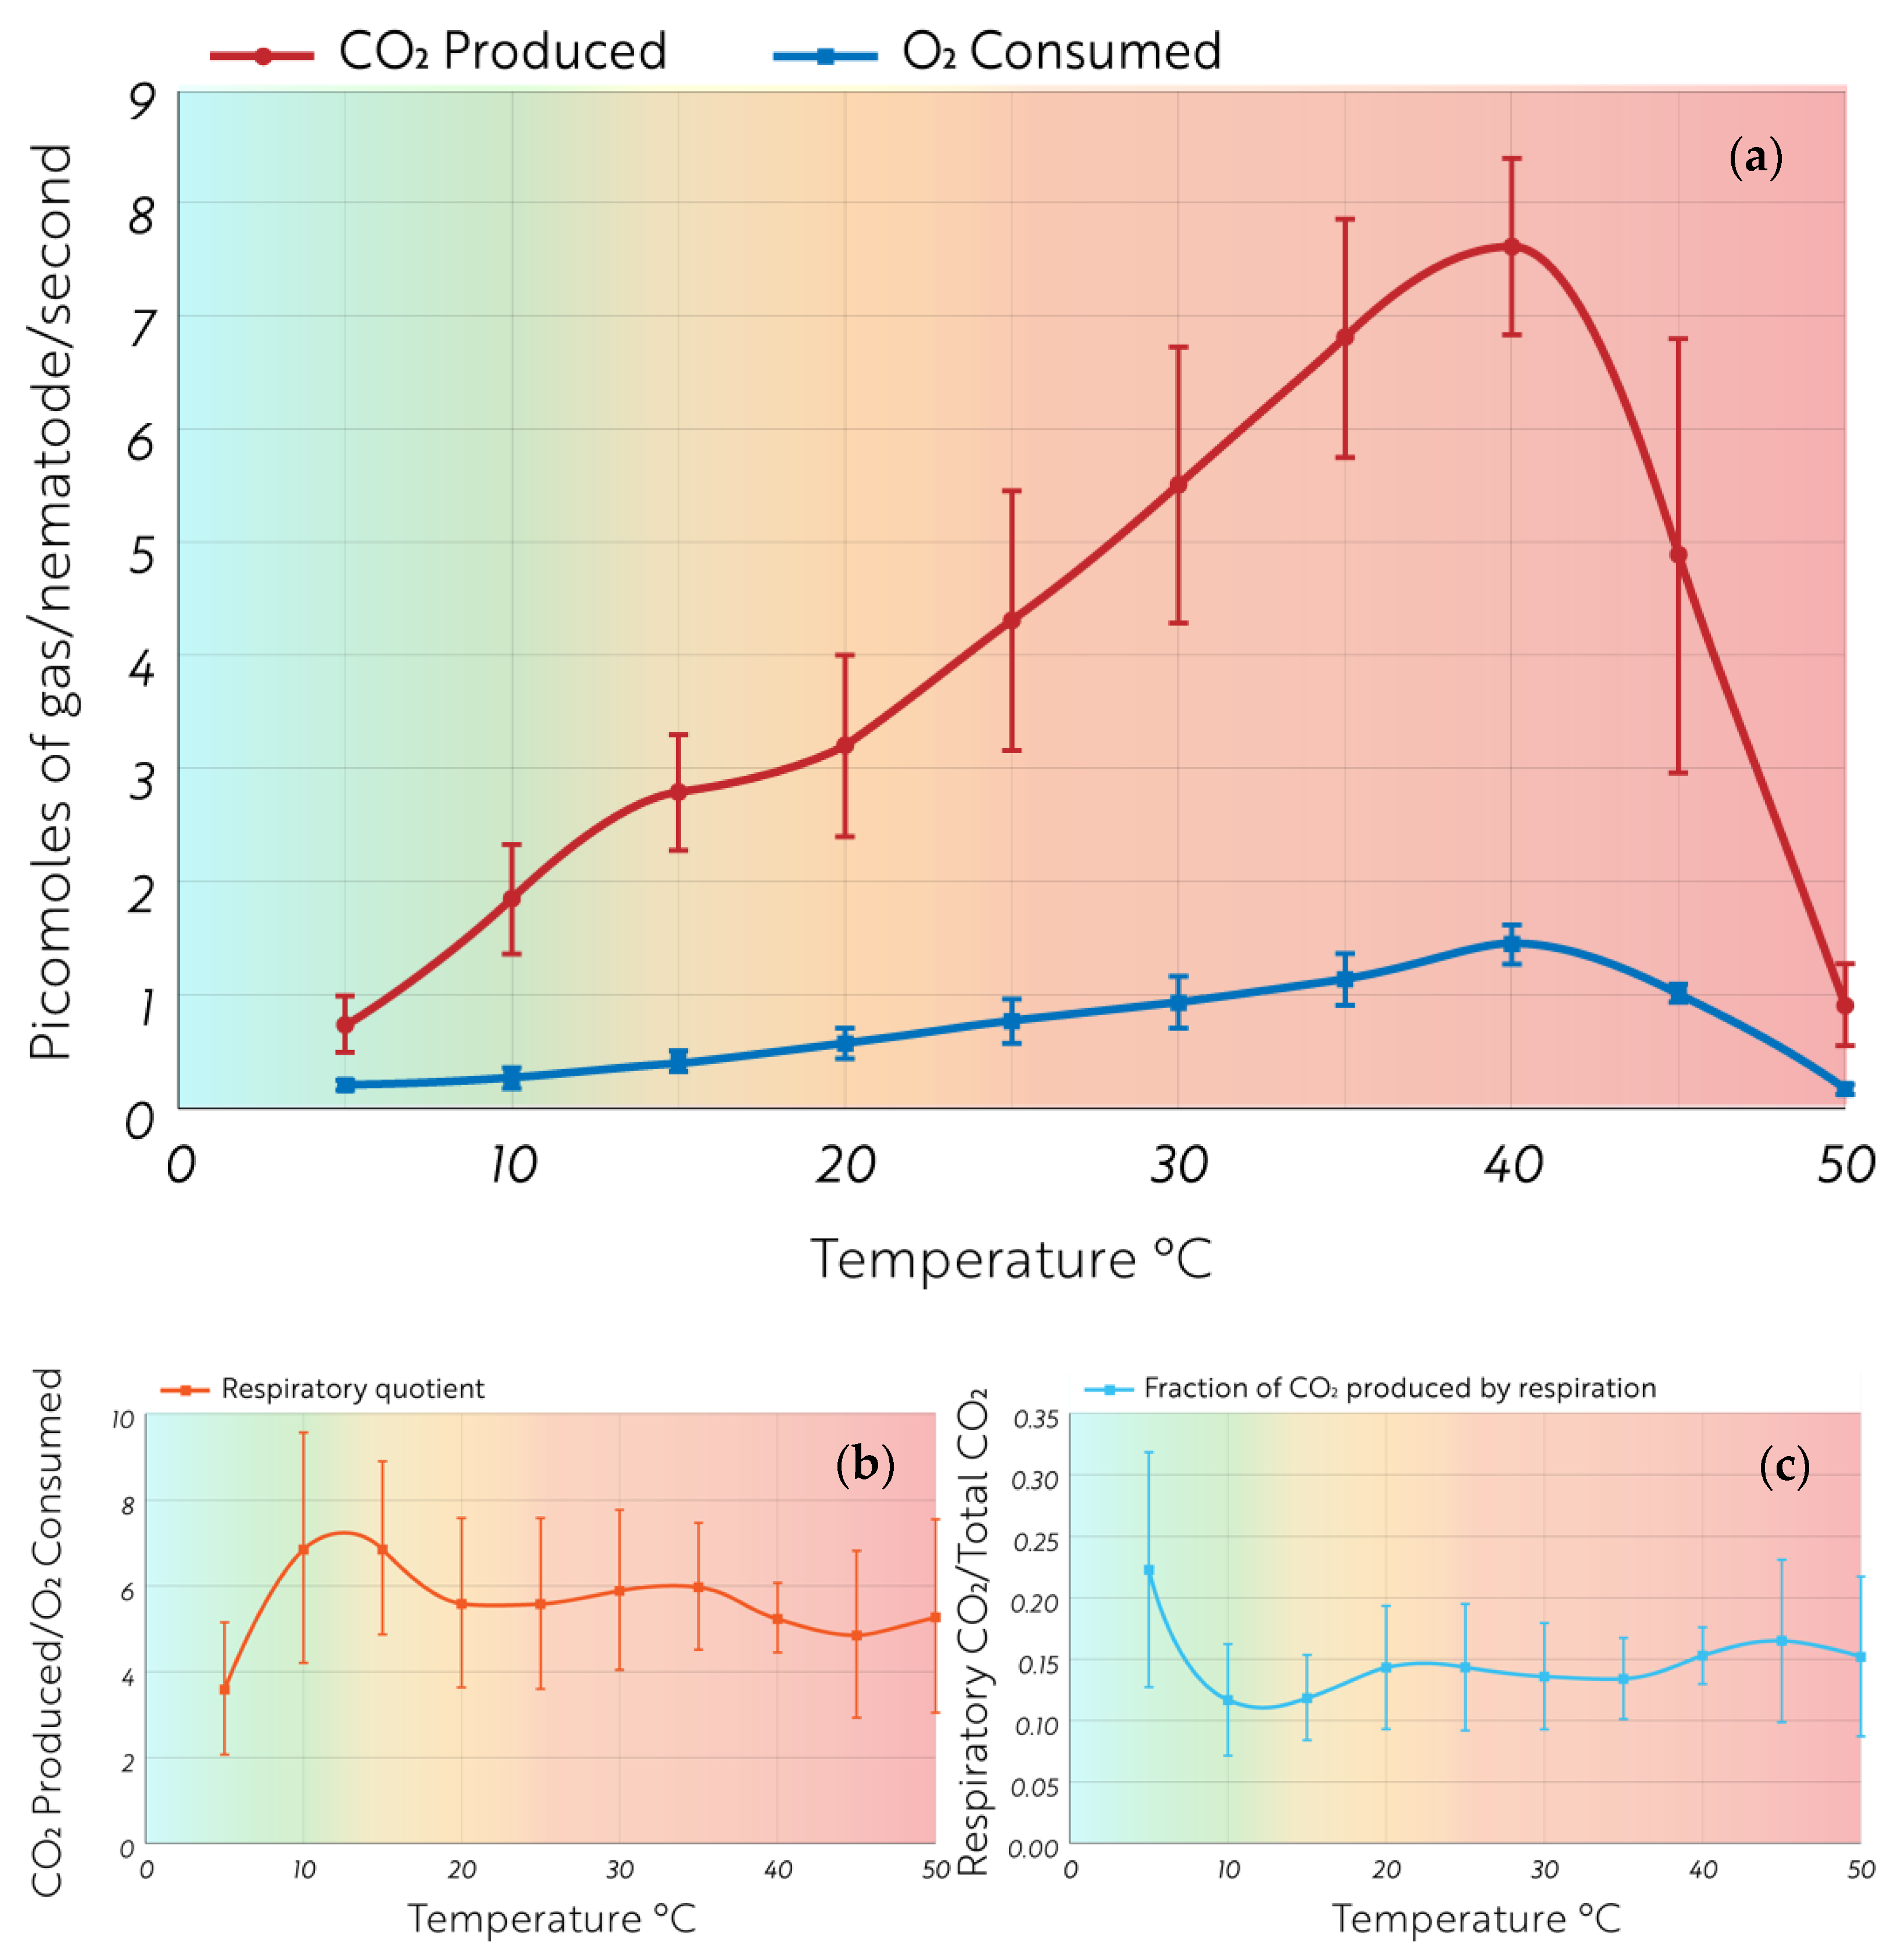
3. Results
4. Discussion
Ecological Impacts
5. Conclusions
Author Contributions
Funding
Institutional Review Board Statement
Informed Consent Statement
Data Availability Statement
Acknowledgments
Conflicts of Interest
Appendix A


References
- Pachauri, R.K.; Allen, M.R.; Barros, V.R.; Broome, J.; Cramer, W.; Christ, R.; Church, J.A.; Clarke, L.; Dahe, Q.; Dasgupta, P.; et al. Climate Change 2014: Synthesis Report. Contribution of Working Groups I, II and III to the Fifth Assessment Report of the Intergovernmental Panel on Climate Change; Pachauri, R.K., Meyer, L., Eds.; IPCC: Geneva, Switzerland, 2014; p. 151. ISBN 978-92-9169-143-2. [Google Scholar]
- Turner, J.; Colwell, S.R.; Marshall, G.J.; Lachlan-Cope, T.A.; Carleton, A.M.; Jones, P.D.; Lagun, V.; Reid, P.A.; Iagovkina, S. Antarctic Climate Change during the Last 50 Years. Int. J. Climatol. 2005, 25, 279–294. [Google Scholar] [CrossRef]
- Nielsen, U.N.; Wall, D.H.; Adams, B.J.; Virginia, R.A. Antarctic Nematode Communities: Observed and Predicted Responses to Climate Change. Polar Biol. 2011, 34, 1701–1711. [Google Scholar] [CrossRef]
- Steig, E.J.; Schneider, D.P.; Rutherford, S.D.; Mann, M.E.; Comiso, J.C.; Shindell, D.T. Warming of the Antarctic Ice-Sheet Surface since the 1957 International Geophysical Year. Nature 2009, 457, 459–462. [Google Scholar] [CrossRef] [PubMed] [Green Version]
- Fountain, A.G.; Lyons, W.B.; Burkins, M.B.; Dana, G.L.; Doran, P.T.; Lewis, K.J.; McKnight, D.M.; Moorhead, D.L.; Parsons, A.N.; Priscu, J.C.; et al. Physical Controls on the Taylor Valley Ecosystem, Antarctica. BioScience 1999, 49, 961–971. [Google Scholar] [CrossRef]
- Andriuzzi, W.S.; Adams, B.J.; Barrett, J.E.; Virginia, R.A.; Wall, D.H. Observed Trends of Soil Fauna in the Antarctic Dry Valleys: Early Signs of Shifts Predicted under Climate Change. Ecology 2018, 99, 312–321. [Google Scholar] [CrossRef]
- Adams, B.J.; Bardgett, R.D.; Ayres, E.; Wall, D.H.; Aislabie, J.; Bamforth, S.; Bargagli, R.; Cary, C.; Cavacini, P.; Connell, L.; et al. Diversity and Distribution of Victoria Land Biota. Soil Biol. Biochem. 2006, 38, 3003–3018. [Google Scholar] [CrossRef]
- Adams, B.J.; Wall, D.H.; Virginia, R.A.; Broos, E.; Knox, M.A. Ecological Biogeography of the Terrestrial Nematodes of Victoria Land, Antarctica. Zookeys 2014, 419, 29–71. [Google Scholar] [CrossRef] [Green Version]
- Adhikari, B.N.; Wall, D.H.; Adams, B.J. Desiccation Survival in an Antarctic Nematode: Molecular Analysis Using Expressed Sequenced Tags. BMC Genom. 2009, 10, 69. [Google Scholar] [CrossRef] [Green Version]
- Convey, P. Soil Faunal Community Response to Environmental Manipulation on Alexander Island, Southern Maritime Antarctic. In Antarctic Biology in a Global Context; Huiskes, A.H.L., Gieskes, W.W.C., Rozema, J., Schorno, R.M.L., van der Vies, S.M., Wolff, W.J., Eds.; Backhuys Publishers: Leiden, The Netherlands, 2003; pp. 74–78. ISBN 978-90-5782-079-3. [Google Scholar]
- Nielsen, U.N.; Ball, B.A. Impacts of Altered Precipitation Regimes on Soil Communities and Biogeochemistry in Arid and Semi-Arid Ecosystems. Glob. Chang. Biol. 2015, 21, 1407–1421. [Google Scholar] [CrossRef]
- Nielsen, U.N.; Wall, D.H. The Future of Soil Invertebrate Communities in Polar Regions: Different Climate Change Responses in the Arctic and Antarctic? Ecol. Lett. 2013, 16, 409–419. [Google Scholar] [CrossRef]
- Simmons, B.L.; Wall, D.H.; Adams, B.J.; Ayres, E.; Barrett, J.E.; Virginia, R.A. Long-Term Experimental Warming Reduces Soil Nematode Populations in the McMurdo Dry Valleys, Antarctica. Soil Biol. Biochem. 2009, 41, 2052–2060. [Google Scholar] [CrossRef]
- Smith, T.E.; Wall, D.H.; Hogg, I.D.; Adams, B.J.; Nielsen, U.N.; Virginia, R.A. Thawing Permafrost Alters Nematode Populations and Soil Habitat Characteristics in an Antarctic Polar Desert Ecosystem. Pedobiologia 2012, 55, 75–81. [Google Scholar] [CrossRef]
- Courtright, E.; Wall, D.; Virginia, R. Determining Habitat Suitability for Soil Invertebrates in an Extreme Environment: The McMurdo Dry Valleys, Antarctica. Antarct. Sci. 2001, 13, 9–17. [Google Scholar] [CrossRef]
- Ball, B.A.; Virginia, R.A. Meltwater Seep Patches Increase Heterogeneity of Soil Geochemistry and Therefore Habitat Suitability. Geoderma 2012, 189–190, 652–660. [Google Scholar] [CrossRef]
- Adhikari, B.N.; Wall, D.H.; Adams, B.J. Effect of Slow Desiccation and Freezing on Gene Transcription and Stress Survival of an Antarctic Nematode. J. Exp. Biol. 2010, 213, 1803–1812. [Google Scholar] [CrossRef] [PubMed] [Green Version]
- Gooseff, M.N.; Barrett, J.E.; Adams, B.J.; Doran, P.T.; Fountain, A.G.; Lyons, W.B.; McKnight, D.M.; Priscu, J.C.; Sokol, E.R.; Takacs-Vesbach, C.; et al. Decadal Ecosystem Response to an Anomalous Melt Season in a Polar Desert in Antarctica. Nat. Ecol. Evol. 2017, 1, 1334–1338. [Google Scholar] [CrossRef] [PubMed]
- Convey, P.; Wynn-Williams, D.D. Antarctic Soil Nematode Response to Artificial Climate Amelioration. Eur. J. Soil Biol. 2002, 38, 255–259. [Google Scholar] [CrossRef]
- Fritsen, C.; Grue, A.; Priscu, J. Distribution of Organic Carbon and Nitrogen in Surface Soils in the McMurdo Dry Valleys, Antarctica. Polar Biol. 2000, 23, 121–128. [Google Scholar] [CrossRef]
- Wall, D.H.; Virginia, R.A. Controls on Soil Biodiversity: Insights from Extreme Environments. Appl. Soil Ecol. Sect. Agric. Ecosyst. Environ. 1999, 13, 137–150. [Google Scholar] [CrossRef]
- Joyal, J.; Hansen, L.; Coons, D.; Booth, G.; Smith, B.; Mill, D. Calorespirometric Determination of the Effects of Temperature, Humidity, Low O2 and High CO2 on the Development of Musca Domestica Pupae. J. Therm. Anal. Calorim. 2005, 82, 703–709. [Google Scholar] [CrossRef]
- Acar, E.B.; Mill, D.D.; Smith, B.N.; Hansen, L.D.; Booth, G.M. Calorespirometric Determination of the Effects of Temperature on Metabolism of Harmonia Axyridis (Col: Coccinellidae) from Second Instars to Adults. Environ. Entomol. 2004, 33, 832–838. [Google Scholar] [CrossRef]
- Neven, L.G.; Lehrman, N.J.; Hansen, L.D. Effects of Temperature and Modified Atmospheres on Diapausing 5th Instar Codling Moth Metabolism. J. Therm. Biol. 2014, 42, 9–14. [Google Scholar] [CrossRef] [PubMed]
- Freckman, D.W.; Virginia, R.A. Low-Diversity Antarctic Soil Nematode Communities: Distribution and Response to Disturbance. Ecology 1997, 78, 363–369. [Google Scholar] [CrossRef]
- Adhikari, B.N.; Tomasel, C.M.; Li, G.; Wall, D.H.; Adams, B.J. Culturing the Antarctic Nematode Plectus Murrayi. Cold Spring Harb. Protoc. 2010, 2010, pdb.prot5522. [Google Scholar] [CrossRef]
- Criddle, R.S.; Fontana, A.J.; Rank, D.R.; Paige, D.; Hansen, L.D.; Breidenbach, R.W. Simultaneous Measurement of Metabolic Heat Rate, CO2 Production, and O2 Consumption by Microcalorimetry. Anal. Biochem. 1991, 194, 413–417. [Google Scholar] [CrossRef]
- Criddle, R.S.; Breidenbach, R.W.; Rank, D.R.; Hopkin, M.S.; Hansen, L.D. Simultaneous Calorimetric and Respirometric Measurements on Plant Tissues. Thermochim. Acta 1990, 172, 213–221. [Google Scholar] [CrossRef]
- Acar, B.; Smith, B.; Hansen, L.; Booth, G. Use of Calorespirometry to Determine Effects of Temperature on Metabolic Efficiency of an Insect. Environ. Entomol. 2001, 30, 811–816. [Google Scholar] [CrossRef]
- Thornton, W.M. XV. The Relation of Oxygen to the Heat of Combustion of Organic Compounds. Lond. Edinb. Dublin Philos. Mag. J. Sci. 1917, 33, 196–203. [Google Scholar] [CrossRef]
- Barrett, J.E.; Virginia, R.A.; Wall, D.H.; Adams, B.J. Decline in a Dominant Invertebrate Species Contributes to Altered Carbon Cycling in a Low-Diversity Soil Ecosystem. Glob. Chang. Biol. 2008, 14, 1734–1744. [Google Scholar] [CrossRef] [Green Version]
- Gemal, E.L.; Green, T.G.A.; Cary, S.C.; Colesie, C. High Resilience and Fast Acclimation Processes Allow the Antarctic Moss Bryum Argenteum to Increase Its Carbon Gain in Warmer Growing Conditions. Biology 2022, 11, 1773. [Google Scholar] [CrossRef]
- von Stockar, U.; Liu, J. Does Microbial Life Always Feed on Negative Entropy? Thermodynamic Analysis of Microbial Growth. Biochim. Biophys. Acta 1999, 1412, 191–211. [Google Scholar] [CrossRef] [PubMed] [Green Version]
- Toner, J.D.; Sletten, R.S.; Prentice, M.L. Soluble Salt Accumulations in Taylor Valley, Antarctica: Implications for Paleolakes and Ross Sea Ice Sheet Dynamics. J. Geophys. Res. Earth Surf. 2013, 118, 198–215. [Google Scholar] [CrossRef]
- Gropper, S.A.S.; Smith, J.L.; Groff, J.L. Advanced Nutrition and Human Metabolism; Wadsworth/Cengage Learning: Boston, MA, USA, 2009; ISBN 978-0-495-11657-8. [Google Scholar]
- Perez, C.L.; Gilst, M.R.V. A 13C Isotope Labeling Strategy Reveals the Influence of Insulin Signaling on Lipogenesis in C. elegans. Cell Metab. 2008, 8, 266–274. [Google Scholar] [CrossRef] [PubMed] [Green Version]
- Talal, S.; Cease, A.; Farington, R.; Medina, H.E.; Rojas, J.; Harrison, J. High Carbohydrate Diet Ingestion Increases Post-Meal Lipid Synthesis and Drives Respiratory Exchange Ratios above 1. J. Exp. Biol. 2021, 224, jeb240010. [Google Scholar] [CrossRef]
- Guschina, I.A.; Harwood, J.L. Mechanisms of Temperature Adaptation in Poikilotherms. FEBS Lett. 2006, 580, 5477–5483. [Google Scholar] [CrossRef] [PubMed]


Disclaimer/Publisher’s Note: The statements, opinions and data contained in all publications are solely those of the individual author(s) and contributor(s) and not of MDPI and/or the editor(s). MDPI and/or the editor(s) disclaim responsibility for any injury to people or property resulting from any ideas, methods, instructions or products referred to in the content. |
© 2023 by the authors. Licensee MDPI, Basel, Switzerland. This article is an open access article distributed under the terms and conditions of the Creative Commons Attribution (CC BY) license (https://creativecommons.org/licenses/by/4.0/).
Share and Cite
Robinson, C.M.; Hansen, L.D.; Xue, X.; Adams, B.J. Temperature Response of Metabolic Activity of an Antarctic Nematode. Biology 2023, 12, 109. https://doi.org/10.3390/biology12010109
Robinson CM, Hansen LD, Xue X, Adams BJ. Temperature Response of Metabolic Activity of an Antarctic Nematode. Biology. 2023; 12(1):109. https://doi.org/10.3390/biology12010109
Chicago/Turabian StyleRobinson, Colin Michael, Lee D. Hansen, Xia Xue, and Byron J. Adams. 2023. "Temperature Response of Metabolic Activity of an Antarctic Nematode" Biology 12, no. 1: 109. https://doi.org/10.3390/biology12010109