
Simulation and Techno-Economical Evaluation of a Microalgal Biofertilizer Production Process
 , , , and
Abstract
:Simple Summary
Abstract
1. Introduction
2. Materials and Methods
2.1. Raw Material
2.2. Proposed Process
2.2.1. Biomass Storage
2.2.2. Microalgal Biomass Pretreatment
2.2.3. Protein Hydrolysis
2.2.4. Centrifugation
2.2.5. Free-Amino-Acid Concentrate Storage and Packaging
2.2.6. Solar Thermal Collector
Heat-Storage System
Heat-Capture System
2.3. Process Modelling and Simulation: Material and Energy Balances
2.4. Economic Analysis
3. Results and Discussion
3.1. Production of Biofertilizer and Consumption of Reagents and Heating Energy per Year
3.2. Equipment Selection, Sizing, and Cost Estimation
3.2.1. Liquid Packaging Machine
3.2.2. Thermal Solar Collectors
3.3. Investment Capital
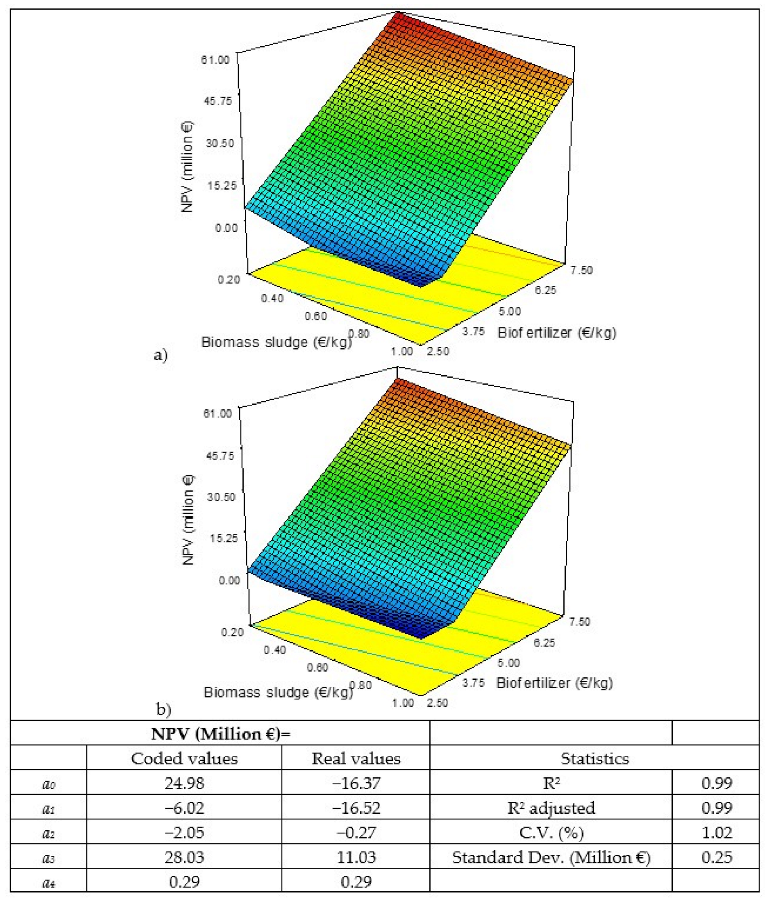
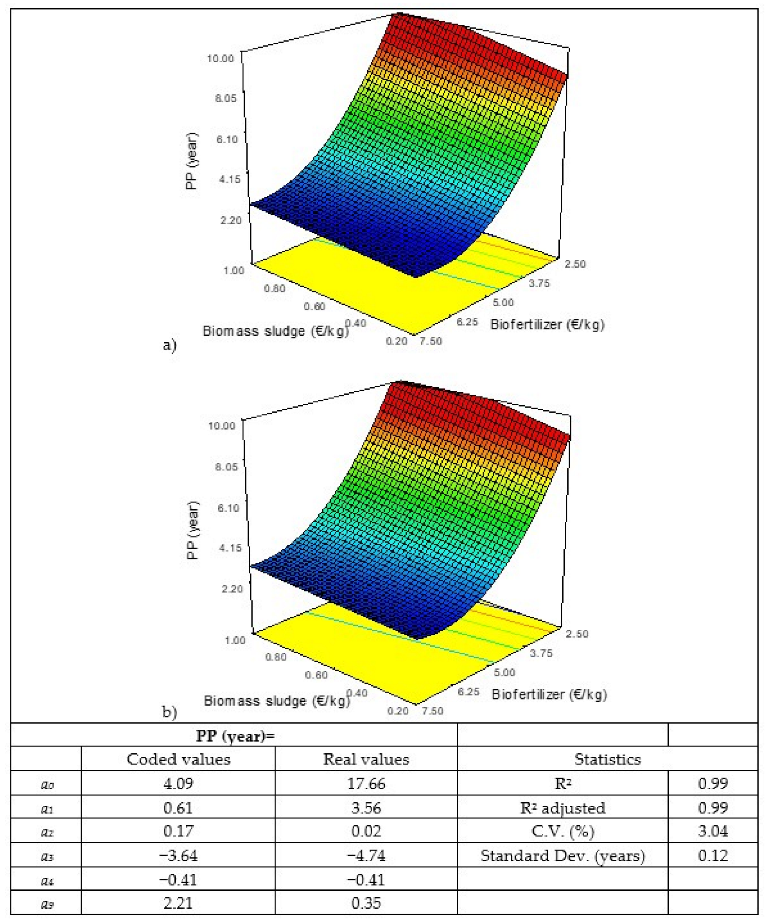
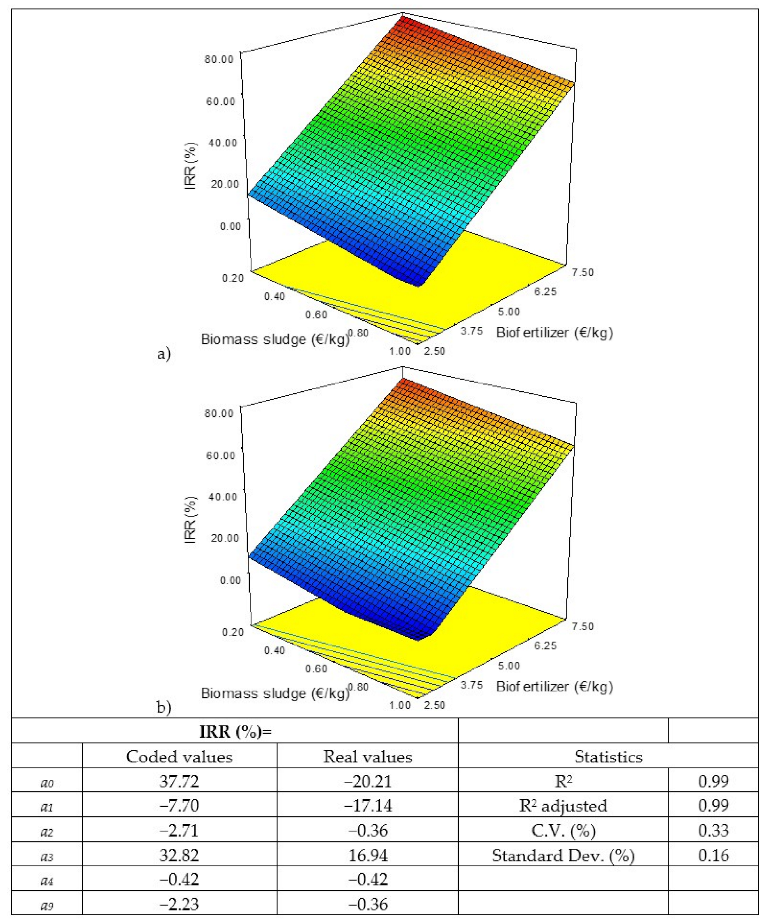
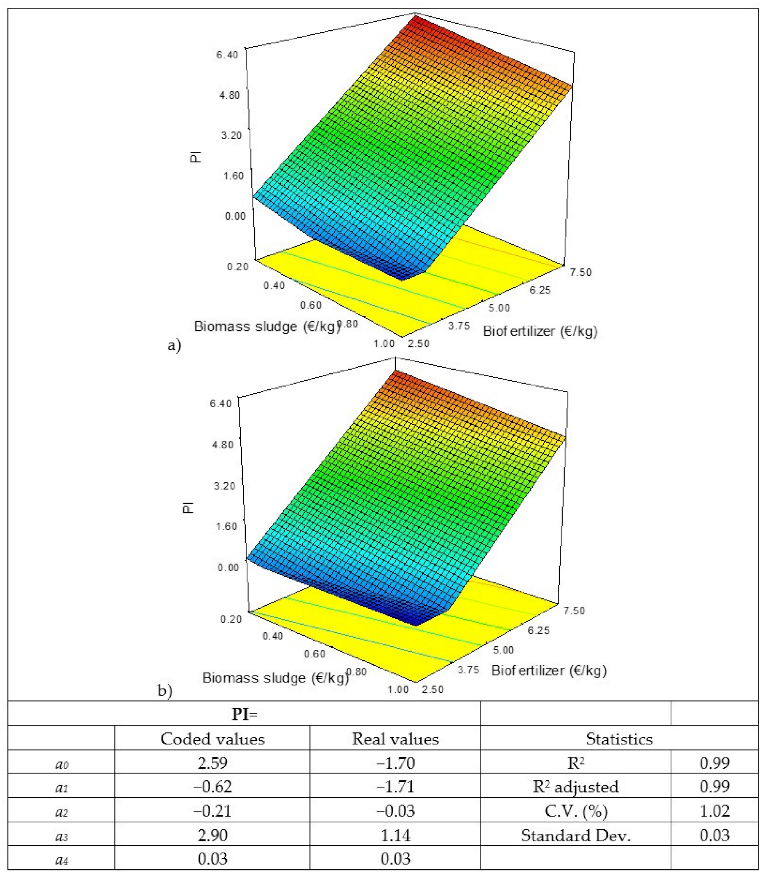
3.4. Economic Sensitivity Analysis
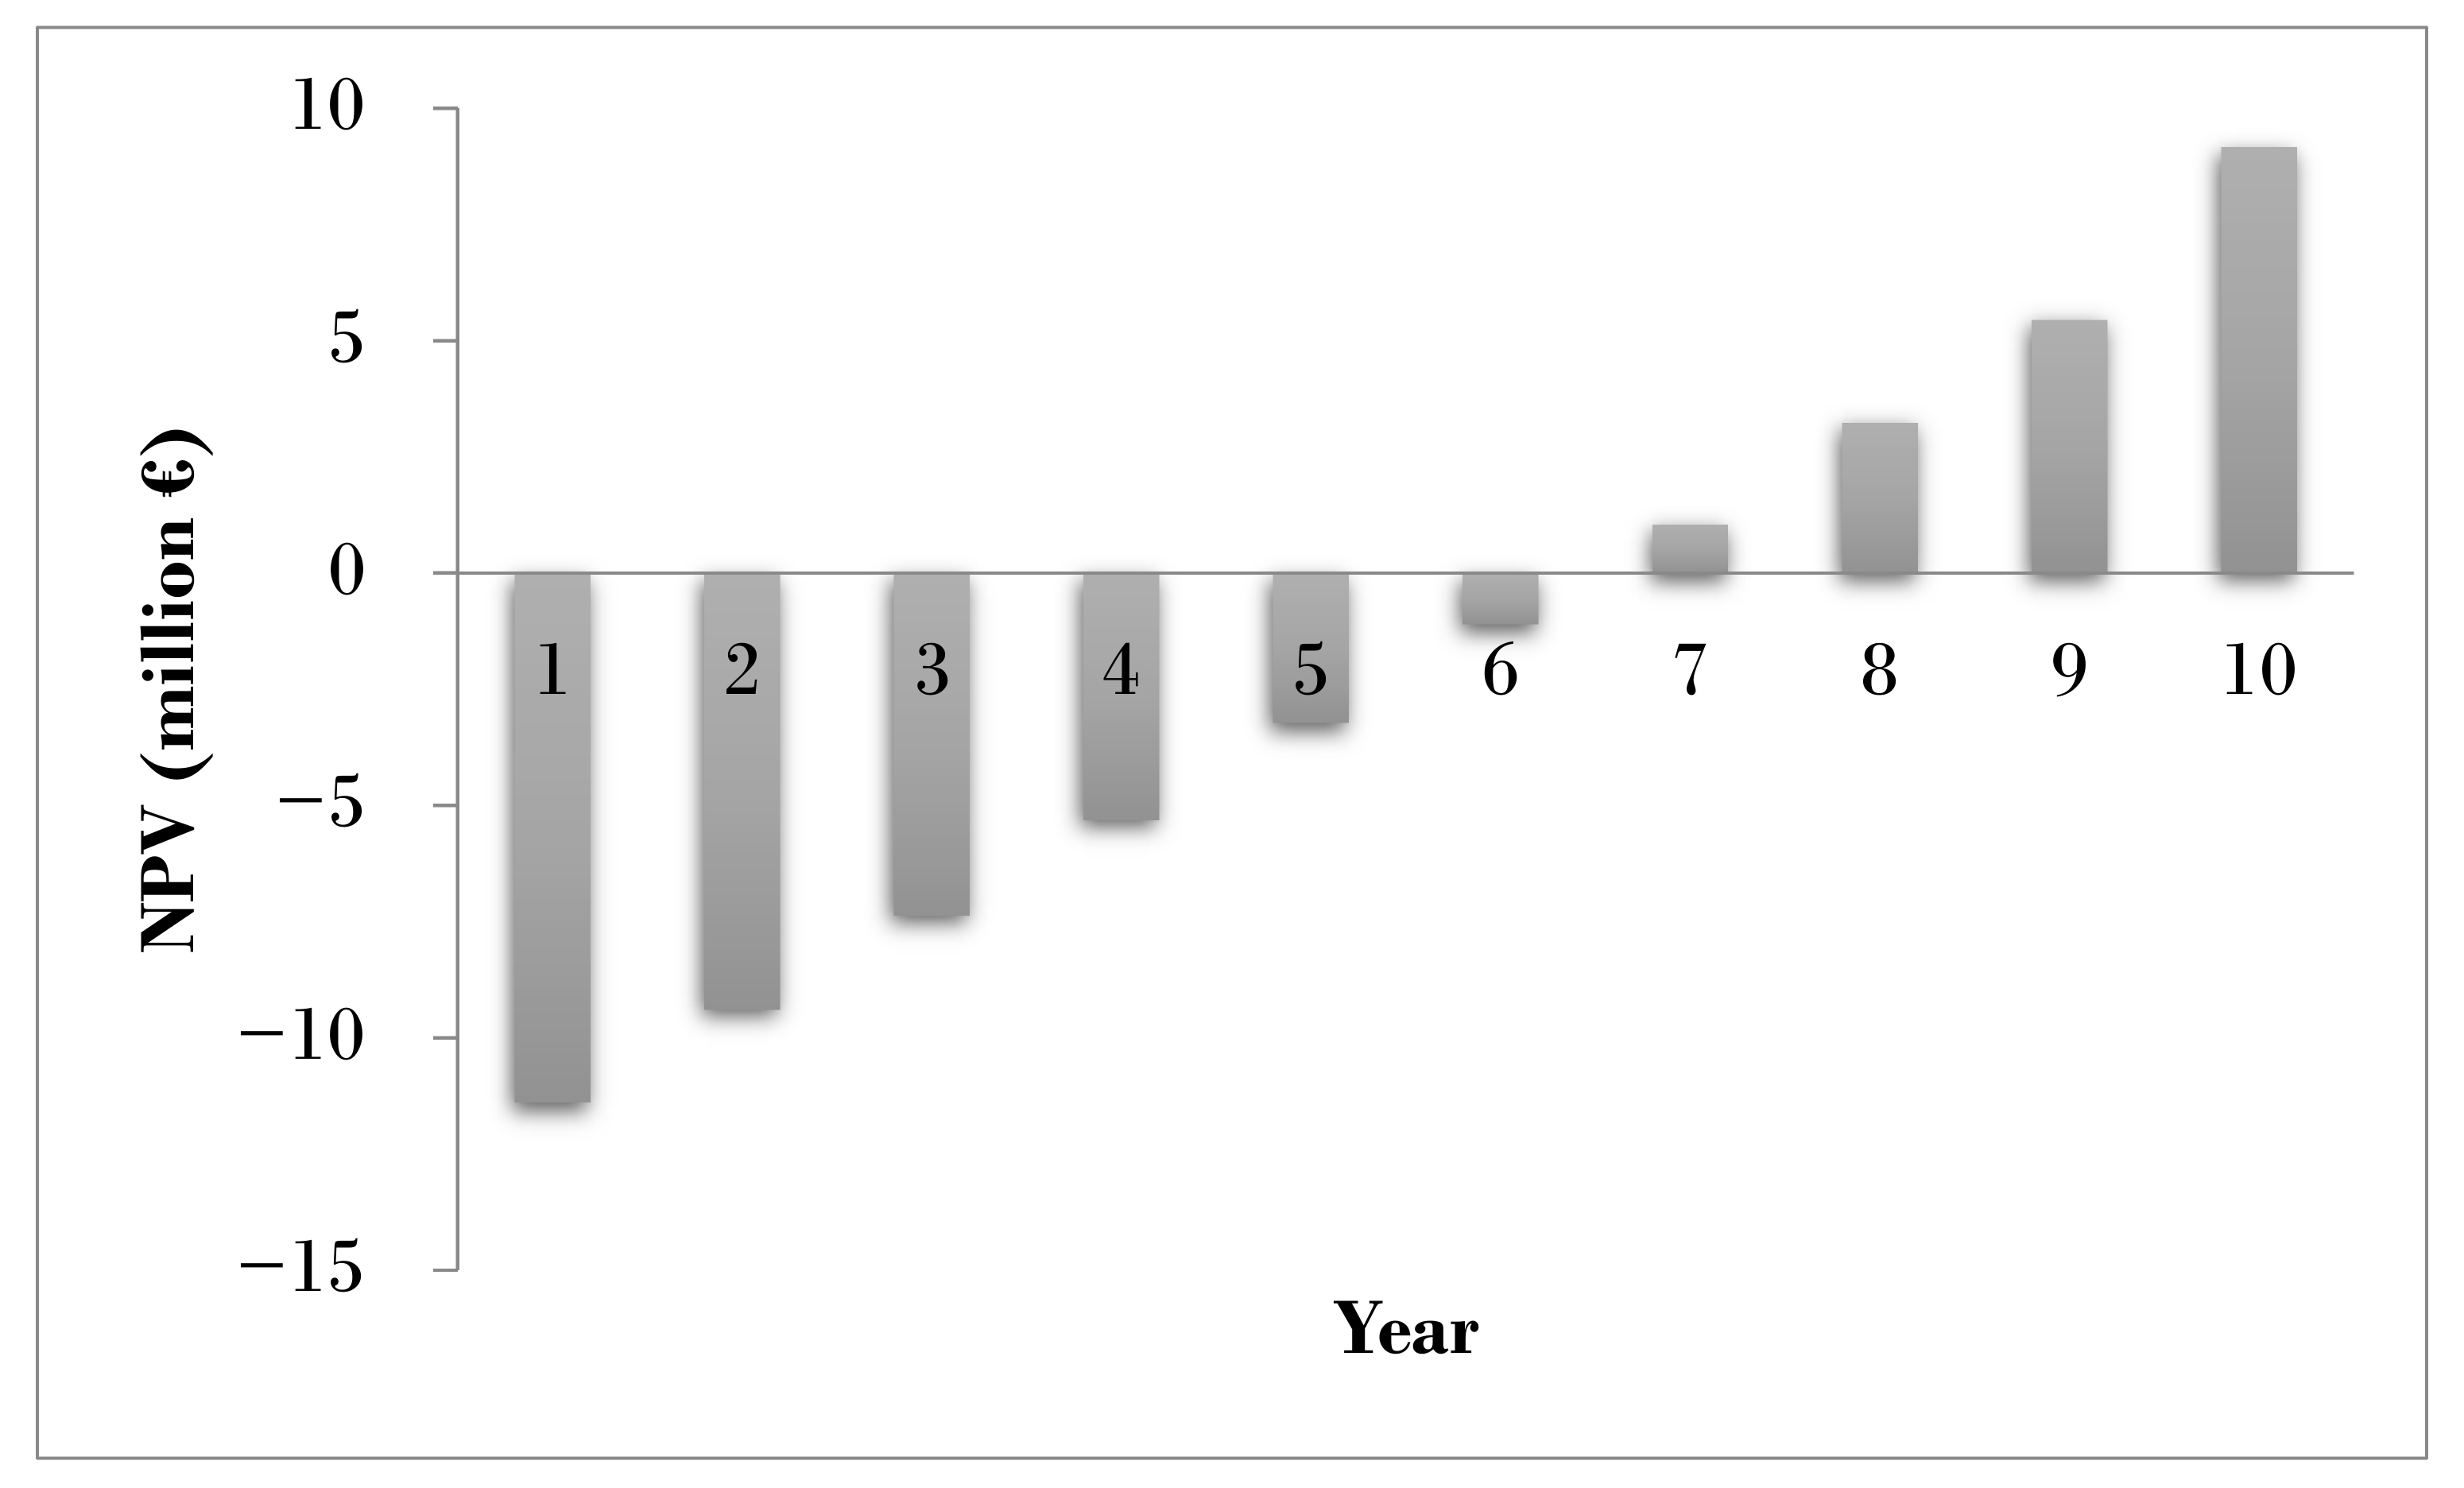
3.5. Case Study
4. Conclusions
Author Contributions
Funding
Institutional Review Board Statement
Informed Consent Statement
Data Availability Statement
Conflicts of Interest
References
- United Nations. UN News the world Population Continues to Increase, Even If It Is Getting Older. Available online: https://news.un.org/es/story/2019/06/1457891 (accessed on 20 July 2022).
- Is It Possible to Feed 10 Billion People without Further Ruining the Environment? Available online: https://news.un.org/es/story/2019/02/1450661 (accessed on 20 July 2022).
- Bayu, T. Review on contribution of integrated soil fertility management for climate change mitigation and agricultural sustainability. Cogent Environ. Sci. 2020, 6, 1823631. [Google Scholar] [CrossRef]
- Bartram, J.; Thyssen, N.; Gowers, A.; Pond, K.; Lack, T.; Danzon, M.; Jiménez-Beltrán, D. Water and health in Europe: A joint report from the European Environment Agency and the WHO Regional Office for Europe. WHO Reg Publ. Eur Ser. 2002, XXIII. [Google Scholar]
- Haq, S.M.; Hassan, M.; Jan, H.A.; Al-Ghamdi, A.A.; Ahmad, K.; Abbasi, A.M. Traditions for Future Cross-National Food Security—Food and Foraging Practices among Different Native Communities in the Western Himalayas. Biology 2022, 11, 455. [Google Scholar] [CrossRef] [PubMed]
- United Nations. The Sustainable Development Goals. Available online: https://www.un.org/sustainabledevelopment/ (accessed on 20 July 2022).
- International Fertilizer Indsutry Association Short-Term Fertilizer Outlook 2021–2022. Available online: https://www.ifastat.org/market-outlooks (accessed on 20 July 2022).
- Ministry of Agriculture, Fisheries and Food. Spain Fertilizer Consumption Statistics in Agriculture. Available online: https://www.mapa.gob.es/es/estadistica/temas/estadisticas-agrarias/agricultura/estadisticas-medios-produccion/fertilizantes.aspx (accessed on 20 July 2022).
- Infoagro Organic Fertilizers. Available online: https://infoagro.com/documentos/?id=11 (accessed on 20 July 2022).
- European Environment Agency Agriculture and Climate Change. Available online: https://www.eea.europa.eu/es/senales/senales-2015/articulos/la-agricultura-y-el-cambio-climatico (accessed on 20 July 2022).
- MICHITTE P Plant Nutrition: Aminoacids. Responsible for R + D + i of the Econatur Laboratories. Available online: http://www.econatur.net/media/File/aminoacidos.pdf (accessed on 20 July 2022).
- Espasa-Manresa R Foliar Fertilization with Aminoacids. Available online: https://www.mapa.gob.es/ministerio/pags/biblioteca/revistas/pdf_Hort/Hort_1983_12_33_35.pdf (accessed on 20 July 2022).
- Institute for Technological Innovation in Agriculture Aminoacids for the Biostimulation of Fruit and Vegetable Crops. Available online: https://www.intagri.com/articulos/nutricion-vegetal/aminoacidos-para-la-bioestimulacion-de-cultivos-hortofruticolas (accessed on 20 July 2022).
- Spanish Association of Agronutrient Manufacturers Aminoacids and Their Interaction with Vegetables. Available online: https://aefa-agronutrientes.org/los-aminoacidos-y-su-interaccion-con-los-vegetales (accessed on 20 July 2022).
- Morillas-España, A.; Ruiz-Nieto, Á.; Lafarga, T.; Acién, G.; Arbib, Z.; González-López, C.V. Biostimulant Capacity of Chlorella and Chlamydopodium Species Produced Using Wastewater and Centrate. Biology 2022, 11, 1086. [Google Scholar] [CrossRef]
- Supraja, K.V.; Behera, B.; Balasubramanian, P. Efficacy of microalgal extracts as biostimulants through seed treatment and foliar spray for tomato cultivation. Ind. Crops Prod. 2020, 151, 112453. [Google Scholar] [CrossRef]
- Behera, B.; Venkata Supraja, K.; Paramasivan, B. Integrated microalgal biorefinery for the production and application of biostimulants in circular bioeconomy. Bioresour. Technol. 2021, 339, 125588. [Google Scholar] [CrossRef]
- Braun, J.C.A.; Colla, L.M. Use of Microalgae for the Development of Biofertilizers and Biostimulants. Bioenergy Res. 2022. [Google Scholar] [CrossRef]
- Vizcaíno, A.J.; Sáez, M.I.; Martínez, T.F.; Acién, F.G.; Alarcón, F.J. Differential hydrolysis of proteins of four microalgae by the digestive enzymes of gilthead sea bream and Senegalese sole. Algal Res. 2019, 37, 145–153. [Google Scholar] [CrossRef]
- Papachristou, I.; Akaberi, S.; Silve, A.; Navarro-López, E.; Wüstner, R.; Leber, K.; Nazarova, N.; Müller, G.; Frey, W. Analysis of the lipid extraction performance in a cascade process for Scenedesmus almeriensis biorefinery. Biotechnol. Biofuels 2021, 14, 20. [Google Scholar] [CrossRef]
- Romero García, J.M.; Acién Fernández, F.G.; Fernández Sevilla, J.M. Development of a process for the production of l-amino-acids concentrates from microalgae by enzymatic hydrolysis. Bioresour. Technol. 2012, 112, 164–170. [Google Scholar] [CrossRef]
- Akaberi, S.; Gusbeth, C.; Silve, A.; Senthilnathan, D.S.; Navarro-López, E.; Molina-Grima, E.; Müller, G.; Frey, W. Effect of pulsed electric field treatment on enzymatic hydrolysis of proteins of Scenedesmus almeriensis. Algal Res. 2019, 43, 101656. [Google Scholar] [CrossRef]
- Plaza, B.M.; Gómez-Serrano, C.; Acién-Fernández, F.G.; Jimenez-Becker, S. Effect of microalgae hydrolysate foliar application (Arthrospira platensis and Scenedesmus sp.) on Petunia x hybrida growth. J. Appl. Phycol. 2018, 30, 2359–2365. [Google Scholar] [CrossRef]
- Navarro-López, E.; Cerón-García, M.D.C.; López-Rodríguez, M.; Acién-Fernández, F.G.; Molina-Grima, E. Biostimulants obtained after pilot-scale high-pressure homogenization of Scenedesmus sp. grown in pig manure. Algal Res. 2020, 52, 102123. [Google Scholar] [CrossRef]
- Aqualia, S.L. The Mérida Treatment Plant Will Recycle the City’s Wastewater with Microalgae. Available online: https://www.hoy.es/merida/depuradora-reciclara-agua-20201229001447-ntvo.html (accessed on 20 July 2022).
- Barceló-Villalobos, M.; Fernández-del Olmo, P.; Guzmán, J.L.; Fernández-Sevilla, J.M.; Acién Fernández, F.G. Evaluation of photosynthetic light integration by microalgae in a pilot-scale raceway reactor. Bioresour. Technol. 2019, 280, 404–411. [Google Scholar] [CrossRef]
- Morillas-España, A.; Lafarga, T.; Acién-Fernández, F.G.; Gómez-Serrano, C.; González-López, C.V. Annual production of microalgae in wastewater using pilot-scale thin-layer cascade photobioreactors. J. Appl. Phycol. 2021, 33, 3861–3871. [Google Scholar] [CrossRef]
- Morillas-España, A.; Lafarga, T.; Gómez-Serrano, C.; Acién-Fernández, F.G.; González-López, C.V. Year-long production of Scenedesmus almeriensis in pilot-scale raceway and thin-layer cascade photobioreactors. Algal Res. 2020, 51, 102069. [Google Scholar] [CrossRef]
- Sánchez Zurano, A.; Garrido Cárdenas, J.A.; Gómez Serrano, C.; Morales Amaral, M.; Acién-Fernández, F.G.; Fernández Sevilla, J.M.; Molina Grima, E. Year-long assessment of a pilot-scale thin-layer reactor for microalgae wastewater treatment. Variation in the microalgae-bacteria consortium and the impact of environmental conditions. Algal Res. 2020, 50, 101983. [Google Scholar] [CrossRef]
- Morales-Amaral, M.D.M.; Gómez-Serrano, C.; Acién, F.G.; Fernández-Sevilla, J.M.; Molina-Grima, E. Outdoor production of Scenedesmus sp. in thin-layer and raceway reactors using centrate from anaerobic digestion as the sole nutrient source. Algal Res. 2015, 12, 99–108. [Google Scholar] [CrossRef]
- NOVOZYMES A/S Technical Sheets of the Different Enzymatic Preparations. Available online: https://www.novozymes.com/es (accessed on 20 July 2022).
- Flickinger, M.C.; Drew, S.W. Encyclopedia of Bioprocess Technology: Fermentation, Biocatalysis, and Bioseparation; John Wiley & Sons: Hoboken, NJ, USA, 1999; Volumes 1-5. [Google Scholar]
- Acién Fernández, F.G.; Fernández Sevilla, J.M.; Molina Grima, E. Chapter 21-Costs analysis of microalgae production. In Biofuels from Algae; Elsevier: Amsterdam, The Netherlands, 2019; pp. 551–566. [Google Scholar] [CrossRef]
- Sarma, S.; Sharma, S.; Rudakiya, D.; Upadhyay, J.; Rathod, V.; Patel, A.; Narra, M. Valorization of microalgae biomass into bioproducts promoting circular bioeconomy: A holistic approach of bioremediation and biorefinery. 3 Biotech 2021, 11, 378. [Google Scholar] [CrossRef]
- Statistics National Institute. Spain Quarterly Labor Cost Survey (ETCL): Second Quarter of 2020. Available online: https://www.ine.es (accessed on 20 July 2022).
- Llamas, B.; Suárez-Rodríguez, M.C.; González-López, C.V.; Mora, P.; Acién, F.G. Techno-economic analysis of microalgae related processes for CO2 bio-fixation. Algal Res. 2021, 57, 102339. [Google Scholar] [CrossRef]
- ZAUBA Detailed Import Data of Flavourzyme 1000 L. Available online: https://www.zauba.com/import-flavourzyme-hs-code.html (accessed on 20 July 2022).
- ZAUBA Detailed Import Data of Alcalase 2.5 L. Available online: https://www.zauba.com/import-ALCALASE+2+5/hs-code-3507-hs-code.html (accessed on 20 July 2022).
- Blaser, H.U.; Schmidt, E. Asymmetric Catalysis on Industrial Scale: Challenges, Approaches and Solutions; WILEY-VCH: Weinheim, Germany, 2004. [Google Scholar]
- Sari, Y.W.; Kartikasari, K.; Widyarani Setyaningsih, I.; Lestari, D. Chapter 13-Techno-economic assessment of microalgae for biofuel, chemical, and bioplastic. In Microalgae; Galanakis, C.M., Ed.; Academic Press: Cambridge, MA, USA, 2021. [Google Scholar]
- Hossain, N.; Mahlia, T.M.I.; Zaini, J.; Saidur, R. Techno-economics and Sensitivity Analysis of Microalgae as Commercial Feedstock for Bioethanol Production. Environ. Prog. Sustain. Energy 2019, 38, 13157. [Google Scholar] [CrossRef]
- Biohuerto Aminoacid Fertilizers. Available online: https://www.biohuerto.es/fertilizantes-liquidos/7264-fertilizante-ecologico-aminoluq-1250ml-batlle-841493400434.html (accessed on 20 July 2022).
- AMAZON Aminoacid Fertilizers. Available online: https://www.amazon.es/amino%C3%A1cidos-calificaci%C3%B3n-ecol%C3%B3gica-aplicaci%C3%B3n-fertirrigaci%C3%B3n/dp/B08B4N56W3 (accessed on 20 July 2022).
- Fertitienda Aminoacid Fertilizers. Available online: https://fertitienda.com/aminoacidos-extractos-algas/agrares-amino7npk-1000l.html (accessed on 20 July 2022).
- Procampo Aminoacid Fertilizers. Available online: https://www.procampo.net/abonos-y-correctores/aminoacidos/ecologicos/179-lysodin-algafert.html (accessed on 20 July 2022).
- Fitosanitarios Mavesa Aminoacid Fertilizers. Available online: https://fitosanitariosmavesa.com/producto/algafert-5l/ (accessed on 20 July 2022).
- Manomano Aminoacid Fertilizers. Available online: https://www.manomano.es/catalogue/p/kenogard-concentrado-algas-marinas-fertirrigacin-alganol-goteo-5-litros-34823287?model_id=24876102 (accessed on 20 July 2022).
- Capmatic Ltd. Flowmatic™-Liquid Mass; Capmatic Ltd.: Montréal-Nord, QC, Canada; Available online: https://capmatic.com/en/flowmaticlm.html (accessed on 20 July 2022).
- Isofotón SA ISONOX II (Isofotón, S.A, Spain). Available online: https://dokumen.tips/engineering/ficha-tecnica-isofoton-colector-plano-isonox-ii-2002.html (accessed on 20 July 2022).
- Dimou, C.; Vlysidis, A.; Kopsahelis, N.; Papanikolaou, S.; Koutinas, A.A.; Kookos, I.K. Techno-economic evaluation of wine lees refining for the production of value-added products. Biochem. Eng. J. 2016, 116, 157–165. [Google Scholar] [CrossRef]
- Papadaki, E.; Kontogiannopoulos, K.N.; Assimopoulou, A.N.; Mantzouridou, F.T. Feasibility of multi-hydrolytic enzymes production from optimized grape pomace residues and wheat bran mixture using Aspergillus niger in an integrated citric acid-enzymes production process. Bioresour. Technol. 2020, 309, 123317. [Google Scholar] [CrossRef]
- Asiedu, A.; Ben, S.; Resurreccion, E.; Kumar, S. Techno-economic analysis of protein concentrate produced by flash hydrolysis of microalgae. Environ. Prog. Sustain. Energy 2018, 37, 881–890. [Google Scholar] [CrossRef]
- Thomassen, G.; Van Dael, M.; You, F.; Van Passel, S. A multi-objective optimization-extended techno-economic assessment: Exploring the optimal microalgal-based value chain. Green Chem. 2019, 21, 5945–5959. [Google Scholar] [CrossRef]
- INGNIA Solutions Organic Amendment INGNIA Bulk Compost, Price on Truck in the Same Facilities. Available online: https://ingnia.com/producto/enmienda-organica-ingnia-compost-granel/ (accessed on 20 July 2022).
- Arashiro, L.T.; Montero, N.; Ferrer, I.; Acién, F.G.; Gómez, C.; Garfí, M. Life cycle assessment of high rate algal ponds for wastewater treatment and resource recovery. Sci. Total Environ. 2018, 622–623, 1118–1130. [Google Scholar] [CrossRef] [PubMed] [Green Version]
- Biorizon Biotech SL a Great Step to Be Part of the UN Global Compact. Available online: https://www.biorizon.es/un-gran-paso-de-biorizon-biotech-al-formar-parte-del-pacto-mundial-de-la-onu/ (accessed on 20 July 2022).
- ASAJA the Power of Microalgae in the Agricultural Sector. Available online: https://www.asaja.com/horizontales/bioestimulantes_23/el_poder_de_las_microalgas_en_el_sector_agricola_2433 (accessed on 20 July 2022).
- Ficosterra. Available online: https://www.ficosterra.com/ficosterra-unica-empresa-espanola-seleccionada-por-naciones-unidas-para-luchar-contra-la-contaminacion-de-mares-y-oceanos/ (accessed on 20 July 2022).
- Invertia (El Español). Available online: https://www.elespanol.com/invertia/disruptores-innovadores/disruptores/scale-ups/20210814/biotecnologia-espanola-elegida-naciones-unidas-agricultura-xxi/603939913_0.html (accessed on 20 July 2022).


| Process Stage | Equipment Name | Modelling |
|---|---|---|
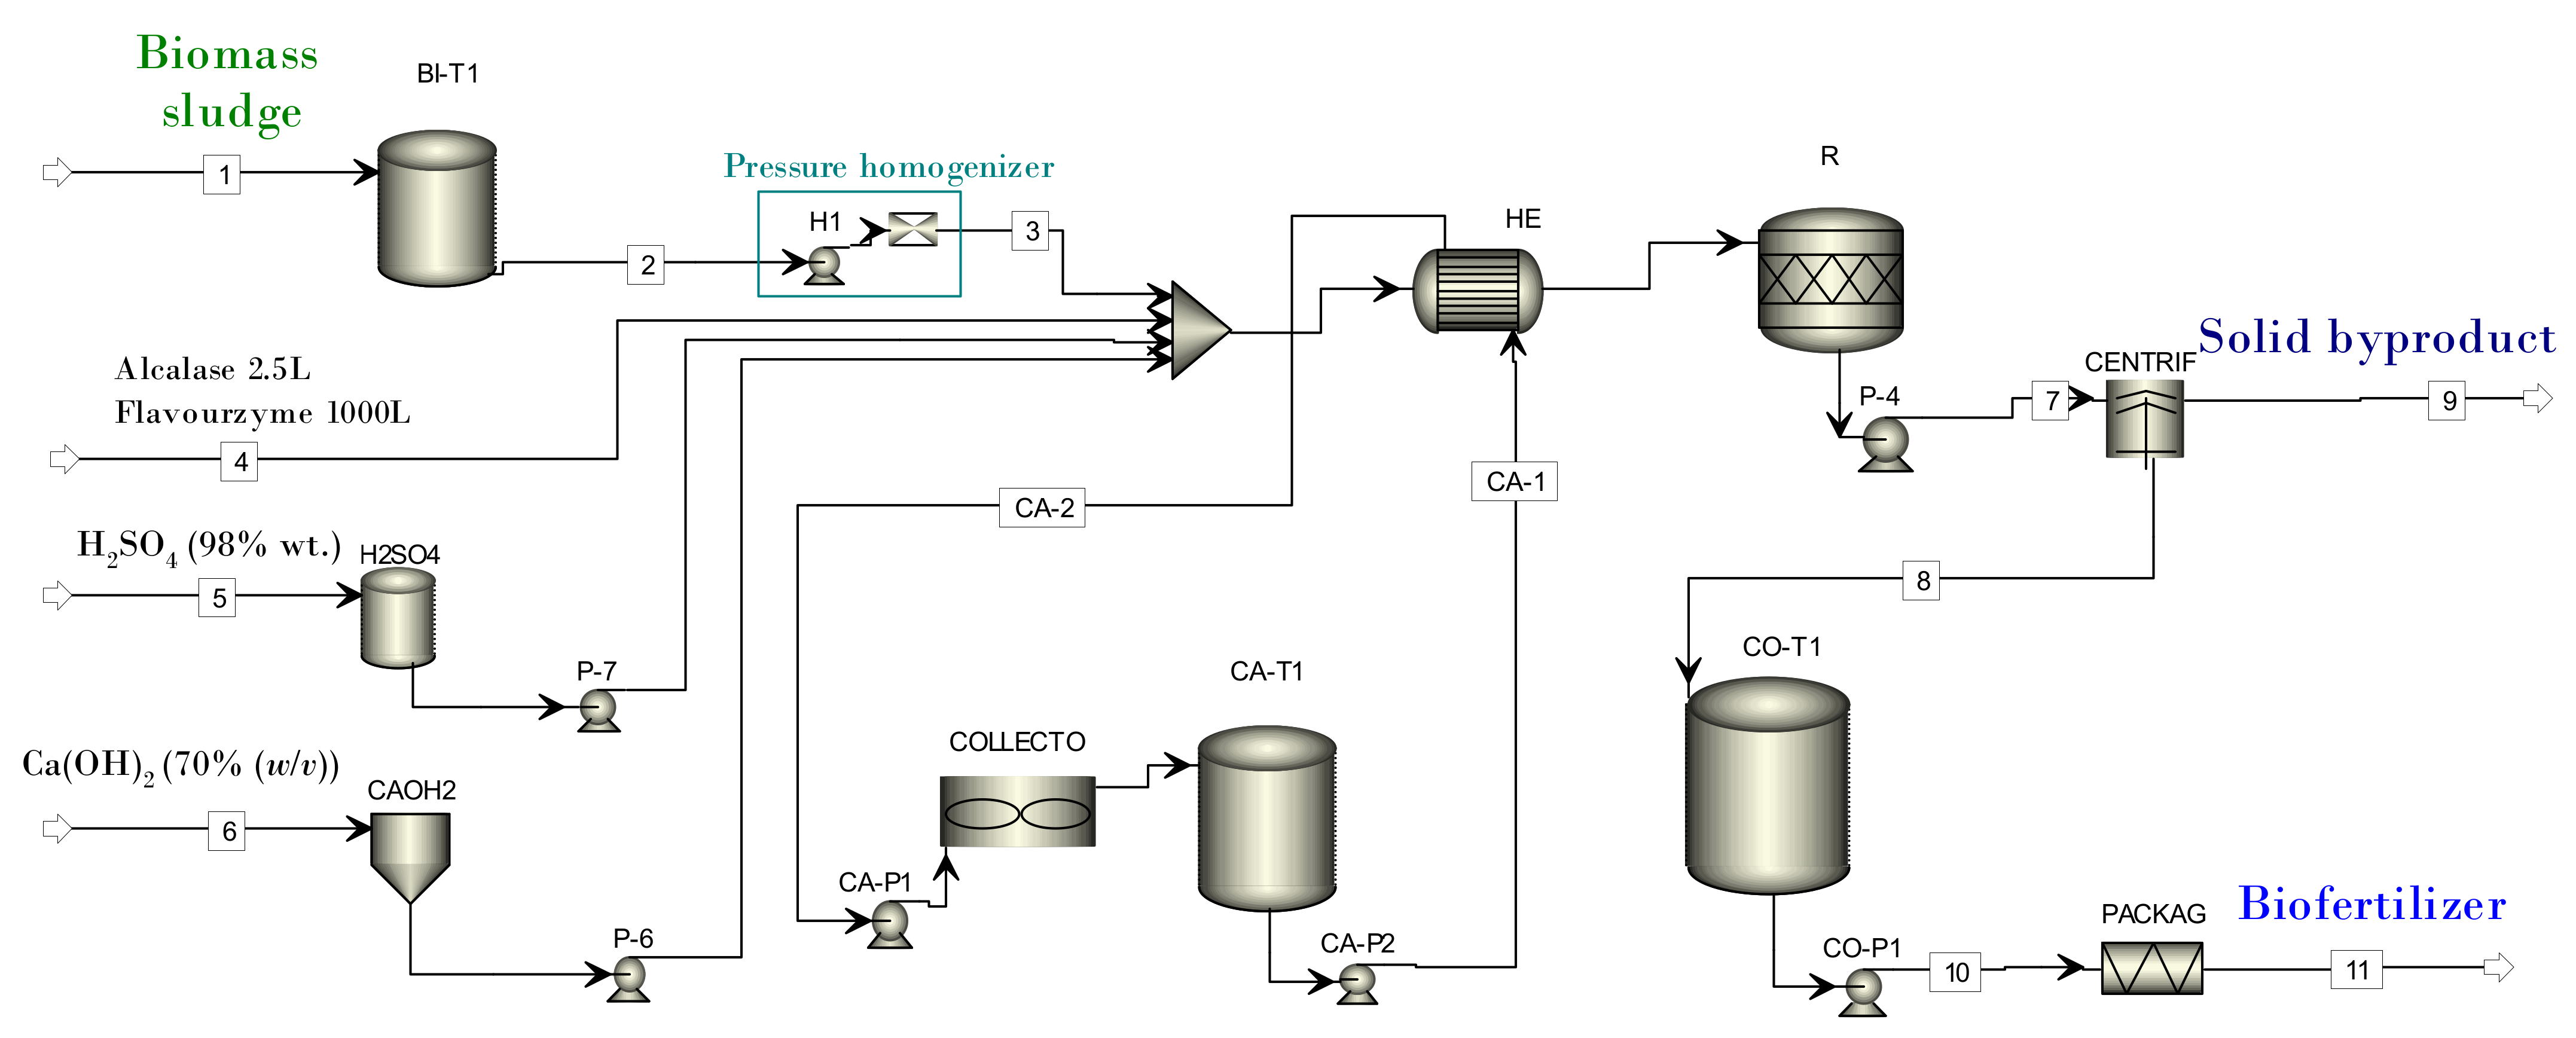
| Biomass storage (BIOMA-ST) | BI-T1 | Tank |
| Pretreatment (PRETRE) | H1 | High-pressure homogenizer: a pump to increase the pressure up to 200 bar and a valve to depressurize |
| Enzymatic hydrolysis (HYDROLY) | P-6 | Pump |
| R | Hydrolysis reactor: stoichiometric reactor in which two reactions take place: first, the hydrolysis of proteins with a conversion of 55%, and second, the reaction of H2SO4 to completion | |
| P-7 | Pump | |
| P-4 | Pump | |
| HE | Heat exchanger: countercurrent, with a hot fluid outlet temperature of 65 °C and a minimum approach temperature of 10 °C | |
| CaOH2 | Tank | |
| H2SO4 | Tank | |
| Centrifugation (CENTRIFU) | CENTRIF | Centrifuge: disc centrifuge to achieve 35% humidity in the solid |
| Concentrate storage (CONCE-ST) | CO-T1 | Tank |
| CO-P1 | Pump | |
| Packaging (PACKAG) | PACKAG | Liquid packaging machine: no model in ASPEN Plus |
| Heat capture (HEAT-CAP) | CA-T1 | Tank |
| CA-P1 | Pump | |
| CA-P2 | Pump | |
| COLLECTO | Solar thermal collector: a heater to reach 85 °C, which allows the energy that the collectors will need to capture to be determined |
| Scenarios | Cost of the Biomass Sludge (EUR/kg) | Cost of the Enzymes (EUR/kg) | Biofertilizer Sale Price (EUR/kg) |
|---|---|---|---|
| 1 | 1.0 | 17.5 | 2.5 |
| 2 | 1.0 | 25.0 | 5.0 |
| 3 | 0.6 | 10.0 | 7.5 |
| 4 | 0.2 | 25.0 | 5.0 |
| 5 | 0.6 | 17.5 | 5.0 |
| 6 | 0.2 | 10.0 | 5.0 |
| 7 | 0.2 | 17.5 | 2.5 |
| 8 | 1.0 | 10.0 | 5.0 |
| 9 | 0.6 | 25.0 | 2.5 |
| 10 | 1.0 | 17.5 | 7.5 |
| 11 | 0.6 | 10.0 | 2.5 |
| 12 | 0.2 | 17.5 | 7.5 |
| 13 | 0.6 | 25.0 | 7.5 |
| Stream | 1 | 2 | 3 | 4 | 5 | 6 | 7 | 8 | 9 | 10 | 11 | CA-1 | CA-2 |
|---|---|---|---|---|---|---|---|---|---|---|---|---|---|
| T (°C) | 25 | 25 | 40.04 | 25 | 25 | 25 | 50 | 50 | 50 | 50 | 50 | 85 | 65 |
| P (bar) | 1.01 | 1.01 | 1.01 | 1.01 | 1.01 | 1.01 | 1.01 | 1.01 | 1.01 | 1.01 | 1.01 | 1.01 | 1.01 |
| Total flow (kg/h) | 260.42 | 260.42 | 260.42 | 4.79 | 0.88 | 2.79 | 268.87 | 207.82 | 61.05 | 207.82 | 207.82 | 118.20 | 118.20 |
| Water (kg/h) | 209.85 | 209.85 | 209.85 | 2.4 | 0.02 | 1.39 | 213.98 | 194.03 | 19.95 | 194.03 | 194.03 | 118.20 | 118.20 |
| Protein (kg/h) | 25.03 | 25.03 | 25.03 | 11.26 | 11.26 | ||||||||
| Lipids (kg/h) | 8.85 | 8.85 | 8.85 | 8.85 | 8.85 | ||||||||
| Carbohydrates (kg/h) | 13.15 | 13.15 | 13.15 | 13.15 | 13.15 | ||||||||
| Ash (kg/h) | 3.54 | 3.54 | 3.54 | 3.54 | 3.54 | ||||||||
| Enzymes (kg/h) | 0.94 | 0.94 | 0.94 | ||||||||||
| Sucrose (kg/h) | 1.44 | 1.44 | 1.31 | 0.13 | 1.31 | 1.31 | |||||||
| H2SO4 (kg/h) | 0.86 | ||||||||||||
| Ca(OH)2 (kg/h) | 1.40 | 0.75 | 0.75 | ||||||||||
| Amino acids (kg/h) | 13.77 | 12.48 | 1.28 | 12.48 | 12.48 | ||||||||
| CaSO4 (kg/h) | 1.2 | 1.2 | |||||||||||
| Supplied heat (kJ/h) | 10,336.50 |
| Annual Values of Consumption and Products | Amount |
|---|---|
| Biomass sludge consumption (20%) (t) | 2062.50 |
| Enzyme consumption (t) | 37.91 |
| CaOH2 (70% w/v) consumption (t) | 22.08 |
| H2SO4 (98% wt.) consumption (t) | 6.97 |
| Energy consumption for heating (kJ) | 8.19·107 |
| Production of solid by-product (t) | 483.51 |
| Biofertilizer production (t) | 1645.95 |
| Equipment Name | Selected Equipment | Units | Sizing | Cost (EUR) | Total Cost (EUR) | Source | |
|---|---|---|---|---|---|---|---|
| BI-T1 | Carbon steel storage tank | 1 | 8.06 | m3 | 24,300 | 24,300 | APEA database |
| H1 | SS316 stainless steel high-pressure positive displacement Pump | 1 | 106 | kW | 229,100 | 229,100 | APEA database |
| P-6 | SS304 stainless steel centrifugal pump | 1 | 1 | kW | 5700 | 5700 | APEA database |
| R | SS304 stainless steel jacketed stirred tank | 1 | 1.11 | m3 | 78,200 | 78,200 | APEA database |
| P-7 | SS304 stainless steel centrifugal pump | 1 | 1 | kW | 5700 | 5700 | APEA database |
| P-4 | Carbon steel centrifugal pump | 1 | 1 | kW | 4500 | 4500 | APEA database |
| HE | Carbon steel counterflow shell and tube heat exchanger | 1 | 0.47 | m2 | 8200 | 8200 | APEA database |
| CaOH2 | Fiber-reinforced polymer storage tank | 1 | 3.8 | m3 | 43,100 | 43,100 | APEA database |
| H2SO4 | Fiber-reinforced polymer storage tank | 1 | 3.8 | m3 | 43,100 | 43,100 | APEA database |
| CENTRIF | Carbon steel high-speed disc centrifuge | 1 | 254 | mm | 219,100 | 219,100 | APEA database |
| CO-T1 | Carbon steel storage tank | 5 | 39.6 | m3 | 60,000 | 300,000 | APEA database |
| CO-P1 | Carbon steel centrifugal pump | 1 | 1 | kW | 4500 | 4500 | APEA database |
| PACKAG | Liquid packaging machine Flowmatic™-Liquid Mass (Capmatic Ltd., Montreal, QC, Canada) for containers up to 20 L | 1 | 120 | bpm | 80,000 | 80,000 | Budget Capmatic Ltd., Canada |
| CA-T1 | Carbon steel storage tank | 1 | 11.4 | m3 | 26,900 | 26,900 | APEA database |
| CA-P1 | Carbon steel centrifugal pump | 1 | 1 | kW | 4500 | 4500 | APEA database |
| CA-P2 | Carbon steel centrifugal pump | 1 | 1 | kW | 4500 | 4500 | APEA database |
| COLLECTO | Flat solar collector ISONOX II (Isofotón, S.A, Malaga, SpainEspaña) | 7 | 1.9 | m2 | 650 | 4550 | Budget Isofotón, S.A, Malaga, Spain |
| Item | Amount (EUR) | % |
|---|---|---|
| Equipment | 1,088,448.80 | 11.28 |
| Piping | 542,566.50 | 5.62 |
| Civil | 405,450.50 | 4.20 |
| Instrumentation | 1,035,617.10 | 10.73 |
| Electrical | 1,301,905.00 | 13.49 |
| Design, engineering, procurement | 3,208,042.43 | 33.25 |
| Administrative/contract taxes | 576,675.40 | 5.98 |
| Contingencies | 1,489,817.60 | 15.44 |
| Total Investment | 9,648,523.33 | 100.00 |
| Scenario | NPV (million EUR) | PP (Year) | IRR (%) | PI |
|---|---|---|---|---|
| 1 | −9.82 | −1.02 | ||
| 2 | 17.19 | 5.02 | 27.46 | 1.78 |
| 3 | 54.97 | 2.58 | 71.01 | 5.70 |
| 4 | 28.94 | 3.65 | 42.70 | 3.00 |
| 5 | 25.09 | 4.01 | 37.62 | 2.60 |
| 6 | 32.99 | 3.35 | 48.18 | 3.42 |
| 7 | 3.11 | 8.92 | 9.96 | 0.32 |
| 8 | 21.24 | 4.44 | 32.64 | 2.20 |
| 9 | −4.99 | −0.52 | ||
| 10 | 47.07 | 2.88 | 60.29 | 4.88 |
| 11 | −0.74 | −0.08 | ||
| 12 | 58.82 | 2.46 | 76.53 | 6.10 |
| 13 | 50.92 | 2.72 | 65.42 | 5.28 |
| Item | Amount (Million EUR/Year) | % |
|---|---|---|
| Raw-material cost | 1.79 | 42.43 |
| Utilities cost | 0.30 | 7.11 |
| Labor cost | 0.58 | 13.74 |
| Maintenance costs | 0.06 | 1.38 |
| Operating costs | 0.15 | 3.44 |
| Contingencies | 0.32 | 7.56 |
| Administration costs | 0.26 | 6.05 |
| Depreciation | 0.77 | 18.28 |
| Production costs | 4.22 | 100.00 |
| NPV (Million EUR) | 9.17 | |
| IRR (%) | 18.31 | |
| PP (year) | 6.51 | |
| IR | 0.95 |
Publisher’s Note: MDPI stays neutral with regard to jurisdictional claims in published maps and institutional affiliations. |
© 2022 by the authors. Licensee MDPI, Basel, Switzerland. This article is an open access article distributed under the terms and conditions of the Creative Commons Attribution (CC BY) license (https://creativecommons.org/licenses/by/4.0/).
Share and Cite
Romero-García, J.M.; González-López, C.V.; Brindley, C.; Fernández-Sevilla, J.M.; Acién-Fernández, F.G. Simulation and Techno-Economical Evaluation of a Microalgal Biofertilizer Production Process. Biology 2022, 11, 1359. https://doi.org/10.3390/biology11091359
Romero-García JM, González-López CV, Brindley C, Fernández-Sevilla JM, Acién-Fernández FG. Simulation and Techno-Economical Evaluation of a Microalgal Biofertilizer Production Process. Biology. 2022; 11(9):1359. https://doi.org/10.3390/biology11091359
Chicago/Turabian StyleRomero-García, Juan Miguel, Cynthia Victoria González-López, Celeste Brindley, José María Fernández-Sevilla, and Francisco Gabriel Acién-Fernández. 2022. "Simulation and Techno-Economical Evaluation of a Microalgal Biofertilizer Production Process" Biology 11, no. 9: 1359. https://doi.org/10.3390/biology11091359