
The Protective Performance of Process Operators’ Protective Clothing and Exposure Limits under Low Thermal Radiation Conditions


Abstract
:Simple Summary
Abstract
1. Introduction
2. Materials and Methods
2.1. General
2.2. Test Persons
2.3. Ethical Considerations
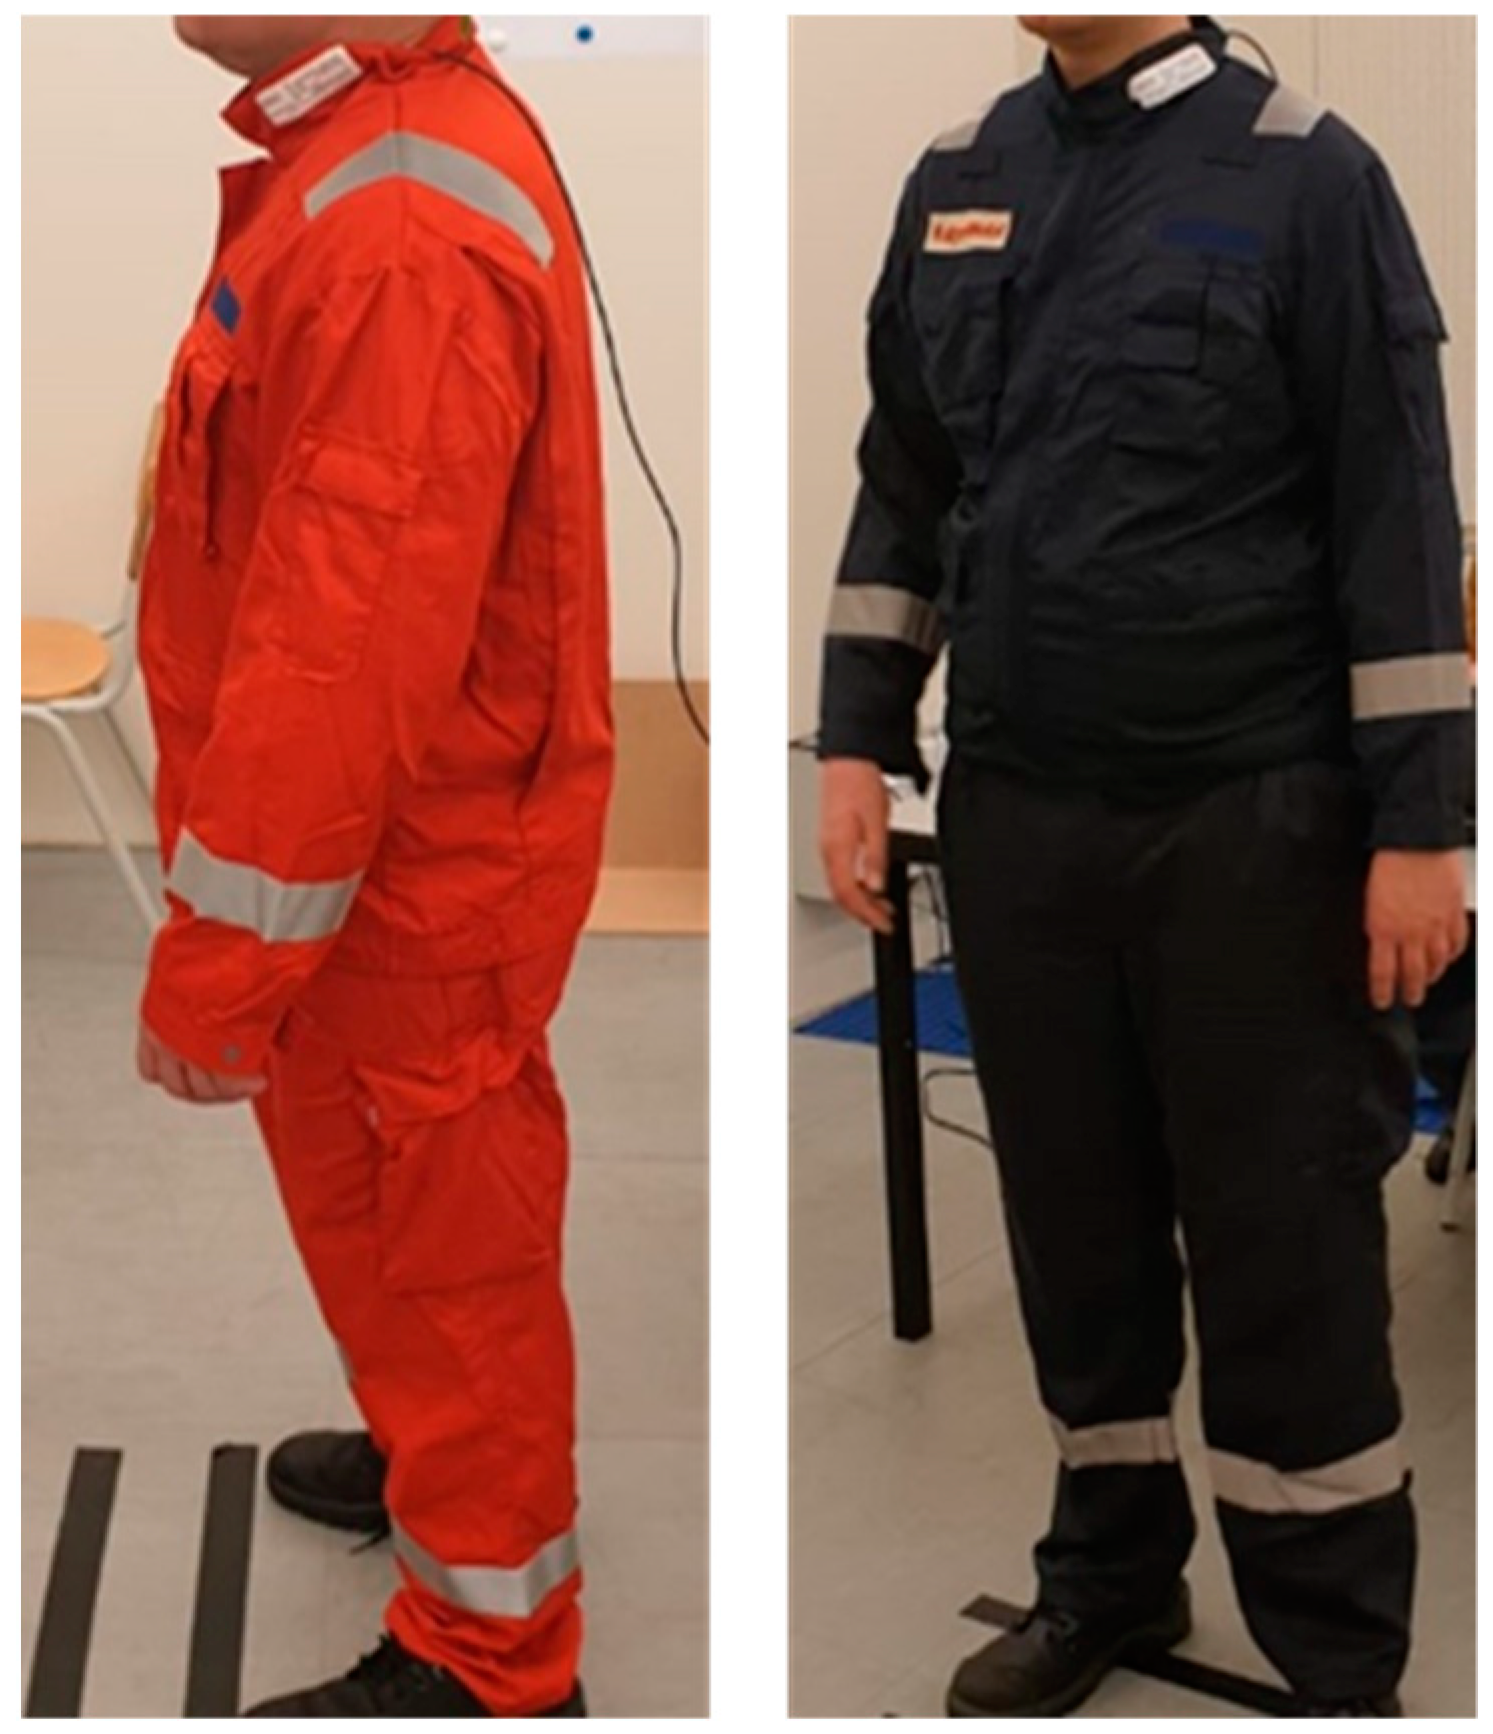
2.4. Clothing
2.5. Study Design
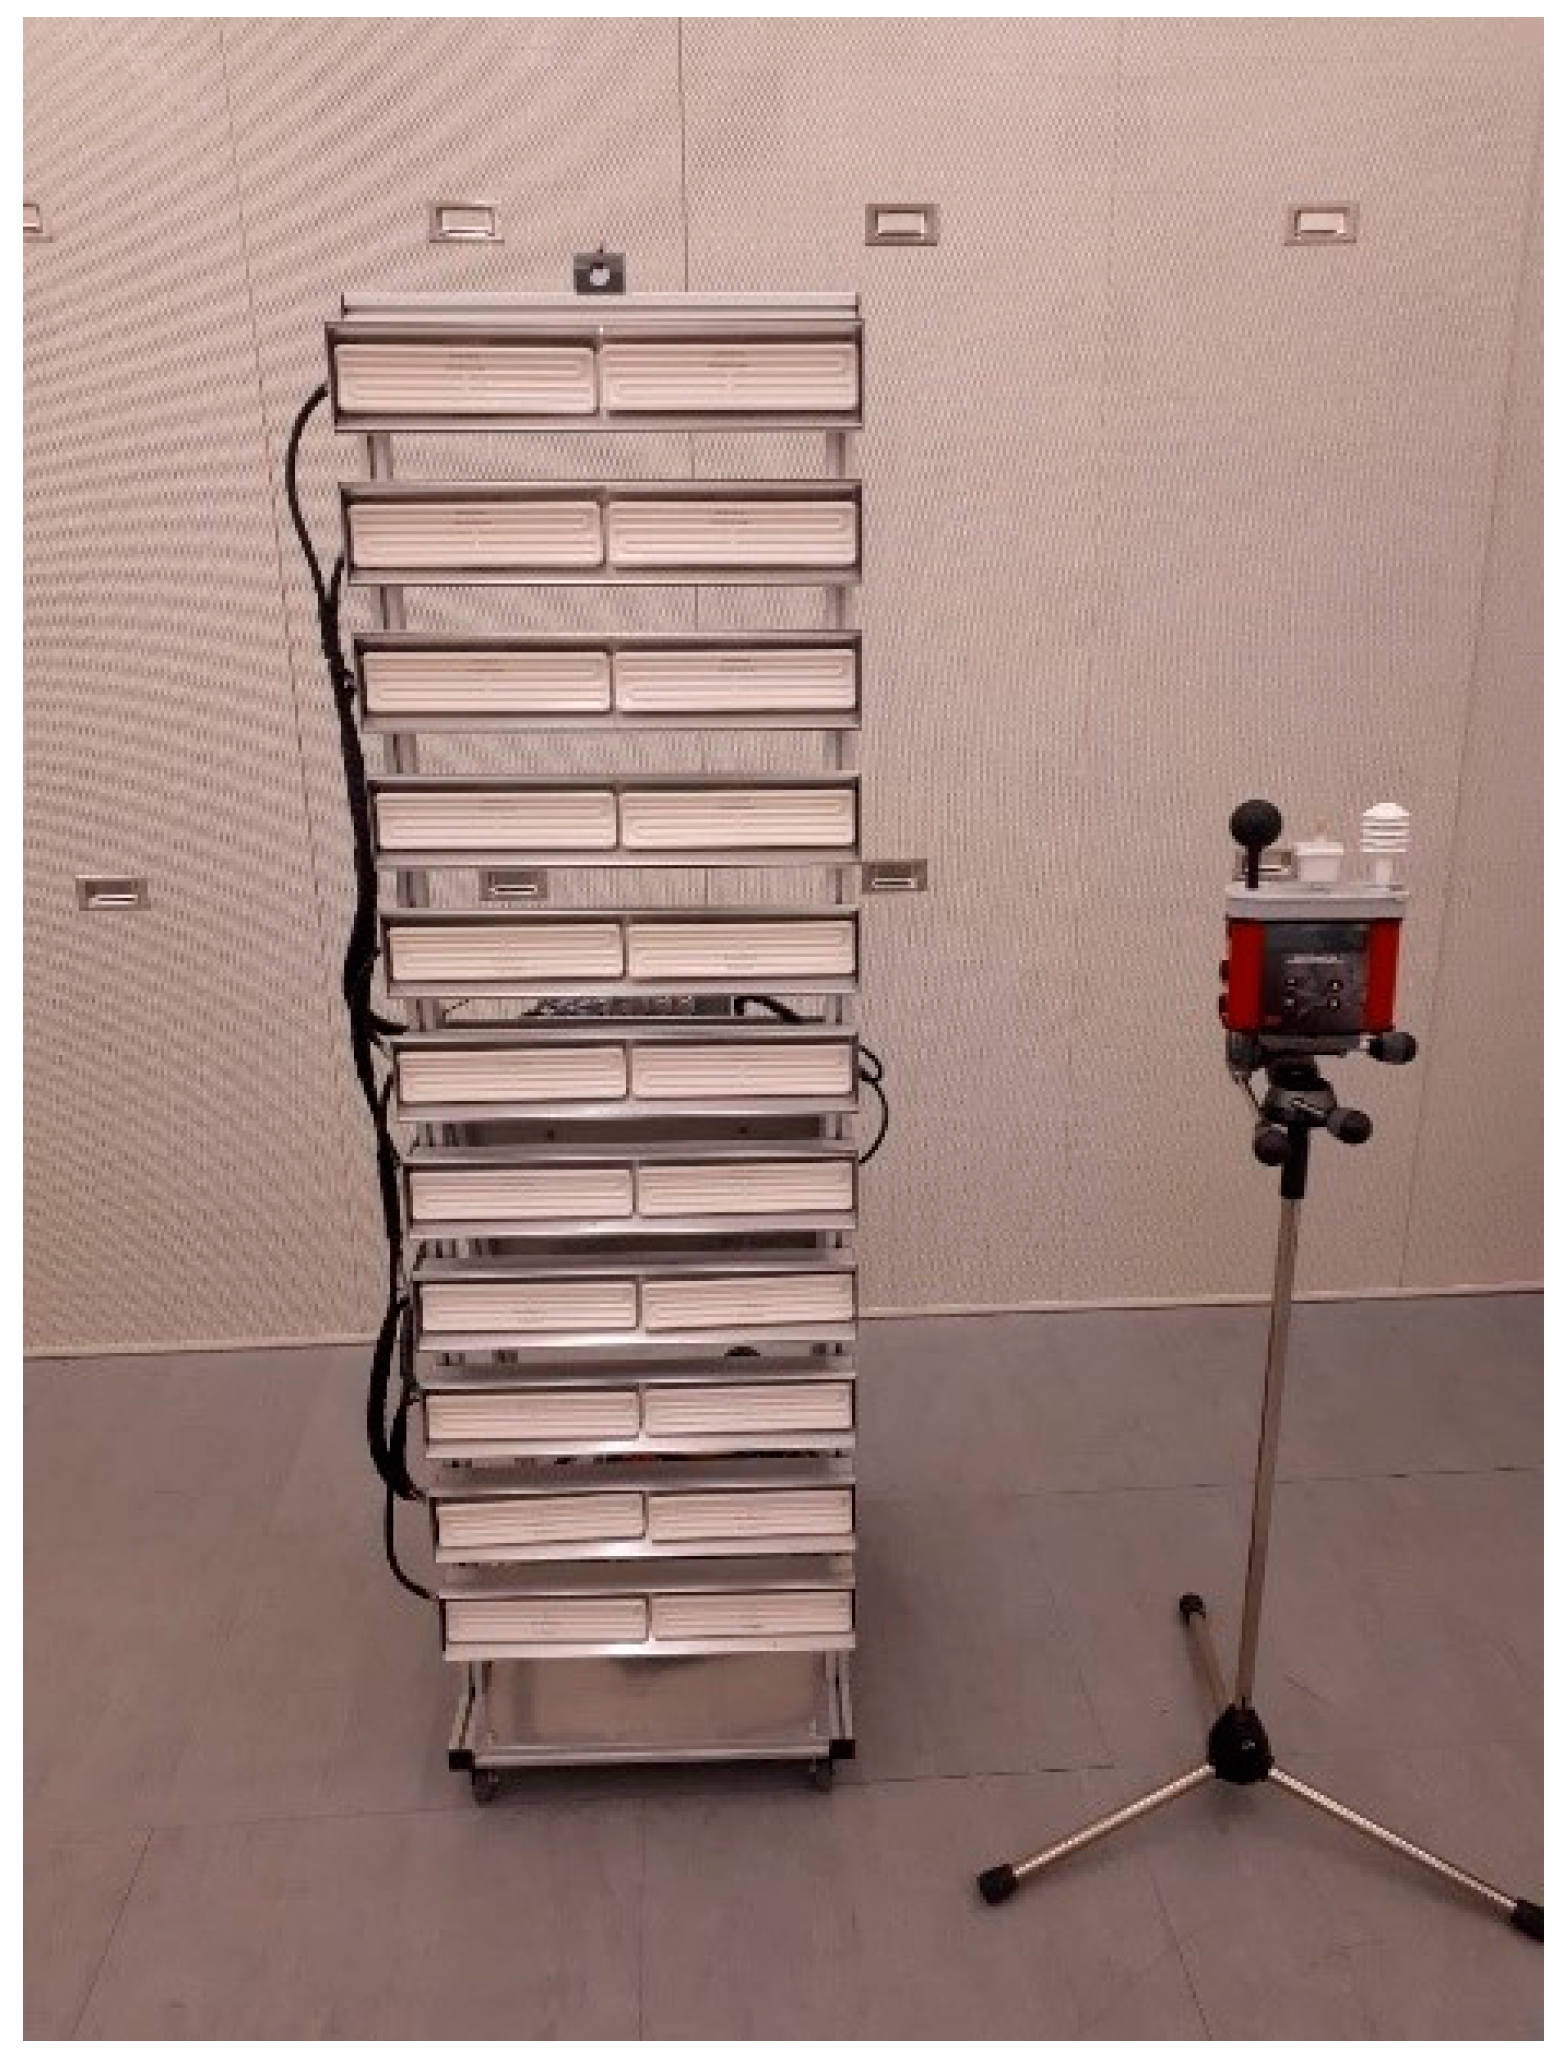
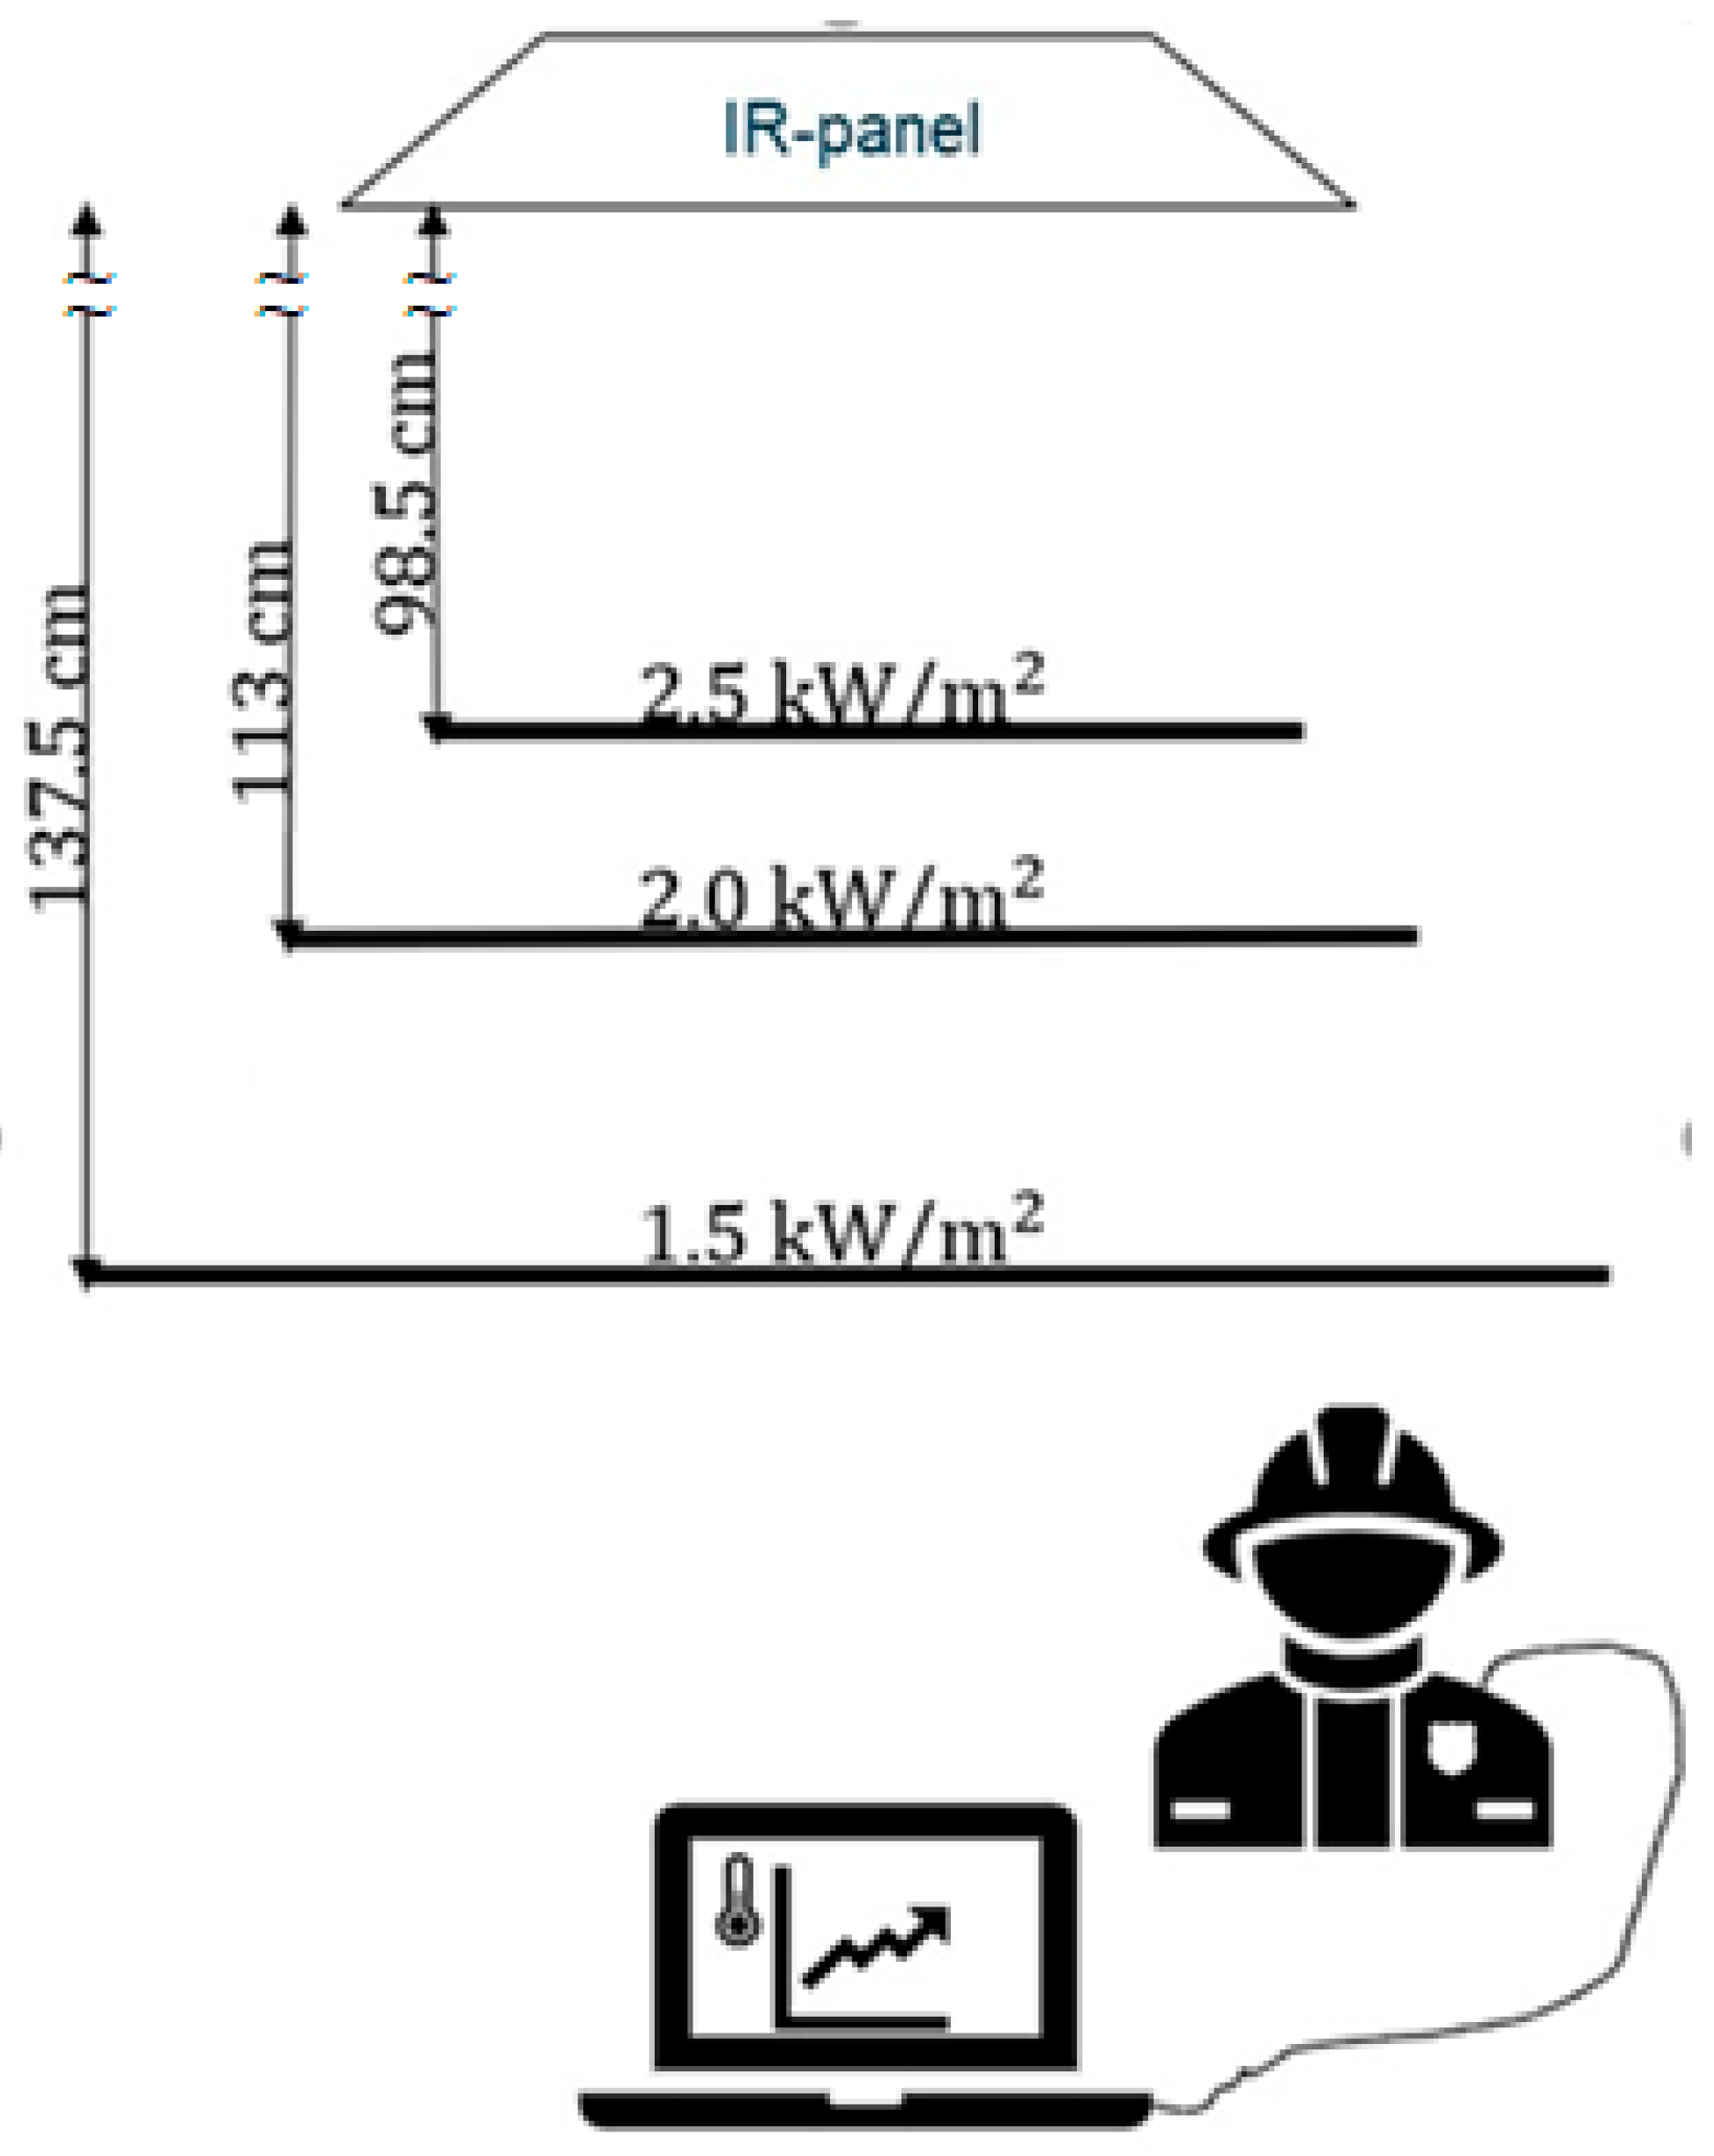
2.5.1. Test Setup
2.5.2. Test Procedure
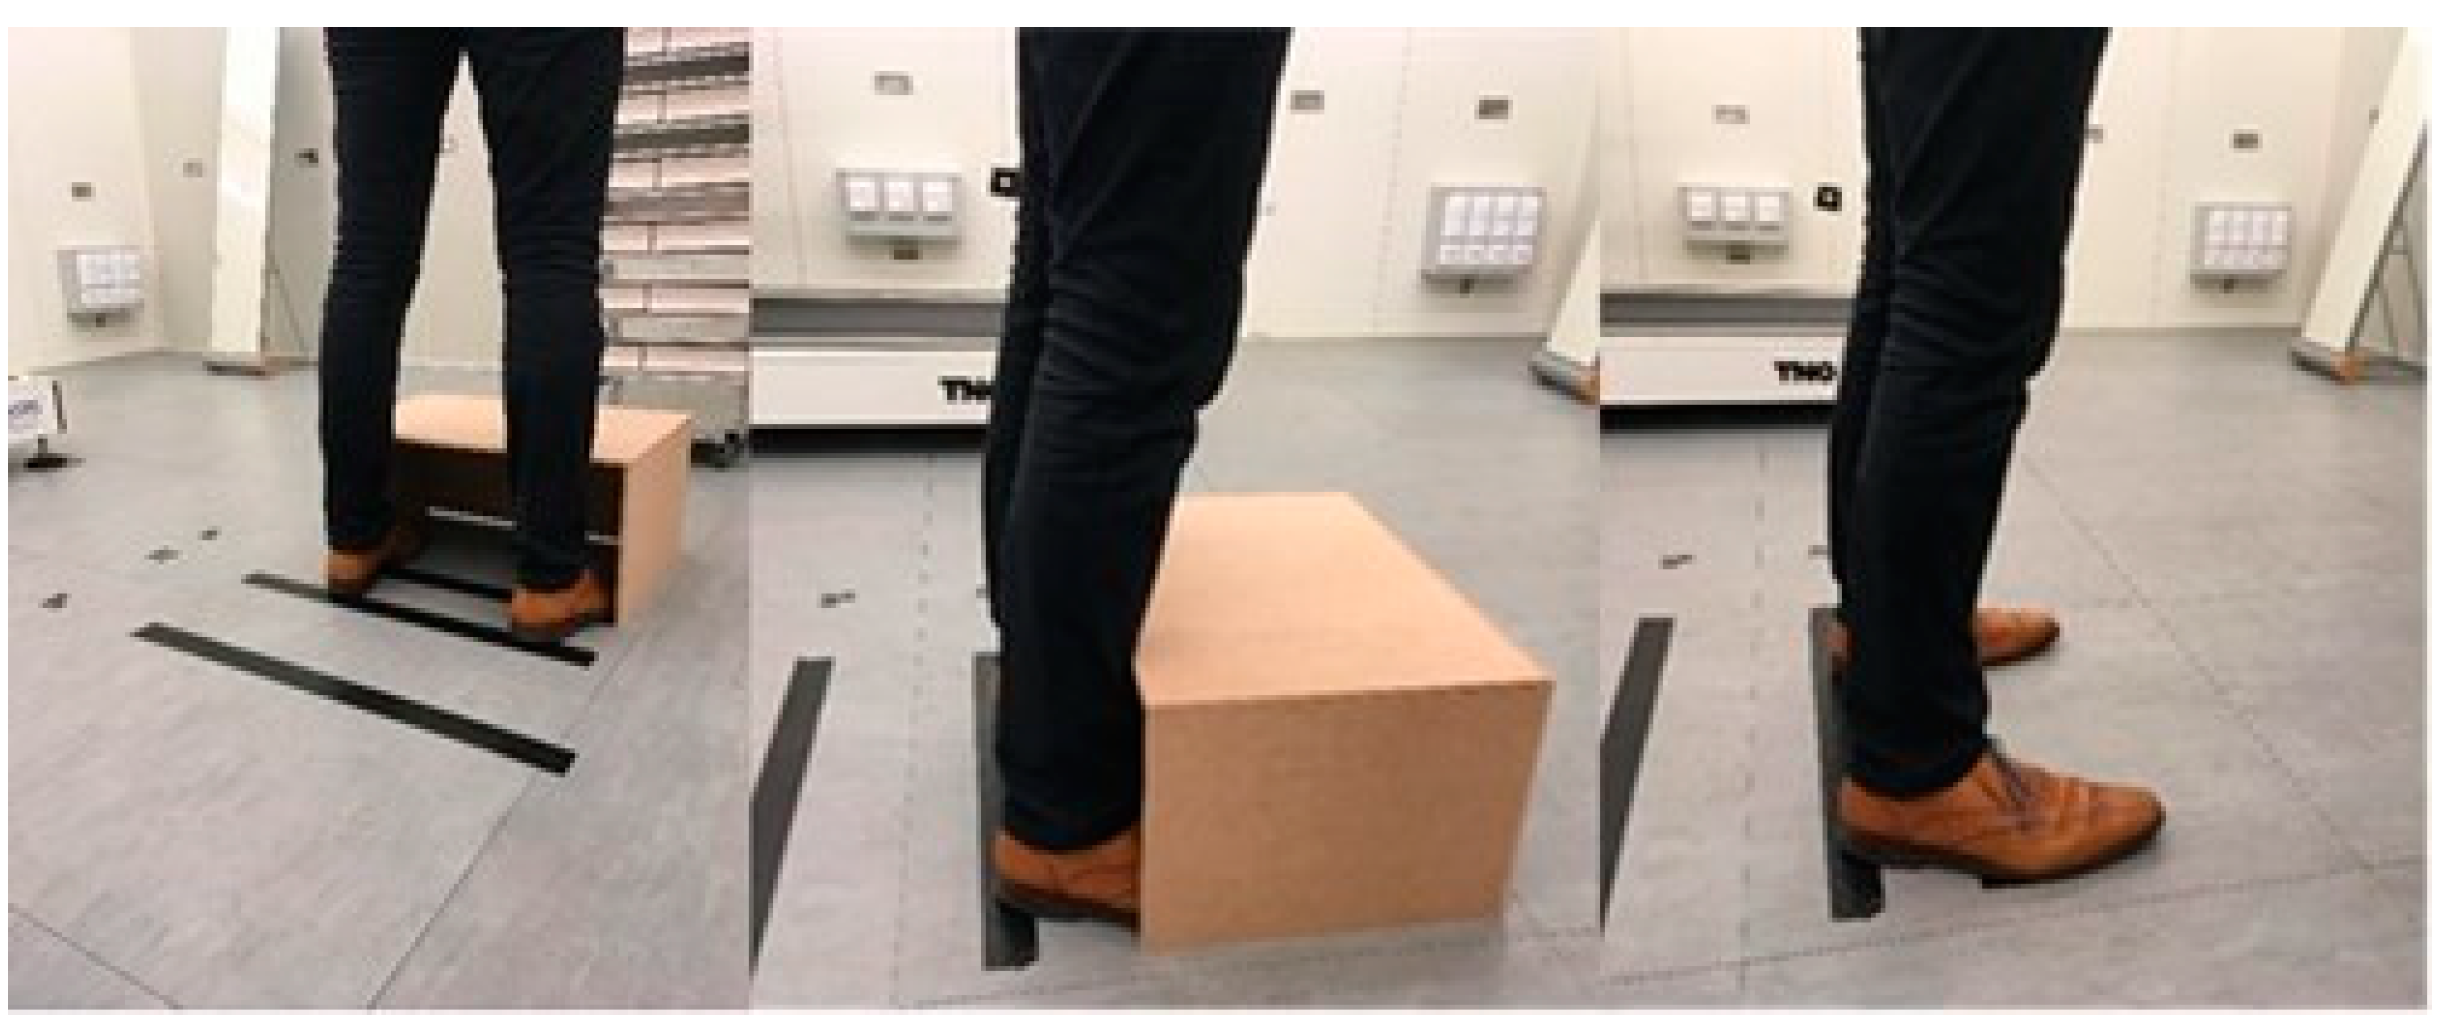
2.6. Air Gap Estimation
2.7. Data Analysis
2.7.1. Data Analysis for Exposure Limits
2.7.2. Data Analysis and Statistics for Evaluation of the Air Gap
3. Results
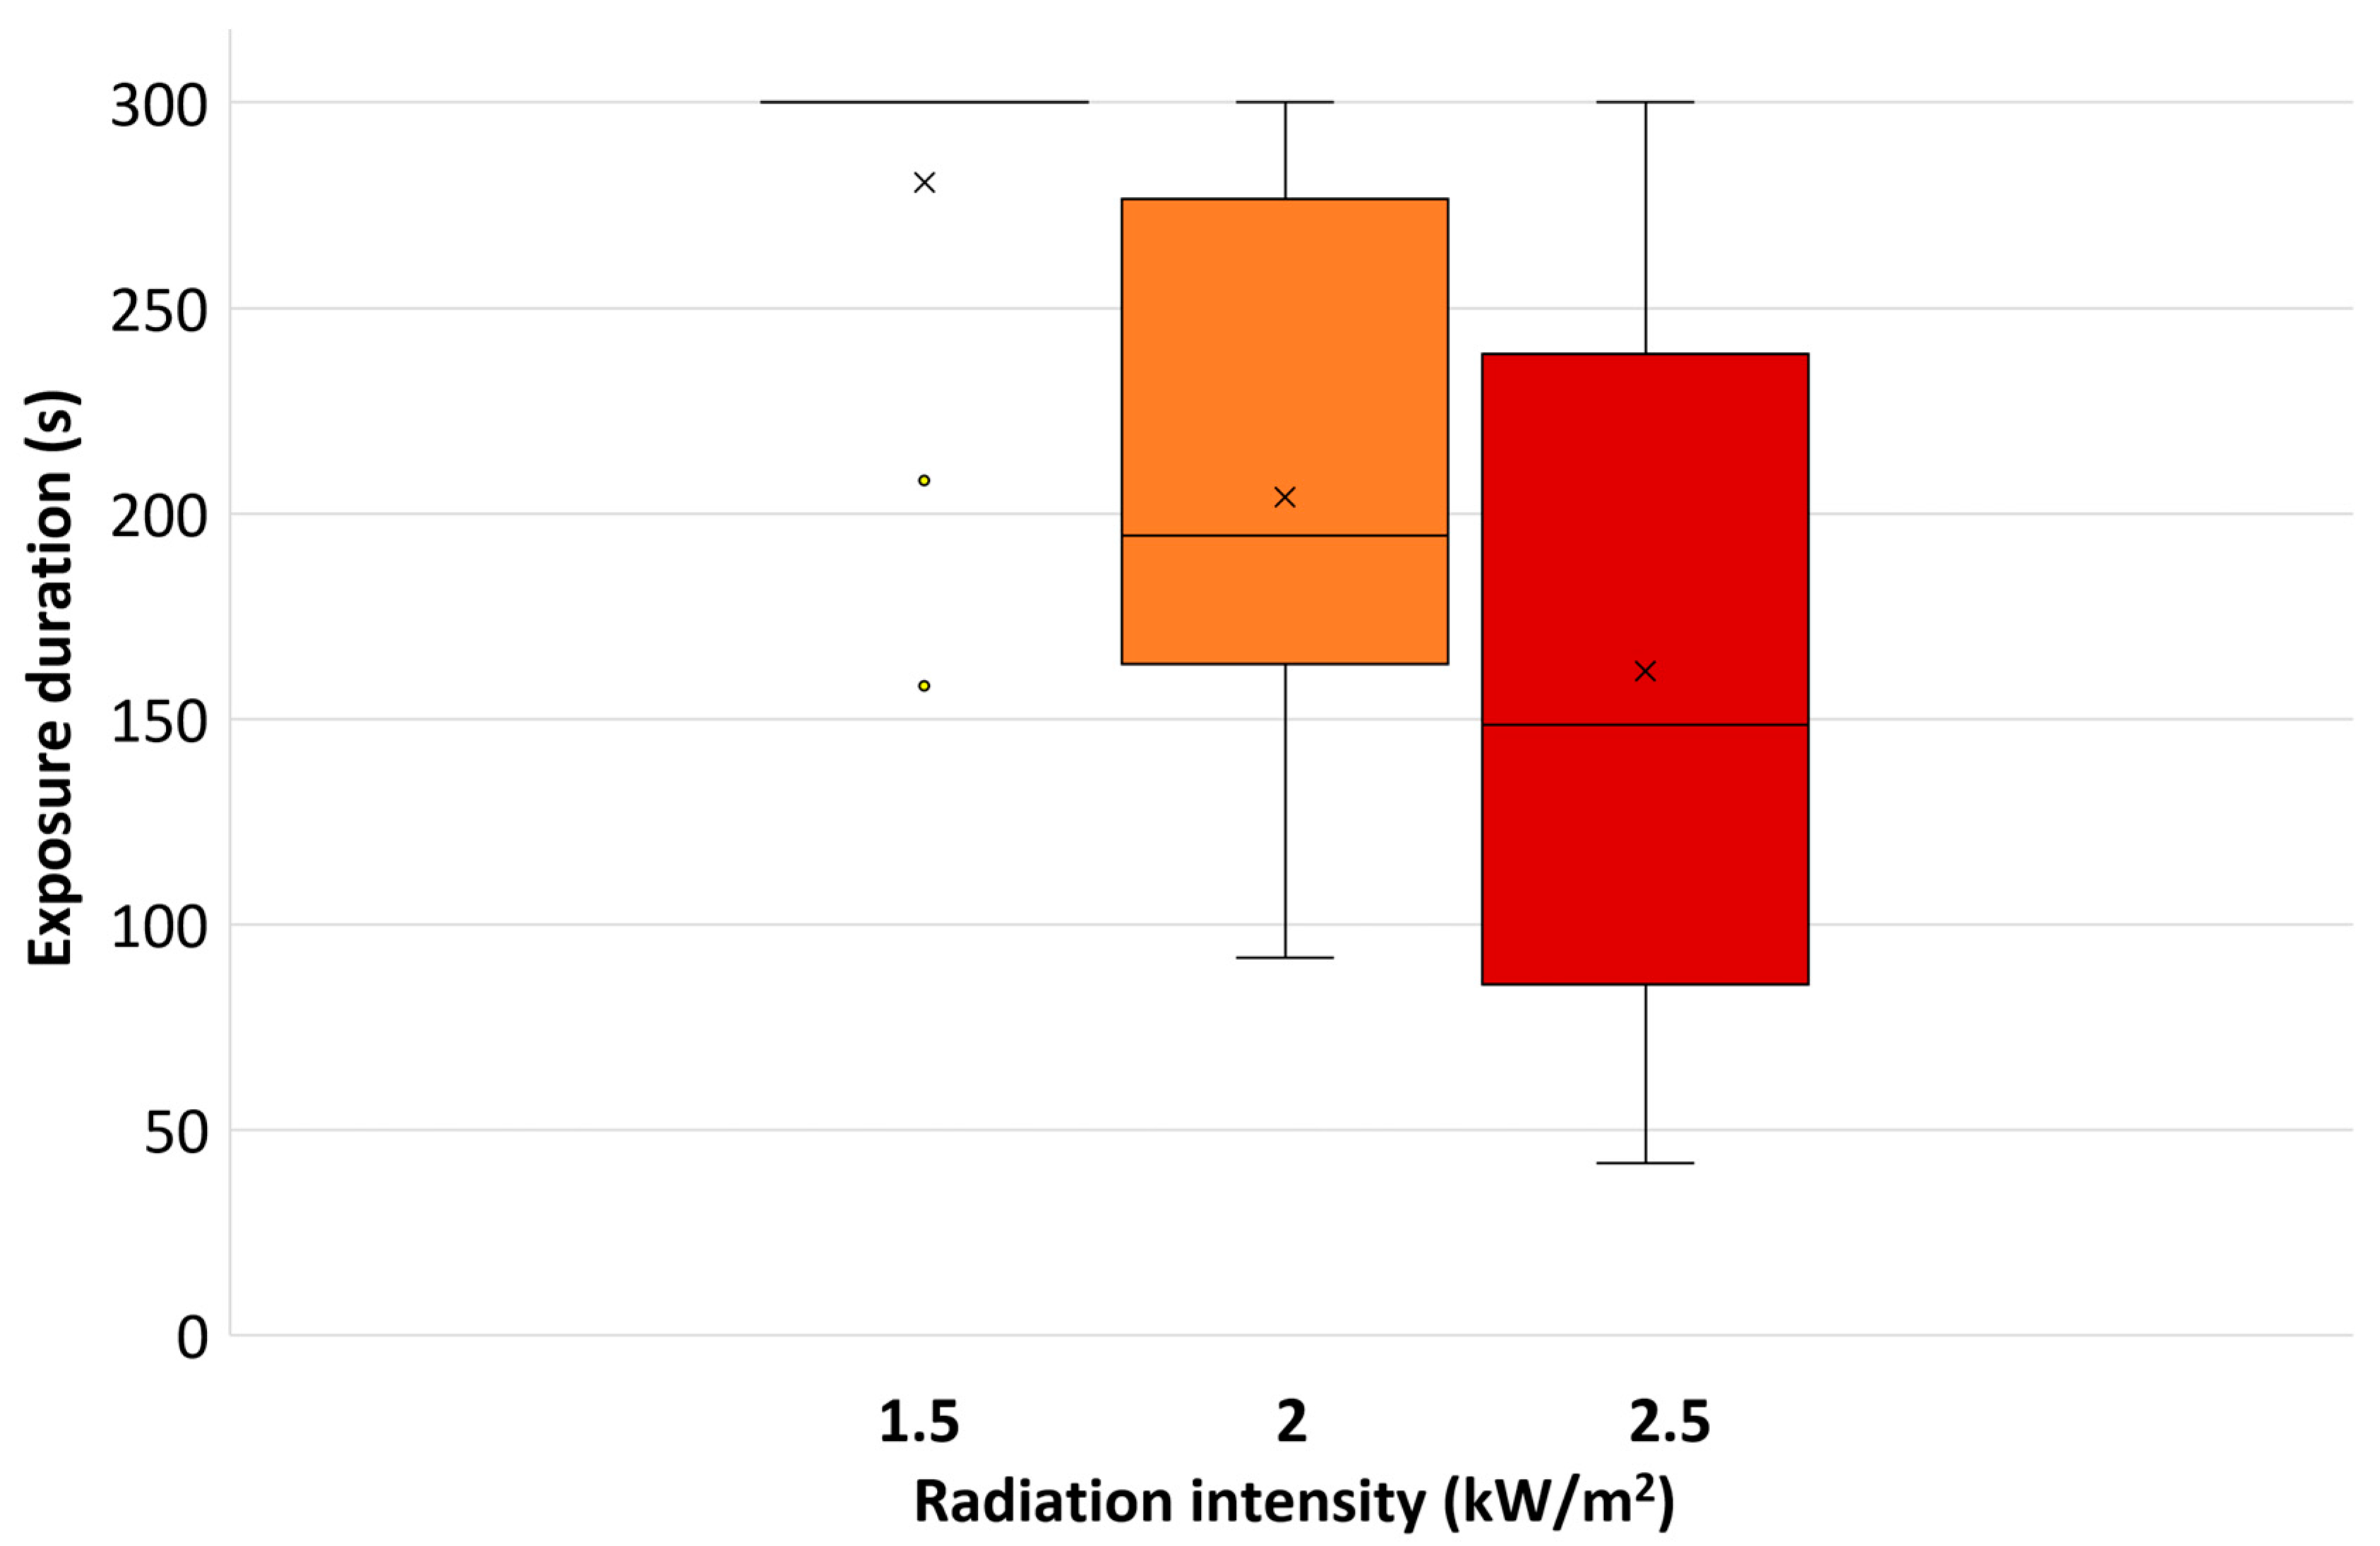
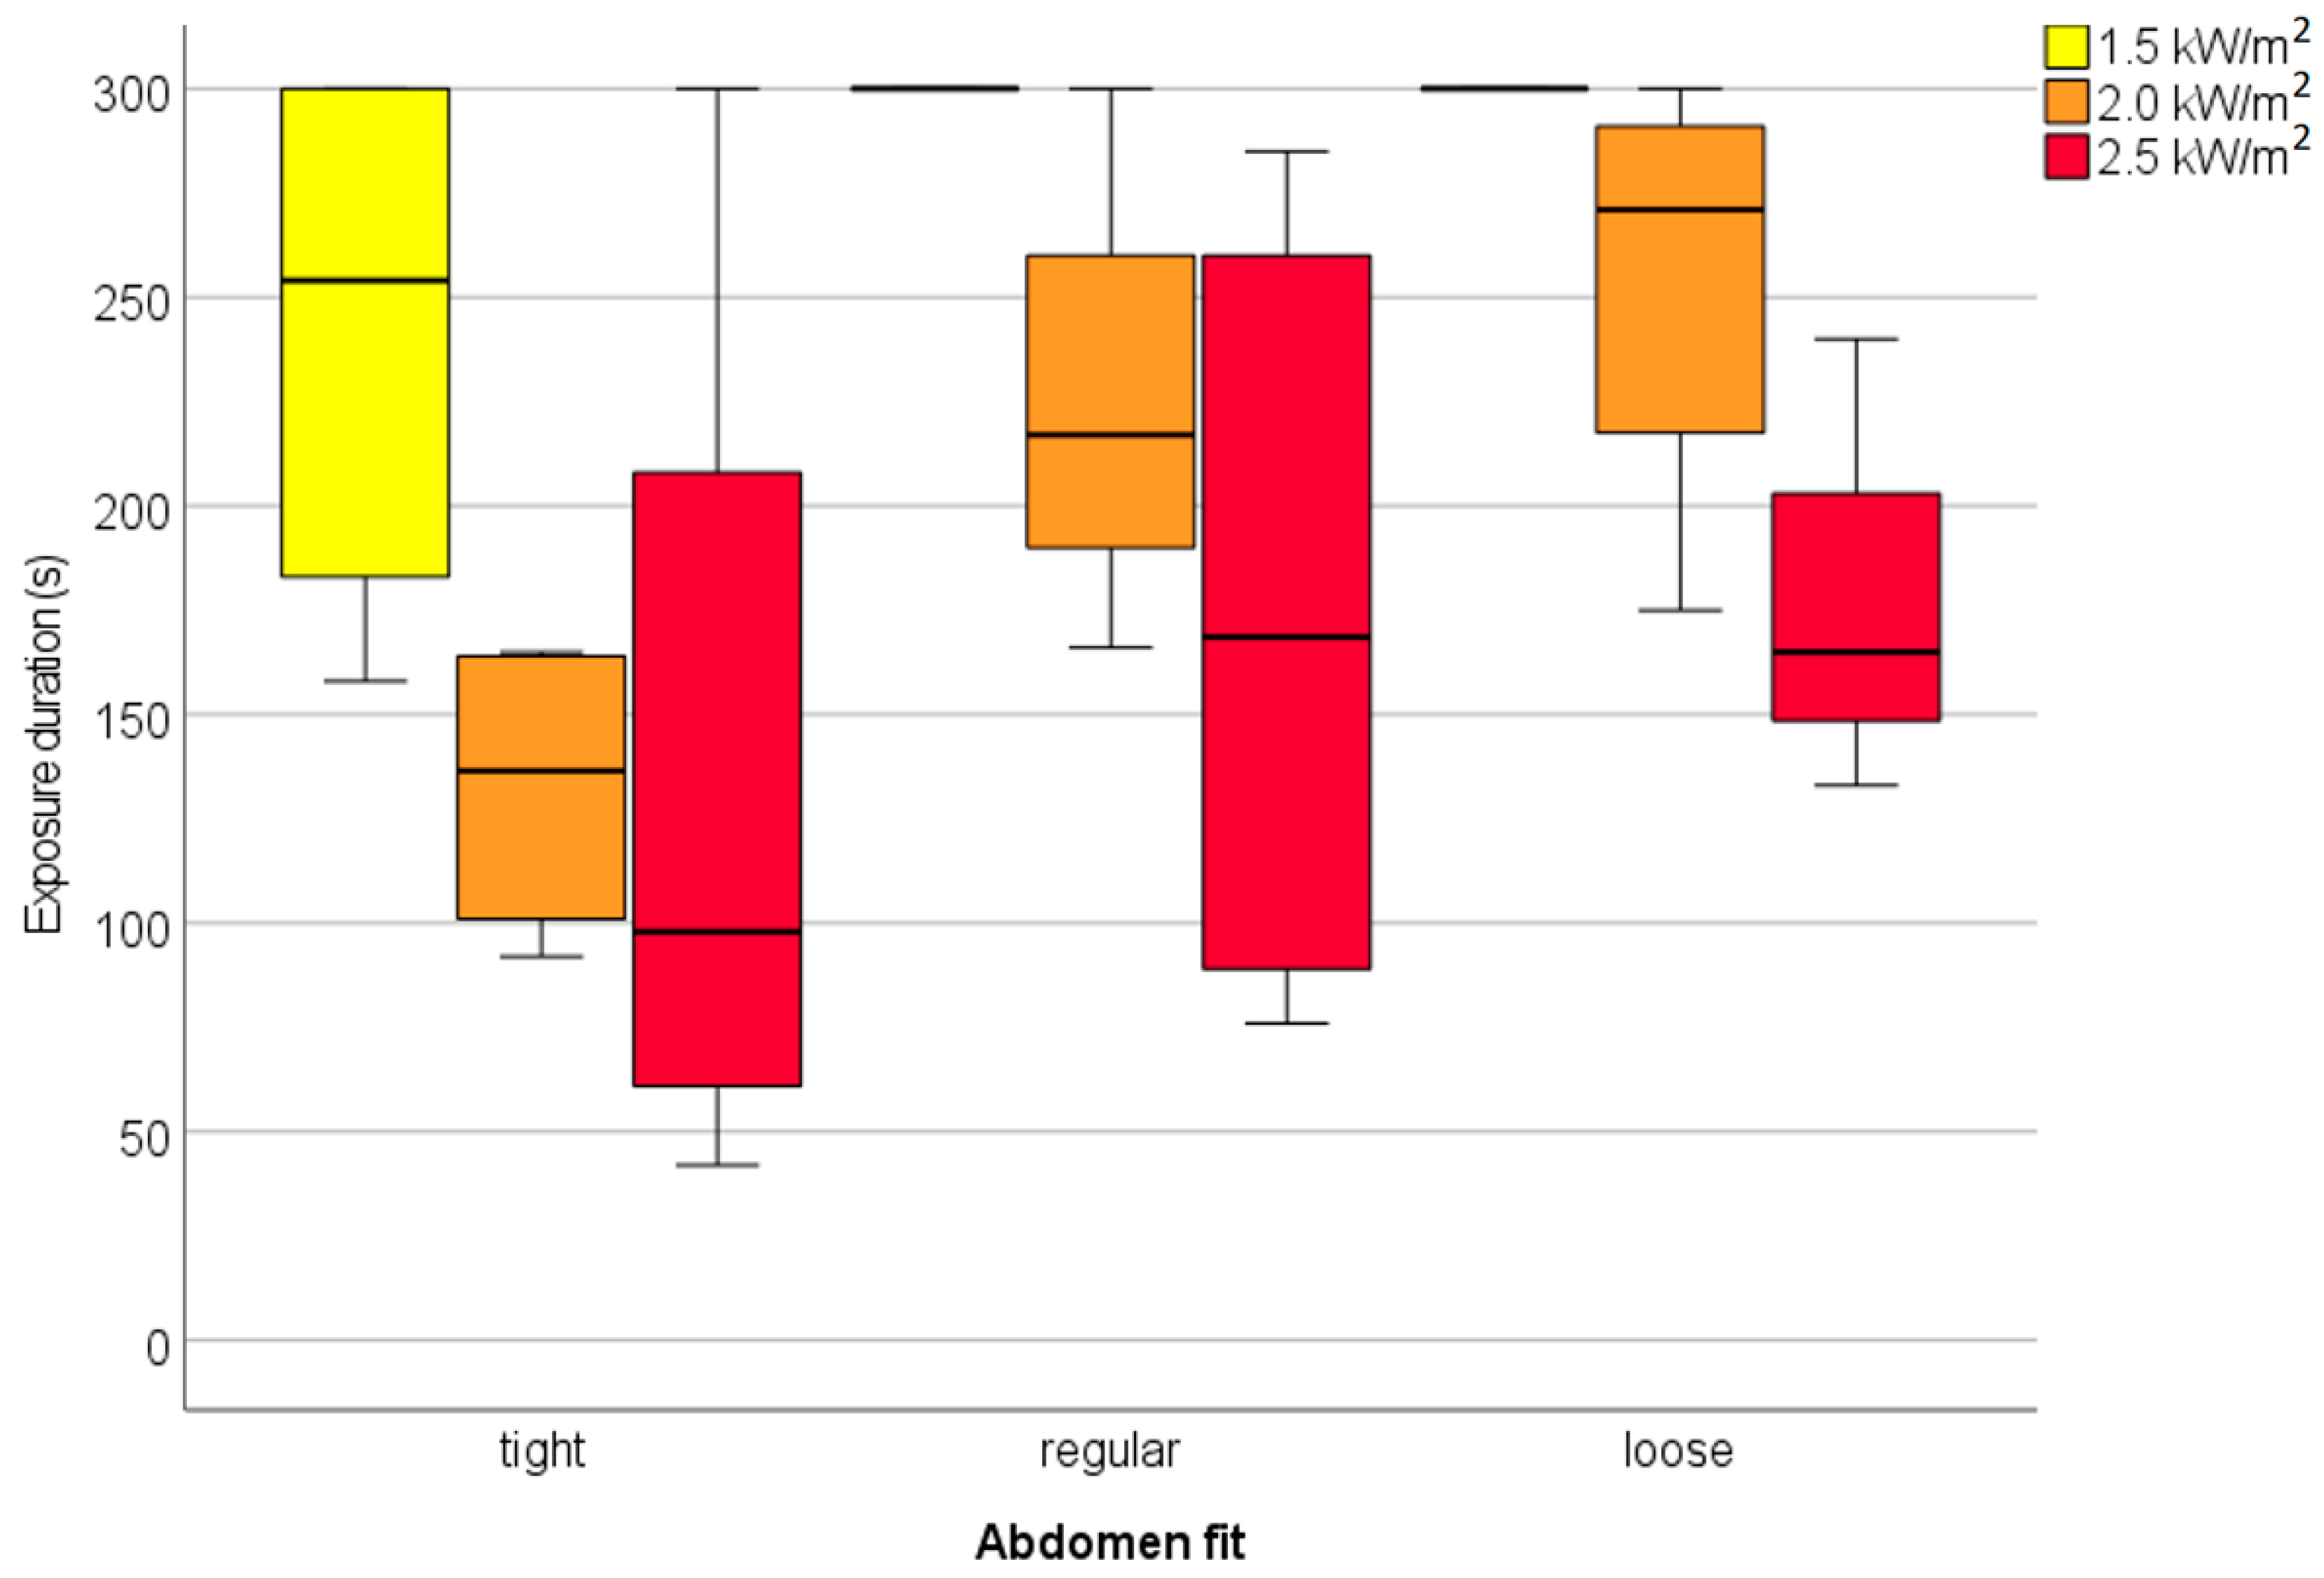
3.1. Exposure Time
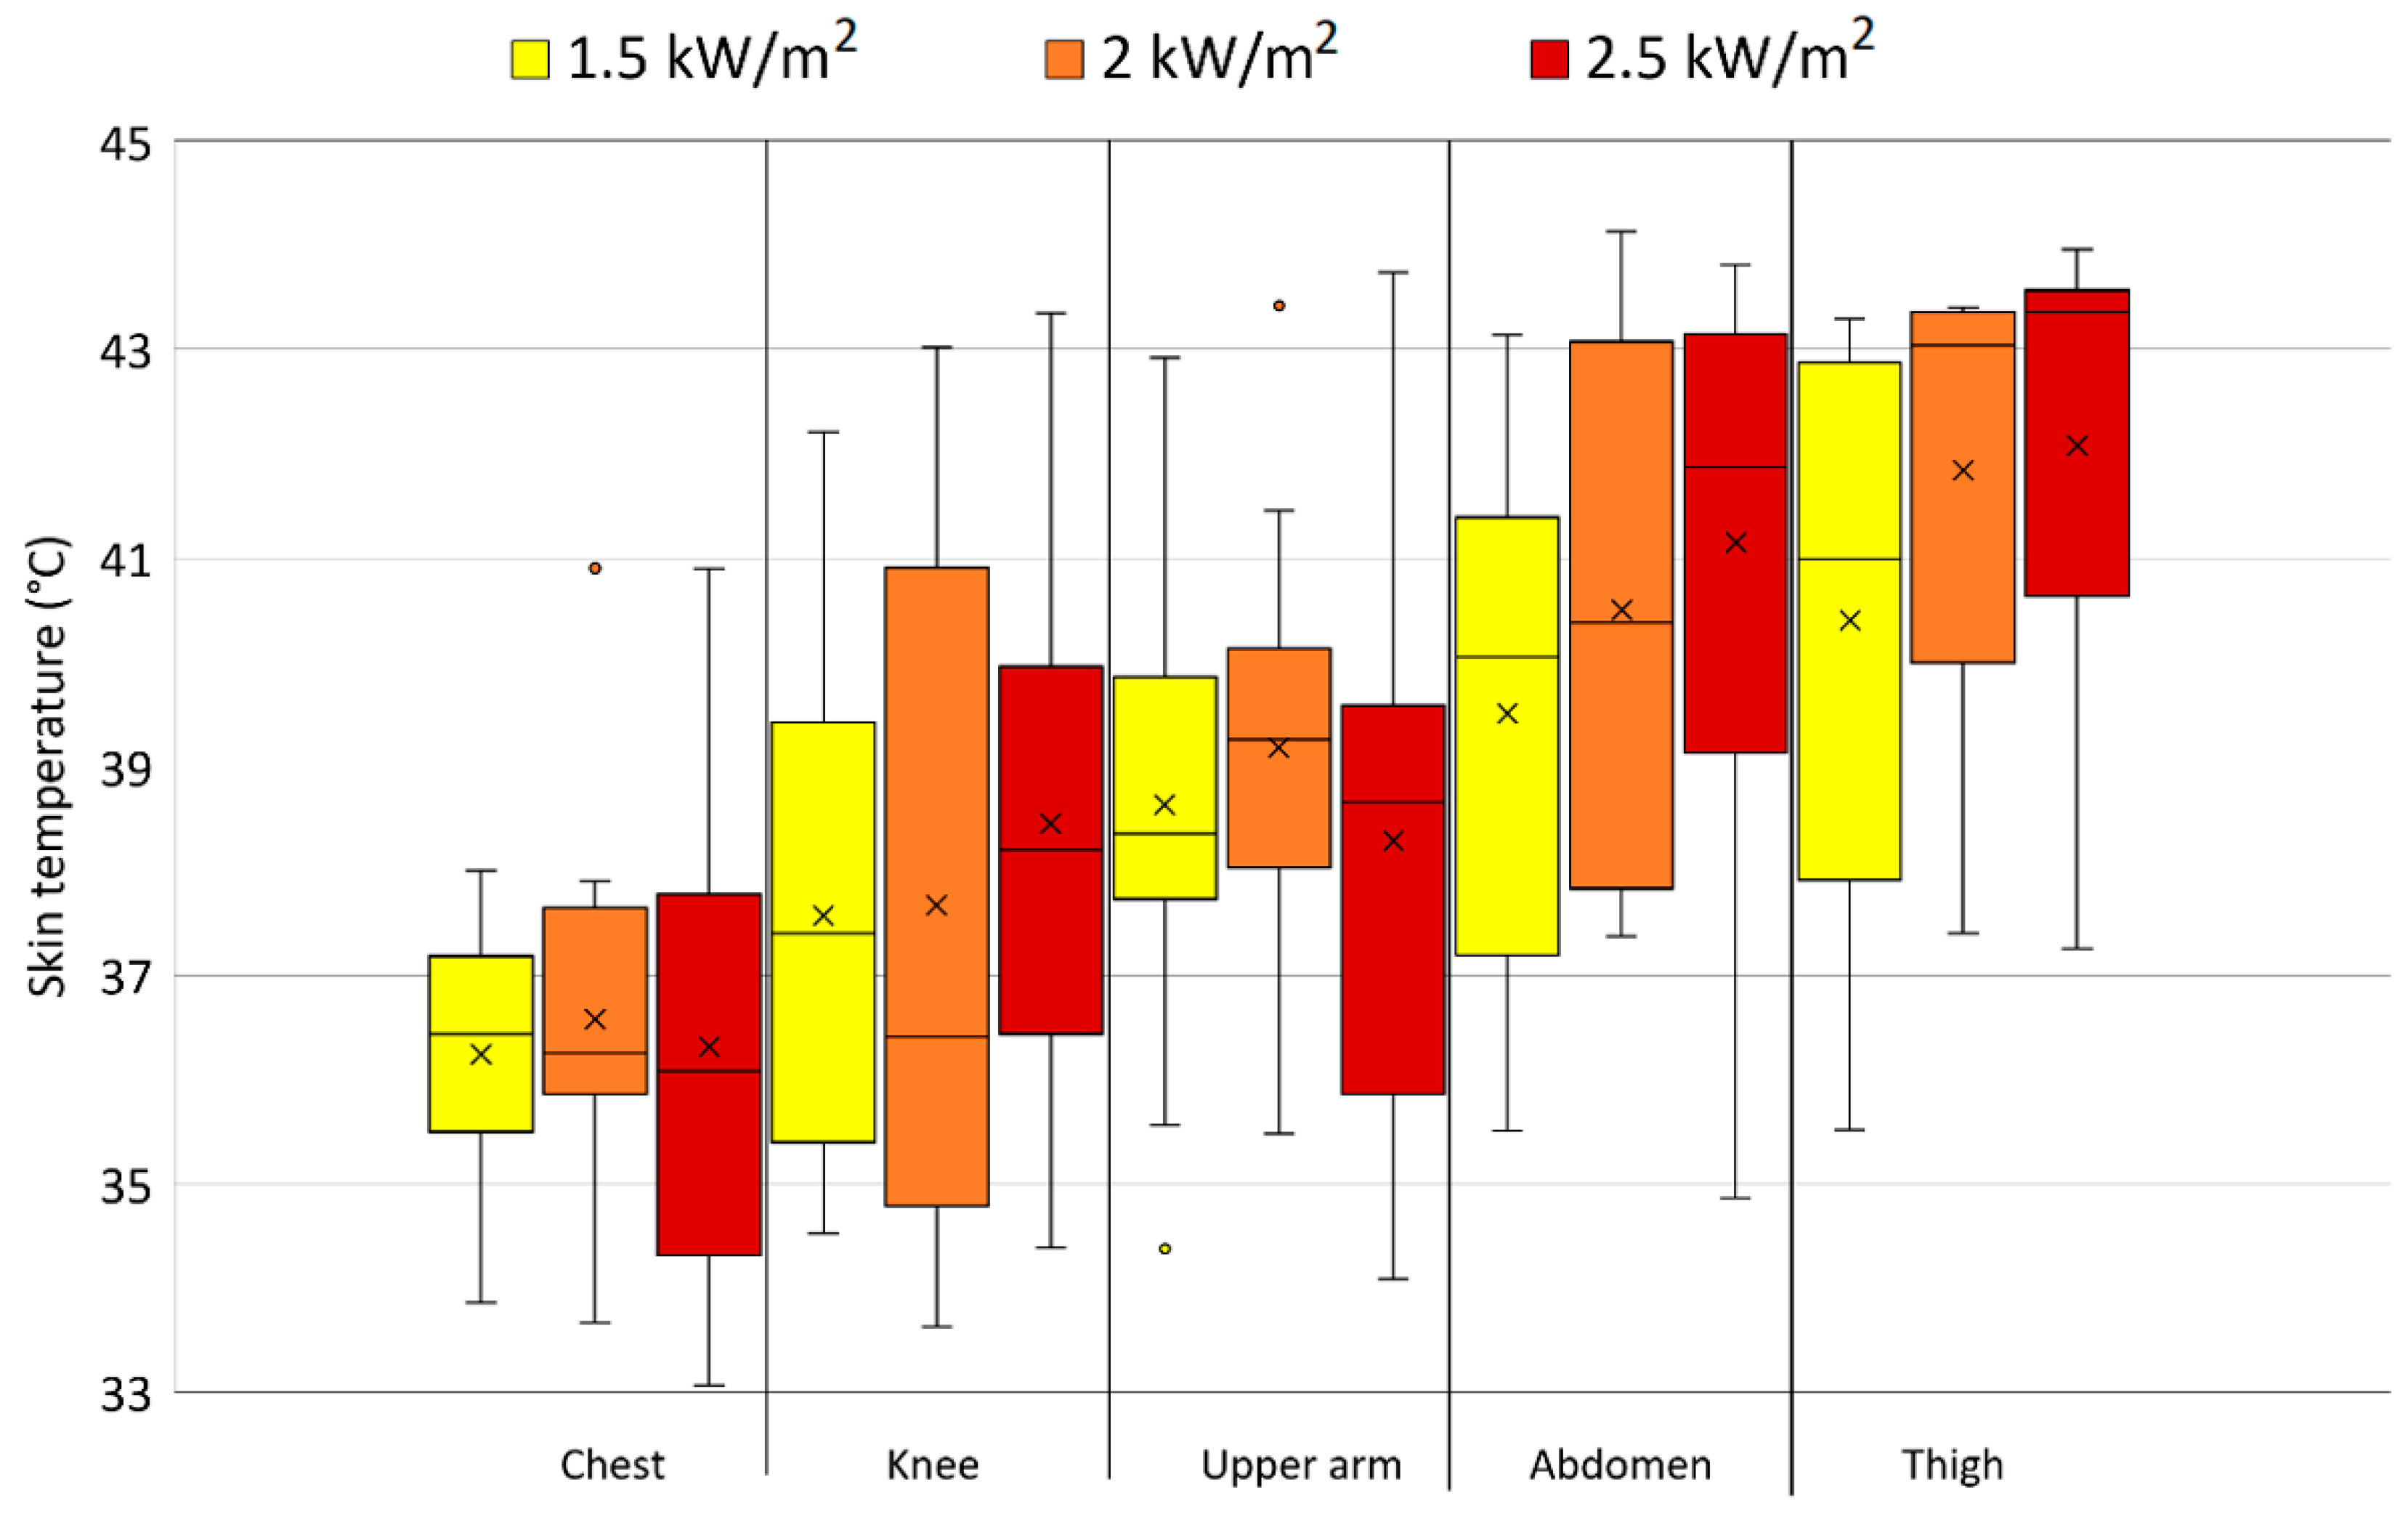
3.2. Skin Temperature
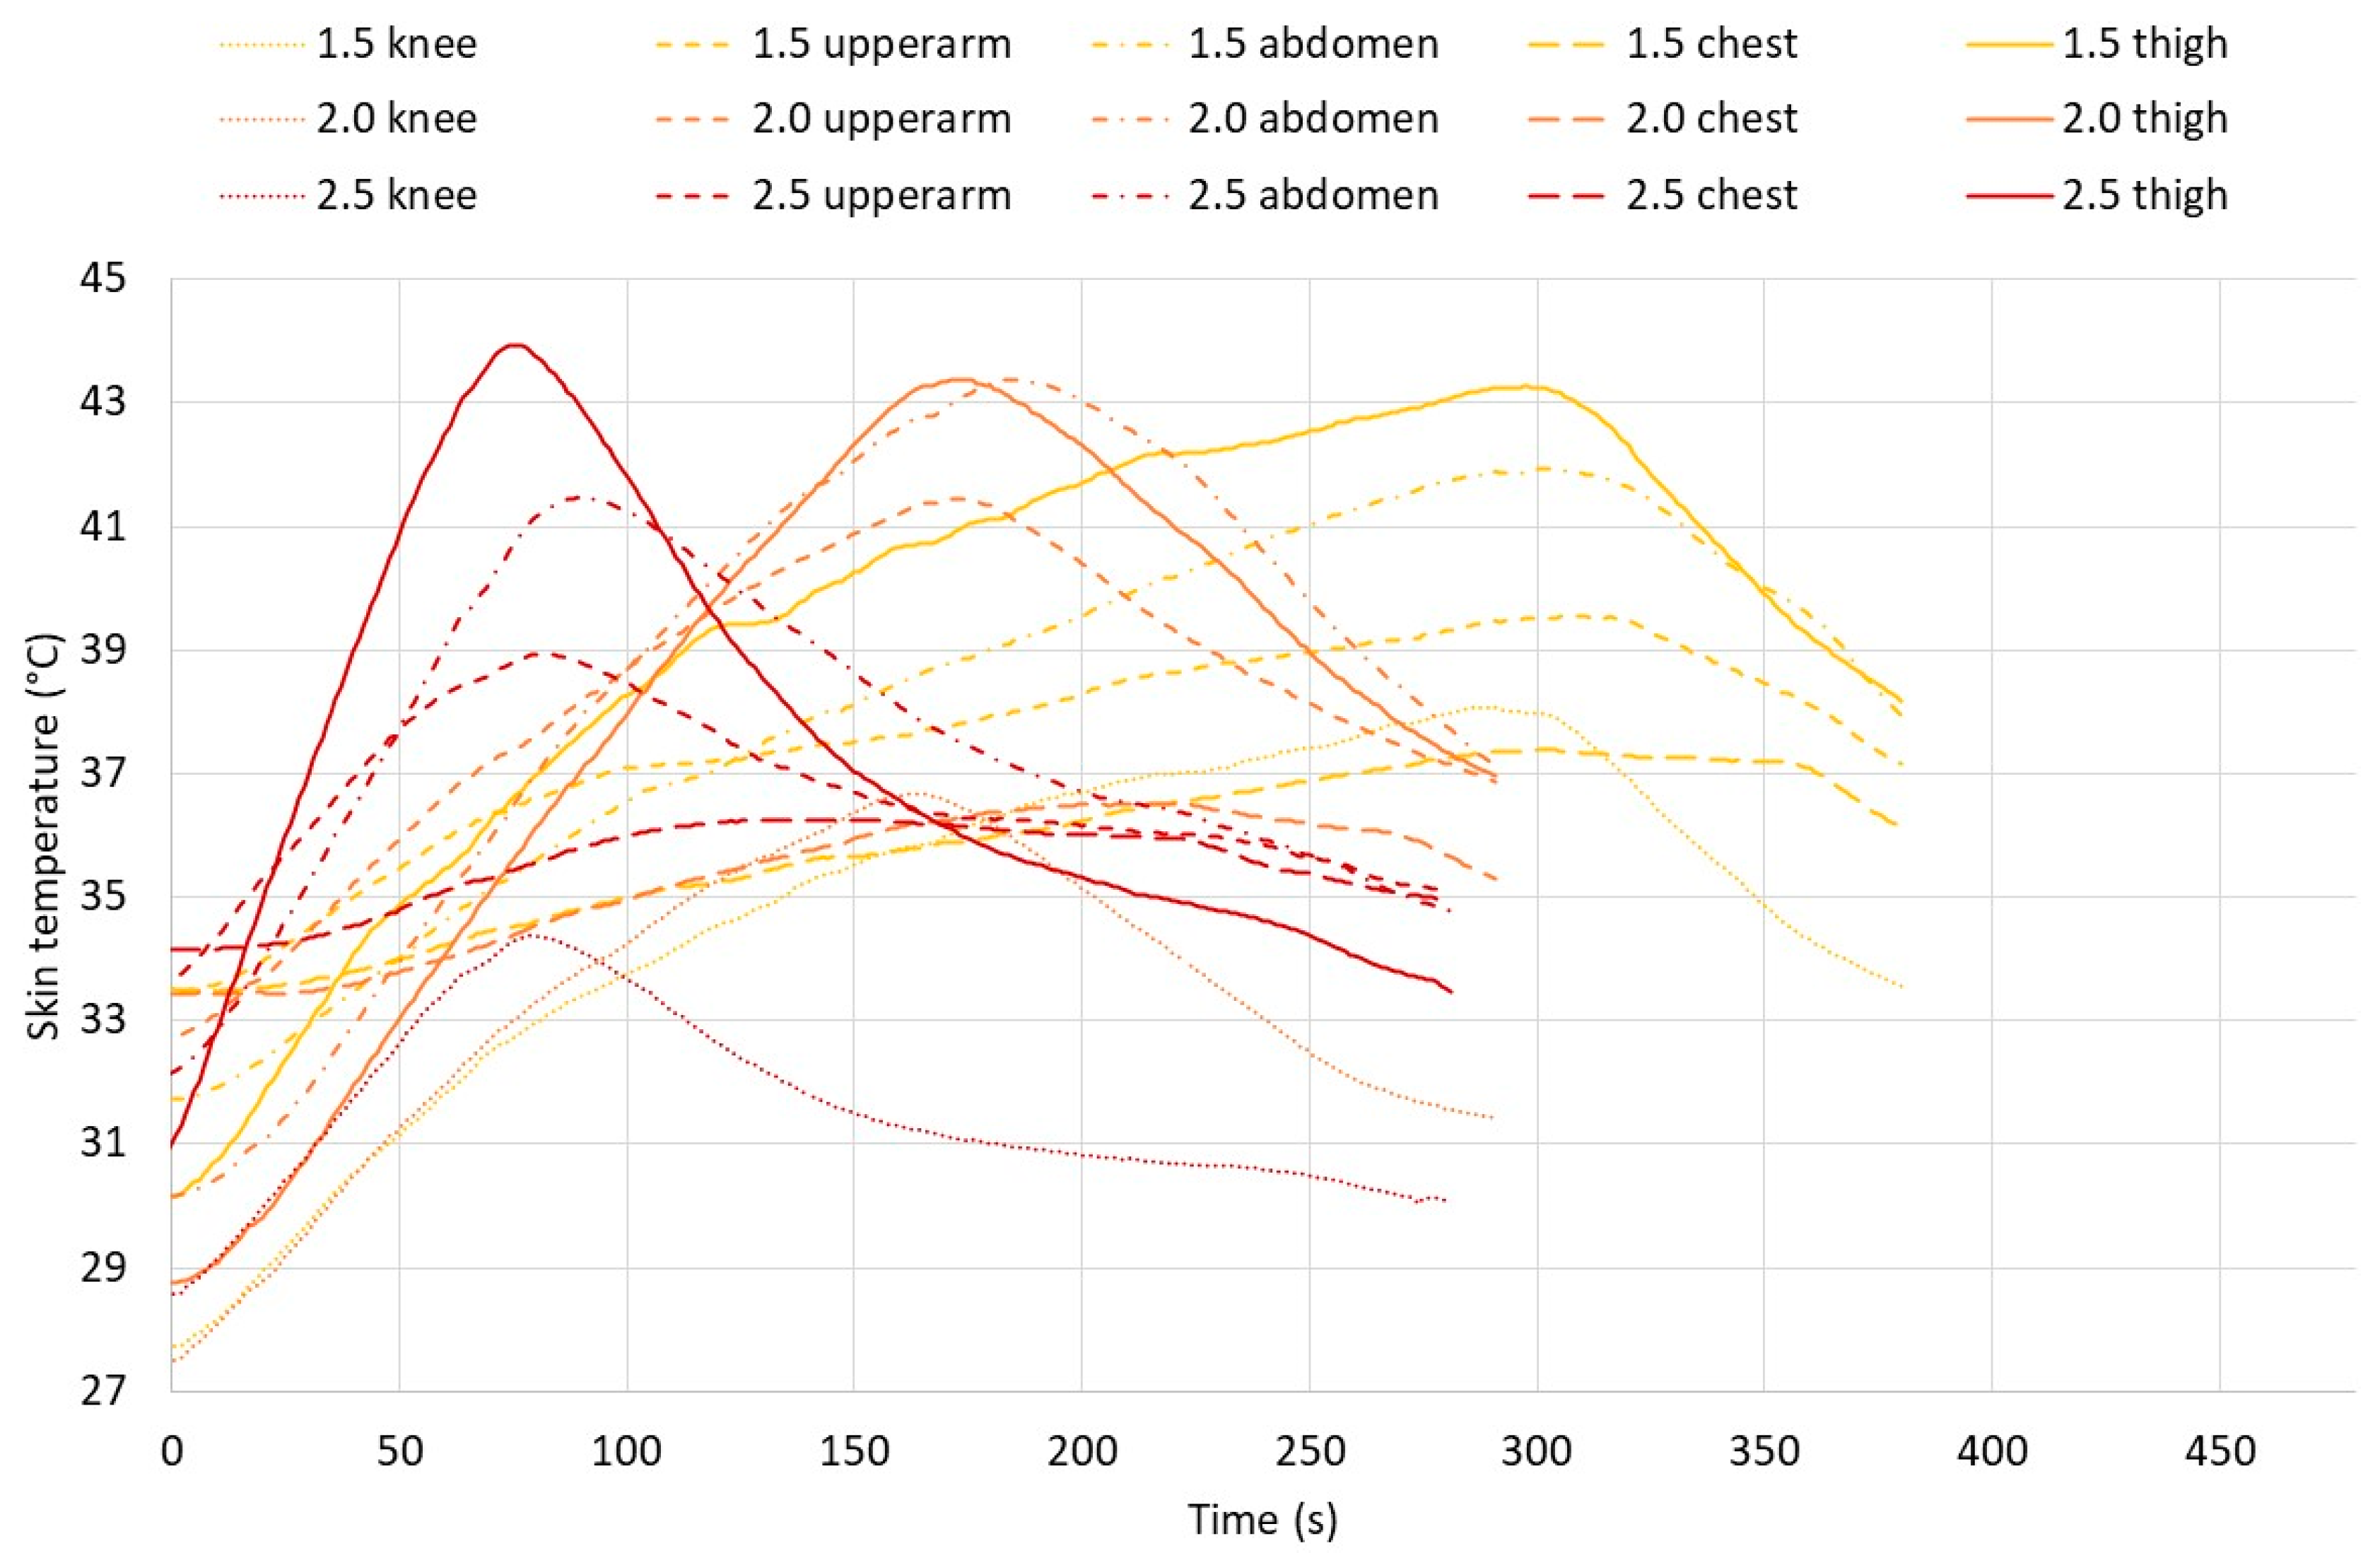
Skin Temperature Change
3.3. Subjective Responses
3.4. Air Gap
3.4.1. Comparisons between Groups: Tight, Regular, and Loose Fit
3.4.2. Effect of Clothing Fit on Change in Subjective Responses
3.4.3. Regression Analysis of Clothing Fit on Skin Temperature Change
3.4.4. Regression between Skin Temperature and Anthropometric Parameters
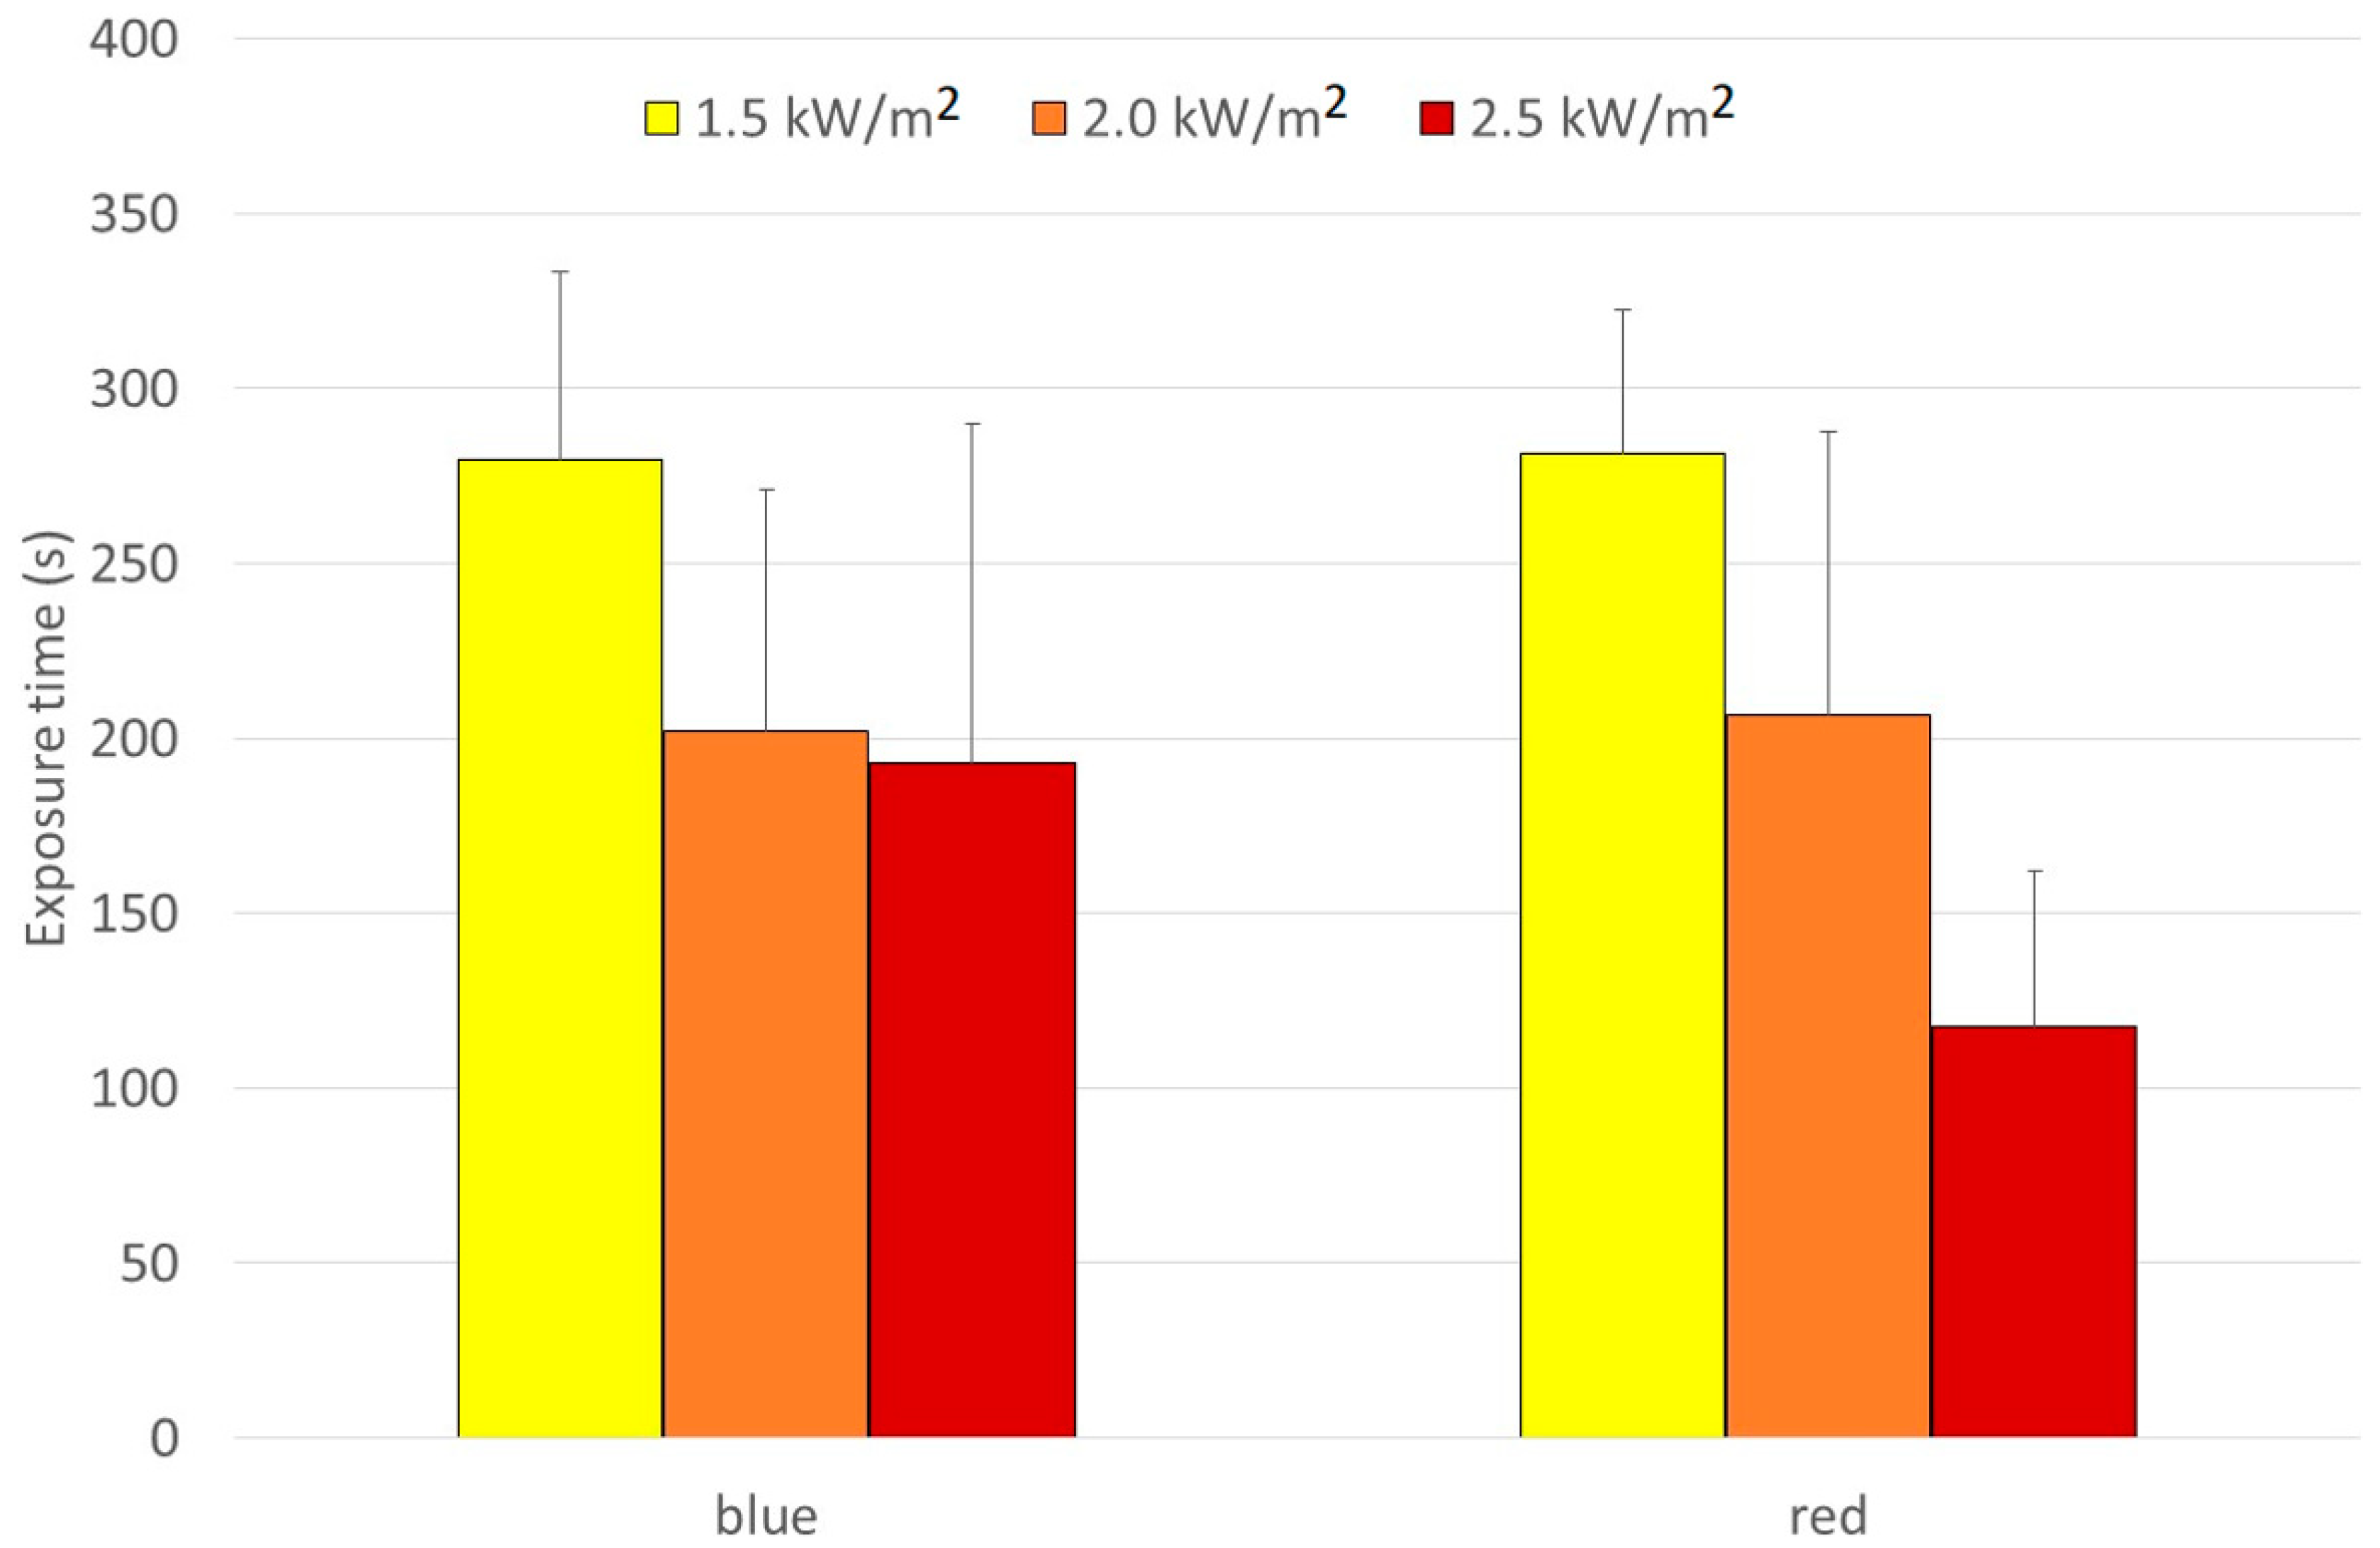
3.5. Effect of Color
4. Discussion
4.1. Exposure Limits
4.2. Clothing Fit and Air Gap Effects
4.3. Color Effects
4.4. Relation to Studies on Firefighter Protective Clothing
5. Conclusions and Recommendations
5.1. Conclusions
- EN ISO 11612 [29] certified process operator clothing offers sufficient protection to prevent skin burns during short-term activities up to 5 min at radiation intensities of 1.5 kW/m2—provided that the clothing fit is not tight and the correct size is used.
- For up to 3 min, the clothing offers sufficient protection against a radiation intensity of 2.0 kW/m2, provided that the clothing is not tight and the correct size is used.
- Supplementary (long) underwear and sufficiently loose clothing contribute to the protection of operators during an increased time at the earlier mentioned radiation levels or against higher heat radiation levels.
- Without supplementary underclothing at higher radiation intensities than 2.0 kW/m2, EN ISO 11612 [29] clothing is unsuitable for wearing as protective clothing.
- The maximum radiation levels for operators’ clothing set in the “Guidelines for maximum permissible levels of heat radiation for short deployment (maximum 5 min) of (company) firefighting personnel and operators at industrial companies” can be adjusted from 1 kW/m2 to 1.5 kW/m2 based on this validation study, provided fitting conditions are met.
5.2. Recommendations
Author Contributions
Funding
Institutional Review Board Statement
Informed Consent Statement
Data Availability Statement
Acknowledgments
Conflicts of Interest
References
- EN 469:2020; Protective Clothing for Firefighters—Performance Requirements for Protective Clothing for Firefighting Activities. CEN: Brussels, Belgium, 2020.
- Kahn, S.A.; Patel, J.H.; Lentz, C.W.; Bell, D.E. Firefighter burn injuries: Predictable patterns influenced by turnout gear. J. Burn. Care Res. 2012, 33, 152–156. [Google Scholar] [CrossRef] [PubMed]
- Karter, M.J. Patterns of Firefighter Fireground Injuries. Natl. Fire Prot. Assoc. 2012, 1/12 2, 23. [Google Scholar]
- Kim, D.-H.; Kim, S.; Lee, J.-Y. An empirical investigation of firefighting personal protective equipment and burn injuries in Korea. Ind. Health 2022, 60, 2–15. [Google Scholar] [CrossRef] [PubMed]
- Mert, E.; Psikuta, A.; Bueno, M.A.; Rossi, R.M. The effect of body postures on the distribution of air gap thickness and contact area. Int. J. Biometeorol. 2017, 61, 363–375. [Google Scholar] [CrossRef] [PubMed]
- Holmér, I. Protective clothing in hot environments. Ind. Health 2006, 44, 404–413. [Google Scholar] [CrossRef]
- Mert, E.; Psikuta, A.; Bueno, M.A.; Rossi, R.M. Effect of heterogenous and homogenous air gaps on dry heat loss through the garment. Int. J. Biometeorol. 2015, 59, 1701–1710. [Google Scholar] [CrossRef]
- Chen, Y.S.; Fan, J.; Qian, X.; Zhang, W. Effect of garment fit on thermal insulation and evaporative resistance. Text. Res. J. 2004, 74, 742–748. [Google Scholar] [CrossRef]
- Frackiewicz-Kaczmarek, J.; Psikuta, A.; Bueno, M.A.; Rossi, R.M. Effect of garment properties on air gap thickness and the contact area distribution. Text. Res. J. 2015, 85, 1907–1918. [Google Scholar] [CrossRef]
- Ghazy, A.; Bergstrom, D.J. Influence of the air gap between protective clothing and skin on clothing performance during flash fire exposure. Heat Mass Transf. Waerme-Und Stoffuebertragung 2011, 47, 1275–1288. [Google Scholar] [CrossRef]
- Psikuta, A.; Mert, E.; Annaheim, S.; Rossi, R.M. Local air gap thickness and contact area models for realistic simulation of human thermo-physiological response. Int. J. Biometeorol. 2018, 62, 1121–1134. [Google Scholar] [CrossRef]
- Fu, M.; Weng, W.; Yuan, H. Effects of multiple air gaps on the thermal performance of firefighter protective clothing under low-level heat exposure. Text. Res. J. 2014, 84, 968–978. [Google Scholar] [CrossRef]
- Su, Y.; Li, J.; Wang, Y. Effect of air gap thickness on thermal protection of firefighter’s protective clothing against hot steam and thermal radiation. Fibers Polym. 2017, 18, 582–589. [Google Scholar] [CrossRef]
- Song, G. Clothing air gap layers and thermal protective performance in single layer garment. J. Ind. Text. 2007, 36, 193–205. [Google Scholar] [CrossRef]
- Ghazy, A. The thermal protective performance of firefighters’ clothing: The air gap between the clothing and the body. Heat Transf. Eng. 2017, 38, 975–986. [Google Scholar] [CrossRef]
- Zhai, L.N.; Li, J. Prediction methods of skin burn for performance evaluation of thermal protective clothing. Burns 2015, 41, 1385–1396. [Google Scholar] [CrossRef] [PubMed]
- Psikuta, A.; Kuklane, K.; Bogdan, A.; Havenith, G.; Annaheim, S.; Rossi, R.M. Opportunities and constraints of presently used thermal manikins for thermo-physiological simulation of the human body. Int. J. Biometeorol. 2016, 60, 435–446. [Google Scholar] [CrossRef]
- Heus, R.; Kistemaker, J. Testen brandweerkleding Prof Tech Styles (Tests of firefighters’ clothing Prof Tech Styles), in Dutch. In TNO Memo 2000-M16; TNO Technische Menskunde: Soesterberg, The Netherlands, 2000. [Google Scholar]
- Heus, R.; Wammes, L.; Kistemaker, J.; Havenith, G. Verbetering uitrukkleding Brandweer Amsterdam (Improvement of Amsterdam Fire Brigade turn-out gear), in Dutch. In TNO-TM 1995 C6; TNO Technische Menskunde: Soesterberg, The Netherlands, 1995. [Google Scholar]
- Heus, R.; Wammes, L.; Lotens, W. Een vergelijking van zes brandweerpakken met een referentiepak; gesimuleerde praktijkproeven en comfortproeven (A comparison of six firefighters’ suits with reference clothing; simulated practice trials and comfort trials), in Dutch. In Rapport IZF 1992 C-12; Instituut voor Zintuigfysiologie TNO: Soesterberg, The Netherlands, 1992. [Google Scholar]
- Havenith, G.; Holmér, I.; Meinander, H.; den Hartog, E.; Richards, M.; Broede, P.; Candas, V. Assessment of thermal properties of protective clothing and their use. In Thermprotect: Final Technical Report 2006; EU-Project: Leicestershire, UK, 2016. [Google Scholar]
- Bröde, P.; Kuklane, K.; Candas, V.; den Hartog, E.A.; Griefahn, B.; Holmér, I.; Meinander, H.; Nocker, W.; Richards, M.; Havenith, G. Heat gain from thermal radiation through protective clothing with different insulation, reflectivity and vapour permeability. Int. J. Occup. Saf. Ergon. 2010, 16, 231–244. [Google Scholar] [CrossRef]
- Havenith, G.; Bröde, P.; den Hartog, E.; Kuklane, K.; Holmer, I.; Rossi, R.M.; Richards, M.; Farnworth, B.; Wang, X. Evaporative cooling: Effective latent heat of evaporation in relation to evaporation distance from the skin. J. Appl. Physiol. 2013, 114, 778–785. [Google Scholar] [CrossRef]
- PGS29. Richtlijn voor bovengrondse opslag van brandbare vloeistoffen in verticale cilindrische tanks. In Publicatiereeks Gevaarlijke Stoffen 29: Versie 1.1; Publicatiereeks Gevaarlijke Stoffen: Delft, The Netherlands, 2016. [Google Scholar]
- Meinster, J. Handreiking inzake maximaal toelaatbare niveaus van warmtestraling voor korte inzet (maximaal 5 minuten) van (bedrijfs)brandweerpersoneel en operators bij industriële bedrijven (Guidance on maximum permissible levels of heat radiation for short deployment (maximum 5 minutes) of (company) firefighters and operators at industrial companies), in Dutch. Land. Expertisecentrum Brandweer BRZO 2016, 5. [Google Scholar]
- Nawaz, N.; Troynikov, O. Firefighters’ protective jackets: Fit to female form and its effects on attributes relevant to thermal comfort. J. Occup. Environ. Hyg. 2018, 15, 792–802. [Google Scholar] [CrossRef]
- Yu, M.; Wang, Y.; Wang, Y.; Li, J. Correlation between clothing air gap space and fabric mechanical properties. J. Text. Inst. 2013, 104, 67–77. [Google Scholar] [CrossRef]
- Psikuta, A.; Frackiewicz-Kaczmarek, J.; Mert, E.; Bueno, M.A.; Rossi, R.M. Validation of a novel 3D scanning method for determination of the air gap in clothing. Measurement 2015, 67, 61–70. [Google Scholar] [CrossRef]
- EN ISO 11612:2015; Protective Clothing—Clothing to Protect against Heat and Flame—Minimum Performance Requirements. ISO: Geneva, Switzerland, 2015.
- Adolf, E.F. The initiation of sweating in response to heat. Am. J. Physiol. 1946, 145, 710–715. [Google Scholar] [CrossRef] [PubMed]
- ISO 7243:2017; Ergonomics of the Thermal Environment—Assessment of Heat Stress Using the WBGT (Wet Bulb Globe Temperature) Index. ISO: Geneva, Switzerland, 2017.
- Liljegren, J.C.; Carhart, R.A.; Lawday, P.; Tschopp, S.; Sharp, R. Modeling the wet bulb globe temperature using standard meteorological measurements. J. Occup. Environ. Hyg. 2008, 10, 654–655. [Google Scholar] [CrossRef]
- Borg, G. Psychophysical bases of perceived exertion. Med. Sci. Sports Exerc. 1982, 14, 377–381. [Google Scholar] [CrossRef] [PubMed]
- ISO 10551:2019; Ergonomics of the Physical Environment—Subjective Judgement Scales for Assessing Physical Environments. ISO: Geneva, Switzerland, 2019.
- Song, G.; Paskaluk, S.; Sati, R.; Crown, E.M.; Doug Dale, J.; Ackerman, M. Thermal protective performance of protective clothing used for low radiant heat protection. Text. Res. J. 2011, 81, 311–323. [Google Scholar] [CrossRef]
- Den Hartog, E.; Heus, R. Veilige stralingscontouren bij incidenten-gerelateerd aan warmtebelasting voor hulpverleners (Safe radiation contours at incident related to heat stress for first responders), in Dutch. In TNO-DV3 2006 C024; TNO Defensie en Veiligheid: Soesterberg, The Netherlands, 2006. [Google Scholar]
- Heus, R.; den Hartog, E. Maximum allowable exposure to different heat radiation levels in three types of heat protective clothing. Ind. Health 2017, 55, 529–536. [Google Scholar] [CrossRef]
- Van Mierlo, R.; Lemaire, A. Onderzoek veilige afstand geplande vreugdevuren Scheveningen en Duindorp 2016-2017 (A study to safe distances from planned bonfires in Scheveningen and Duindorp 2016–2017), in Dutch. In 2016-Efectis-R001439; Efectis Nederland: Bleiswijk, The Netherlands, 2016. [Google Scholar]
- Ye, H.; De, S. Thermal injury of skin and subcutaneous tissues: A review of experimental approaches and numerical models. Burns 2017, 43, 909–932. [Google Scholar] [CrossRef]
- Jussila, K.; Kekäläinen, M.; Simonen, L.; Mäkinen, H. Determining the optimum size combination of three-layered cold protective clothing in varying wind conditions and walking speeds: Thermal manikin and 3D body scanner study. J. Fashion Technol. Textile Eng. 2015, 3, 1–9. [Google Scholar] [CrossRef]
- Kuklane, K. Protection of feet in cold exposure. Ind. Health 2009, 47, 242–253. [Google Scholar] [CrossRef]
- Mandal, S.; Mazumder, N.-U.-S.; Agnew, R.J.; Song, G.; Li, R. Characterization and modeling of thermal protective and thermo-physiological comfort performance of polymeric textile materials—A review. Materials 2021, 14, 2397. [Google Scholar] [CrossRef] [PubMed]
- Veselá, S.; Psikuta, A.; Frijns, A.J.H. Local clothing thermal properties of typical office ensembles under realistic static and dynamic conditions. Int. J. Biometeorol. 2018, 62, 2215–2229. [Google Scholar] [CrossRef] [PubMed]
- Clark, J.A.; Cena, K. Net radiation and heat transfer through clothing: The effects of insulation and colour. Ergonomics 1978, 21, 691–696. [Google Scholar] [CrossRef]
- Davis, S.; Capjack, L.; Kerr, N.; Fedosejcvs, R. Clothing as protection from ultraviolet radiation: Which fabric is most effective? Int. J. Dermatol. 1997, 36, 374–379. [Google Scholar] [CrossRef] [PubMed]
- Jögård, H. Solenergitransmission i Textila Material (Transmission of Solar Energy in Textiles), in Swedish. Bachelor’s Thesis, Kandidatexamen vid Institutionen Textilhögskolan, Högskolan i Borås, Borås, Sweden, 2004:2:1, 2004. [Google Scholar]


| TP | Gender | Age (Years) | Height (cm) | Weight (kg) | BMI | Clothing Color |
|---|---|---|---|---|---|---|
| 1 | Female | 19 | 176.0 | 80.4 | 26.0 | Blue |
| 2 | Male | 58 | 186.0 | 99.3 | 28.7 | Blue |
| 3 | Male | 43 | 171.0 | 87.0 | 29.8 | Blue |
| 4 | Male | 58 | 176.0 | 85.8 | 27.7 | Blue |
| 5 | Male | 29 | 198.0 | 118.0 | 30.1 | Blue |
| 6 | Male | 38 | 178.5 | 103.8 | 32.6 | Red |
| 7 | Male | 50 | 179.6 | 83.0 | 25.7 | Blue |
| 8 | Male | 39 | 185.0 | 89.5 | 26.2 | Red |
| 9 | Male | 31 | 175.5 | 90.2 | 29.3 | Red |
| 10 | Male | 21 | 183.0 | 78.7 | 23.5 | Red |
| 11 | Male | 27 | 186.0 | 112.0 | 32.4 | Red |
| 12 | Male | 42 | 183.0 | 89.7 | 26.8 | Blue |
| Average | 38 ± 13 | 181.5 ± 7.1 | 93.1 ± 12.5 | 28.2 ± 2.7 |
| Thermal Sensation | Comfort Sensation | Pain Sensation | Perceived Exertion | ||||
|---|---|---|---|---|---|---|---|
| −4 | Very cold | 0 | Neutral | 0 | No pain | 6 | No exertion at all |
| −3 | Cold | 1 | Slightly uncomfortable | 1 | Slightly painful | 7 | Extremely light |
| −2 | Cool | 2 | Uncomfortable | 2 | Painful | 8 | |
| −1 | Slightly cool | 3 | Very uncomfortable | 3 | Very painful | 9 | Very light |
| 0 | Neither warm nor cold | 4 | Very, very uncomfortable | 4 | Very, very painful | 10 | |
| 1 | Slightly warm | 11 | Light | ||||
| 2 | Warm | 12 | |||||
| 3 | Hot | 13 | Somewhat hard | ||||
| 4 | Very hot | 14 | |||||
| 15 | Hard (heavy) | ||||||
| 16 | |||||||
| 17 | Very hard | ||||||
| 18 | |||||||
| 19 | Extremely hard | ||||||
| 20 | Maximal exertion | ||||||
| Time Limit (min) | 1.5 kW/m2 | 2 kW/m2 | 2.5 kW/m2 |
|---|---|---|---|
| 1 | 100 (12) | 100 (12) | 92 (11) |
| 3 | 92 (11) | 50 (6) | 33 (4) |
| 5 | 83 (10) | 17 (2) | 8 (1) |
| Skin Location | 1.5 kW/m2 | 2 kW/m2 | 2.5 kW/m2 |
|---|---|---|---|
| Chest | 0.0121 ± 0.0028 | 0.0158 ± 0.0073 | 0.0202 ± 0.0132 |
| Upper arm | 0.0236 ± 0.0101 | 0.0400 ± 0.0274 | 0.0463 ± 0.0360 |
| Abdomen | 0.0328 ± 0.0172 | 0.0531 ± 0.0338 | 0.0777 ± 0.0433 |
| Thigh | 0.0379 ± 0.0196 | 0.0655 ± 0.0366 | 0.0978 ± 0.0616 |
| Knee | 0.0313 ± 0.0133 | 0.0520 ± 0.0318 | 0.0808 ± 0.0513 |
| 1.5 kW/m2 | 2 kW/m2 | 2.5 kW/m2 | ||||
|---|---|---|---|---|---|---|
| Responses | Start | End | Start | End | Start | End |
| Thermal sensation | 0.0 ± 1.0 | 1.8 ± 0.7 | −0.1 ± 0.5 | 2.0 ± 0.7 | 0.0 ± 0.7 | 2.6 ± 0.8 |
| Comfort | 0.1 ± 0.3 | 1.9 ± 0.9 | 0.0 ± 0.0 | 2.2 ± 0.7 | 0.2 ± 0.4 | 2.6 ± 1.1 |
| Pain | 0.0 ± 0.0 | 0.5 ± 0.7 | 0.0 ± 0.0 | 0.6 ± 0.8 | 0.0 ± 0.0 | 1.1 ± 1.1 |
| RPE | 6.1 ± 0.3 | 10.0 ± 2.2 | 6.2 ± 0.4 | 9.8 ± 2.1 | 6.3 ± 0.7 | 10.7 ± 2.6 |
| TP | Chest | Upper Arm | Abdomen | Thigh | Overall | Jacket |
|---|---|---|---|---|---|---|
| 1 | 15.9 | 23.9 | 20.7 | 19.1 | 19.9 ± 3.3 | 20.2 ± 4.0 |
| 2 | 27.1 | 23.9 | 35.0 | 15.9 | 25.5 ± 7.9 | 28.6 ± 5.7 |
| 3 | 18.3 | 17.5 | 14.3 | 25.5 | 18.9 ± 4.7 | 16.7 ± 2.1 |
| 4 | 9.5 | 26.3 | 37.4 | 28.6 | 25.5 ± 11.6 | 24.4 ± 14.0 |
| 5 | 31.0 | 9.5 | 0.0 | 3.2 | 10.9 ± 14.0 | 13.5 ± 15.9 |
| 6 | 28.6 | 20.7 | 31.0 | 27.1 | 26.9 ± 4.4 | 26.8 ± 5.4 |
| 7 | 31.8 | 24.7 | 31.0 | 38.2 | 31.4 ± 5.5 | 29.2 ± 3.9 |
| 8 | 35.0 | 19.9 | 27.1 | 25.5 | 26.9 ± 6.2 | 27.3 ± 7.6 |
| 9 | 35.0 | 25.5 | 40.6 | 33.4 | 33.6 ± 6.2 | 33.7 ± 7.6 |
| 10 | 63.7 | 27.1 | 60.5 | 36.6 | 47.0 ± 17.9 | 50.4 ± 20.3 |
| 11 | 36.6 | 17.5 | 14.3 | 27.1 | 23.9 ± 10.1 | 22.8 ± 12.1 |
| 12 | 19.1 | 20.7 | 23.9 | 24.7 | 22.1 ± 2.6 | 21.2 ± 2.4 |
| Average | 29.3 ± 13.9 | 21.4 ± 5.0 | 28.0 ± 15.4 | 25.4 ± 9.5 | 26.0 ± 11.7 | 26.2 ± 12.4 |
| Groups Based on | 1.5 kW/m2 | 2 kW/m2 | 2.5 kW/m2 |
|---|---|---|---|
| A Chest | F(2,9) = 0.544, p = 0.599 ** | F(2,9) = 0.089, p = 0.916 | F(2,9) = 1.742, p = 0.229 |
| B Upper arm | F(2,9) = 2.749, p = 0.117 ** | F(2,9) = 0.929, p = 0.430 | F(2,9) = 1.156, p = 0.357 |
| C Abdomen | F(2,9) = 2.749, p = 0.117 ** | F(2,9) = 6.445, p = 0.018 * Posthoc: significant difference between tight fit and loose fit (p = 0.018) | F(2,9) = 0.260, p = 0.777 |
| D Thigh | F(2,9) = 0.544, p = 0.599 ** | F(2,9) = 0.513, p = 0.615 | F(2,9) = 1.153, p = 0.358 |
| E Jacket | F(2,9) = 0.544, p = 0.599 ** | F(2,9) = 1.671, p = 0.241 | F(2,9) = 0.539, p = 0.601 |
| F Whole suit | F(2,9) = 0.544, p = 0.599 ** | F(2,9) = 1.671, p = 0.241 | F(2,9) = 0.312, p = 0.739 |
| Radiation Intensity (kW/m2) | |||||||||
|---|---|---|---|---|---|---|---|---|---|
| Air Gap at | 1.5 | 2.0 | 2.5 | 1.5 | 2.0 | 2.5 | 1.5 | 2.0 | 2.5 |
| 1.5 | 2.0 | 2.5 | 1.5 | 2.0 | 2.5 | 1.5 | 2.0 | 2.5 | |
| Exposure Time | ∆Tskin/t: Mean Whole Body | ∆Tskin/t: Mean Upper Body | |||||||
| Chest | 0.692 | 0.601 | 0.365 | 0.928 | 0.948 | 0.612 | 0.664 | 0.682 | 0.321 |
| Upper arm | 0.002 * | 0.022 * | 0.181 | 0.001 * | 0.003 * | 0.043 * | 0.001 * | 0.005 * | 0.128 |
| Abdomen | 0.019 * | 0.010 * | 0.452 | 0.011 * | 0.011 * | 0.106 | 0.033 * | 0.042 * | 0.315 |
| Thigh/trousers | 0.034 * | 0.255 | 0.073 | 0.024 * | 0.126 | 0.148 | - | - | - |
| Mean jacket | 0.156 | 0.050 * | 0.847 | 0.091 | 0.094 | 0.363 | 0.189 | 0.214 | 0.756 |
| Mean whole suit | 0.087 | 0.058 | 0.549 | 0.048 * | 0.076 | 0.266 | 0.144 | 0.206 | 0.650 |
| ∆Tskin/t: mean lower body | ∆Tskin/t: chest | ∆Tskin/t: upper arm | |||||||
| Chest | - | - | - | 0.533 | 0.120 | 0.482 | - | - | - |
| Upper arm | - | - | - | - | - | - | 0.335 | 0.215 | 0.317 |
| Abdomen | - | - | - | - | - | - | - | - | - |
| Thigh/trousers | 0.013 * | 0.066 | 0.072 | - | - | - | - | - | - |
| Mean jacket | - | - | - | 0.085 | 0.010 * | 0.057 | 0.806 | 0.456 | 0.722 |
| Mean whole suit | 0.040 * | 0.043 * | 0.138 | 0.059 | 0.012 * | 0.083 | 0.933 | 0.555 | 0.783 |
| ∆Tskin/t: abdomen | ∆Tskin/t: thigh | ∆Tskin/t: knee | |||||||
| Chest | - | - | - | - | - | - | - | - | - |
| Upper arm | - | - | - | - | - | - | - | - | - |
| Abdomen | 0.011 * | 0.017 * | 0.162 | - | - | - | - | - | - |
| Thigh/trousers | - | - | - | 0.022 * | 0.117 | 0.136 | 0.009 * | 0.041 * | 0.053 |
| Mean jacket | 0.072 | 0.088 | 0.475 | - | - | - | - | - | - |
| Mean whole suit | 0.030 * | 0.059 | 0.331 | 0.036 * | 0.056 | 0.156 | 0.059 | 0.046 * | 0.172 |
Publisher’s Note: MDPI stays neutral with regard to jurisdictional claims in published maps and institutional affiliations. |
© 2022 by the authors. Licensee MDPI, Basel, Switzerland. This article is an open access article distributed under the terms and conditions of the Creative Commons Attribution (CC BY) license (https://creativecommons.org/licenses/by/4.0/).
Share and Cite
Heus, R.; Kingma, B.R.M.; van Berlo, B.M.A.; Mol, D.; Daanen, H.A.M.; Kuklane, K. The Protective Performance of Process Operators’ Protective Clothing and Exposure Limits under Low Thermal Radiation Conditions. Biology 2022, 11, 1222. https://doi.org/10.3390/biology11081222
Heus R, Kingma BRM, van Berlo BMA, Mol D, Daanen HAM, Kuklane K. The Protective Performance of Process Operators’ Protective Clothing and Exposure Limits under Low Thermal Radiation Conditions. Biology. 2022; 11(8):1222. https://doi.org/10.3390/biology11081222
Chicago/Turabian StyleHeus, Ronald, Boris R. M. Kingma, Birgit M. A. van Berlo, Douwe Mol, Hein A. M. Daanen, and Kalev Kuklane. 2022. "The Protective Performance of Process Operators’ Protective Clothing and Exposure Limits under Low Thermal Radiation Conditions" Biology 11, no. 8: 1222. https://doi.org/10.3390/biology11081222