Article

Long-Term Exposure to Ozone Increases Neurological Disability after Stroke: Findings from a Nationwide Longitudinal Study in China

1
Institute of Reproductive and Child Health/National Health Commission Key Laboratory of Reproductive Health and Department of Epidemiology and Biostatistics, School of Public Health, Peking University, Beijing 100191, China
2
School of Health Policy and Management, Chinese Academy of Medical Sciences & Peking Union Medical College, Beijing 100730, China
3
College of Environmental Sciences and Engineering, Peking University, Beijing 100871, China
4
State Key Joint Laboratory of Environmental Simulation and Pollution Control, School of Environment, Tsinghua University, Beijing 100084, China
5
The General Office of Stroke Prevention Project Committee, National Health Commission of the People’s Republic of China, Beijing 100053, China
*
Authors to whom correspondence should be addressed.
These authors contributed equally to this work.
Biology 2022, 11(8), 1216; https://doi.org/10.3390/biology11081216
Submission received: 1 June 2022 / Revised: 5 August 2022 / Accepted: 10 August 2022 / Published: 13 August 2022

Abstract

:

Simple Summary

In China, ozone is a major air pollutant that has been linked to stroke incidence and mortality. However, how long-term exposure to ozone affects the life quality among stroke survivors is unknown. This study presents a longitudinal analysis of nationwide data of Chinese adults, and shows that exposure to ozone can increase the risk of post-stroke disability. Taking ambient O3 under control can delay the progression of neurological disability among stroke survivors.

Abstract

Exposure to ozone (O3) is associated with stroke incidence and mortality. However, whether long-term exposure to O3 is associated with post-stroke neurological disability remains unknown. This study investigated the relationship based on the longitudinal analysis of China National Stroke Screening Survey (CNSSS), which included 65,778 records of stroke patients. All of the analyzed patients were followed-up at least twice. Stroke disability was assessed using the modified Rankin scale (mRS). Long-term exposure was assessed by the peak-season or annual mean of maximum 8-h O3 concentrations for 365 days before the mRS measurement. We used fixed-effect models to evaluate the associations between O3 and mRS score, with adjustment for multiple confounders, and found a 10 µg/m3 increase in peak-season O3 concentration was associated with a 0.0186 (95% confidence interval [CI] 0.0115–0.0256) increment in the mRS score. The association was robust in various subpopulations. For secondary outcomes, for each 10 µg/m3 increment in peak-season O3, the odds ratio of an increased mRS score (vs. unchanged or decreased mRS score) increased by 23% (95% CI 9–37%). A nonlinear analysis showed a sublinear association between O3 exposure and risk for post-stroke disability. A saturation effect was observed at an O3 concentration of more than ~120 μg/m3. Our study adds to evidence that long-term exposure to O3 increases the risk of neurological disability after stroke.

1. Introduction

Stroke is recognized as one of the biggest causes of disability worldwide, yet its neurological burden has been well under-recognized as it was classified as a cardiovascular disease before the release of latest revision of the WHO International Classification of Disease (ICD-11) [1]. It is of significant public health interest to identify the risk factors for stroke-related disability. Among the modifiable risk factors, air pollution is the third leading contributor to the global stroke burden, accounting for 29.2% of the full burden [2]. Stroke accounts for an estimated 113 million disability-adjusted life-years (DALYs), which integrates healthy life years lost due to both premature mortality and living with disability [3]. It is estimated that stroke accounts for 2.07% (95% CI, 1.6–2.52%) of total years lived with disability (YLDs) and 5.65% of total DALYs (95% CI, 5.14–6.17%) according to the Global Burden of Disease (GBD) study in 2019 [4]. However, studies on risk factors have focused on their effects on the incidence or the years of life loss (YLLs) due to stroke, ignoring YLDs.
Increased concentrations of air pollution are strongly associated with risk for stroke [5,6,7]. Exposure to ozone (O3), a major air pollutant, also contributes to the risk for many neurological diseases, such as stroke, Parkinson’s disease, dementia, and multiple sclerosis [5,8]. A meta-analysis showed a weak association between short-term O3 and admission to hospital for stroke or mortality from stroke, with a pooled relative risk of 1.001 (95% CI, 1.000–1.002) per 10 ppb [9]. Although those studies were conducted in different regions, most evaluated the effects of short-term exposure to O3 on stroke. Studies investigating the relationship between short-term O3 exposure and stroke may have some inherited shortcomings. Ground-surface O3 is produced by photochemical chemical reactions between primary air pollutants (e.g., nitrogen dioxide and volatile organic compounds), and thus its short-term variations are affected by climate conditions, such as temperature. Therefore, climate variables, which directly affect human health in a complex nonlinear pattern, can be confounders for the short-term effects of O3. Long-term exposure to O3 is less affected by short-term fluctuations in climate, and its health effects can be stable. However, the relevant epidemiological evidence is sparse. The World Health Organization released the revised Global Air Quality Guidelines, which provide a recommended long-term, peak-season (i.e., maximum of 6-month moving averages) O3 level of <60 µg/m3 based on all non-accidental mortality and respiratory mortality studies [10], suggesting that the effects of O3 have been underestimated before. It is of public health importance to evaluate the long-term effect of O3, particularly in an aging society.
Compared with its incidence and mortality, disability caused by stroke and long-term prognosis of stroke, which may affect the quality of life, have been investigated less intensively. A cross-sectional study conducted in Texas from 2000 to 2012 reported that each 10 μg/m3 increment in daily exposure to O3 was significantly associated with a 0.29 (95% CI 0.06–0.51) increment of initial stroke severity (assessed by NIH Stroke Scale, NIHSS) [11]. A longitudinal study involving older Chinese adults found that each 10 μg/m3 increase in annual mean O3 exposure was associated with a 10.4% increased risk for cognitive impairment, as assessed by the Mini-Mental State Examination [12]. A California study showed that increment in O3 was negatively associated with verbal fluency and executive function [13]. Studies in China on the association between O3 and neurological disability after stroke have been challenging for two reasons: First, there are few studies that contain quantitative assessment of neurological function after stroke. Second, regulatory measurements of O3 have been based on monitoring stations and were not available for the full coverage of O3, hampering the assessment of population-level long-term exposure. The Modified Rankin Scale (mRS) assesses disability in patients who have suffered a stroke and is compared over time to check for recovery and degree of continued disability or dependence in daily activities. Compared with other stroke scales, mRS is easy to operate, can be scored by simple inquiry, and has good reliability and authenticity [14]. In this study, we used a fixed-effect model to evaluate the association between O3 and mRS score based on a national stroke survey in China. Our analysis included 65,778 records of stroke patients. The participants were followed up at least twice with valid mRS measurements. The potential effects of modifiers of the relationship between O3 and mRS score were also examined.

2. Methods

2.1. Exposure Assessment

We obtained the 10 × 10 km maximum daily 8-h averaged O3 concentrations in China from 1 January 2013 to 31 December 2019, from the Tracking Air Pollution in China Database (TAP; http://www.tapdata.org.cn; accessed on 9 June 2021). This database uses a data-fusion algorithm for O3 estimation that combines in situ observations, satellite remote-sensing measurements, and results from the community multiscale air quality model. Details of the database and the accuracy of the model can be found elsewhere [4]. By linking the community address (longitude and latitude) of each participant derived from the China National Stroke Screening Survey (CNSSS) to the nearest O3 grid, we matched each participant to the 10 × 10 km grid. We calculated the peak-season or the annual mean concentration during the year preceding the measurement of the mRS as long-term exposure to O3. Therefore, this study only included the mRS records measured from 1 January 2014, due to the limited availability of the exposure data. We also calculated O3 exposure using different time windows to test whether the exposure time window affected the estimated effect of O3.

2.2. Population Selection

The study population was obtained from CNSSS, an ongoing community-based stroke surveillance program in mainland China that started in 2013 [15]. The design, methods, and participants of the CNSSS program are available elsewhere [15,16,17]. Briefly, a two-stage stratified cluster sampling method was adopted for each screening. The participants were interviewed using a standardized face-to-face questionnaire to collect information on their demographic characteristics, socioeconomic status, stroke history, and risk factors for stroke by neurologists or physicians from community hospitals. The data can be obtained from the Bigdata Observatory Platform for Stroke of China (BOSC; https://www.chinasdc.cn/; accessed on 10 June 2021) [18]. Because the prevalence of stroke is relatively low among younger adults [19], CNSSS only screens residents aged 40 years and older in each community. The inclusion criteria were patients diagnosed with stroke, stroke onset preceding the mRS measurement, and at least two mRS measurements [20]. We did not exclude the patients with stroke recurrences. Recurred stroke might be a pathway to explain why O3 increased the mRS score among the survivors, and air pollution has been evidenced to be a risk factor of stroke incidences and recurrences. Therefore, the patients with a history of recurrent stroke might be more susceptible to air pollution. Excluding them could lead to an underestimated association. Additionally, the recurrent stroke patients might have a high probability of death, and thus tended to be ignored by our study. We introduced a method of inverse-probability weights to adjust for the missingness, as mentioned in the statistical analyses section.

2.3. Outcome

The primary outcome was the change in mRS score. The mRS score (range 0–6) was used to measure the degree of disability or dependence in daily activities of patients with stroke: the higher the score, the greater the disability. A score of 0 means no symptoms; 1 indicates no significant disability despite symptoms; and scores of 2–4 mean slight, moderate, moderately severe, and severe disability, respectively. A score of 6 indicates death and thus didn’t appear in our surveys on stroke survivors. The secondary outcome was the change in mRS score transformed into a dichotomous variable using cut-off values of >0, >1, >2, >3, >4, or >5.

2.4. Covariates

Personal information of the participants was collected by questionnaires. Participants’ demographic characteristics were documented, including age (≤45, 46–55, 56–65, 66–75, 76–85, of >86 years), sex (male or female), and region (southwest, south, northwest, northeast, north, east, or central China). Data on lifestyle-related factors were collected, including smoking status (yes or no), alcohol consumption (yes or no), exercise (yes or no; no enough exercise: frequency <3 times/week and <30 min/time or less), BMI (underweight, <18.5; normal, 18.5–24; overweight, 24–28; obese, >28), and drinking milk (yes or no; no enough milk intake: drinking <200 mL/day milk and <5 days/week or less) [21,22]. As both O3 concentration and status of neurological health can be seasonally varied, an indicator of season was also created based on the date of mRS measurement. In addition, a history of hypertension (yes or no), diabetes (yes or no), lipid disorders (yes or no), and atrial fibrillation (yes or no), as well as years after stroke (<1, 1, 2, 3, 4, 5–10, 10–20, or >20 years), were included as confounding factors. We used multiple imputation for the missing covariate values.

2.5. Statistical Analyses

Linear fixed-effect models were used to examine the associations between the change in mRS score and the ambient exposure to O3 with participant-specific intercepts. In the main analysis, we used the peak-season or the annual mean of O3 during the year preceding the mRS measurement (defined as the lag-1 year exposure) to assess the association. The linear fixed-effect models can be specified as follows:
mRSi,j~β1O3,i,j + β2xi,j + η(i),
where i and j denote the indexes for subject and visit, respectively; mRSi,j denotes the diagnosed score of ith subject at the jth visit; xi, denotes the adjusted covariates; η(i) denotes the fixed-effect term to characterize the participant-specific baseline risk of neurological disability; and βs denote the regression coefficients. The association was quantified as the change in mRS score for each 10 μg/m3 increment in O3. We also modeled dichotomous variables (as described above) as the secondary outcomes, using fixed-effect logistic regressions. We also created an additional dichotomous outcome to indicate mRS change (1: increased mRS; 0: unchanged or decreased mRS). We calculated the odds ratio (OR) to assess the association between the binary indicator of stroke disability and O3 concentrations.
The basic model (Model 1) only included O3 exposure and the progress in mRS score with time as the only covariate, and the term was parametrized as the interaction term between the temporal index and baseline age or years after stroke. We also conducted several sensitivity analyses to evaluate the robustness of the model estimates. First, we conducted four additional models, which sequentially included a series of covariates. On the basis of Model 1, Model 2 additionally included season; Model 3 encompassed several lifestyle-related covariates (i.e., smoking, drinking, exercise, BMI, and drinking milk); Model 4 included annual average PM2.5 as an additional covariate; and Model 5 further adjusted for hypertension, diabetes, and lipid disorders. Model 5 was considered as the full model. Because the subjects might not be randomly distributed among baseline mRS levels (a higher baseline mRS score might be associated with an increased risk for death, which makes follow-up less likely), the inverse probability weight (IPW) method was used to obtain representative estimates. Second, we explored the variation in the association between O3 and mRS score by stratifying the patients by region, age, years after stroke, sex, hypertension, diabetes, dyslipidemia, atrial fibrillation, drinking, smoking, physical inactivity, and BMI. Third, we evaluated the cumulative effect of different time windows of O3 exposure (lag of 1, 2, or 3 years) on the mRS score. A nonlinear model was applied to analyze the exposure–response association between O3 concentration and mRS score using smooth spline functions.
Statistical analysis was performed using R (version 3.5.1; R Core Team; Vienna, Austria). Coefficient and odds ratio (OR) estimates with 95% confidence intervals were reported, and p-values < 0.05 were considered indicative of statistical significance.

3. Results

3.1. Study Sample

In total, 28,056 individuals (65,778 visits) were followed up. At baseline, the median O3 peak-season concentration was 107.50 μg/m3 (25th to 75th percentile, 93.70–123.27 μg/m3), and the O3 annual mean concentration was 82.75 μg/m3 (25th to 75th percentile, 75.03–90.49 μg/m3). The distributions of O3 concentration for different time windows are shown in Supplemental Table S1a,b. Table 1 shows the baseline characteristics of the participants by peak-season O3 concentration quartile. Disease characteristics varied according to the O3 concentration. Despite using different measurements of exposure to O3, Table S2 shows the semblable characteristics. Supplementary Figure S1 shows the surveyed locations in seven Chinese geographical zones; the sample covered most provincial administrative regions in mainland China, except for Tibet.

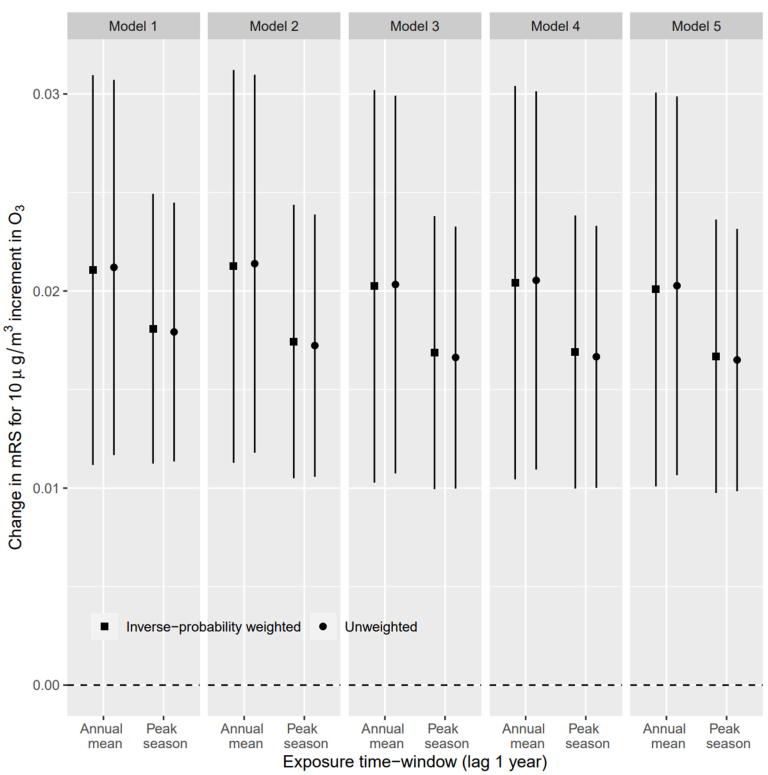
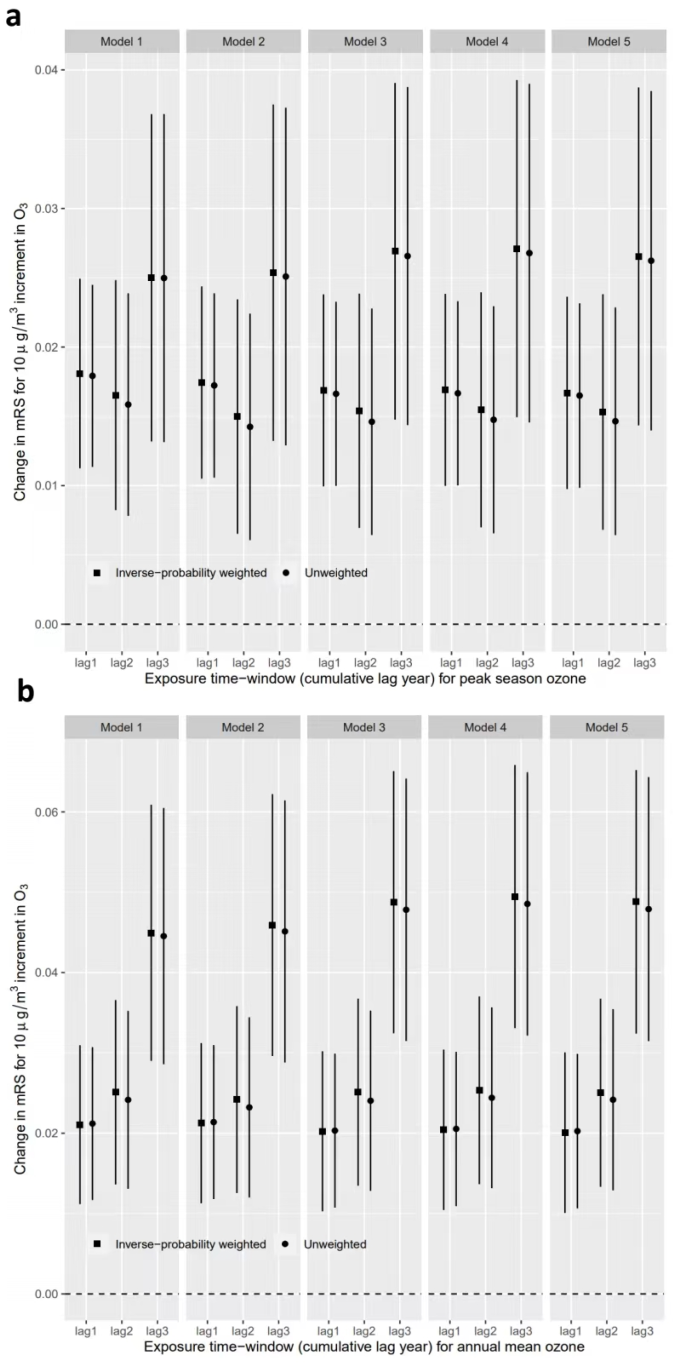
3.2. Association between O3 Exposure and mRS Score

As shown in Figure 1, the effect of peak-season O3 was slightly weaker than that of the annual mean O3 in each model. Each 10 µg/m3 increment of annual average O3 exposure increased the mRS score by 0.020 points (95% CI, 0.010–0.030) in the fully adjusted model. The effect was estimated to be 0.017 (95% CI, 0.010–0.024) in terms of peak-season O3. The result was robust when adjusting for different covariates. For the secondary outcomes, there was a significant association between O3 exposure and an increase in mRS score. For each 10 µg/m3 increment in peak-season and annual mean O3 exposure, the OR of an increased mRS score (vs. unchanged or decreased mRS score) for peak-season and annual mean O3 was 1.23 (95% CI, 1.09–1.37) and 1.28 (95% CI, 1.09–1.52), respectively, in the fully adjusted model (Supplemental Figure S2). However, there was no significant effect on individuals with high levels of baseline mRS score (mRS > 2 points). In the sensitivity analyses, effect estimates of air pollutants back-extrapolated to the year of baseline examination were similar to or slightly higher than the main results (Figure 2).

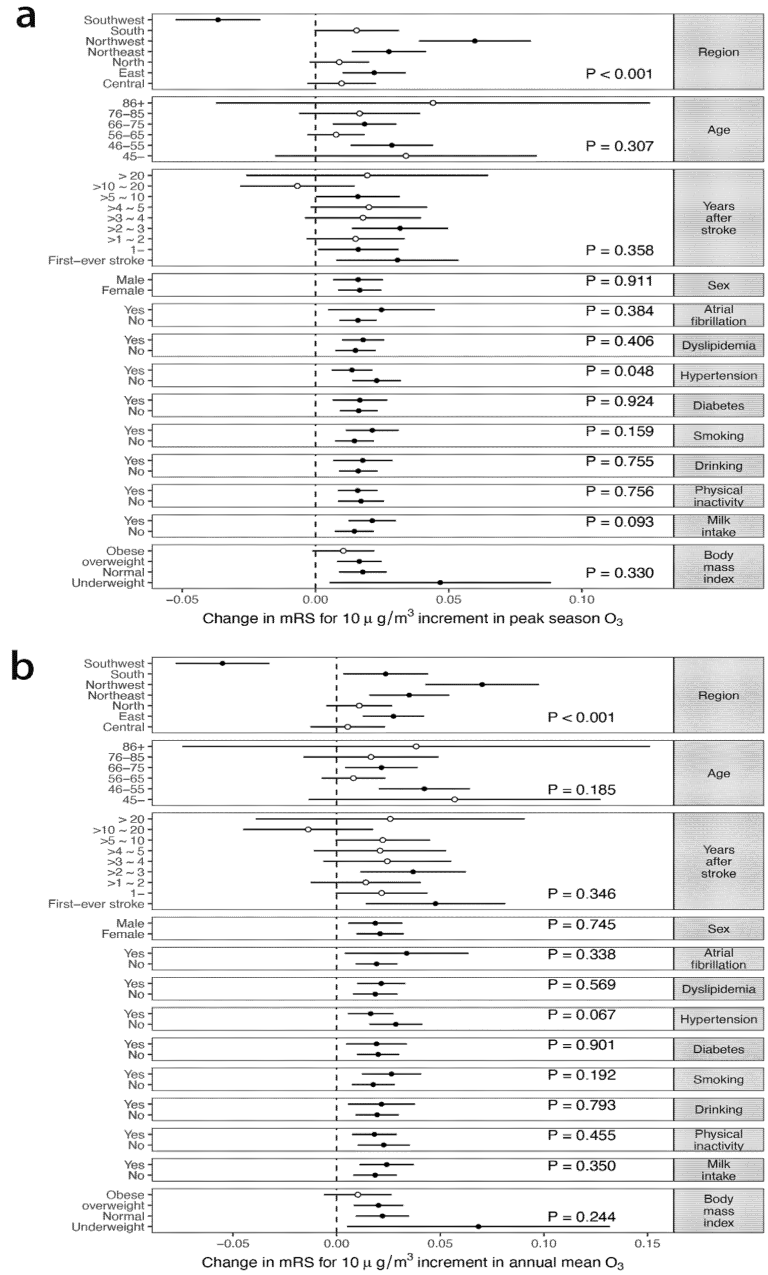
3.3. Effect Modification

To identify the populations particularly susceptible to O3 exposure, we investigated the potential effect modifications of baseline characteristics (Figure 3). There was no change in effect stratified by age, years after stroke, sex, hypertension, diabetes, dyslipidemia, atrial fibrillation, drinking, smoking, physical inactivity, or BMI. The results showed significantly positive associations in northwest, northeast, and east China, with estimated effects of 0.060 (95% CI 0.039–0.081), 0.028 (95% CI 0.014–0.041), and 0.022 (95% CI 0.010–0.034), respectively, but not for southwest China (−0.037; 95%CI −0.053–−0.021). The difference across regions was statistically significant (p < 0.001). The relatively small sample size in southwest China (n = 4221, compared with n = 14,891 in north China) is likely the underlying reason; other possibilities are geographical differences in climate, lifestyle, residential habit of heating, and baseline health status. For instance, southwest had a high prevalence of stroke [15], which suggests a poor baseline level of cerebrovascular health. Therefore, among the vulnerable stroke patients, exposure to air pollution may lead to a fatal outcome rather than neurological disability. Further studies are warranted to confirm the modification effect and to examine the biological mechanisms of the geographical difference in the effect of O3 on disability after stroke.

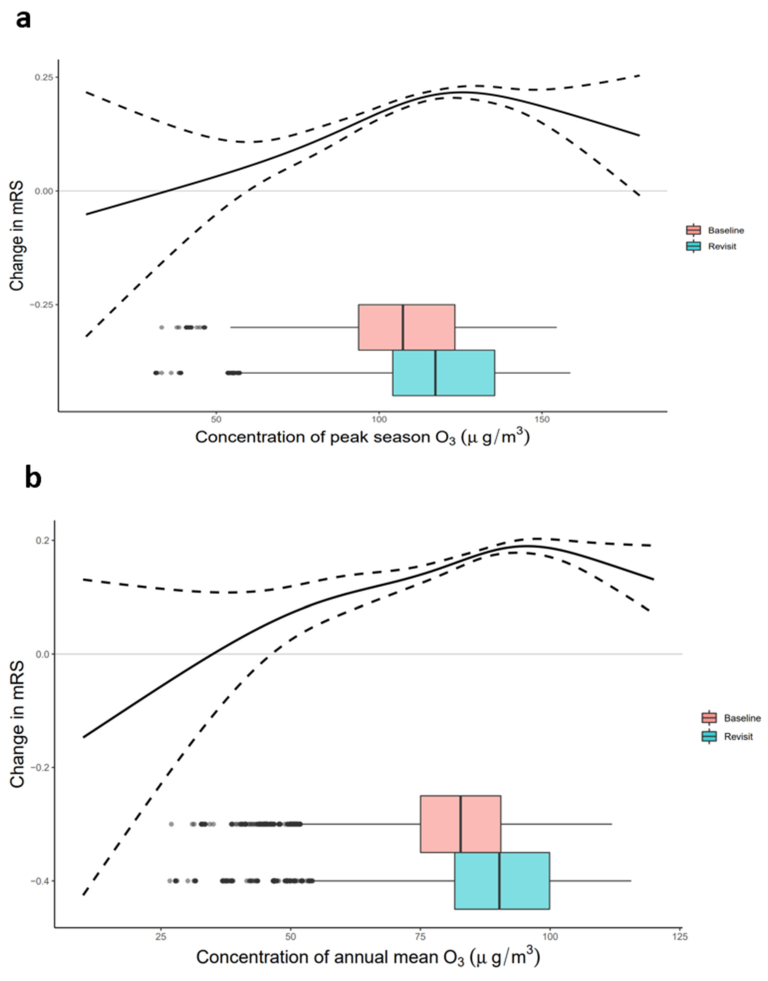
3.4. Exposure−Response Relationship

When using splines for the annual mean O3 term in the nonlinear model, the exposure–response curve was similar to the curve using peak-season O3 exposure (Figure 4). The directions of the overall effects estimated by the nonlinear models were consistent with the linear results. The effect was almost linear at concentrations of ≤100 µg/m3 for peak-season O3. The estimated curvatures showed a saturated effect of O3 on post-stroke disability at high concentrations.

4. Discussion

China bears the highest burden of stroke globally [23]. However, few studies have evaluated the influence of the outdoor environment on stroke prognosis [24]. To the best of our knowledge, this is the only national longitudinal study to date to investigate the influence of O3 exposure on mRS score in China. We found that long-term exposure to O3 was associated with an elevated risk of neurological disability after controlling for potential confounders. Each 10 µg/m3 increment in peak-season O3 was associated with a 0.017 (95% CI 0.010–0.024) increment in the mRS score. The estimate was robust in various subpopulations. The exposure–response curve showed a sublinear function between the increased risk for post-stroke disability and an increased O3 concentration.
The risks of stroke mortality and hospital admission are associated with acute effects of O3 in China. A meta-analysis showed a weak association between short-term O3 and admission to hospital for stroke or mortality from stroke (relative risk, 1.001; 95% CI 1.000–1.002) per 10 ppb [9]. Previous reports on long-term O3 exposure and incidence of stroke are inconsistent. A study in the southeast United States revealed that the annual mean O3 was associated with an increased risk of stroke mortality with a hazard ratio (HR) of 1.012 (95% CI 1.012–1.013) [5]. Zhao et al. [8] reported an HR of 1.08 (95% CI 1.06–1.10) for each interquartile range increase in O3 (10.1 ppb) in a Canadian cohort. However, another study reported that warm-season O3 was not associated with an increase in the incidence of stroke (HR 0.96; 95% CI 0.91–1.01) [25]. The possible reasons for the discrepancy include the different study designs, exposure concentrations, and populations. Few studies have reported an association between exposure to O3 and an increased risk for disability. A cross-sectional study conducted in Texas from 2000 to 2012 reported that each 10 μg/m3 increment in daily exposure to O3 was significantly associated with a 0.29 (95% CI 0.06–0.51) increment of initial stroke severity (NIHSS).
Our results indicated that the effect of peak-season O3 was more concise than that of annual mean O3 with a narrower confidence interval. In some studies, O3 concentrations were calculated for the “peak” or warm season, whereas others used the annual average or median as an exposure indicator. The WHO has updated the Air Quality Guidelines to provide guidance on the health risks of O3. According to a meta-analysis concerning the long-term effect of O3 on mortality, the pooled OR from studies using annual mean metrics showed estimated effects for all-cause and respiratory mortality of 0.97 (95% CI 0.93–1.02) and 0.99 (95% CI 0.89–1.11) for each 10 μg/m3 increment of O3, respectively. In studies using peak-season O3 metrics, the pooled OR was estimated to be 1.01 (95% CI 1.00–1.02) for all-cause mortality and 1.02 (95% CI 0.99–1.05) for respiratory mortality. Although the meta-analysis identified high levels of heterogeneity, the error of the estimated effects measured using peak-season O3 was lower than annual mean O3, which is consistent with our findings. Therefore, peak-season mean may be useful for assessing the health effect of long-term O3 exposure.
Although the biological mechanisms underlying the adverse effects of O3 on the central nervous system remain unclear, some studies have implicated a few plausible pathways, including inflammation and oxidative stress. First, as an oxidizer, O3 can activate respiratory inflammatory responses directly, and cause systemic inflammations after entering the bloodstream [26,27]. Second, exposure to O3 can also induce endothelial dysfunction and increase the risk of thrombosis [28,29]. Third, because of oxidative stress, O3 exposure can introduce the formation of free radicals in cells and tissues, which furthers DNA damage and lipid peroxidation [30,31]. Finally, O3 has been found to change the permeability of the blood–brain barrier (BBB) and even to cause dysfunctions, which may further lead to persistent damage in the central nervous system [31,32].
This study had several limitations. First, in terms of exposure matching, O3 concentrations were estimated at a resolution of 10 km × 10 km. The geographic addresses were confined to the community-hospital level for confidentiality, possibly leading to exposure misclassification due to measurement error. Moreover, because stroke survivors spend more time indoors and we could not take into account indoor O3 concentration due to the inaccessibility of data, further research with a portable individual-level O3 exposure testing instrument is expected to validate our results. Second, except for PM2.5, we could not estimate the potential confounding or interactive effects of other ambient air pollutants such as NO2 and black carbon, which might be correlated with O3. After adjusting for PM2.5 as a covariate, the effect remained robust. Therefore, we assumed that the effect of O3 was independent of PM2.5. Third, the individual-level information was self-reporting, possibly introducing recall bias. Moreover, unmeasured confounders (e.g., medication history) might bias the results in an unknown direction. Fourth, the unbalanced age structure of participants (≥40 years) and sampled counties (more concentrated in the eastern part of the country) make this study less representative of the whole population. The participants that were excluded due to having no follow-up measurements might also lead to selection bias. In addition, people with a higher baseline mRS score may have a higher risk for death and thus be less likely to be followed up. In the sensitivity analysis, the results obtained with and without weighting were similar, demonstrating the robustness of the findings. Fifth, the mRS score might be influenced by stroke severity and recurrence, and the precise times of stroke or transient ischemic attack (also known as mini stroke) are unknown, which might have biased the results. However, we stratified the studied population by years after stroke in the sensitivity analysis, but did not find a significant difference between the subpopulation-specific associations. The results of the sensitivity analysis indicated that the history of stroke did not considerably affect our results.

5. Conclusions

Long-term exposure to O3 was associated with a higher risk for post-stroke neurological disability among middle-aged and elderly Chinese people. Taking ambient O3 under control might delay the progression of neurological disability among the aging population. Our findings point to the urgent necessity for implementing stringent clean air policies to reduce ambient O3 pollution, which might bring great public health benefits in an aging society.

Supplementary Materials

The following are available online at https://www.mdpi.com/article/10.3390/biology11081216/s1, Table S1. (a) Distribution of different quantiles of O3 peak season concentration for lag 1, 2, 3 year (μg/m3); (b) Distribution of different quantiles of O3 annual mean concentration for lag 1, 2, 3 year (μg/m3). Table S2. Descriptive characteristics of study participants at baseline by annual averaged O3 concentration quartile. Figure S1. Locations of surveyed counties of CNSSS from 2014 to 2019. (+) represents the locations of the surveyed counties. Figure S2. Associations of O3 exposure with different categorical mRS score outcomes for per 10 μg/m3 increment of O3. a: Peak season O3. b: Annual mean O3. Model 1 was only adjusted for the interaction of follow-up period with age at baseline, and the interaction of follow-up period with years after stroke at baseline. Model 2 was additionally adjusted for season. Model 3 was additionally adjusted for smoking, drinking, physical activity, milk intake, and body mass index. Model 4 was additionally adjusted for PM2.5. Model 5 was additionally adjusted for hypertension, diabetes, dyslipidemia and atrial fibrillation. mRS, modified Rankin Scale.

Author Contributions

Conceptualization, T.G. and T.X.; methodology, T.X., and H.L. (Hong Lu); validation, M.C., M.T., R.W., X.Y. and H.L. (Hengyi Liu); formal analysis, H.L. (Hong Lu) and J.L.; resources, B.C. and Y.L.; data curation, T.G., T.X., M.C. and Q.X.; writing—original draft preparation, H.L. (Hong Lu) and J.L.; writing—review and editing, all authors; supervision, T.G. and T.X.; funding acquisition, Y.L., T.G. and T.X. All authors have read and agreed to the published version of the manuscript.

Funding

This study was funded by the National Natural Science Foundation of China (no. 42175182, 71532014, 91846303), PKU-Baidu Fund (2020BD031), Energy Foundation (G-2107-33169, R-2109-33379), the Fundamental Research Funds for the Central Universities (BMU2021YJ042), and CAMS Innovation Fund for Medical Sciences (2017-I2M-1-004).

Institutional Review Board Statement

The study was conducted in accordance with the Declaration of Helsinki, and approved by the Ethics Committee of XUANWU HOSPITAL, CAPITAL MEDICAL UNIVERSITY (protocol code: NO.2015024 and date of approval: 8 October 2015).

Informed Consent Statement

Informed consent was obtained from each participant. The Ethics Committee of Xuanwu Hospital, Capital Medical University (Beijing, China) approved the study.

Data Availability Statement

Additional data are not available, because only authorized researchers can assess the database.

Acknowledgments

We are grateful to the study participants, project staff, and the China Stroke Data Center members for collecting and sharing the data used in this study.

Conflicts of Interest

The authors declare no conflict of interests.

References

  1. Shakir, R. The struggle for stroke reclassification. Nat. Rev. Neurol. 2018, 14, 447–448. [Google Scholar] [CrossRef] [PubMed]
  2. Wang, H.; Naghavi, M.; Allen, C.; Barber, R.M.; Bhutta, Z.A.; Carter, A.; Bell, M.L. Global, regional, and national life expectancy, all-cause mortality, and cause-specific mortality for 249 causes of death, 1980–2015: A systematic analysis for the Global Burden of Disease Study 2015. Lancet 2016, 388, 1459–1544. [Google Scholar] [CrossRef]
  3. Feigin, V.L.; Krishnamurthi, R.V.; Parmar, P.; Norrving, B.; Mensah, G.A.; Bennett, D.A.; Barker-Collo, S.; Moran, A.E.; Sacco, R.L.; Truelsen, T. Update on the Global Burden of Ischemic and Hemorrhagic Stroke in 1990-2013: The GBD 2013 Study. Neuroepidemiology 2015, 45, 161–176. [Google Scholar] [CrossRef] [PubMed]
  4. Xue, T.; Zheng, Y.; Geng, G.; Xiao, Q.; Meng, X.; Wang, M.; Li, X.; Wu, N.; Zhang, Q.; Zhu, T. Estimating Spatiotemporal Varia-tion in Ambient Ozone Exposure during 2013-2017 Using a Data-Fusion Model. Environ. Sci. Technol. 2020, 54, 14877–14888. [Google Scholar] [CrossRef] [PubMed]
  5. Danesh Yazdi, M.; Wang, Y.; Di, Q.; Zanobetti, A.; Schwartz, J. Long-term exposure to PM2.5 and ozone and hospital admissions of Medicare participants in the Southeast USA. Environ. Int. 2019, 130, 104879. [Google Scholar] [CrossRef]
  6. Luo, Y.; Guo, Y.; Tao, L.; Xu, Q.; Wang, C.; Wang, A.; Li, X.; Guo, J.; Yan, A. Particulate Matter and Hospital Admissions for Stroke in Beijing, China: Modification Effects by Ambient Temperature. J. Am. Heart Assoc. 2016, 5, e003437. [Google Scholar] [CrossRef]
  7. McClure, L.A.; Loop, M.S.; Crosson, W.; Kleindorfer, D.; Kissela, B.; Al-Hamdan, M. Fine Particulate Matter (PM(2.5)) and the Risk of Stroke in the REGARDS Cohort. J. Stroke Cerebrovasc. Dis. 2017, 26, 1739–1744. [Google Scholar] [CrossRef]
  8. Zhao, N.; Pinault, L.; Toyib, O.; Vanos, J.; Tjepkema, M.; Cakmak, S. Long-term ozone exposure and mortality from neurological diseases in Canada. Environ. Int. 2021, 157, 106817. [Google Scholar] [CrossRef]
  9. Shah, A.S.V.; Lee, K.K.; McAllister, D.; Hunter, A.; Nair, H.; Whiteley, W.; Langrish, J.P.; Newby, D.E.; Mills, N. Short term exposure to air pollution a.and stroke: Systematic review and meta-analysis. BMJ 2015, 350, h1295. [Google Scholar] [CrossRef]
  10. World Health Organization. WHO Global Air Quality Guidelines: Particulate Matter (PM2.5 and PM10), Ozone, Nitrogen Dioxide, Sulfur Dioxide and Carbon Monoxide. World Health Organization. 2021. Available online: https://apps.who.int/iris/handle/10665/345329 (accessed on 31 May 2022).
  11. Wing, J.J.; Sánchez, B.N.; Adar, S.D.; Meurer, W.J.; Morgenstern, L.B.; Smith, M.A.; Lisabeth, L.D. Synergism of Short-Term Air Pollution Exposures and Neighborhood Disadvantage on Initial Stroke Severity. Stroke 2017, 48, 3126–3129. [Google Scholar] [CrossRef]
  12. Gao, Q.; Zang, E.; Bi, J.; Dubrow, R.; Lowe, S.R.; Chen, H.; Zeng, Y.; Shi, L.; Chen, K. Long-term ozone exposure and cognitive impairment among Chinese older adults: A cohort study. Environ. Int. 2022, 160, 107072. [Google Scholar] [CrossRef] [PubMed]
  13. Ilango, S.D.; Gonzalez, K.; Gallo, L.; Allison, M.A.; Cai, J.; Isasi, C.R.; Hosgood, D.H.; Vasquez, P.M.; Zeng, D.; Mortamais, M.; et al. Long-Term Exposure to Ambient Air Pollution and Cognitive Function Among Hispanic/Latino Adults in San Diego, California. J. Alzheimer Dis. 2021, 79, 1489–1496. [Google Scholar] [CrossRef] [PubMed]
  14. Broderick, J.P.; Adeoye, O.; Elm, J. Evolution of the Modified Rankin Scale and Its Use in Future Stroke Trials. Stroke 2017, 48, 2007–2012. [Google Scholar] [CrossRef] [PubMed]
  15. Guan, T.; Ma, J.; Li, M.; Xue, T.; Lan, Z.; Guo, J.; Shen, Y.; Chao, B.; Tian, G.; Zhang, Q.; et al. Rapid transitions in the epidemiology of stroke and its risk factors in China from 2002 to 2013. Neurology 2017, 89, 53–61. [Google Scholar] [CrossRef] [PubMed]
  16. Li, J.L.; Wang, L.D.; Chao, B.H.; Liu, Y.L. Prevalence of stroke in China: An epidemiological study based on the National Stroke Screening Survey. Lancet 2015, 386, 49. [Google Scholar] [CrossRef]
  17. Qi, W.; Ma, J.; Guan, T.; Zhao, D.; Abu-Hanna, A.; Schut, M.; Chao, B.; Wang, L.; Liu, Y. Risk Factors for Incident Stroke and Its Subtypes in China: A Prospective Study. J. Am. Heart Assoc. 2020, 9, e016352. [Google Scholar] [CrossRef]
  18. Chao, B.H.; Tu, W.J.; Wang, L.D. Initial establishment of a stroke management model in China: 10 years (2011–2020) of Stroke Prevention Project Committee, National Health Commission. Chin. Med. J. 2021, 134, 2418–2420. [Google Scholar] [CrossRef]
  19. Yi, X.; Luo, H.; Zhou, J.; Yu, M.; Chen, X.; Tan, L.; Wei, W.; Li, J. Prevalence of stroke and stroke related risk factors: A population based cross sectional survey in southwestern China. BMC Neurol. 2020, 20, 5. [Google Scholar] [CrossRef]
  20. Longde, W.; Ling, Y.; Yang, H.; Yi, Z.; Yong, W.; Xun, J.; Xiao, N.; Qiu, Q.; Li, H.; Yu, X.; et al. Fixed-dose combination treatment after stroke for secondary prevention in China: A national community-based study. Stroke 2015, 46, 1295–1300. [Google Scholar] [CrossRef]
  21. Mpandzou, G.; Aït Ben Haddou, E.; Regragui, W.; Benomar, A.; Yahyaoui, M. Vitamin D deficiency and its role in neurological conditions: A review. Rev. Neurol. 2016, 172, 109–122. [Google Scholar] [CrossRef]
  22. Kerac, M.; Postels, D.; Mallewa, M.; Jalloh, A.A.; Voskuijl, W.; Groce, N.; Gladstone, M.; Molyneux, E. The interaction of malnutrition and neurologic disability in Africa. Semin. Pediatric Neurol. 2014, 21, 42–49. [Google Scholar] [CrossRef] [PubMed]
  23. Wang, W.; Jiang, B.; Sun, H.; Ru, X.; Sun, D.; Wang, L.; Wang, L.; Jiang, Y.; Li, Y.; Wang, Y.; et al. Prevalence, Incidence, and Mortality of Stroke in China: Results from a Nationwide Population-Based Survey of 480 687 Adults. Circulation 2017, 135, 759–771. [Google Scholar] [CrossRef]
  24. Chen, G.; Wang, A.; Li, S.; Zhao, X.; Wang, Y.; Li, H.; Meng, X.; Knibbs, L.; Bell, M.L.; Abramson, M.J.; et al. Long-Term Exposure to Air Pollution and Survival After Ischemic Stroke. Stroke 2019, 50, 563–570. [Google Scholar] [CrossRef] [PubMed]
  25. Wolf, K.; Hoffmann, B.; Andersen, Z.J.; Atkinson, R.W.; Bauwelinck, M.; Bellander, T.; Brandt, J.; Brunekreef, B.; Cesaroni, G.; Chen, J.; et al. Long-term exposure to low-level ambient air pollution and incidence of stroke and coronary heart disease: A pooled analysis of six European cohorts within the ELAPSE project. Lancet Planet. Health 2021, 5, e620–e632. [Google Scholar] [CrossRef]
  26. Mumby, S.; Chung, K.F.; Adcock, I.M. Transcriptional Effects of Ozone and Impact on Airway Inflammation. Front. Immunol. 2019, 10, 1610. [Google Scholar] [CrossRef] [PubMed]
  27. Day, D.B.; Xiang, J.; Mo, J.; Li, F.; Chung, M.K.; Gong, J.; Weschler, C.J.; Ohman-Strickland, P.A.; Sundell, J.; Weng, W.; et al. Association of Ozone Exposure With Cardiorespiratory Pathophysiologic Mechanisms in Healthy Adults. JAMA Intern. Med. 2017, 177, 1344–1353. [Google Scholar] [CrossRef] [PubMed]
  28. Xia, Y.; Niu, Y.; Cai, J.; Lin, Z.; Liu, C.; Li, H.; Chen, C.; Song, W.; Zhao, Z.; Chen, R.; et al. Effects of Personal Short-Term Exposure to Ambient Ozone on Blood Pressure and Vascular Endothelial Function: A Mechanistic Study Based on DNA Methylation and Metabolomics. Environ. Sci. Technol. 2018, 52, 12774–12782. [Google Scholar] [CrossRef]
  29. Rich, D.Q.; Kipen, H.M.; Huang, W.; Wang, G.; Wang, Y.; Zhu, P.; Ohman-Strickland, P.; Hu, M.; Philipp, C.; Diehl, S.R.; et al. Association Between Changes in Air Pollution Levels During the Beijing Olympics and Biomarkers of Inflammation and Thrombosis in Healthy Young Adults. JAMA 2012, 307, 2068–2078. [Google Scholar] [CrossRef]
  30. Li, J.; Zhou, C.; Xu, H.; Brook, R.D.; Liu, S.; Yi, T.; Wang, Y.; Feng, B.; Zhao, M.; Wang, X.; et al. Ambient Air Pollution Is Associated With HDL (High-Density Lipoprotein) Dysfunction in Healthy Adults. Arter. Thromb. Vasc. Biol. 2019, 39, 513–522. [Google Scholar] [CrossRef]
  31. Martinez-Lazcano, J.C.; González-Guevara, E.; del Carmen Rubioubio, M.; Franco-Pérez, J.; Custodio, V.; Hernández-Cerón, M.; Livera, C.; Paz, C. The effects of ozone exposure and associated injury mechanisms on the central nervous system. Rev. Neurosci. 2013, 24, 337–352. [Google Scholar] [CrossRef]
  32. Croze, M.L.; Zimmer, L. Ozone Atmospheric Pollution and Alzheimer’s Disease: From Epidemiological Facts to Molecular Mechanisms. J. Alzheimer Dis. 2018, 62, 503–522. [Google Scholar] [CrossRef] [PubMed]
Figure 1. Associations of O3 exposure with mRS score based on different model settings. Model 1 was only adjusted for the interaction of the follow-up period with age at baseline and the interaction of the follow-up period with years after stroke at baseline. Model 2 was additionally adjusted for season. Model 3 was additionally adjusted for smoking, drinking, physical activity, milk intake, and body mass index. Model 4 was additionally adjusted for PM2.5. Model 5 was additionally adjusted for hypertension, diabetes, dyslipidemia, and atrial fibrillation. mRS, modified Rankin Scale.
Biology 11 01216 g001
Figure 2. Associations of O3 exposure with mRS score using different exposure time windows. (a) Peak-season O3. (b) Annual mean O3. Models were adjusted for the interaction of the follow-up period with age at baseline, the interaction of follow-up period with years after stroke at baseline, season of the study, smoking, drinking, physical activity, milk intake, body mass index, hypertension, diabetes, dyslipidemia, and atrial fibrillation. mRS, modified Rankin Scale.
Biology 11 01216 g002
Figure 3. Subpopulation-specific effect of O3 exposure with mRS score outcomes for per 10 ug/m3 increment of O3 by demographic subgroups. (a) Peak-season O3. (b) Annual mean O3. Models were adjusted for the interaction of the follow-up period with age at baseline, the interaction of the follow-up period with years after stroke at baseline, season of the study, smoking, drinking, physical activity, milk intake, body mass index, hypertension, diabetes, dyslipidemia, and atrial fibrillation. mRS, modified Rankin Scale.
Biology 11 01216 g003
Figure 4. Exposure−response curves for O3 exposure levels with mRS score. The solid line represents the point estimates; the dashed line represents the confidence intervals. The distribution of O3 concentration of the baseline and revisit population are shown in the box plot. (a) Peak-season O3. (b) Annual mean O3. Models were adjusted for the interaction of the follow-up period with age at baseline, the interaction of the follow-up period with years after stroke at baseline, season of the study, smoking, drinking, physical activity, milk intake, body mass index, hypertension, diabetes, dyslipidemia, and atrial fibrillation. mRS, modified Rankin Scale.
Biology 11 01216 g004
Table 1. Descriptive characteristics of the study participants at baseline by peak-season O3 concentration quartile.
OverallO3 First QuartileO3 Second QuartileO3 Third QuartileO3 Fourth Quartilep-Value
(≤93.70 μg/m3)(93.70–107.50 μg/m3)(107.50–123.27 μg/m3)(>123.27 μg/m3)
Age Group <0.01
 ≤45 585 (2.09)197 (2.49)161 (2.29)125 (1.78)102 (1.46)——
 45–55 4288 (15.28)1176 (14.84)1016 (14.48)1066 (15.15)1030 (14.76)——
 55–65 9857 (35.13)2438 (30.77)2405 (34.27)2486 (35.33)2528 (36.22)——
 65–75 9681 (34.51)2308 (29.13)2447 (34.87)2437 (34.64)2489 (35.66)——
 75–85 3388 (12.08)829 (10.46)912 (13.00)865 (12.29)782 (11.21)——
 >85 257 (0.92)76 (0.96)76 (1.08)57 (0.81)48 (0.69)——
Sex <0.01
 Female 13,094 (46.67)3398 (48.38)3353 (47.78)3267 (46.43)3076 (44.08)——
 Male 14,842 (52.90)3610 (51.40)3659 (52.14)3713 (52.77)3860 (55.31)——
 Missing 120 (0.43)16 (0.23)5 (0.07)56 (0.80)43 (0.62)——
Atrial Fibrillation <0.01
 No 26,649 (94.99)6661 (94.83)6537 (93.16)6736 (95.74)6715 (96.22)——
 Yes 1401 (4.99)363 (5.17)480 (6.84)294 (4.18)264 (3.78)——
 Missing 6 (0.02)0 (0.00)0 (0.00)6 (0.09)0 (0.00)——
Dyslipidemia <0.01
 No 15,179 (54.1)3484 (49.6)3959 (56.42)4068 (57.82)3668 (52.56)——
 Yes 9715 (34.63)1902 (27.08)2242 (31.95)2609 (37.08)2962 (42.44)——
 Missing 3162 (11.27)1638 (23.32)816 (11.63)359 (5.10)349 (5.00)——
Hypertension <0.01
 No 9021 (32.15)2493 (35.49)2174 (30.98)2249 (31.96)2105 (30.16)——
 Yes 19,029 (67.83)4531 (64.51)4843 (69.02)4781 (67.95)4874 (69.84)——
 Missing 6 (0.02)0 (0.00)0 (0.00)6 (0.09)0 (0.00)——
Diabetes Mellitus <0.01
 No 20,847 (74.30)4908 (69.87)5289 (75.37)5383 (76.51)5267 (75.47)——
 Yes 5272 (18.79)1027 (14.62)1278 (18.21)1484 (21.09)1483 (21.25)——
 Missing 1937 (6.90)1089 (15.50)450 (6.41)169 (2.40)229 (3.28)——
Smoke <0.01
 No 18,217 (64.93)4154 (59.14)4626 (65.93)4796 (68.16)4641 (66.50)——
 Yes 7133 (25.42)1779 (25.33)1824 (25.99)1793 (25.48)1737 (24.89)——
 Missing 2706 (9.64)1091 (15.53)567 (8.08)447 (6.35)601 (8.61)——
Drink <0.01
 No 23,133 (82.45)5812 (82.74)5862 (83.54)5845 (83.07)5614 (80.44)——
 Yes 4910 (17.50)1210 (17.23)1152 (16.42)1184 (16.83)1364 (19.54)——
 Missing 13 (0.05)2 (0.03)3 (0.04)7 (0.10)1 (0.01)——
Sport <0.01
 No 11,147 (39.73)2824 (40.21)2673 (38.09)2660 (37.81)2990 (42.84)——
 Yes 16,901 (60.24)4198 (59.77)4344 (61.91)4370 (62.11)3989 (57.16)——
 Missing 8 (0.03)2 (0.03)0 (0.00)6 (0.09)0 (0.00)——
Milk <0.01
 No 17,073 (60.85)3837 (54.63)4264 (60.77)4304 (61.17)4668 (66.89)——
 Yes 4449 (15.86)973 (13.85)1130 (16.10)1090 (15.49)1256 (18.00)——
 Missing 6534 (23.29)2214 (31.52)1623 (23.13)1642 (23.34)1055 (15.12)——
BMI <0.01
 (−Inf,18.5] 545 (1.94)163 (2.32)175 (2.49)124 (1.76)83 (1.19)——
 (18.5,24] 10,580 (37.71)3092 (44.02)2850 (40.62)2435 (34.61)2203 (31.57)——
 (24,28] 11,849 (42.23)2786 (39.66)2906 (41.41)3105 (44.13)3052 (43.73)——
 (28, Inf] 5055 (18.02)967 (13.77)1082 (15.42)1370 (19.47)1636 (23.44)——
 Missing 27 (0.10)16 (0.23)4 (0.06)2 (0.03)5 (0.07)——
Publisher’s Note: MDPI stays neutral with regard to jurisdictional claims in published maps and institutional affiliations.

