Article

Physical Enrichment Triggers Brain Plasticity and Influences Blood Plasma Circulating miRNA in Rainbow Trout (Oncorhynchus mykiss)

1
INRAE, INRAE, Université de Pau & Pays Adour, NUMEA, 64310 Saint-Pée-sur-Nivelle, France
2
INRAE, LPGP, 35000 Rennes, France
3
IRISA, INRIA, CNRS, Université de Rennes 1, 35000 Rennes, France
4
CNRS, IFCE, INRAE, Université de Tours, PRC, 37380 Nouzilly, France
*
Authors to whom correspondence should be addressed.
These authors contributed equally to this work.
Biology 2022, 11(8), 1093; https://doi.org/10.3390/biology11081093
Submission received: 13 June 2022 / Revised: 18 July 2022 / Accepted: 19 July 2022 / Published: 22 July 2022

Abstract

:

Simple Summary

Overall, this study has reported that environmental enrichment significantly displayed a series of differentially expressed genes and pathways related to cerebral activity, neural plasticity (neurotrophic markers), neurogenesis, and synaptogenesis, essentially in telencephalon, which may underpin the beneficial effects of a complex environment on rainbow trout’s adaptive behaviors. In addition, environmental enrichment significantly influenced circulating miRNAs (c-miRNAs) profiles of plasma in rainbow trout, which reveals the high potential of c-miRNAs, as physiologically relevant biomarker candidates of fish behavioral plasticity.

Abstract

Physical enrichment is known to improve living conditions of fish held in farming systems and has been shown to promote behavioral plasticity in captive fish. However, the brain’s regulatory-mechanism systems underlying its behavioral effects remain poorly studied. The present study investigated the impact of a three-month exposure to an enriched environment (EE vs. barren environment, BE) on the modulation of brain function in rainbow trout (Oncorhynchus mykiss) juveniles. Using high-throughput RT-qPCR, we assessed mRNA genes related to brain function in several areas of the trout brain. These included markers of cerebral activity and plasticity, neurogenesis, synaptogenesis, or selected neurotransmitters pathways (dopamine, glutamate, GABA, and serotonin). Overall, the fish from EE displayed a series of differentially expressed genes (neurotrophic, neurogenesis, and synaptogenesis markers) essentially localized in the telencephalon, which could underpin the beneficial effects of complexifying the environment on fish brain plasticity. In addition, EE significantly affected blood plasma c-miRNA signatures, as revealed by the upregulation of four c-miRNAs (miR-200b/c-3p, miR-203a-3p, miR-205-1a-5p, miR-218a-5p) in fish blood plasma after 185 days of EE exposure. Overall, we concluded that complexifying the environment through the addition of physical structures that stimulate and encourage fish to explore promotes the trout’s brain function in farming conditions.

1. Introduction

The environment of an organism can convey a powerful influence over its biology and physiology. Since as early as the late 1940s, with Hebb’s first highlighted ‘enriched environment (EE)’ as an experimental concept [1], it has become well-known that environmental stimulation promotes a wide range of effects on an animal’s behavior [2]. An EE is defined as “a modification of the environment of captive animals, thereby increasing the animal’s behavioral possibilities and leading to improvements of their biological function” [3]. Although results vary depending on the outcome variables assessed, the addition of different structures to the habitat (e.g., physical enrichment) and types of environmental enrichments (e.g., sensorial, occupational, social, and dietary enrichment), as reviewed in fish by Arechavala-Lopez and collaborators [4], confers more environmental complexity and deeply provides behavioral plasticity by modifying an individual’s environmental perception. Indeed, the surrounding environments that animals inhabit shape their behavioral phenotypes, physiological status, and molecular processes.
In fish, a growing body of studies describes the beneficial effects of EE but to a lesser extent than in mammals (for reviews, see Corcoran [5] and Näslund and Johnsson [6]). However, EE has been shown to improve fish cognitive abilities [7], to reduce aggressive behavior [8], and to circulate stress hormones [9]. However, EE is not always beneficial. While some studies showed improved cognition and brain growth in fish kept in structured environments, other studies found no effect [10,11,12] from physical enrichment. Moreover, a recent review by Jones and collaborators [13] highlighted the importance of the type of physical environment (dimensions, ecological rationale, timing of enrichment, amount, inputs, lighting, and social environment), which could explain the different results obtained in these studied.
Recently, we highlighted important behavioral differences between rainbow trout (Oncorhynchus mykiss) juveniles reared in EE with physical enrichments (PVC pipes, plastic plants, and white stones) for three months and those held in barren environment (BE) [14]. When observed in their rearing tanks, enriched fish displayed more shoal cohesion and fewer agonistic and/or stereotypic behaviors. When subjected to social isolation in a novel environment, they explored more and displayed fewer fear-related behaviors. When exposed to a novel object, enriched fish were bolder and less neophobic, spending more time close to the object, without exhibiting anxiety-like behaviors. This behavioral plasticity triggered by EE is closely linked to the individual’s perception of its surroundings (threatening, safe, etc.), which is an elementary process involved in cognition [15].
In sharp contrast, the relation between observed fish behaviors triggered by EE and the brain, which underlies these behaviors, remains largely unknown. Ebbesson and Braithwaite [16] synthetized the impacts of the environment, whether natural or in aquaculture, on fish neural plasticity and cognition. Most studies of EE-induced brain changes have described effects on brain size [17,18,19] and, generally, EE results in faster rates of neural proliferation [7,20,21]. However, the neural regulatory mechanisms underpinning the specific effects of EE on cognition have rarely been studied in fish, and even more rarely in salmonids. Among these species, trout is the main continental fish species produced in Europe (European Commission, 2020), so it deserves more attention, especially for finding strategies to alleviate welfare issues caused by low-stimulating environments often encountered in farming systems. Understanding the neural mechanisms underlying the behavioral effects of EE, which we previously reported in trout [14], would highlight the brain-plasticity mechanisms involved and provide new insight into the benefits of this practice in farmed fish.
Several studies have revealed a specific role of small non-coding RNAs (c-miRNAs, approximately 22 nucleotides in length) in a wide variety of biological processes in mammals, including neuronal plasticity and other brain functions [22,23], and these would play a potential role in cognitive functions [24]. Furthermore, previous studies reported that the expression of c-miRNAs is associated with behavioral responses to drugs [25,26], behavioral plasticity in honey bees [27], and agonistic behavior in crab [28]. Numerous studies in humans have shown that c-miRNAs are naturally secreted from cells into body fluids, such as serum, blood plasma, saliva, urine, milk, amniotic fluid, colostrum, bronchial lavage, cerebrospinal fluid, peritoneal fluid, and pleural fluid [29], where they remain highly stable [30]. This confers a great potential to c-miRNAs as prognostic biomarkers. Recently, the high potential of c-miRNAs was highlighted as a physiologically relevant biomarker candidate for the phenotyping of reproductive and metabolic states in trout [31]. However, no research in fish has currently evaluated the association of c-miRNAs with cognitive and behavioral responses, despite the potential interest of these c-miRNAs as biomarker candidates of cognition-related behavioral plasticity, as revealed by analyses of numerous genes’ expressions.
The present study, complementing our previous work [14], aims to investigate the molecular mechanisms at the cerebral level underlying the EE’s beneficial effects in trout reared in an aquaculture system. In order to reveal the brain’s regulatory pathways and networks involved in the environmental effects on fish cognition, we used a high-throughput microfluidics quantitative polymerase chain reaction (qPCR) system (Biomark microfluidic system; Fluidigm, San Francisco, USA) to analyze numerous genes’ expressions in specific areas of the trout brain (forebrain, hypothalamus, and hindbrain). These selected genes include markers of cerebral activity, neural plasticity (neurotrophic markers), neurogenesis, synaptogenesis, and selected neurotransmitters pathways. In addition, we aim to explore the potential of selected c-miRNAs in a biological fluid (plasma) of fish as non-invasive biomarkers of the behavioral plasticity through the cognitive processes observed in our EE study.

2. Materials and Methods

2.1. Animal Handling

The experiment was conducted following the Guidelines of the National Legislation on Animal Care of the French Ministry of Research (Decree No 2013–118, February 2013) and in accordance with EU legal frameworks related to the protection of animals used for scientific purposes (i.e., Directive 2010/63/EU). The scientists in charge of the experiments received training and personal authorization. The experiment was conducted at the INRAE Physiology and Genomic Laboratory (LPGP) experimental facilities (permit number C35-238-6, Rennes, France), delivered by French veterinary services, and approved by the ethics committee for the animal experimentation of Rennes and the French minister of national education, research, and innovation, under the authorization number APAFIS#28962- 131 2021011323275224.

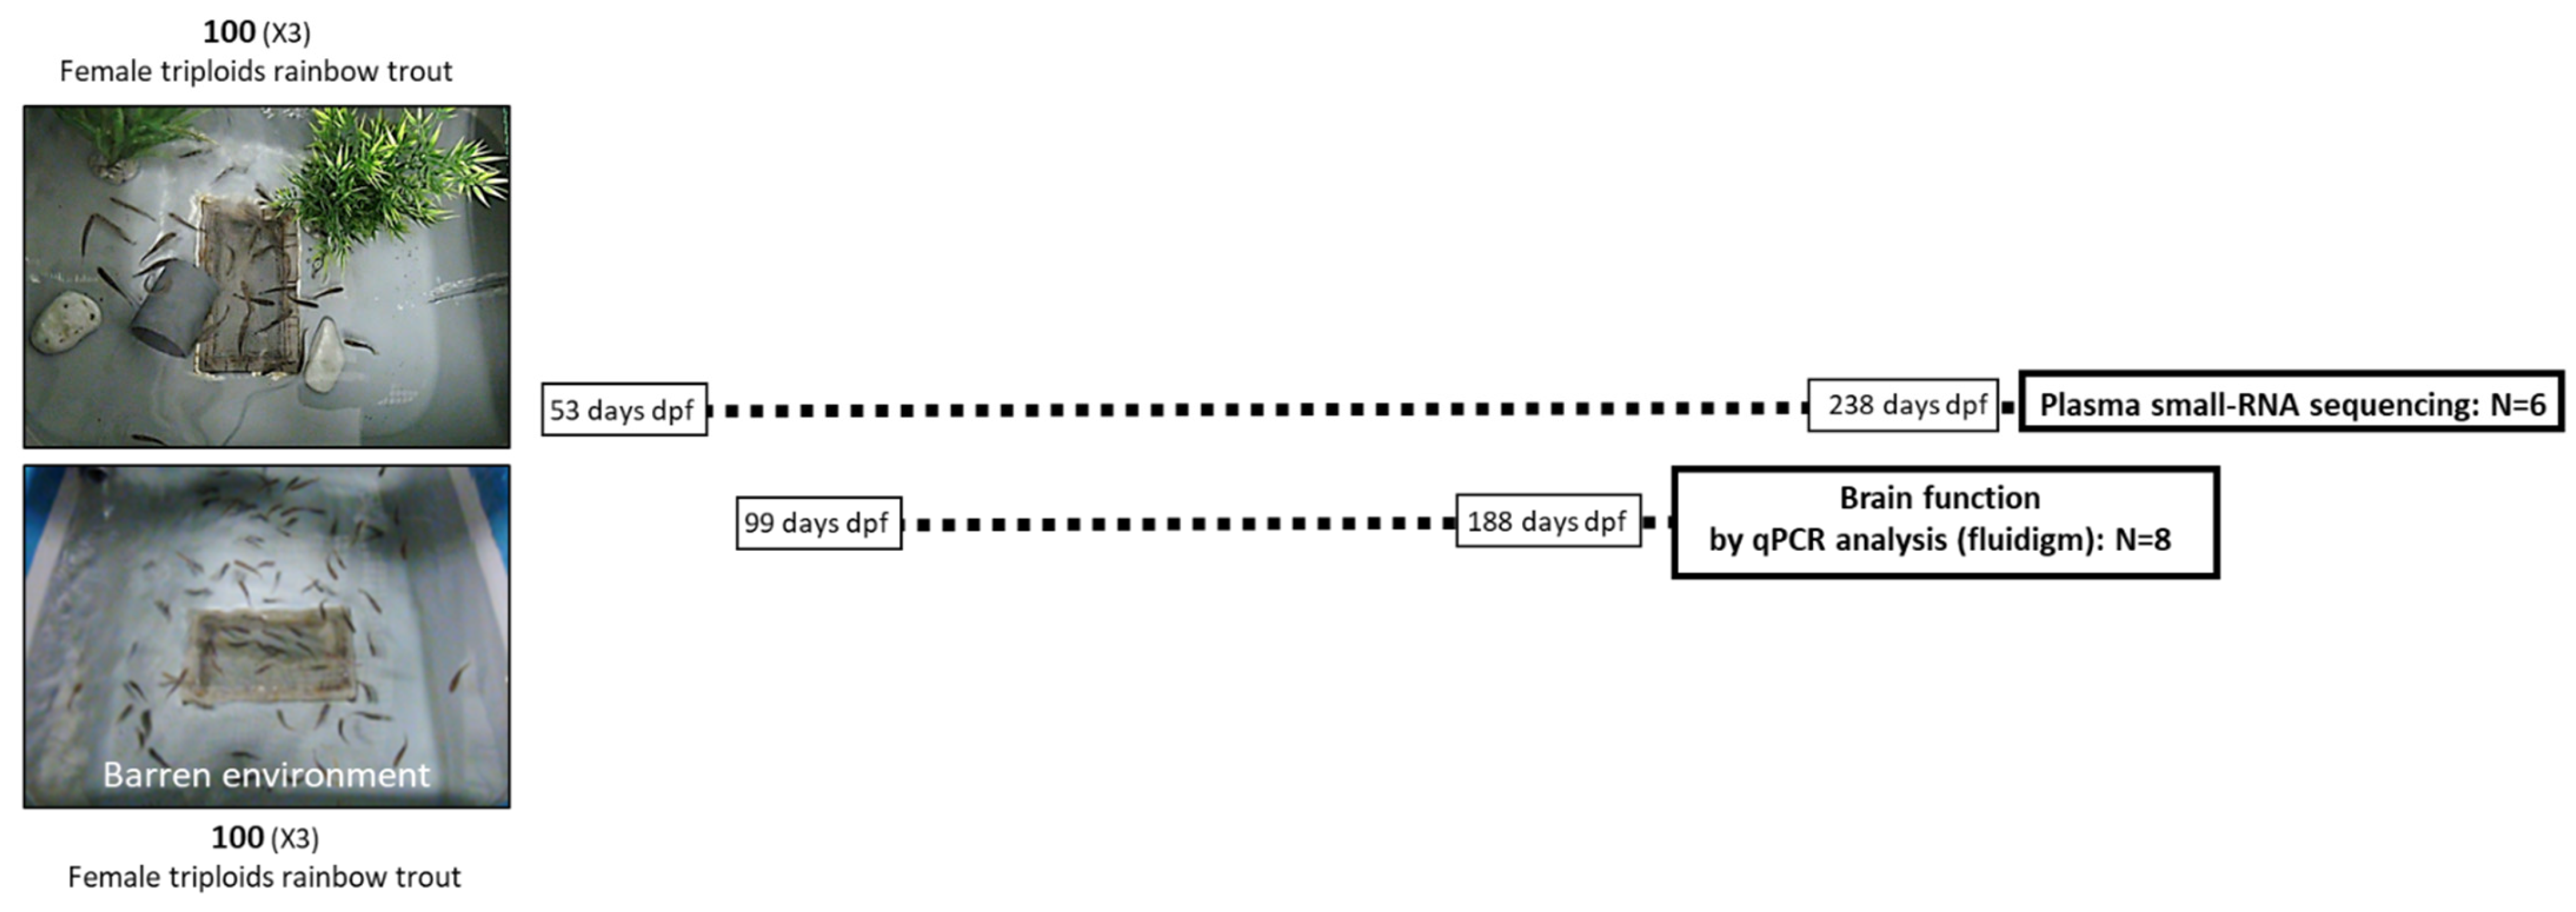
2.2. Fish and Experimental Design

The experimental design is already published [14]. In this study, we used triploid female trout (Oncorhynchus mykiss), the most commonly used in research experiments because they are the ones sold in the market. Fish were originated from eggs fertilized at experimental facilities (INRAE-PEIMA, permit number B29-277-02, Sizun, France). Eggs originated from two batches: eggs from batch 1 used for c-miRNAs analyses were fertilized on 7 November 2019, while eggs from batch 2 used for qPCR analyses were fertilized on 18 June 2020. Trout fry were transferred to INRAE LPGP (Rennes, France) at 53 and 99 days post fertilization (dpf) for small RNA and qPCR analyses, respectively. They were split into two experimental groups, submitted to either environmental enrichment (EE) or barren environment (BE) and kept under these conditions until 238 dpf for batch 1 and 189 dpf for batch 2. The EE consisted of physical enrichments and was composed of PVC pipes, plastic plants (grapes of leaves), and white stones, representing a complete panel of the different structures tested in the literature reviewed by Näslund and Johnsson [6]. For each stage, fish mean weight, tank size, number of individuals per tank, number of tanks per treatment, and number and types of physical enrichments, as well as estimated floor coverage (%), are given in Table 1 (batch 1 for c-miRNA analysis) and Table 2 (batch 2 for molecular analysis).
Fish load was always lower than 25 kg/m3. Water temperature was maintained at 12 +/− 0.2 °C, the artificial photoperiod was 12:12 h, and the water quality was regularly checked (NH4+, NO2-159, NO3-160). All tanks were supplied by circulating and recycled water. Fish were fed daily with extruded pellets (39% proteins and 24% lipids, Le Gouessant, France), the diameter and the quantity being regularly adapted according to fish mean weight. The experimental protocol is summarized in Figure 1.
Fish rearing, fluid sampling, and biological samples used for RNA-seq and RT-qPCR analysis are described.

2.3. Sampling Protocol

For qPCR analyses, eight fish per treatment were euthanized using a lethal dose of tricaine methane sulphonate (200 mg/L; PHARMAQ, Hampshire, UK) after three months of being reared in either environmental enrichment (EE) or barren environment (BE). Subsequently, the fish brain was rapidly dissected, and the forebrain, hindbrain, and hypothalamus were extracted and frozen at −80 °C until qPCR analyses, as previously described [32].
For small RNA analyses, after a six-month captive period (in enriched or barren tanks), five fish (other cohort) from EE treatment and six fish from BE treatment were euthanized. Blood (~0.400 mL) was sampled from caudal sinuses into EDTA-coated syringes, and samples were stored on ice. After sampling, blood cells and plasma were separated by centrifugation (10 min at 3000 rpm). Plasma was collected and frozen at −20 °C until small RNA analyses.
In this study, the fish used for RNA-seq analyses were from batch 1, with fish that were never subjected to behavioral tests. Fish used for RT-qPCR analyses were also not subjected to behavioral tests prior to tissue collection but originated from the same batch 2 as the fish with behavioral phenotypes that were published in our previous paper [14].

2.4. Gene Expression Measurement by Real-Time Quantitative PCR

For 8 fish per treatment (EE and BE), total RNA was extracted from the brain divided in three areas (forebrain, hindbrain, and hypothalamus) using the TRIzol reagent method (Invitrogen, Carlsbad, CA, USA) with Precellys (Bertin technologies, Montigny le Bretonneux, France) in accordance with the instructions of the manufacturer, as previously described [33]. Total RNA (2 μg) was used for cDNA synthesis. The Super-Script III RNAse H-Reverse transcriptase kit (Invitrogen) was used with random primers (Promega, Charbonniéres, France) to synthesize cDNA. High throughput real-time quantitative PCR (RT-qPCR) was performed using the Biomark microfluidic system from Fluidigm (Fluidigm, San Francisco, CA, USA), in which each gene combination was quantified using a 96.96 Dynamic Array™ IFCs (BMK-M-96.96, Fluidigm) as previously published [34]. Pre-amplification of the samples, chip loading, and RT-qPCR were performed in accordance with the protocol of the manufacturer. The results were analyzed using the Fluidigm PCR analysis software v.4.1.3. Firstly, 6.5 ng of each cDNA were initially pre-amplified (10 min 95 °C activation and 14 PCR cycles at 15 s 95 °C for 4 min, 60 °C) with PreAmp Master Mix (100-5581, Fluidigm) with a pool containing all the primers (200 nM), excluding the 16S rRNA primer sets. Pre-amplified samples were diluted to 1/5 after an exonuclease treatment (M02935, NEB, Biolabs, Ipswich, MA, USA). In order to prepare samples for loading into the IFC, a mix was prepared consisting of 440 μL 2× TaqMan Master Mix (Applied Biosystem 4369016, Thermofischer Scientific, Maryland, USA), 44 μL 20× DNA Binding Dye Sample Loading Reagent (100-7609, Fluidigm), and 44 µL 20× EvaGreen dye (31000, Biotium, San Francisco, CA, USA), plus 132 μL TE buffer. A volume of 6 μL of the mix was dispensed to each well of a 96-well assay plate. Two microliters of pre-amplified and diluted cDNA sample were added to each well, and the plate was briefly vortexed and centrifuged.
For the assays, 5 μL of each Assay (5 μM each primer in primer-mix (2× assay loading reagent, 100-7611, Fluidigm) with Tris EDTA) were dispensed to each Detector Inlet of the 96.96 IFC. Following priming of the IFC in the IFC Controller HX, 5 μL of the cDNA sample + reagent mix and 5 μL of Assay were dispensed to each sample inlet of the 96.96 IFC. After loading the assays and samples into the IFC, it was transferred to the BioMark, and PCR was performed using the following thermal protocol: thermal mix of 50 °C, 2 min; 70 °C, 30 min; 25 °C, 10 min; hot start at 50 °C, 2 min; 95 °C, 10 min PCR Cycle of 35 cycles of (95 °C, 15 s; 60 °C, 60 s), and melting analysis (60 °C, 30 s; 95 °C, 1 °C/3 s). Results were analyzed using the Fluidigm real-time PCR analysis software v.4.1.3. Data were extrapolated from standard curves and normalized to the validated housekeeping gene. Compared to 18 s and actin, the elongation factor 1α gene (eef1α) showed the most stable expression between brain areas and tissues and was chosen as the reference gene. Relative expression of the target genes was determined by the ΔΔCT method [35,36,37]. Mean ± standard error of mean values for each group are expressed in fold changes relative to the BE treatment for all genes. Primer sequences used to amplify all paralogs genes and accession numbers of the primers are presented in Table 1. All gene sequences of trout used were identified by in silico analysis by Genomicus software v.100.01 (www.genomicus.biologie.ens.fr; accessed on 1 November 2020) and Ensembl (http://www.ensembl.org, Ensembl Release 102; accessed on November 2020, trout genome available) and queried against mammals or fish genome using the BLAST tool in Ensembl and in NCBI (https://blast.ncbi.nlm.nih.gov/Blast.cgi, accessed on 1 November 2020) to confirm the gene identification (Table 3).

2.5. Primer Design

The primer sequences used to amplify all genes and accession numbers of the primers are presented in Table 3. For gene targets that had not previously been validated, primers were tested on a pool of cDNA, and amplified products were systematically sequenced.
PCR primers (Table 3) for the target regions were designed for each gene using Primer3 software [38]. To optimize annealing temperature for the respective gene, PCR was performed with specific primer pairs, and analysis of PCR products was done by electrophoresis on agarose gel (1.5%) [39].

2.6. RNA Extraction, Pre-Processing, and Illumina Small RNA Deep Sequencing for Plasma Samples

Plasma samples were homogenized in TRIzol reagent (Trizol BD) at a ratio of 400 µL of fluid per milliliter of reagent (N = 5 for EE, N = 6 for BE). Total RNA was extracted in accordance with the instructions of the manufacturer. Except for the isopropanol step, glycogen was added to each sample to facilitate visualization of precipitated RNA. The quantity of miRNA was assessed using qubit microRNA assay kit (ThermoFisher, Maryland, USA), which allows fast and accurate quantification of c-miRNA using the Qubit Fluorometer. Libraries from RNA were constructed using the NEXTflex small RNA ki v3 (Bioo Scientific, Saint Marcel, France). Starting from 1 µg of total RNA, an adapter was ligated on the 3’ end of the RNAs. A second adapter was ligated to the 5’ end. Ligated RNAs were subjected to reverse transcription using M-MuLv transcriptase and a trout primer complementary to the 3’ adapter. PCR amplification (16 cycles) was performed on the cDNA using a universal primer and a barcoded primer. Final size selection was performed on 3% gel cassette on a Pippin HT between 126 pb and 169 pb. Sequencing (single read 50 nucleotide) was performed using a NovaSeq 6000 (Illumina, Evry, France) with SBS (Sequence By Synthesis) technique. A total of over 449 million reads (sequences after Illumina Purity Filter) were obtained, with a number of reads per library ranging between 24 and 52 million. All reads were deposited into NCBI Sequence Read Archive under accession number SUB9869985. Reads were trimmed using cut adapt to remove the adapter sequence GCCTTGGCACCCGAGAATTCCA and the random primers. Reads were subsequently aligned onto the trout genome (NCBI RefSeq assembly accession GCF_013265735.2).

2.7. c-miRNA Annotation, Quantification and Differential Expression Analysis

The trout miRNAome annotation was established using Prost! [40], which was ran on the trout reference genome (NCBI RefSeq assembly accession GCF_013265735.2). Prost! was ran using the trout c-miRNA annotation, as previously established [31], for all the circulating fluids sequencing samples.
When Prost! identified multiple potential annotations for a given sequence, counts for this sequence were distributed relatively to the abundance of single annotated sequences of the same c-miRNA. If a c-miRNA was found only in multiple annotation, counts were distributed evenly between annotations. Counts in samples from the same tissue were averaged, and c-miRNAs for which normalized abundance was greater than 10 RPM were considered expressed in the fluid. Differential-expression analyses were performed using DESeq2 [41] and raw counts from all fluid c-miRNA-expression data. For each differential-expression test, log fold changes were corrected using lfcShrink (type = “apeglm”), and p-values were corrected using an FDR method (correction of Benjamini-Hochberg) to account for multiple testing. To identify c-miRNAs differentially expressed between the different conditions, a model was built using all samples and considering all possible effects (~condition).
To investigate the possible tissue origin of c-miRNAs differentially expressed in blood plasma, we used small sequencing libraries of samples originating from a wide variety of tissues in precedent studies [42]. This analysis investigated a subset of 14 different organs from females (brain, pituitary, gills, liver, heart, muscle, stomach, intestine, spleen, head-kidney, trunk-kidney, skin, ovary, eggs).

2.8. Statistical Analysis

All statistical analyses were performed using R software (v3.5.2)/R Commander package. All data are expressed as mean (EE vs. BE) with standard deviations across biological replicates. Effects were considered statistically significant at p < 0.05. Analyses were carried out on untransformed data, since criteria for normality and homogeneity of variances were fulfilled (Shapiro–Wilk and Levene’s test, respectively). Values of mRNA level of all transcripts revealed by RT-qPCR were analysed by Welch’s t-tests. If the criteria (normality and homogeneity) were still not met, a non-parametric test was used for the analysis.

3. Results

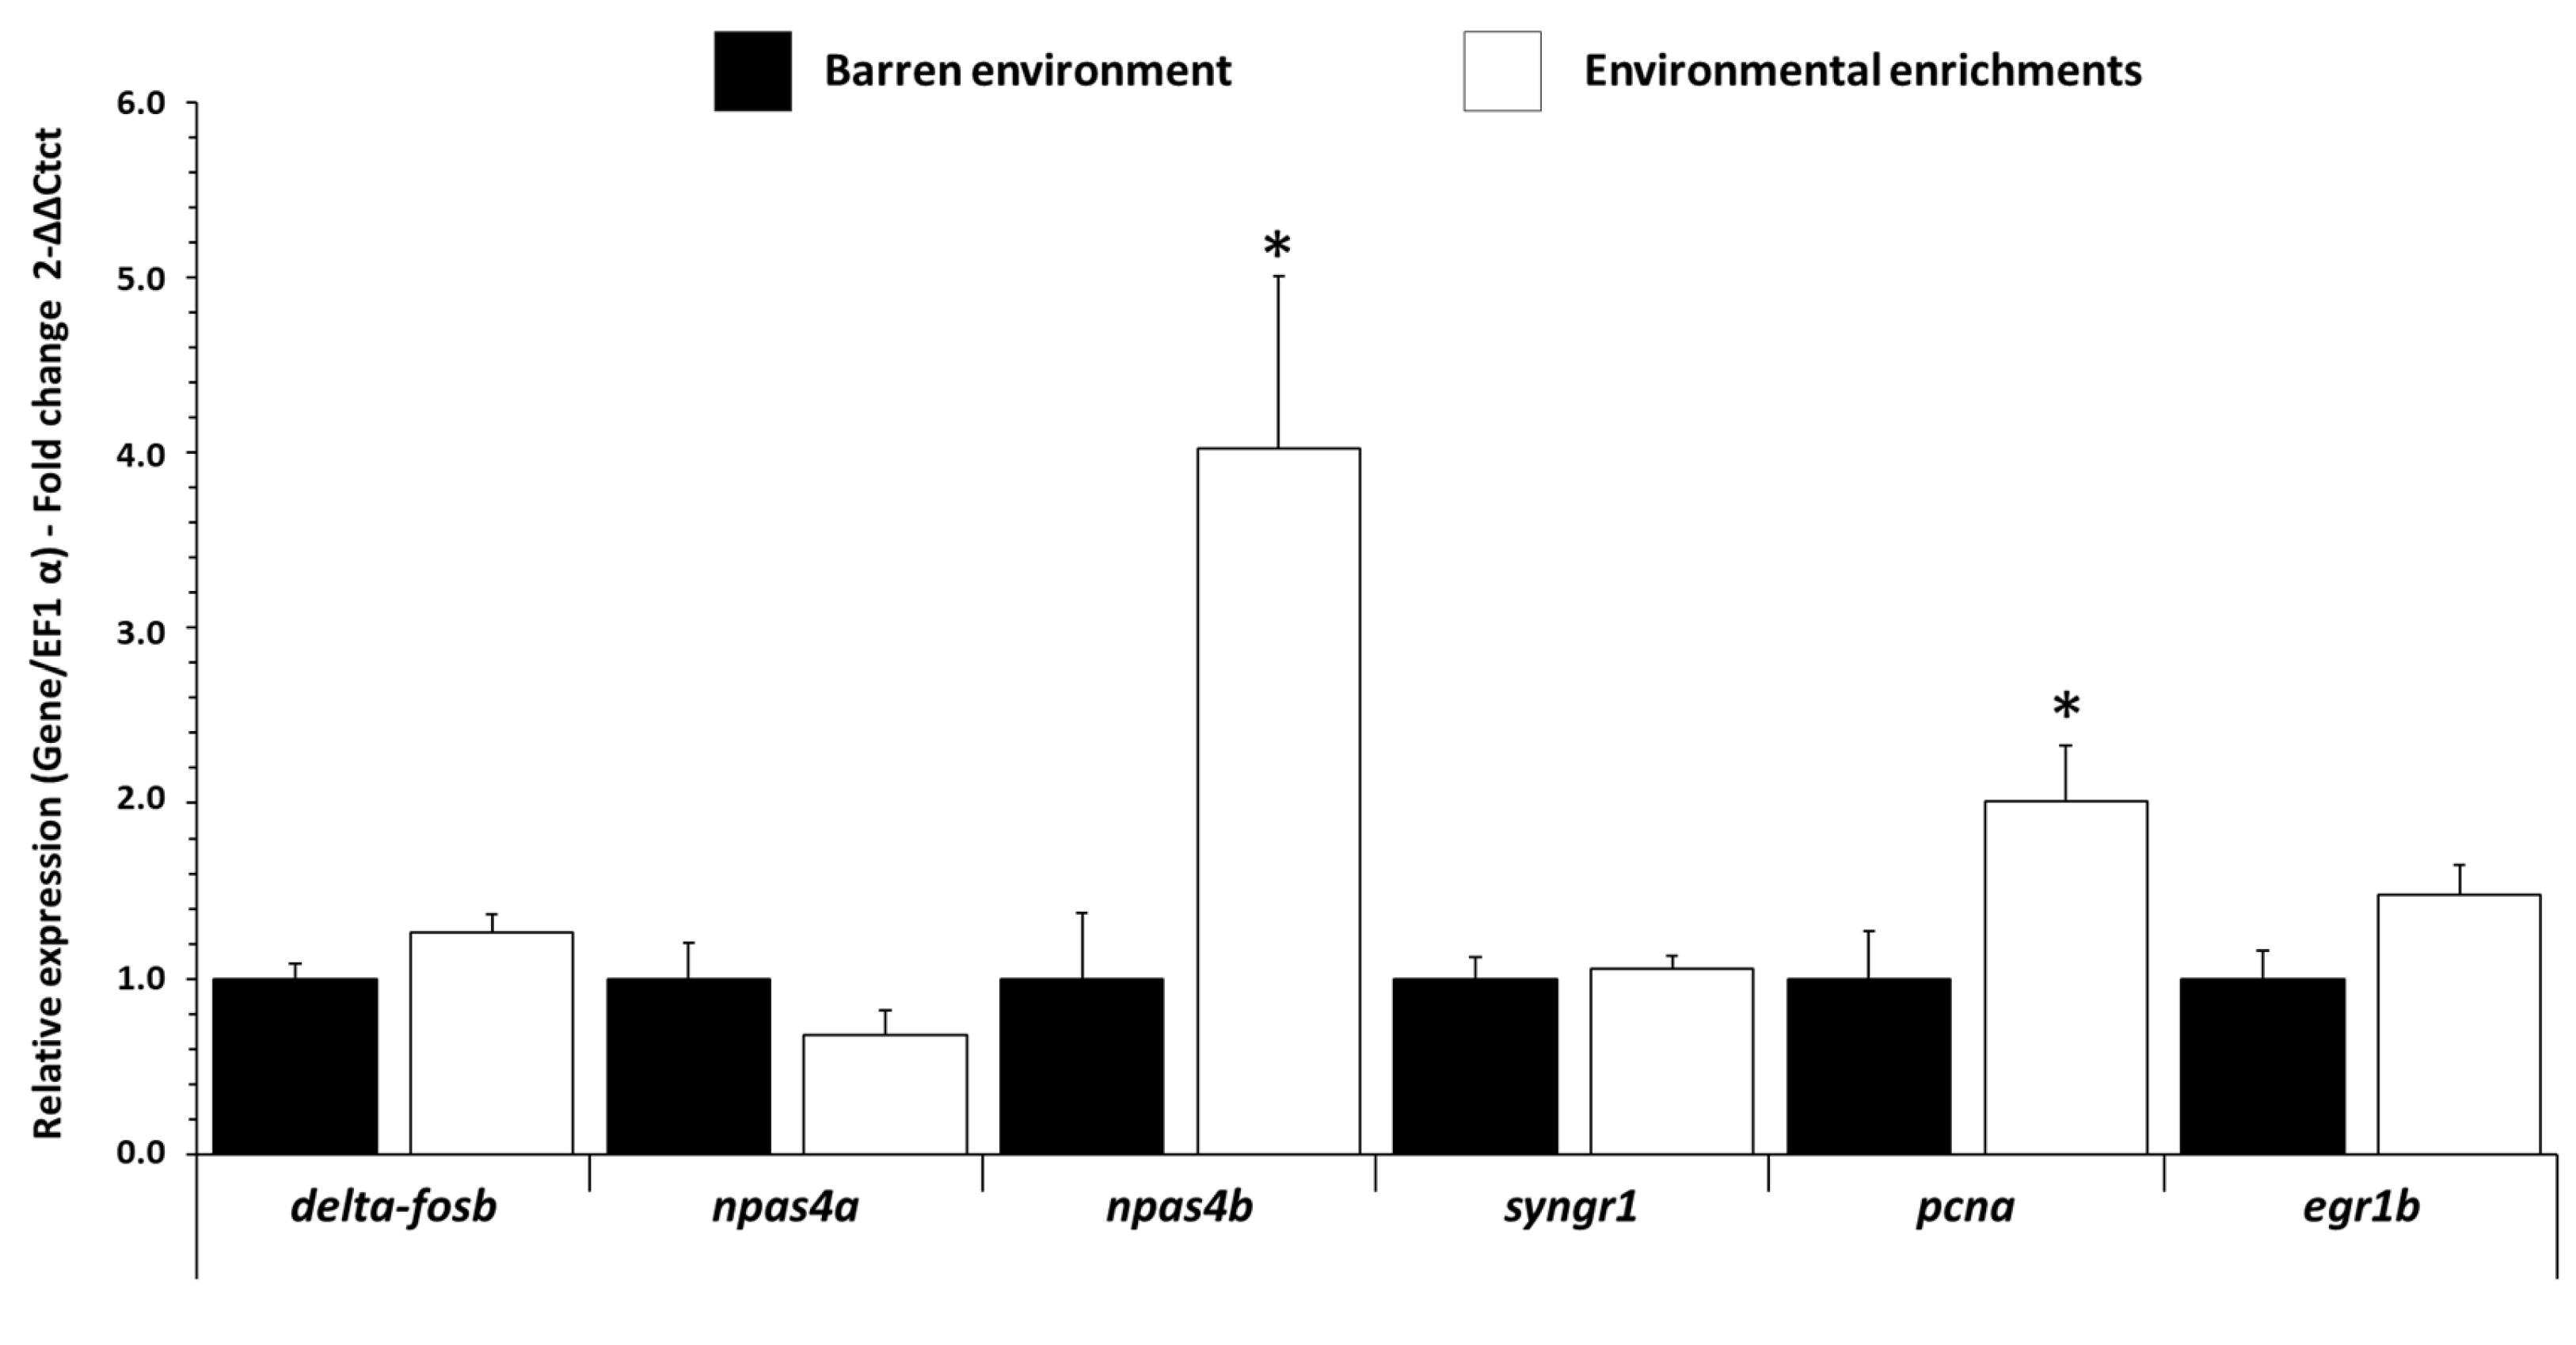
3.1. Influence of EE on mRNA Expression Levels of Neuronal Activity Gene in Trout Brain

In the forebrain, npas4b (Neuronal PAS Domain Protein 4) and pcna (proliferating cell nuclear antigen), early markers of excitatory-inhibitory balance of neural circuits and markers of neurogenesis, respectively, were increased (p ˂ 0.021 f = 2.98 and p ˂ 0.031 f = 2.439, respectively) in EE fish compared to BE fish (Figure 2). Other genes (delta-fosb, syngr1, egr1b) were not significantly differentially detected in the forebrain and hypothalamus (Figure S1), and no mRNA-expression-levels variations were detected in the hindbrain for any of the genes studied (Figure S1).

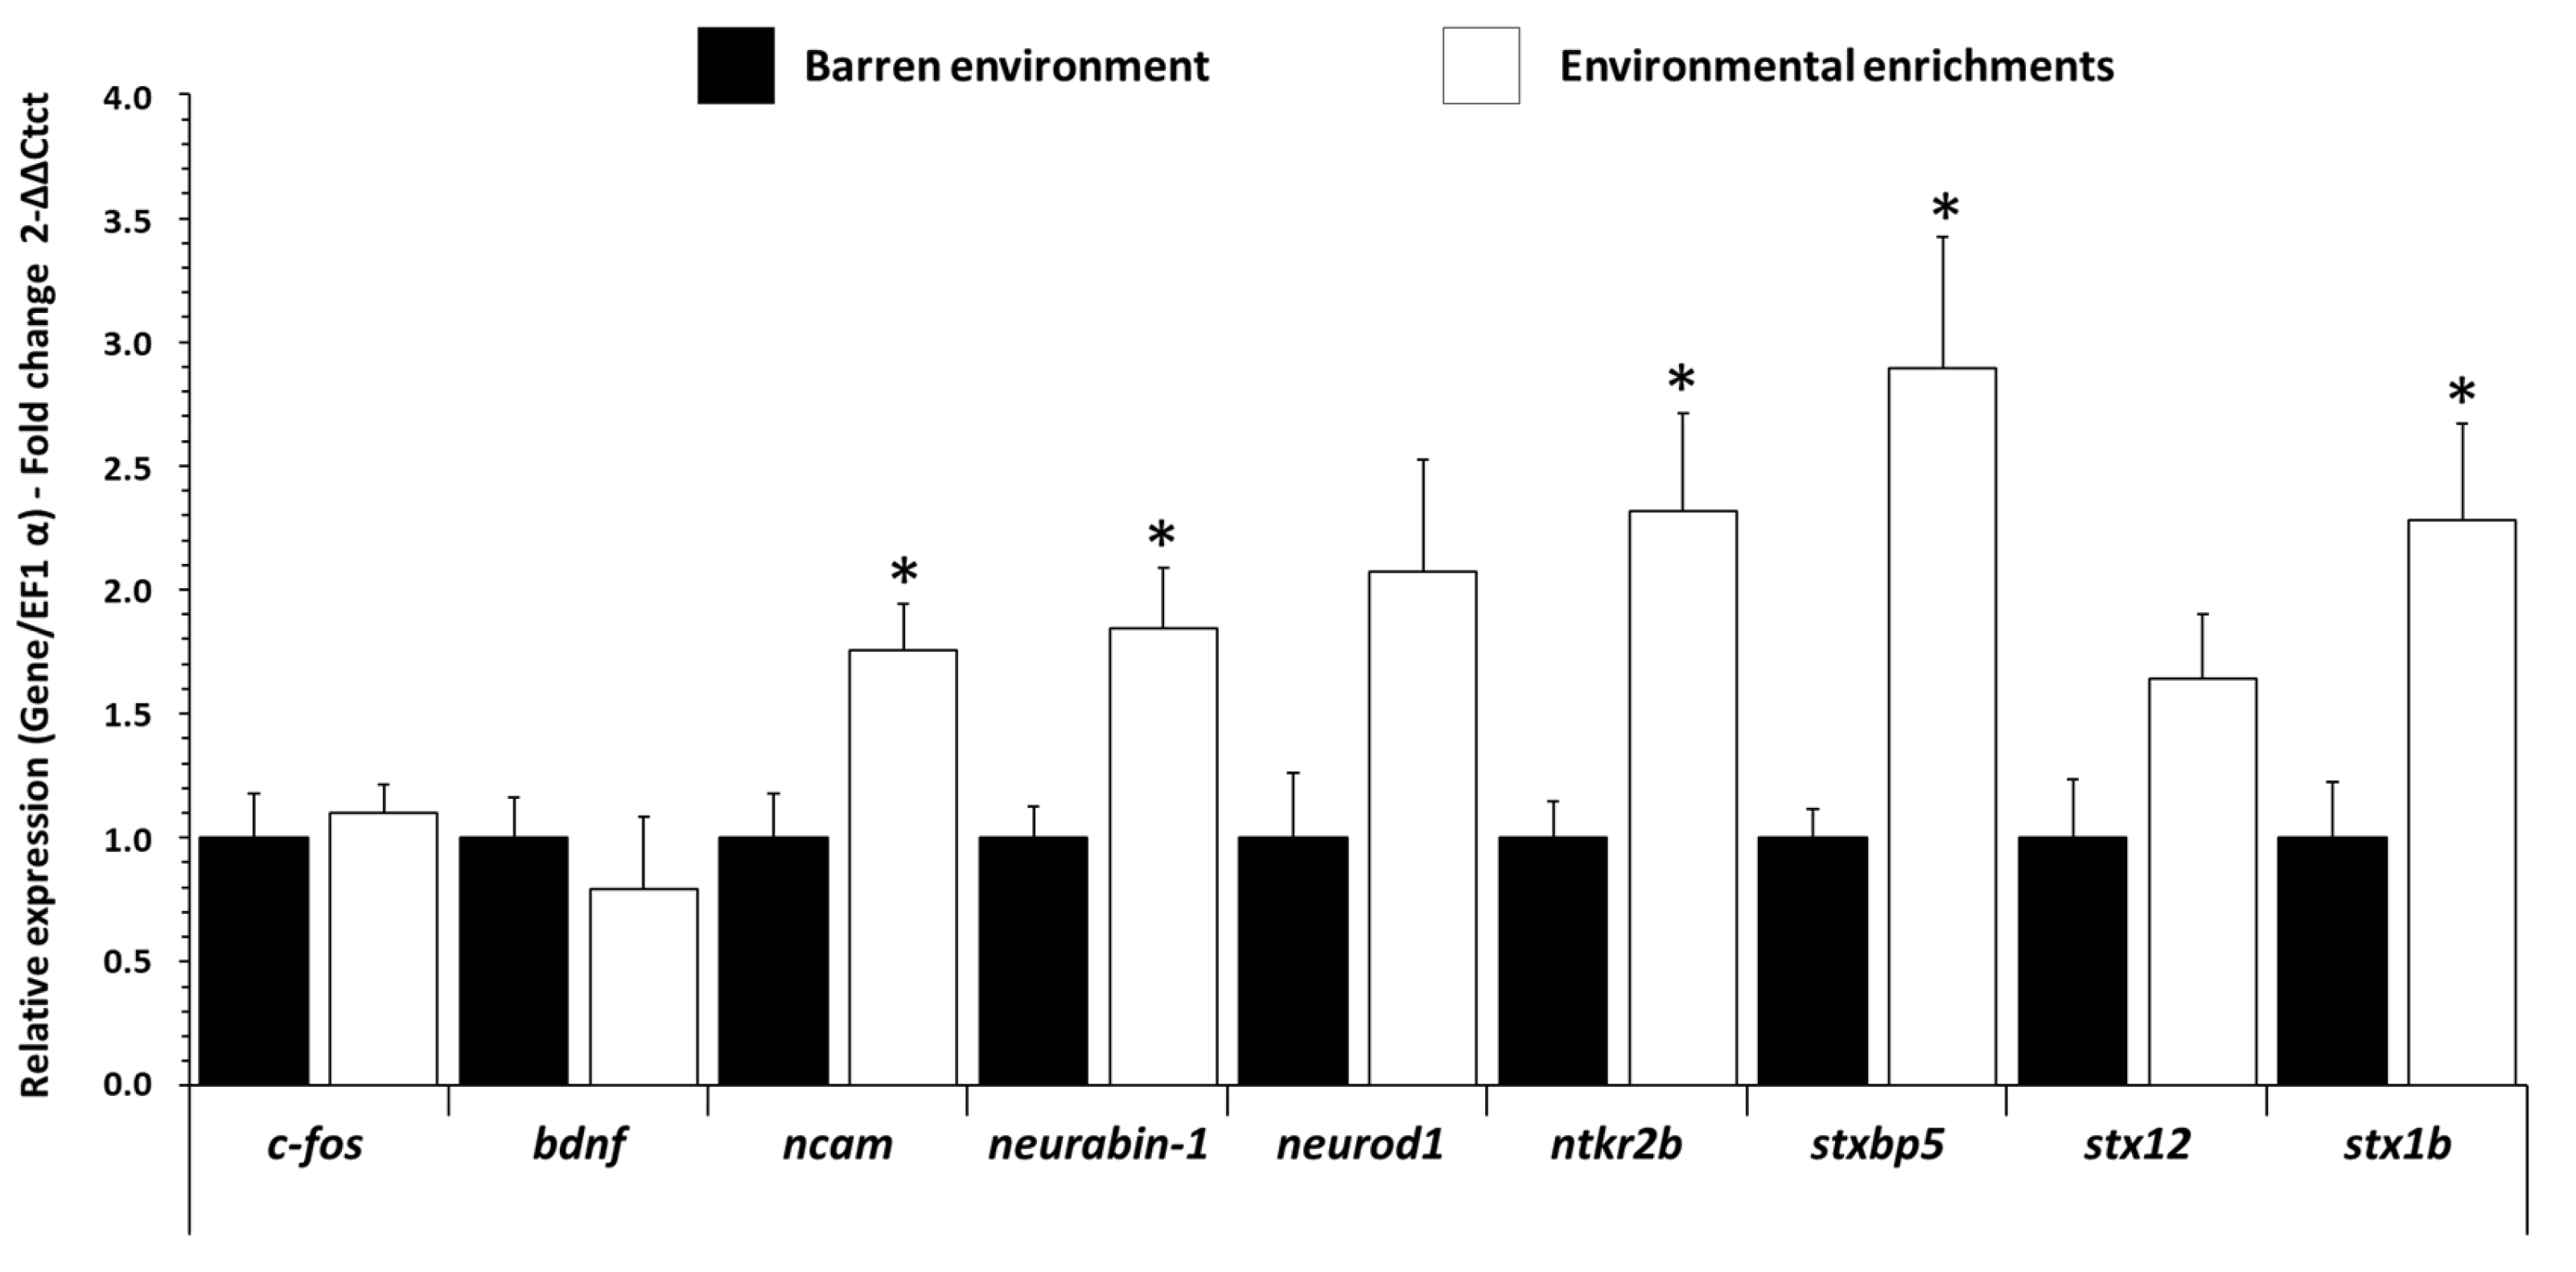
3.2. Influence of EE on mRNA Expression Levels of Neurotrophic and Synaptogenesis Gene in Trout Brain

In the forebrain, ncam (Neural Cell Adhesion Molecule, marker of neural cell migration and adhesion), neurabin-1 (marker of neurite formation), ntrk2b (neurotrophic tyrosine kinase, receptor, type 2, marker of neurons survival and differentiation), stxbp5 (Syntaxin Binding Protein 5, marker of synaptogenesis), and stx1b (Syntaxin-1b, marker of synaptogenesis) were increased (p ˂ 0.012 f = 2.948, p ˂ 0.014 f = 3.024, p ˂ 0.019 f = 3.127, p ˂ 0.011 f = 3.474, p ˂ 0.018 f = 2.84, respectively) in EE fish in comparison to BE fish (Figure 3). Other genes (c-fos, bdnf, neurod1, stx12) were not modified in the forebrain, and no mRNA-expression-levels changes were detected in the hypothalamus and hindbrain (Figure S2).

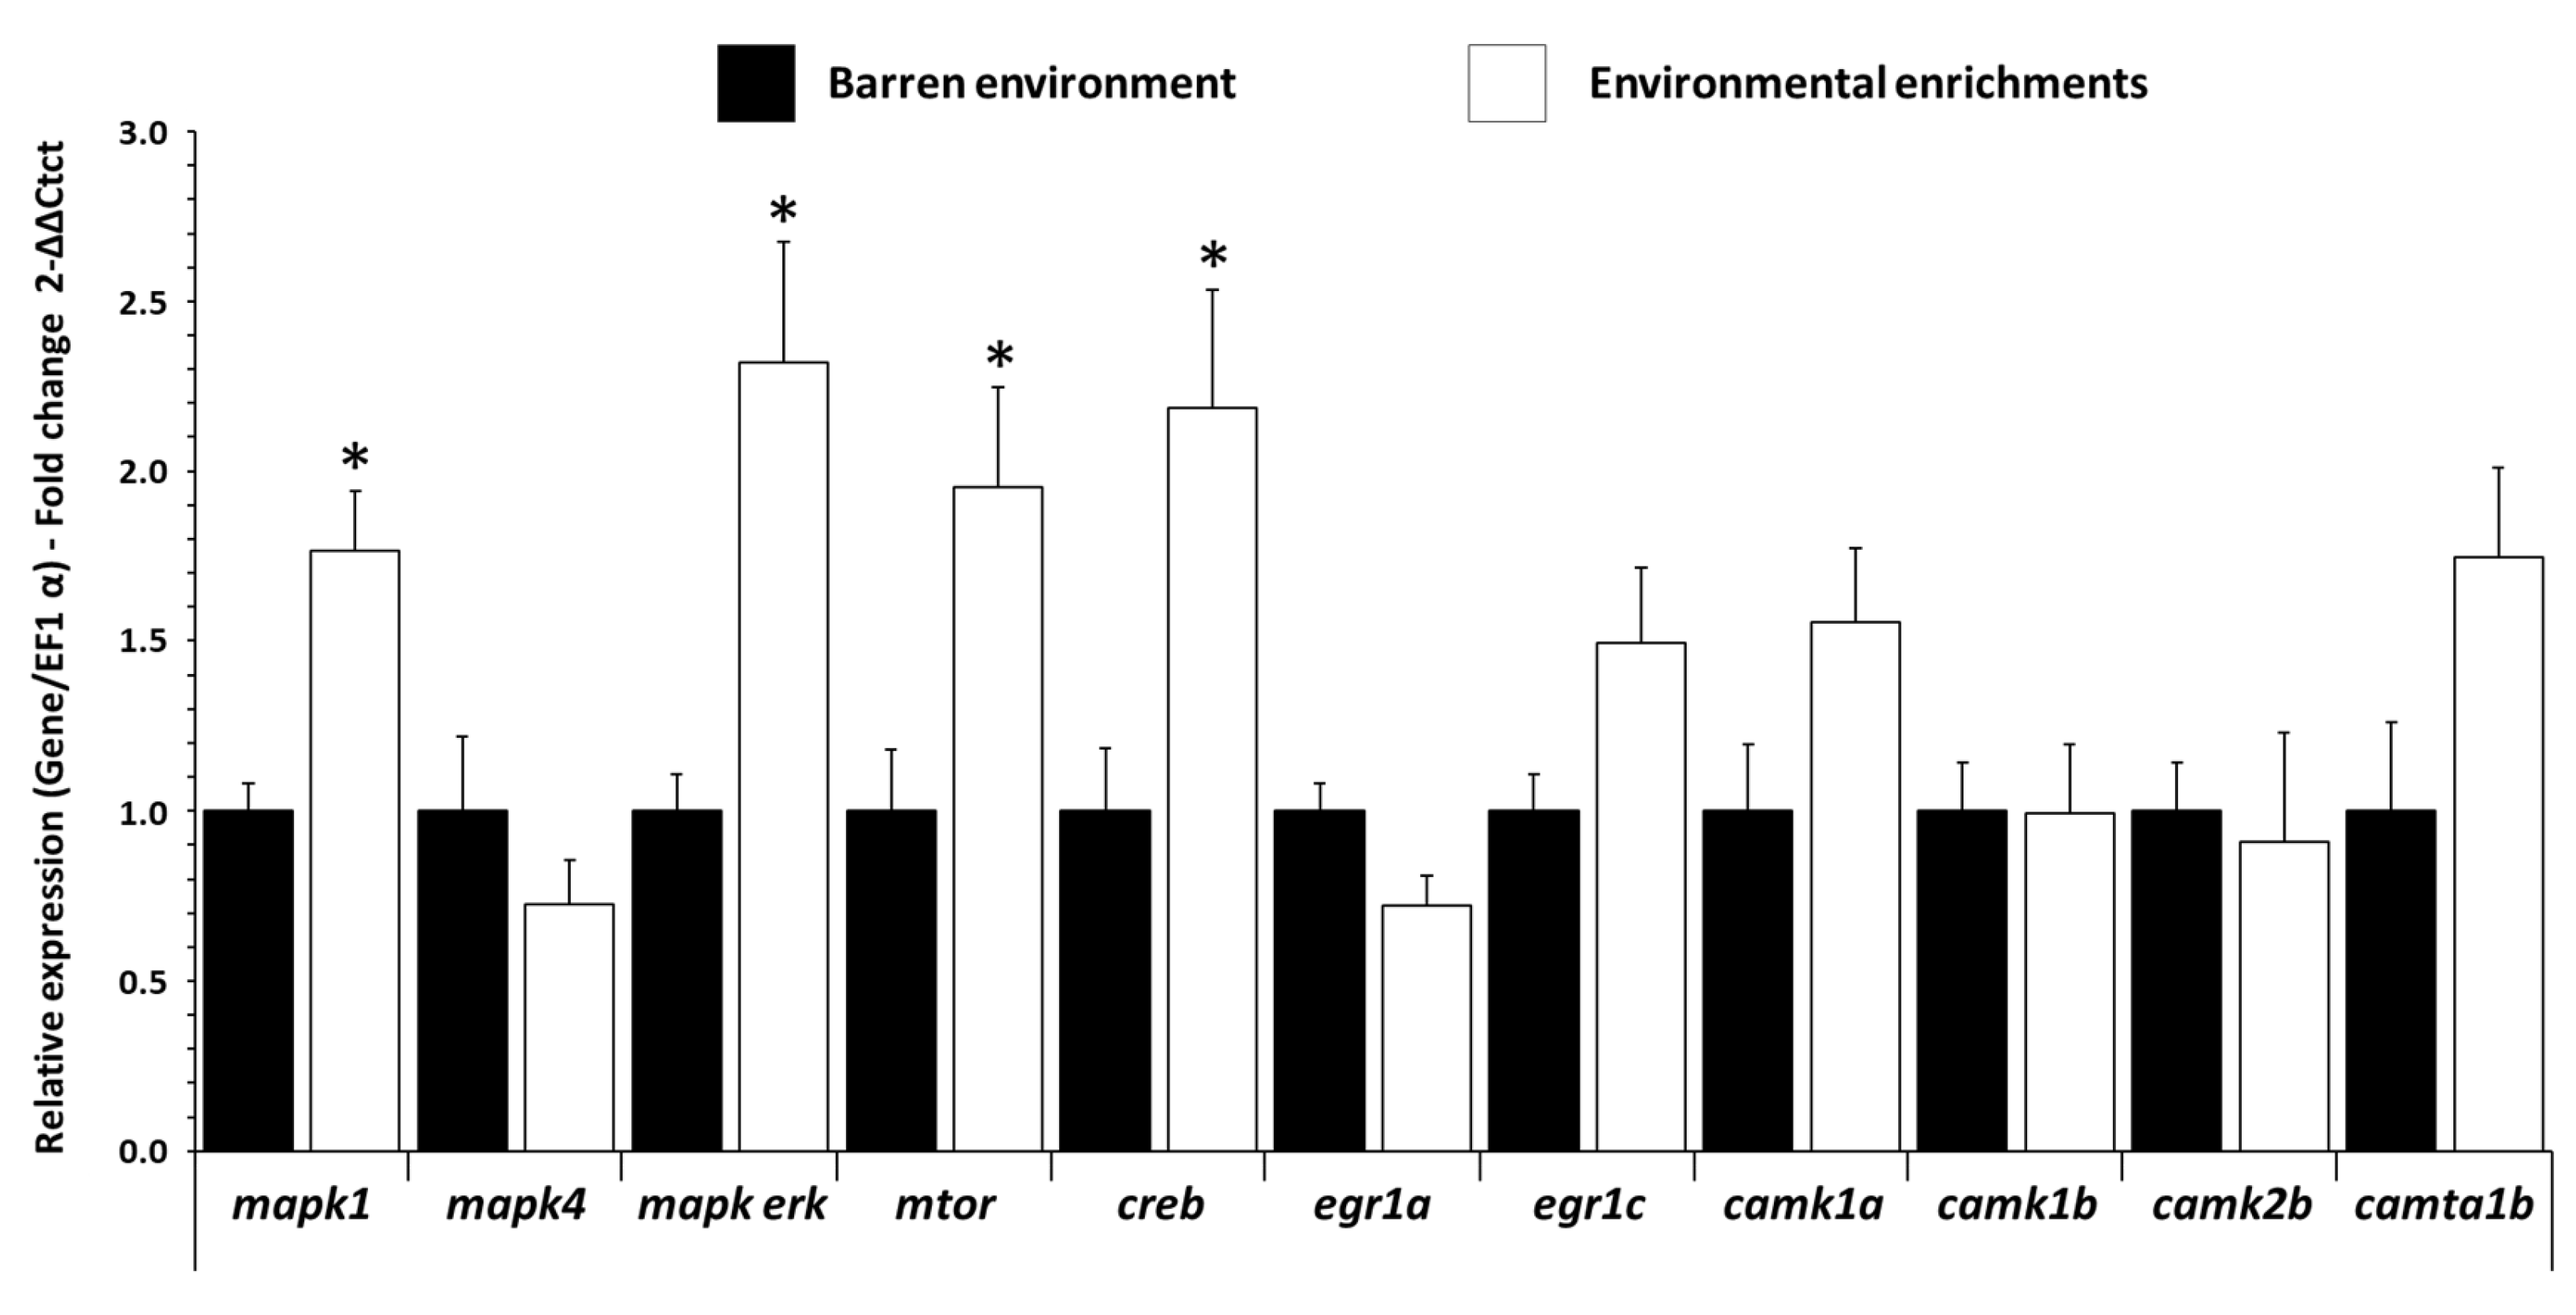
3.3. Influence of EE on mRNA Expression Levels of Plasticity Gene in Trout Brain

In the forebrain, mapk1 (Mitogen-activated protein kinase 1, marker of synaptic plasticity and cell proliferation), mapk-erk (marker of neurite formation), mtor (mammalian target of rapamycin, marker of plasticity, proliferation, growth and survival), and creb (C-AMP Response marker of synaptic plasticity and cell proliferation) were increased (p ˂ 0.003 f = 3.973, p ˂ 0.009 f = 3.552, p ˂ 0.021 f = 2.744, p ˂ 0.015 f = 2.997, respectively) in EE fish compared to BE fish (Figure 4). Other genes’ expressions (mapk4, egr1a, egr1c, camk1a, camk1b, camk2b, camta1b) were not modified in the forebrain, and no changes in mRNA levels were detected in the hypothalamus and hindbrain (Figure S3).

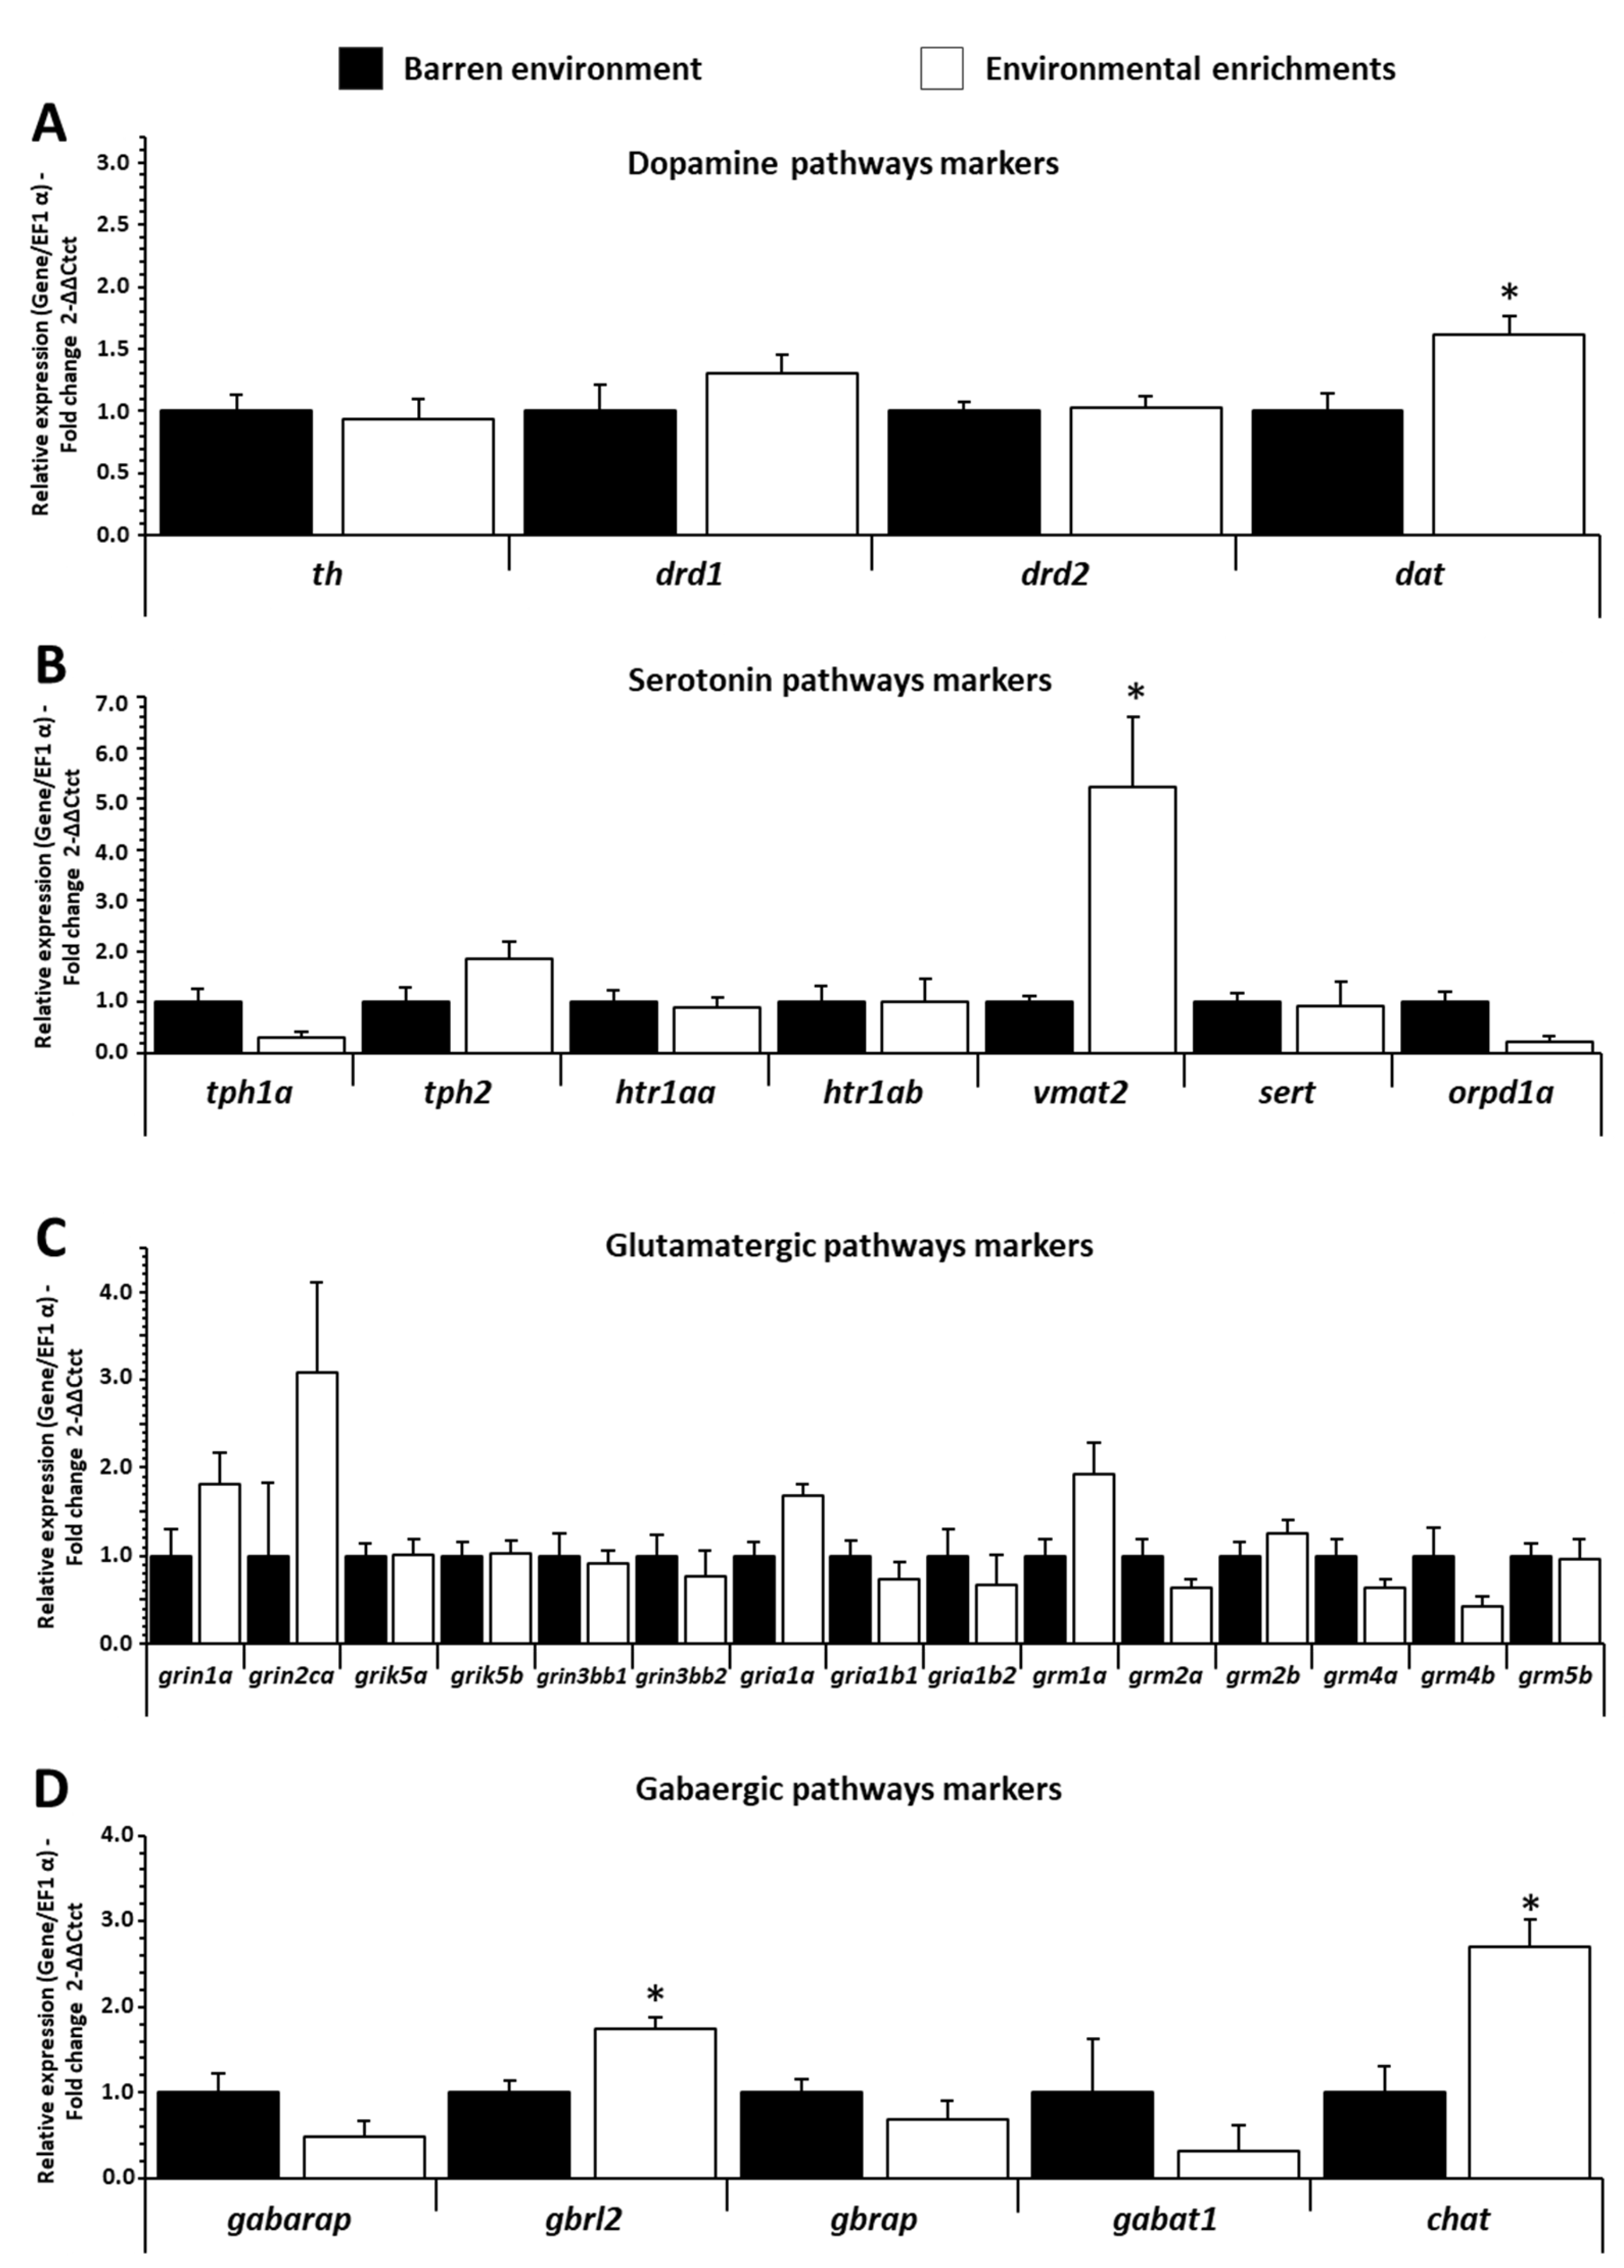
3.4. Influence of EE on mRNA Expression Levels of Neurotransmitters Pathways Gene in Trout Brain

For dopamine pathways, only dat (dopamine carrier) was increased (p ˂ 0.013 f = 2.907) in the forebrain of EE fish compared to BE fish (Figure 5A). In contrast, th (tyrosine hydroxylase enzyme), drd1, and drd2 (dopaminergic receptor) were not differentially expressed in the forebrain, and no mRNA-expression-levels changes were detected in the hypothalamus and hindbrain of trout (Figure S4A).
For serotonin pathways (Figure 5B), only mRNA vmat2 (vesicular monoamine transporter 2) in the forebrain was increased (p ˂ 0.021 f = 3.064) for EE fish compared to BE. tph1a and tph2 (precursor isoenzyme of serotonin), htr1aa and htr1ab (serotonin receptor), and sert (serotonin carrier) were not regulated in the forebrain, and no mRNA-expression-levels changes were detected in the hypothalamus and hindbrain of trout (Figure S4B).
For glutamatergic pathways (Figure 5C), for all selected genes studied, no genes (grin1a, grin2ca, grik5a, grik5b, grin3bb1, grin3bb2, gria1a, gria1b1, gria1b2, grm1a, grim2a, grim2b, grm4a, grm4b, grim5b) were regulated in the forebrain, hypothalamus, and hindbrain of trout (Figure S4C).
For gabaergic pathways (Figure 5D), gbrl2 (Gamma-aminobutyric acid (GABA) receptor-associated protein-like 2) and chat (enzyme of GABA) expression in the forebrain was increased (p ˂ 0.002 f = 3.915 and p ˂ 0.006 f = 3.614, respectively) for EE fish compared to BE. The expressions of gabarap, gbrap (GABA receptor), and gabaT1 (GABA carrier) were not different in the forebrain, and no changes were detected in the hypothalamus and hindbrain (Figure S4C).

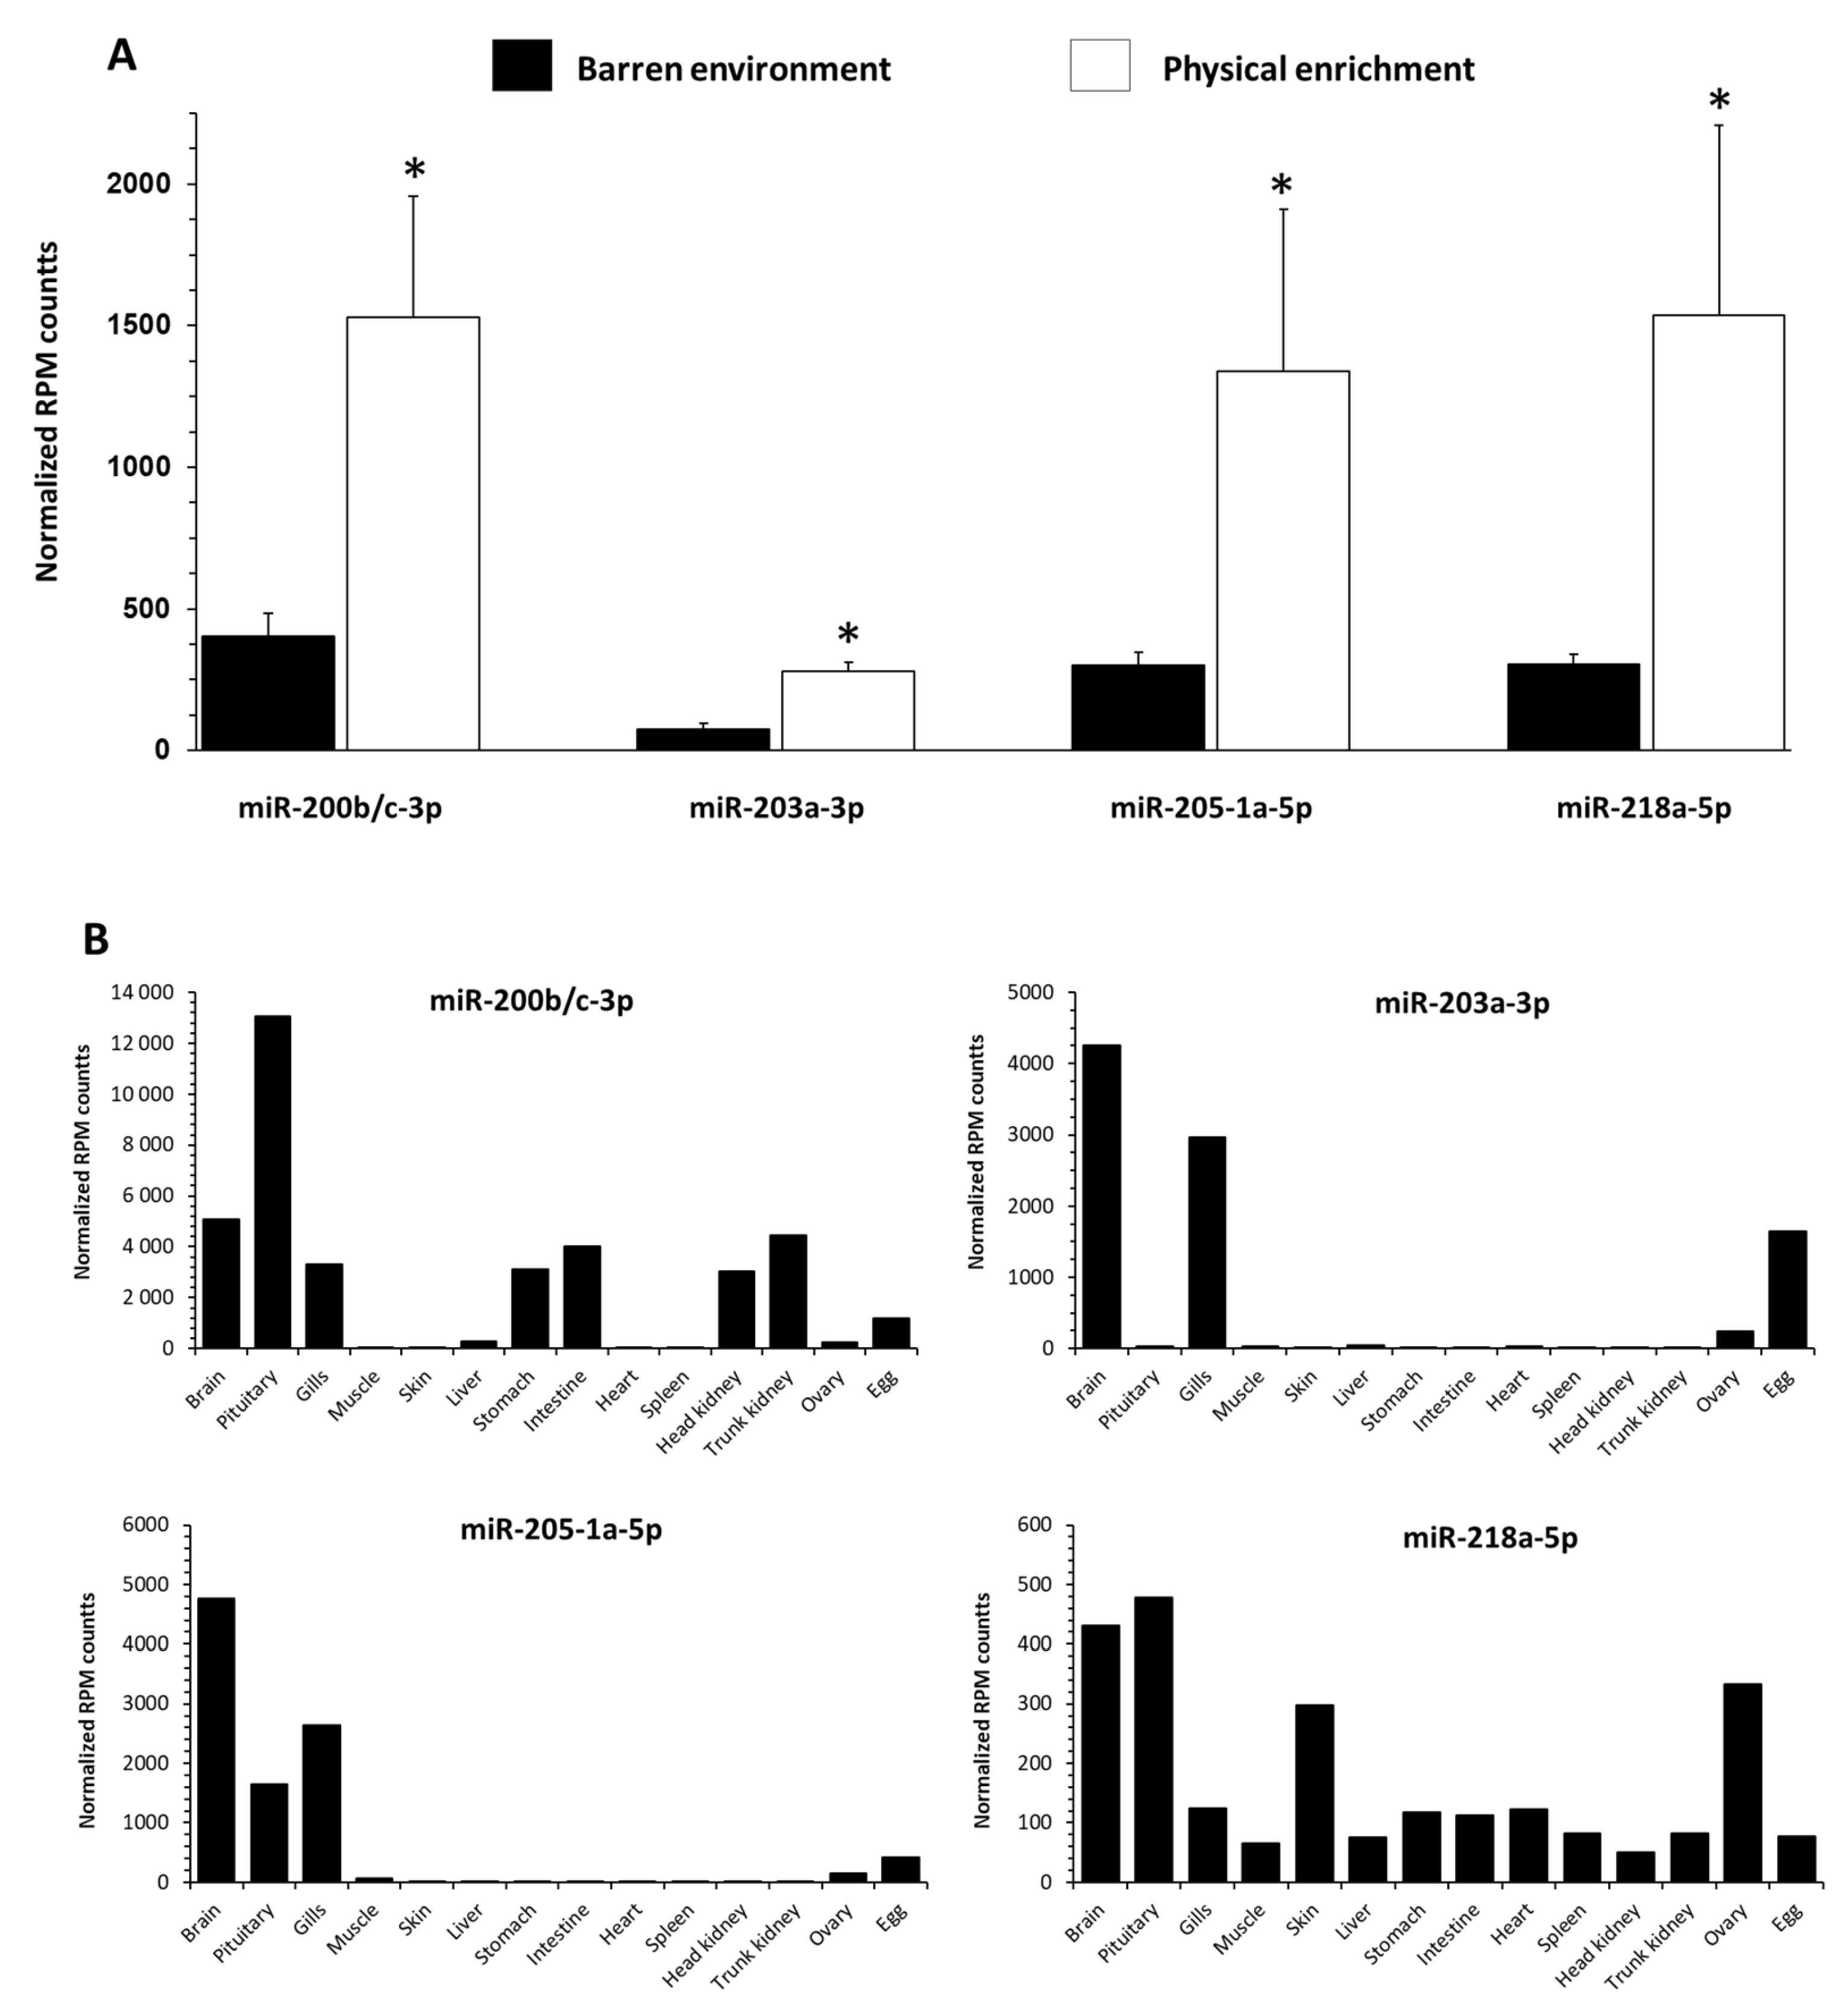
3.5. Influence of EE on Selected c-miRNAs Abundance in Blood-Plasma Fluid in RT

Among the 354 known annotated trout c-miRNAs [31], 203 were detected on average above a threshold of 10 reads per million reads (RPM). A significant upregulation of four c-miRNAs was observed in trout reared with EE: miR-203a-3p levels were increased with a log two-fold change of 1.62 (p ˂ 0.01), miR-205-1a-5p with a log two-fold change of 1.24 (p ˂ 0.01), miR-218a-5p with a log two-fold change of 1.37 (p ˂ 0.01), and miR-200b/c-3p with a log two-fold change of 1.38 (p ˂ 0.02) (Figure 6A).
The potential tissue origin of these candidate c-miRNAs was analyzed in a panel of tissues to shed light on their possible origin of expression (Figure 6B). MiR-218a-5p and miR-200b/c-3p were expressed in a wide variety of tissues with a maximum of expression in the brain (including the pituitary gland), whereas miR-203a-3p and miR-205-1a-5p appeared as predominant in the brain and gills.

4. Discussion

In this study, we observed that trout reared in an enriched environment displayed a differential expression of several genes and pathways related to plasticity, neurogenesis, and neuronal function mainly in the forebrain. The present study also demonstrated a c-miRNA signature in the plasma for fish reared in EE, suggesting their physiologically relevance as biomarker candidates for the effects of EE in trout.

4.1. EE Affects Cerebral Function in Telencephalon of Trout

In fish, numerous studies reported the impact of EE on brain development, gene expression, and behavior and learning abilities [7,9,17,43,44,45]. While these studies indicated that EE affects gene-expression patterns, it remains challenging to interpret how these neurobiological differences may be linked to behavior because very few studies have compared genes related to pathways linked to brain activity and behavior in specific brain areas between EE vs. BE, and none have compared them in trout. In the present study, all selected brain markers differentially expressed between the fish reared in BE vs. EE were mainly located in the forebrain. In vertebrates, cognitive processing is mainly under forebrain control, and, more specifically, the cerebral cortex [46]. In contrast to mammals, teleost fish do not possess a cerebral cortex. Furthermore, fish telencephalic areas (containing the amygdala and hippocampus) have been found to be functionally equivalent to mammalian forebrain regions [47,48], and fish are capable of displaying complex behaviors including decision-making and associative learning as well as the cognitive regulation of emotion, which are under forebrain regulation [49]. We previously showed that fish environmental perception, which is a cognitive process leading to various emotional states (anxiety, fearfulness, etc.) [15], is influenced by a complex and stimulating environment, [14]. Our new results suggest that, as in mammals, these cognitive EE effects are mainly under forebrain control. Environmental stimulations likely enhanced functional adaptation of this brain area via synaptic plasticity, neurogenesis, and neuronal activation, possibly causing the low-anxiety profile observed in fish raised in an environmental enrichment [14].
Among functional adaptation, it is well known that external stimulations such as those provided by the environment have a variety of effects on brain plasticity at levels ranging from the molecular and cellular to the behavioral [50]. In particular, EE induces many structural and functional changes in the brain, especially neuroplasticity, and it is noteworthy that these changes result in further beneficial effects at behavioral levels (for review, see [51]). Neuroplasticity induces cognitive and emotional changes characterized by several observed behavioral modifications: improved spatial and non-spatial learning and memory, novel object discrimination, enhanced spatial searching strategies, and decreased anxiety-like behaviors [51]. In fish, environmental complexity can lead to neural developmental and plastic modifications; and if understimulated, fish (e.g., G. morhua) develop smaller brains [52].
In the present study, we found that some brain plasticity markers were upregulated in the forebrain of enriched fish. Among the molecular brain factors revealing brain plasticity, mtor took center stage in the molecular studies of neuronal plasticity in mammals [53]. In particular, mtor allows an increase in the rate of translation in response to external stimuli, and mtor has been repeatedly shown to participate in neuronal development and the proper functioning of mature neurons enhancing neuronal survival, differentiation, and morphogenesis [54]. In mice, blocking the activity of the mTOR protein is known to trigger reduced social behavior, attention, and spatial learning [55]. In fish, mTOR is particularly important in the consolidation of long-term memory [56]. In the same way, MAPK/ERK is a protein kinase activated by neurotrophic factors involved in synapse formation and plasticity, which has a dual role in the establishment of functional synaptic connections and their short-term plasticity [57]. It is also well established that the MAPK/ERK kinase signaling cascade plays critical roles in brain development, learning and memory [58]. In addition to its role in plasticity and behavior, the ERK pathway, which can be revealed by CREB expression, is crucial in the cellular and molecular mechanisms underlying the behavioral effects related to brain plasticity [59]. All these studies in mammals suggest that molecular signaling pathways related to brain plasticity could also play a prominent role in the modification of the cognitive processes due to EE in trout. However, a more in-depth analysis, particularly at the protein level, will support this conclusion.
In addition to markers of neuroplasticity, markers of neuronal activation highlight the influence of EE on the adaptive capacity of the cerebral activation underlying the cognitive processes. Among them, the transcription factor neuronal PAS domain-containing protein 4 (npas4) has been suggested as a candidate gene in the cortex of mammals (amygdala and hippocampus), regulating anxiety or depression [60], cognition [61], and social behavior [62]. Here, we found a decrease in the expression of npas4b in the hypothalamus of EE fish. This could indicate that EE significantly stimulates the neuronal circuit of fish brain, likely explaining the decrease in the anxiety-like behaviors we previously observed in EE fish and their willingness to explore a novel surrounding perceived as less threatening than by BE fish [14].
Activation of neuronal circuits can be mapped through visualization of immediate early neurotrophic genes such as bdnf, c-fos, and neurod1. In the few fish studies, lower expression of bdnf [43] and upregulation of neurod1 [17] in the forebrain subregions associated with cognitive functions were measured in enriched salmon. However, we did not observe any change in the expression of these two genes in EE fish. The duration of the enriched period before brain-gene analyses was relatively long (i.e., three months), and transcripts were not immediately quantified after a behavioral test, which could explain that the visualization of immediate early genes bdnf and neurod1 were not different between groups. Nevertheless, with nine selected established markers, our study showed an important upregulation for five of them in EE fish. ncam, which regulates neuronal development by modulating cell adhesion and signal transduction, is known to play an important role in learning skills in mice, by enhancing stabilization of synaptic contacts [63]. This marker is also an important contributing factor to the pathophysiology of depression in mammals. Constitutive deficiency of ncam in mice resulted in impaired memory and led to an increased immobility in the tail-suspension test [64], suggesting a depression-like behavioral phenotypes [65]. In accordance with these observations in mammals, a more in-depth analysis at the protein level could suggest that ncam activity may be associated with lower anxiety-related behaviors and higher exploration for fish reared in EE. There is also some evidence indicating a possible role for the ntrk2b receptor and its ligand in learning and memory [66]. Neurotrophins, including the NTRK receptor, are involved in the alteration of hippocampal function and behavior in mammals as a susceptibility gene in neuropsychiatric disorders [67]. Overall, upregulation of neural plasticity, neurogenesis, and neuronal activation markers in the forebrain of fish reared in a complex and stimulating environment could contribute, at least in part, to enabling the behavioral plasticity and the positive emotional state observed in our previous experiment [14], as shown by a lower anxiety level and a higher motivation to explore in these fish.
Regarding neurotransmitters, there are critical neuromodulators known to play a fundamental role in a multitude of cognitive processes, including reward processing, learning, decision-making, motivation to engage in goal-orientated behaviors (e.g., eating and drinking), or positive affects [68,69]. In fish, the central neurotransmitter system also influences behavior [70] and cognitive processes [71], including neural plasticity associated with learning and memory [72,73]. For example, the serotonergic system influences behavior [70] and cognitive processes [71], including the neural plasticity associated with learning and memory [73]. EE also increases dopaminergic and serotonergic activities in fish telencephalon, in link with enhanced cognition and exploratory behavior [74]. Overall in fish, it is well known that the barren environment damaged these cognitive functions (spatial-learning ability) in striped knifejaw (Oplegnathus fasciatus) [75], rainbow trout (Oncorhynchus mykiss) [76], zebrafish (Danio rerio) [77], guppies (Poecilia reticulata) [78], and gilthead seabream (Sparus aurata) [74]. In the present experiment, despite the evidence of the impact of EE in the regulation of neurotransmitters in fish, related genes remain mainly undifferentiated between the two treatments. Of the 4 genes involved in the dopamine system, only dat was upregulated in the forebrain of EE fish; for the serotonin system, only vmat2 was upregulated in the forebrain of the 6 genes; 1 gene (gria1b1) was under-regulated in the hypothalamus of the 15 targeted genes involved in the glutaminergic system, and 2 (of the 5) genes involved in the GABAergic pathway were upregulated in the forebrain. Although few in number, the upregulated genes involved in the regulation of the central neurotransmitter system were localized in the forebrain of EE fish, supporting the role played by this brain area in the underlying effects of environmental enrichment on fish behavioral plasticity.

4.2. EE Influences Circulating miRNAs Profiles of Plasma in Trout

Besides showing that the molecular events associated with EE-induced behavioral plasticity and cognitive processes are associated with changes in gene expression, we hypothesized that this influence (and associated molecular changes) might induce changes in c-miRNAs in blood plasma. While roles for c-miRNAs in non-pathological contexts have received little attention, and data in non-human species remain scarce and mostly related to pathologies, we investigated whether changes in c-miRNAs could be linked to the behavioral plasticity observed in our enriched fish [14]. We found that four c-miRNAs, miR-200b/c-3p, miR-203-3p, miR-205-1a-5p, and miR-218a-5p, were upregulated in EE fish that could be linked to the modified cognitive perception of the environment, as shown by the fewer anxiety-like behaviors in these fish. The link between these four c-miRNAs and behavior is difficult to establish, given the lack of research on this subject in fish, especially for c-miRNA. However, a link between miR-200-3p and serotoninergic changes was established in rats [79]. More specifically related to behavior, miR-200-3p seemed to influence agonistic behavior in the Chinese mitten crab (E. sinensis) by mediating the serotonin- and dopamine-regulation mechanisms [28]. MiR-205-3p was significantly dysregulated in mice with tauopathy, a neurodegenerative disease that includes deficits in cognition, behavior, and movement [80]. In addition, miR-218-5p was one of the most significantly induced c-miRNAs in the prefrontal cortex of rats under chronic stress and plays a functional role in depression- and anxiety-like behaviors [81]. Moreover, a link between miR-218-5p and dopaminergic neurons in rats is established [82]. In our study, the upregulation of serotonin (vmat2) and dopamine transporters (dat) playing a role in the re-uptake of these monoamines could suggest changes in the activity of these neurons, thus being able to regulate cognitive functions and behaviors in fish reared in EE. These four c-miRNAs are either specific to certain tissues—this is the case of miR-205-1a-5p and miR-203a-3p, which mainly originate from the brain and gills (to a lesser extent)—or present in a majority of tissues, but with a maximum expression in the brain (miR-200b/c-3p and miR-218a-5p). The high presence of these c-miRNAs in the brain suggests that the brain could contribute to differential c-miRNA levels in blood plasma.
We, thus, provide evidence that rearing fish with EE results in the behavioral plasticity associated with brain genes’ modulations and changes in the level of certain c-miRNAs in blood plasma. Despite a lack of clear understanding of the biological roles of c-miRNAs, these promising results highlight the potential of c-miRNAs as physiologically relevant biomarkers in fish cognitive processes and behavior. Moreover, these results pave the way for the use of c-miRNAs for non-invasive phenotyping of behavioral plasticity in fish.
Finally, the results of this study illustrate that the living conditions of trout (EE vs. BE) are associated with important modifications (markers of plasticity, neurogenesis, cerebral activity) in brain regions that are key for their adaptation. Thus, these modifications illustrate that environmental conditions can have major consequences on the functioning of their brain and, potentially, on their welfare and adaptation to the proposed conditions.

5. Conclusions

Our previously published study [14] revealed important behavioral plasticity in trout, probably linked to their perception of a less-threatening environment when reared with enrichments. Perception is a cognitive process, causing different emotional states, which are mainly expressed here by lower fearfulness towards novelty and fewer anxiety-like behaviors. As far as we are aware, by complementing this previous work, we demonstrated for the first time in a teleost fish that complexifying the environment through the addition of physical structures enhances neuroplasticity, which promotes neuro-synaptogenesis and neural activation in the fish forebrain, which are important for cognitive processes, providing a neuronal foundation for the behavioral differences observed between BE and EE. This study also demonstrated a c-miRNA signature in plasma for fish reared in EE, suggesting their physiological relevance as biomarker candidates of cognition-related behavioral plasticity in trout.

Supplementary Materials

The following supporting information can be downloaded at: https://www.mdpi.com/article/10.3390/biology11081093/s1, Figure S1: Neuronal activity related mRNA level of transcripts in hypothalamus and hindbrain of RT raised in a barren environment (black) or environmental enrichment (white) during three months; Figure S2: Neurotrophic and synaptogenesis factors related mRNA level of transcripts in hypothalamus and hindbrain of RT raised in a barren environment (black) or environmental enrichment (white) during three months; Figure S3: Plasticity factors related mRNA level of transcripts in hypothalamus and hindbrain of RT raised in a barren environment (black) or environmental enrichment (white) during three months; Figure S4: Dopamine, serotonin, glutamatergic and gabaergic pathways related mRNA level of transcripts in hypothalamus and hindbrain of RT raised in a barren environment (black) or environmental enrichment (white) during three months.

Author Contributions

Formal analyses and writing, E.C., V.B., J.R. and V.C.; conceptualization, L.C., J.B., S.S.-C. and V.C.; c-miRNA molecular analyses, E.C.; bioinformatic analysis, L.M.; investigation (molecular analyses), E.B. All authors have read and agreed to the published version of the manuscript.

Funding

This work was financially supported by the French funding account CASDAR (Compte 602 d’Affectation Spéciale “Développement Agricole et Rural”), under grant agreement no. 603 19AIP5919, and by the European Commission/European Fund of Maritime Affairs and Fisheries (PhenomiR project).

Institutional Review Board Statement

The study was conducted according to the guidelines of the National Legislation on Animal Care of the French Ministry of Research (Decree No 2013–118, 1 February 2013) and in accordance with EU legal frameworks relating to the protection of animals used for scientific purposes (i.e., Directive 2010/63/EU).

Informed Consent Statement

Not applicable.

Data Availability Statement

All the data are available from the first author and can be delivered if required.

Acknowledgments

This work was performed in collaboration with Sandra Fourre at the GeT core facility, Toulouse, France (http://get.genotoul.fr, accessed on 1 July 2020), and was supported by the France Génomique National infrastructure, funded as part of the “Investissement d’avenir” program managed by the Agence Nationale pour la Recherche (contract ANR-10-INBS-09).

Conflicts of Interest

The authors declare no conflict of interest.

References

  1. Hebb, D.O. The effects of early experience on problem-solving at maturity. Am. Psychol. 1947, 2, 306–307. [Google Scholar]
  2. Bayne, K. Environmental enrichment and mouse models: Current perspectives. Anim. Model Exp. Med. 2018, 1, 82–90. [Google Scholar] [CrossRef] [Green Version]
  3. Newberry, R.C. Environmental enrichment: Increasing the biological relevance of captive environments. Appl. Anim. Behav. Sci. 1995, 44, 229–243. [Google Scholar] [CrossRef]
  4. Arechavala-Lopez, P.; Cabrera-Álvarez, M.J.; Maia, C.M.; Saraiva, J.L. Environmental enrichment in fish aquaculture: A review of fundamental and practical aspects. Rev. Aquac. 2022, 14, 704–728. [Google Scholar] [CrossRef]
  5. Corcoran, M. Environmental enrichment for aquatic animals. Vet. Clin. N. Am. Exot. Anim. Pract. 2015, 18, 305–321. [Google Scholar] [CrossRef] [PubMed]
  6. Näslund, J.; Johnsson, J.I. Environmental enrichment for fish in captive environments: Effects of physical structures and substrates. Fish Fish. 2016, 17, 1–30. [Google Scholar] [CrossRef]
  7. Salvanes, A.G.V.; Moberg, O.; Ebbesson, L.O.E.; Nilsen, T.O.; Jensen, K.H.; Braithwaite, V.A. Environmental enrichment promotes neural plasticity and cognitive ability in fish. Proc. Biol. Sci. 2013, 280, 20131331. [Google Scholar] [CrossRef]
  8. Kadry, V.O.; Barreto, R.E. Environmental enrichment reduces aggression of pearl cichlid, Geophagus brasiliensis, during resident-intruder interactions. Neotrop. Ichthyol. 2010, 8, 329–332. [Google Scholar] [CrossRef] [Green Version]
  9. Reiser, S.; Pohlmann, D.M.; Blancke, T.; Koops, U.; Trautner, J. Environmental enrichment during early rearing provokes epigenetic changes in the brain of a salmonid fish. Comp. Biochem. Physiol. Part D Genom. Proteom. 2021, 39, 100838. [Google Scholar] [CrossRef]
  10. Brydges, N.M.; Braithwaite, V.A. Does environmental enrichment affect the behaviour of fish commonly used in laboratory work? Appl. Anim. Behav. Sci. 2009, 118, 137–143. [Google Scholar] [CrossRef]
  11. Naslund, J.; Rosengren, M.; Johnsson, J. Fish density, but not environmental enrichment, affects the size of cerebellum in the brain of juvenile hatchery-reared Atlantic salmon. Environ. Biol. Fishes 2019, 102, 705–712. [Google Scholar] [CrossRef] [Green Version]
  12. Toli, E.A.; Noreikiene, K.; DeFaveri, J.; Merilä, J. Environmental enrichment, sexual dimorphism, and brain size in sticklebacks. Ecol. Evol. 2017, 7, 1691–1698. [Google Scholar] [CrossRef] [PubMed]
  13. Jones, N.A.R.; Webster, M.M.; Salvanes, A.G.V. Physical enrichment research for captive fish: Time to focus on the DETAILS. J. Fish Biol. 2021, 99, 704–725. [Google Scholar] [CrossRef] [PubMed]
  14. Brunet, V.; Kleiber, A.; Patinote, A.; Sudan, P.-L.; Duret, C.; Gourmelen, G.; Moreau, E.; Fournel, C.; Pineau, L.; Calvez, S.; et al. Positive welfare effects of physical enrichments from the nature-, functions- and feeling- based approaches in farmed rainbow trout (Oncorhynchus mykiss). Aquaculture 2022, 550, 737825. [Google Scholar] [CrossRef]
  15. Shettleworth, S.J. Clever animals and killjoy explanations in comparative psychology. Trends Cogn. Sci. 2010, 14, 477–481. [Google Scholar] [CrossRef]
  16. Ebbesson, L.O.E.; Braithwaite, V.A. Environmental effects on fish neural plasticity and cognition. J. Fish Biol. 2012, 81, 2151–2174. [Google Scholar] [CrossRef]
  17. Kihslinger, R.L.; Nevitt, G.A. Early rearing environment impacts cerebellar growth in juvenile salmon. J. Exp. Biol. 2006, 209, 504–509. [Google Scholar] [CrossRef] [Green Version]
  18. DePasquale, C.; Neuberger, T.; Hirrlinger, A.M.; Braithwaite, V.A. The influence of complex and threatening environments in early life on brain size and behaviour. Proc. Biol. Sci. 2016, 283, 20152564. [Google Scholar] [CrossRef] [Green Version]
  19. Turschwell, M.P.; White, C.R. The effects of laboratory housing and spatial enrichment on brain size and metabolic rate in the eastern mosquitofish, Gambusia holbrooki. Biol. Open 2016, 5, 205–210. [Google Scholar] [CrossRef] [Green Version]
  20. Von Krogh, K.; Sørensen, C.; Nilsson, G.E.; Øverli, Ø. Forebrain cell proliferation, behavior, and physiology of zebrafish, Danio rerio, kept in enriched or barren environments. Physiol. Behav. 2010, 101, 32–39. [Google Scholar] [CrossRef]
  21. Dunlap, K.D.; Silva, A.C.; Chung, M. Environmental complexity, seasonality and brain cell proliferation in a weakly electric fish, Brachyhypopomus gauderio. J. Exp. Biol. 2011, 214, 794–805. [Google Scholar] [CrossRef] [PubMed] [Green Version]
  22. Schouten, M.; Aschrafi, A.; Bielefeld, P.; Doxakis, E.; Fitzsimons, C.P. microRNAs and the regulation of neuronal plasticity under stress conditions. Neuroscience 2013, 241, 188–205. [Google Scholar] [CrossRef] [PubMed]
  23. Fiorenza, A.; Barco, A. Role of Dicer and the miRNA system in neuronal plasticity and brain function. Neurobiol. Learn. Mem. 2016, 135, 3–12. [Google Scholar] [CrossRef]
  24. Bao, T.; Miao, W.; Han, J.; Yin, M.; Yan, Y.; Wang, W.; Zhu, Y. Spontaneous running wheel improves cognitive functions of mouse associated with miRNA expressional alteration in hippocampus following traumatic brain injury. J. Mol. Neurosci. 2014, 54, 622–629. [Google Scholar] [CrossRef] [PubMed]
  25. Chandrasekar, V.; Dreyer, J.-L. Regulation of MiR-124, Let-7d, and MiR-181a in the accumbens affects the expression, extinction, and reinstatement of cocaine-induced conditioned place preference. Neuropsychopharmacology 2011, 36, 1149–1164. [Google Scholar] [CrossRef]
  26. Schaefer, A.; Im, H.-I.; Venø, M.T.; Fowler, C.D.; Min, A.; Intrator, A.; Kjems, J.; Kenny, P.J.; O’Carroll, D.; Greengard, P. Argonaute 2 in dopamine 2 receptor-expressing neurons regulates cocaine addiction. J. Exp. Med. 2010, 207, 1843–1851. [Google Scholar] [CrossRef] [PubMed] [Green Version]
  27. Greenberg, J.K.; Xia, J.; Zhou, X.; Thatcher, S.R.; Gu, X.; Ament, S.A.; Newman, T.C.; Green, P.J.; Zhang, W.; Robinson, G.E.; et al. Behavioral plasticity in honey bees is associated with differences in brain microRNA transcriptome. Genes Brain Behav. 2012, 11, 660–670. [Google Scholar] [CrossRef] [Green Version]
  28. Pang, Y.; He, L.; Song, Y.; Song, X.; Lv, J.; Cheng, Y.; Yang, X. Identification and Integrated Analysis of MicroRNA and mRNA Expression Profiles During Agonistic Behavior in Chinese Mitten Crab (Eriocheir sinensis) Using a Deep Sequencing Approach. Front. Genet. 2020, 11, 321. [Google Scholar] [CrossRef]
  29. Weber, J.A.; Baxter, D.H.; Zhang, S.; Huang, D.Y.; Huang, K.H.; Lee, M.J.; Galas, D.J.; Wang, K. The microRNA spectrum in 12 body fluids. Clin. Chem. 2010, 56, 1733–1741. [Google Scholar] [CrossRef]
  30. Mitchell, P.S.; Parkin, R.K.; Kroh, E.M.; Fritz, B.R.; Wyman, S.K.; Pogosova-Agadjanyan, E.L.; Peterson, A.; Noteboom, J.; O’Briant, K.C.; Allen, A.; et al. Circulating microRNAs as stable blood-based markers for cancer detection. Proc. Natl. Acad. Sci. USA 2008, 105, 10513–10518. [Google Scholar] [CrossRef] [Green Version]
  31. Cardona, E.; Guyomar, C.; Desvignes, T.; Montfort, J.; Guendouz, S.; Postlethwait, J.H.; Skiba-Cassy, S.; Bobe, J. Circulating miRNA repertoire as a biomarker of metabolic and reproductive states in rainbow trout. BMC Biol. 2021, 19, 235. [Google Scholar] [CrossRef] [PubMed]
  32. Roy, J.; Vigor, C.; Vercauteren, J.; Reversat, G.; Zhou, B.; Surget, A.; Larroquet, L.; Lanuque, A.; Sandres, F.; Terrier, F.; et al. Characterization and modulation of brain lipids content of rainbow trout fed with 100% plant based diet rich in omega-3 long chain polyunsaturated fatty acids DHA and EPA. Biochimie 2020, 178, 137–147. [Google Scholar] [CrossRef] [PubMed]
  33. Roy, J.; Terrier, F.; Marchand, M.; Herman, A.; Heraud, C.; Surget, A.; Lanuque, A.; Sandres, F.; Marandel, L. Effects of Low Stocking Densities on Zootechnical Parameters and Physiological Responses of Rainbow Trout (Oncorhynchus mykiss) Juveniles. Biology 2021, 10, 1040. [Google Scholar] [CrossRef] [PubMed]
  34. Roy, J.; Larroquet, L.; Surget, A.; Lanuque, A.; Sandres, F.; Terrier, F.; Corraze, G.; Lee, J.C.; Skiba-Cassy, S. Impact on cerebral function in rainbow trout fed with plant based omega-3 long chain polyunsaturated fatty acids enriched with DHA and EPA. Fish Shellfish Immunol. 2020, 103, 409–420. [Google Scholar] [CrossRef] [PubMed]
  35. Roy, J.; Baranek, E.; Mercier, Y.; Larroquet, L.; Surget, A.; Ganot, A.; Sandres, F.; Lanuque, A.; Terrier, F.; Briand, L. Involvement of Taste Receptors in the Oro-Sensory Perception of Nutrients in Rainbow Trout (Oncorhynchus mikyss) Fed Diets with Different Fatty Acid Profiles. Aquac. Nutr. 2022, 2022, e1152463. [Google Scholar] [CrossRef]
  36. Pfaffl, M.W. A new mathematical model for relative quantification in real-time RT-PCR. Nucleic Acids Res. 2001, 29, e45. [Google Scholar] [CrossRef]
  37. Heraud, C.; Hirschinger, T.; Baranek, E.; Larroquet, L.; Surget, A.; Sandres, F.; Lanuque, A.; Terrier, F.; Roy, J. Detection and Modulation of Olfactory Sensing Receptors in Carnivorous Rainbow Trout (Oncorhynchus mykiss) Fed from First Feeding with Plant-Based Diet. Int. J. Mol. Sci. 2022, 23, 2123. [Google Scholar] [CrossRef] [PubMed]
  38. Rozen, S.; Skaletsky, H. Primer3 on the WWW for general users and for biologist programmers. Methods Mol. Biol. 2000, 132, 365–386. [Google Scholar] [CrossRef] [Green Version]
  39. Miandare, H.K.; Farahmand, H.; Akbarzadeh, A.; Ramezanpour, S.; Kaiya, H.; Miyazato, M.; Rytkönen, K.T.; Nikinmaa, M. Developmental transcription of genes putatively associated with growth in two sturgeon species of different growth rate. Gen. Comp. Endocrinol. 2012, 182, 41–47. [Google Scholar] [CrossRef]
  40. Desvignes, T.; Batzel, P.; Sydes, J.; Eames, B.F.; Postlethwait, J.H. miRNA analysis with Prost! reveals evolutionary conservation of organ-enriched expression and post-transcriptional modifications in three-spined stickleback and zebrafish. Sci Rep. 2019, 9, 3913. [Google Scholar] [CrossRef] [Green Version]
  41. Love, M.I.; Huber, W.; Anders, S. Moderated estimation of fold change and dispersion for RNA-seq data with DESeq2. Genome Biol. 2014, 15, 550. [Google Scholar] [CrossRef] [PubMed] [Green Version]
  42. Juanchich, A.; Bardou, P.; Rué, O.; Gabillard, J.-C.; Gaspin, C.; Bobe, J.; Guiguen, Y. Characterization of an extensive rainbow trout miRNA transcriptome by next generation sequencing. BMC Genom. 2016, 17, 164. [Google Scholar] [CrossRef] [PubMed]
  43. Mes, D.; van Os, R.; Gorissen, M.; Ebbesson, L.O.E.; Finstad, B.; Mayer, I.; Vindas, M.A. Effects of environmental enrichment on forebrain neural plasticity and survival success of stocked Atlantic salmon. J. Exp. Biol. 2019, 222, jeb212258. [Google Scholar] [CrossRef]
  44. Brockmark, S.; Adriaenssens, B.; Johnsson, J.I. Less is more: Density influences the development of behavioural life skills in trout. Proc. Biol. Sci. 2010, 277, 3035–3043. [Google Scholar] [CrossRef] [PubMed] [Green Version]
  45. Evans, M.L.; Hori, T.S.; Rise, M.L.; Fleming, I.A. Transcriptomic responses of Atlantic salmon (Salmo salar) to environmental enrichment during juvenile rearing. PLoS ONE 2015, 10, e0118378. [Google Scholar] [CrossRef] [PubMed] [Green Version]
  46. Salzman, C.D.; Fusi, S. Emotion, cognition, and mental state representation in amygdala and prefrontal cortex. Annu. Rev. Neurosci. 2010, 33, 173–202. [Google Scholar] [CrossRef] [PubMed] [Green Version]
  47. Northcutt, R.G. Evolution of the telencephalon in nonmammals. Annu. Rev. Neurosci. 1981, 4, 301–350. [Google Scholar] [CrossRef]
  48. Wullimann, M.F.; Mueller, T. Teleostean and mammalian forebrains contrasted: Evidence from genes to behavior. J. Comp. Neurol. 2004, 475, 143–162. [Google Scholar] [CrossRef]
  49. Bshary, R.; Brown, C. Fish cognition. Curr. Biol. 2014, 24, R947–R950. [Google Scholar] [CrossRef] [Green Version]
  50. Kondo, M. Molecular mechanisms of experience-dependent structural and functional plasticity in the brain. Anat. Sci. Int. 2017, 92, 1–17. [Google Scholar] [CrossRef]
  51. Alwis, D.S.; Rajan, R. Environmental enrichment and the sensory brain: The role of enrichment in remediating brain injury. Front. Syst. Neurosci. 2014, 8, 156. [Google Scholar] [CrossRef] [PubMed] [Green Version]
  52. Mayer, I.; Meager, J.; Skjæraasen, J.E.; Rodewald, P.; Sverdrup, G.; Fernö, A. Domestication causes rapid changes in heart and brain morphology in Atlantic cod (Gadus morhua). Environ. Biol Fish. 2011, 92, 181–186. [Google Scholar] [CrossRef]
  53. Switon, K.; Kotulska, K.; Janusz-Kaminska, A.; Zmorzynska, J.; Jaworski, J. Molecular neurobiology of mTOR. Neuroscience 2017, 341, 112–153. [Google Scholar] [CrossRef] [Green Version]
  54. Bockaert, J.; Marin, P. mTOR in Brain Physiology and Pathologies. Physiol. Rev. 2015, 95, 1157–1187. [Google Scholar] [CrossRef] [PubMed]
  55. Zhou, J.; Blundell, J.; Ogawa, S.; Kwon, C.-H.; Zhang, W.; Sinton, C.; Powell, C.M.; Parada, L.F. Pharmacological inhibition of mTORC1 suppresses anatomical, cellular, and behavioral abnormalities in neural-specific Pten knock-out mice. J. Neurosci. 2009, 29, 1773–1783. [Google Scholar] [CrossRef] [PubMed] [Green Version]
  56. Da Peixoto, C.; Parfitt, G.M.; Bruch, G.E.; Cordeiro, M.F.; Almeida, D.V.; Marins, L.F.F.; Barros, D.M. Effects of learning on mTOR pathway gene expression in the brain of zebrafish (Danio rerio) of different ages. Exp. Gerontol. 2017, 89, 8–14. [Google Scholar] [CrossRef]
  57. Giachello, C.N.G.; Fiumara, F.; Giacomini, C.; Corradi, A.; Milanese, C.; Ghirardi, M.; Benfenati, F.; Montarolo, P.G. MAPK/Erk-dependent phosphorylation of synapsin mediates formation of functional synapses and short-term homosynaptic plasticity. J. Cell Sci. 2010, 123, 881–893. [Google Scholar] [CrossRef] [Green Version]
  58. Samuels, I.S.; Saitta, S.C.; Landreth, G.E. MAP’ing CNS development and cognition: An ERKsome process. Neuron 2009, 61, 160–167. [Google Scholar] [CrossRef] [Green Version]
  59. Ciccarelli, A.; Giustetto, M. Role of ERK signaling in activity-dependent modifications of histone proteins. Neuropharmacology 2014, 80, 34–44. [Google Scholar] [CrossRef]
  60. Guidotti, G.; Calabrese, F.; Auletta, F.; Olivier, J.; Racagni, G.; Homberg, J.; Riva, M.A. Developmental influence of the serotonin transporter on the expression of npas4 and GABAergic markers: Modulation by antidepressant treatment. Neuropsychopharmacol. Publ. Am. Coll. Neuropsychopharmacol. 2012, 37, 746–758. [Google Scholar] [CrossRef] [Green Version]
  61. Coutellier, L.; Beraki, S.; Ardestani, P.M.; Saw, N.L.; Shamloo, M. Npas4: A neuronal transcription factor with a key role in social and cognitive functions relevant to developmental disorders. PLoS ONE 2012, 7, e46604. [Google Scholar] [CrossRef] [Green Version]
  62. Jaehne, E.J.; Klarić, T.S.; Koblar, S.A.; Baune, B.T.; Lewis, M.D. Effects of Npas4 deficiency on anxiety, depression-like, cognition and sociability behaviour. Behav. Brain Res. 2015, 281, 276–282. [Google Scholar] [CrossRef] [PubMed]
  63. Hartz, B.P.; Rønn, L.C.B. NCAM in long-term potentiation and learning. Adv. Exp. Med. Biol. 2010, 663, 257–270. [Google Scholar] [CrossRef]
  64. Aonurm-Helm, A.; Jurgenson, M.; Zharkovsky, T.; Sonn, K.; Berezin, V.; Bock, E.; Zharkovsky, A. Depression-like behaviour in neural cell adhesion molecule (NCAM)-deficient mice and its reversal by an NCAM-derived peptide, FGL. Eur. J. Neurosci. 2008, 28, 1618–1628. [Google Scholar] [CrossRef]
  65. Jürgenson, M.; Aonurm-Helm, A.; Zharkovsky, A. Partial reduction in neural cell adhesion molecule (NCAM) in heterozygous mice induces depression-related behaviour without cognitive impairment. Brain Res. 2012, 1447, 106–118. [Google Scholar] [CrossRef] [PubMed]
  66. Sahún, I.; Delgado-García, J.M.; Amador-Arjona, A.; Giralt, A.; Alberch, J.; Dierssen, M.; Gruart, A. Dissociation between CA3-CA1 synaptic plasticity and associative learning in TgNTRK3 transgenic mice. J. Neurosci. 2007, 27, 2253–2260. [Google Scholar] [CrossRef] [PubMed]
  67. Otnaess, M.K.; Djurovic, S.; Rimol, L.M.; Kulle, B.; Kähler, A.K.; Jönsson, E.G.; Agartz, I.; Sundet, K.; Hall, H.; Timm, S.; et al. Evidence for a possible association of neurotrophin receptor (NTRK-3) gene polymorphisms with hippocampal function and schizophrenia. Neurobiol. Dis. 2009, 34, 518–524. [Google Scholar] [CrossRef] [PubMed]
  68. Howe, M.W.; Dombeck, D.A. Rapid signalling in distinct dopaminergic axons during locomotion and reward. Nature 2016, 535, 505–510. [Google Scholar] [CrossRef] [Green Version]
  69. Meneses, A.; Liy-Salmeron, G. Serotonin and emotion, learning and memory. Rev. Neurosci. 2012, 23, 543–553. [Google Scholar] [CrossRef]
  70. Winberg, S.; Nilsson, G.E. Time Course of Changes in Brain Serotonergic Activity and Brain Tryptophan Levels in Dominant and Subordinate Juvenile Arctic Charr. J. Exp. Biol. 1993, 179, 181–195. [Google Scholar] [CrossRef]
  71. Whitaker, K.W.; Neumeister, H.; Huffman, L.S.; Kidd, C.E.; Preuss, T.; Hofmann, H.A. Serotonergic modulation of startle-escape plasticity in an African cichlid fish: A single-cell molecular and physiological analysis of a vital neural circuit. J Neurophysiol. 2011, 106, 127–137. [Google Scholar] [CrossRef] [PubMed] [Green Version]
  72. Ersoy, A.; Waller, M.D. Neurogenesis in adulthood: A possible role in learning. Trends Cogn Sci. 1999, 3, 186–192. [Google Scholar] [CrossRef]
  73. Wood, L.S.; Desjardins, J.K.; Fernald, R.D. Effects of stress and motivation on performing a spatial task. Neurobiol. Learn. Mem. 2011, 95, 277–285. [Google Scholar] [CrossRef] [PubMed] [Green Version]
  74. Arechavala-Lopez, P.; Caballero-Froilán, J.C.; Jiménez-García, M.; Capó, X.; Tejada, S.; Saraiva, J.L.; Sureda, A.; Moranta, D. Enriched environments enhance cognition, exploratory behaviour and brain physiological functions of Sparus aurata. Sci. Rep. 2020, 10, 11252. [Google Scholar] [CrossRef]
  75. Makino, H.; Masuda, R.; Tanaka, M. Environmental stimuli improve learning capability in striped knifejaw juveniles: The stage-specific effect of environmental enrichment and the comparison between wild and hatchery-reared fish. Fish. Sci. 2015, 81, 1035–1042. [Google Scholar] [CrossRef] [Green Version]
  76. Bergendahl, I.A.; Salvanes, A.G.V.; Braithwaite, V.A. Determining the effects of duration and recency of exposure to environmental enrichment. Appl. Anim. Behav. Sci. 2016, 176, 163–169. [Google Scholar] [CrossRef] [Green Version]
  77. Roy, T.; Bhat, A. Learning and Memory in Juvenile Zebrafish: What makes the Difference—Population or Rearing Environment? Ethology 2016, 122, 308–318. [Google Scholar] [CrossRef]
  78. Carbia, P.S.; Brown, C. Environmental enrichment influences spatial learning ability in captive-reared intertidal gobies (Bathygobius cocosensis). Anim. Cogn. 2019, 22, 89–98. [Google Scholar] [CrossRef]
  79. McKibben, L.A.; Dwivedi, Y. MicroRNA Regulates Early-Life Stress–Induced Depressive Behavior via Serotonin Signaling in a Sex-Dependent Manner in the Prefrontal Cortex of Rats. Biol. Psychiatry Glob. Open Sci. 2021, 1, 180–189. [Google Scholar] [CrossRef]
  80. Ryan, B.; Williams, J.M.; Curtis, M.A. Plasma MicroRNAs Are Altered Early and Consistently in a Mouse Model of Tauopathy. Neuroscience 2019, 411, 164–176. [Google Scholar] [CrossRef]
  81. Yoshino, Y.; Roy, B.; Dwivedi, Y. Corticosterone-mediated regulation and functions of miR-218-5p in rat brain. Sci. Rep. 2022, 12, 194. [Google Scholar] [CrossRef] [PubMed]
  82. Ma, X.; Zhang, H.; Yin, H.; Geng, S.; Liu, Y.; Liu, C.; Zhao, J.; Liu, Y.; Wang, X.; Wang, Y. Up-regulated microRNA-218-5p ameliorates the damage of dopaminergic neurons in rats with Parkinson’s disease via suppression of LASP1. Brain Res. Bull. 2021, 166, 92–101. [Google Scholar] [CrossRef] [PubMed]
Figure 1. Scheme of experimental procedure.
Biology 11 01093 g001
Figure 2. Neuronal activity related mRNA level in forebrain of trout raised in a barren environment (black) or environmental enrichments (white) for three months. Values are expressed as group mean ± SEM; fold change vs. barren environment for all genes; Welch’s t-test, Tukey post hoc; differences between treatments are represented by * (p < 0.05). Replicates (n = 8) correspond to different individual fish.
Biology 11 01093 g002
Figure 3. Neurotrophic and synaptogenesis factors related mRNA level in forebrain of trout raised in a barren environment (black) or environmental enrichments (white) for three months. Values are expressed as group mean ± SEM; fold change vs. barren environment for all genes; Welch’s t-test, Tukey post hoc; differences between treatments are represented by * (p < 0.05). Replicates (n = 8) correspond to different individual fish.
Biology 11 01093 g003
Figure 4. Plasticity factors related to mRNA level in forebrain of trout raised in a barren environment (black) or environmental enrichments (white) for three months. Values are expressed as group mean ± SEM; fold change vs. barren environment for all genes; Welch’s t-test, Tukey post hoc; differences between treatments are represented by * (p < 0.05). Replicates (n = 8) correspond to different individual fish.
Biology 11 01093 g004
Figure 5. (A) Dopamine, (B) serotonin, (C) glutamatergic, and (D) gabaergic pathways related mRNA level in forebrain of trout raised in a barren environment (black) or environmental enrichments (white) for three months. Values are expressed as group mean ± SEM; fold change vs. barren environment for all genes; Welch’s t-test, Tukey post hoc; differences between treatments are represented by * (p < 0.05). Replicates (n = 8) correspond to different individual fish.
Biology 11 01093 g005
Figure 6. Abundance and tissue origin of c-miRNAs differentially expressed in blood plasma of fish raised in a barren environment (black) or environmental enrichments (white) for three months. (A) Abundance of c-miRNAs differentially expressed (p ˂ 0.05, see asterisk) in blood plasma. Values are expressed as group mean ± SEM; differential expression analyses were performed using DESeq2 and raw counts from all fluid c-miRNA expression data. For each differential expression test, log fold changes were corrected using lfcShrink (type = “apeglm”), and p-values were corrected using an FDR method (correction of Benjamini-Hochberg) to account for multiple testing. Replicates (n = 5 for EE treatment or 6 for BE treatment) correspond to different individual fish. (B) Abundance of c-miRNAs differentially expressed in blood plasma in a panel of 14 tissues. Values are from small sequencing libraries of precedent studies [31,42].
Biology 11 01093 g006
Table 1. In batch 1: mean fish weight, tank size, number of individuals, number, type and size of structures, and estimated floor covering at each stage.
Days Post-FertilizationAverage Fish Weight at the Beginning of Each PeriodTank sizeNumber tank Replicates and Number of IndividualsNumber (n) and Type of Structures Used in the Enriched GroupFloor Covering
Biology 11 01093 i001 Biology 11 01093 i002 Biology 11 01093 i003
53–2100.12 g100 L
(65 × 50 × 30 cm)
Covered tanks
3 tanks/treatment
100 individuals each
n = 1
(10 × 5 × 5 cm)
n = 2
(24 × 15 × 11 cm)
n = 2
(9 × 8 × 8 cm)
~60%
210–23818.6 g72 L
(55 × 45 × 29 cm)
Uncovered tanks
1 tank/treatment
30 individuals each
n = 1
(10 × 5 × 5 cm)
n = 2
(24 × 15 × 11 cm)
n = 2
(9 × 8 × 8 cm)
~70%
Table 2. In batch 2: mean fish weight, tank size, number of individuals, number, type and size of structures, and estimated floor covering at each stage.
Days Post-FertilizationAverage Fish Weight at the Beginning of Each PeriodTank SizeNumber tank Replicates and Number of IndividualsNumber (n) and Type of Structures Used in the Enriched GroupFloor Covering
Biology 11 01093 i004 Biology 11 01093 i005 Biology 11 01093 i006
99–1362.83 g72 L
(55 × 45 × 29 cm)
Uncovered tanks
2 tanks/treatment
100 individuals each
n = 1
(10 × 5 × 5 cm)
n = 2
(24 × 15 × 11 cm)
n = 2
(9 × 8 × 8 cm)
~70%
137–18911 g3 tanks/treatment
30 individuals each
n = 2
(9 × 8 × 8 cm)
~70%
Table 3. Nucleotide sequences of the PCR primers used to evaluate mRNA abundance of genes by RT-PCR (quantitative PCR).
TranscriptForward PrimerReverse PrimerAccession Number
Reference
eef1a1TCCTCTTGGTCGTTTCGCTGACCCGAGGGACATCCTGTGAF498320
Neuronal activity
delta-fosbTGCAGCCAACTCTCATCTCGGAGGAATAACTGGGCCCTGGXM_021587380.1
npas4aGAGATGGTGTTGCAGGTGGATAGTTGTGGCAGCTGATGGGXM_021618560.2
npas4bAGCGAGAGAGGGAGGACATTGTGGGTGGGGTTATTCTGGGXM_036967710.1
syngr1CTTCCCACAGATCAGCTCCGCAGGAAACAGAACCCCACGAXP_036805055.1
pcnaGTGGACAAGGAGGAGGAAGCACTGTCTTGGAGAGGGGTGTXM_036936092.1
egr1bCCCAACATGTCTCTGCCCATGCTCTGACACTGGAAAGGCTXM_021617535.1
Neurotrophic factor
c-fosAACAGACTCTCCATGGCAGTTGCTGATGTGATGACGGTGGXM_021611391.1
bdnfGCTGCCGTGGAATAGACAAGTCCTTATAAACCGCCAGCCAGU108576.1
ncamGCTAACGTCACCAAAGCCAAGGCAGCAGTACAGTTGTAGCXM_021582629.1
neurabin-1AGGAGAGAGAGGAGACAGCATTCCTCCGCCTGTTTCTCATXM_021572886.1
neurod1AACCATGAGTAAGGACGGCGTTCTCCCGACCCTCCTTCTTXM_021608264.2
ntkr2bACTATCCTGGAGCTGCTGGACTGTTCGTGGAGCTCTTGGTXM_021602993.2
stxbp5GTCCTCCAAGTCACACCCTGTCAGATCCCACAACACCACGXP_021441002.2
stx12ACAACTTCCAGGCCGTACAGCAGAGGCACCATCTTCAGCAXM_036970689.1
stx1bTGACCGAGTACAACACCACGGCATATCCTCCAGCTCCTCGNP_001117929.1
Plasticity/synaptogenesis factor
mapk1CCTGCTCATCAACACCACCTAGCCACGTACTCTGTCAGGAXM_036937960.1
mapk4GGCAGGCTCTAAACCCTTGTAGAGAGGAGTGGGAGTGGTCXM_021620877.2
mapk-erkAGTCCATCTCCACGACCATCGAAAGCCTCCAGACGTTTCCNM_001124424.1
mtorCCAAGGACTTCGCTCACAAGGCTCCTTGATGTCTTGCTGGXM_021615845.1
crebCAGATTGACAGCTGCCCCTATGGTGTTCTGGTGTAGTGCTMG310160.1
egr1aCGATCACCTGACCACACACATCAGGTGGATCTTGGTGTGCENSOMYT00000041426.1
egr1cCTCGTACCCCTCTCCCTCAAAGATGGAGGCTACGGAGGAGENSOMYT00000036541.1
camk1aAGAGGACGGGAATGGATGGACTAGCACCACCTCCGAGAACXM_036950122.1
camk1bGTTGGCCCAGAAACCCTACAAGAGCTTGGCGTCATTCTCANM_001124638.1
camk2bGCCGCTGTGTCAAACTTTGTGCTTCCCTCTCCAGCTTCTGXM_036976944.1
camta1bCTACTGCCCTGCCCATGAAAGGGCAAGTCTCGAGCTTTAXM_036947092.1
Dopamine markers
thACGCTCTCTCAAGGTGTTCGAAAGTACTCCAGCCCCTCCAXM_021564247.1
drd1GGAGGAGCTGCAGAAGAAGGTTTCCAGTGACACATCGGCAXM_021617454.1
drd2CCTCCAGTCCACCACCAATTCCACTCTCCCACCACCTCTANM_001124372.2
datCTACCTCAGCGTCGACTTCCTAGCACACCAAACCCGACTCXM_021592557.1
Serotonin markers
tph1aACACCAGAGCCAGACACATGTCATCTGAAGCTCCGAGGGAXM_021598622.1
tph1bAGCGTCCGTTTACAGTGAGGGCCCACGATGTCCAGTTCATXM_021598622.1
tph2AGCACCTCAAAGACCACGTCACTGGTCGAGCTCTGCAATCMG015698
5ht1aaCCCAACACTCCACAGTCCTCACCGAGCGTCTTTACCGTTTXM_021622104
5ht1abGAGGACCAACGGGGACCCGA AATCGCCGTGCTTGACCGCACCAF0100015582
sertCCTGCTGCCCTACATGTTGAGGGGCAGATGTGTTTCCAGAM_021582096.1
Glutamatergic markers
grin1aAACAAGCGAGGACCTAAGGCCTGGCGGAGAGGATGATGACXM_021602512.2
grin2caACCCTCTGCCTTTCTTGAGCCACAGGGCTGCAGTACTCAAXM_036938636.1
grik5aGCAGATCAGGGTCCAGTCACAGTCAAAATACCCTCCCGCGXM_036969398.1
grik5bTGAAGAGGAGGTGGTGGGAAGATGATGAGGCCGCAGATCAXM_036952756.1
grin3bb1CTACTTCAGTGAGCGTGCCATACTCGAAGCGCATGTCCTCXM_021614590.2
grin3bb2GGATCCAGAATAGGCCTGCCGAACACCCTCTTCCCACAGGXM_036977945.1
gria1b1GCCTTTCAGAACCTCCGGAACTGGATGTCGATACCCTGGCXM_036989628.1
gria1b2GCGTATTGACATTTCCCGGCCCTCAATCCGAACCTGCTGTXR_005035026.1
grm1aGCTGATCGAAAGTGTGGGGAATGTTGGGGAGCAGGAAAGGXM_021600740.2
grim2aTGCATCGCCACTTCAGCTAATGCGTGTGAAGAGGATGACCXM_036950357.1
grim2bGTGAGGGGAAGTGAGACAGCGGGGTTCCGTGTGTTAGTGTXM_021568769.2
grm4aCCATTTCATCTGGGTGGGCTCCTCTGATGGACTGGCGTTTXM_021609206.2
grm4bGTGCCAGAGACCTTCAACGAGACTGCGAGGTCCCAAAGAAXM_036988394.1
grim5bGGGCATCCTGTTTGACGAGATGTCCCAGCTCCCTACGTTAXM_036961649.1
Gabaergic markers
gabarapCAGATGCACTTTCCCTCCCCTCAACCGAAATCCCCATCTCGNM_001165091.1
gbrl2AGAGAGAGATGGGGATGGCTAGGATGCAAGGGTTGTGTCANM_001165109.1
gbrapCTCACAGTGGGCCAGTTCTAGAGGTGGGAGGAATGACGTTNM_001165091.1
gabat1GGTGATGGAGTTTTGGGAGCTAAACCAGGACCCAAGCGATXM_021615563.1
chatCATCATCGTGGCATGCAAGAAGTTCTCCGCCATCTTCACTXM_021581165
Publisher’s Note: MDPI stays neutral with regard to jurisdictional claims in published maps and institutional affiliations.

