
Effects of Dominance and Sprint Interval Exercise on Testosterone and Cortisol Levels in Strength-, Endurance-, and Non-Training Men

 , , , ,
Abstract
:Simple Summary
Abstract
1. Introduction
2. Materials and Methods
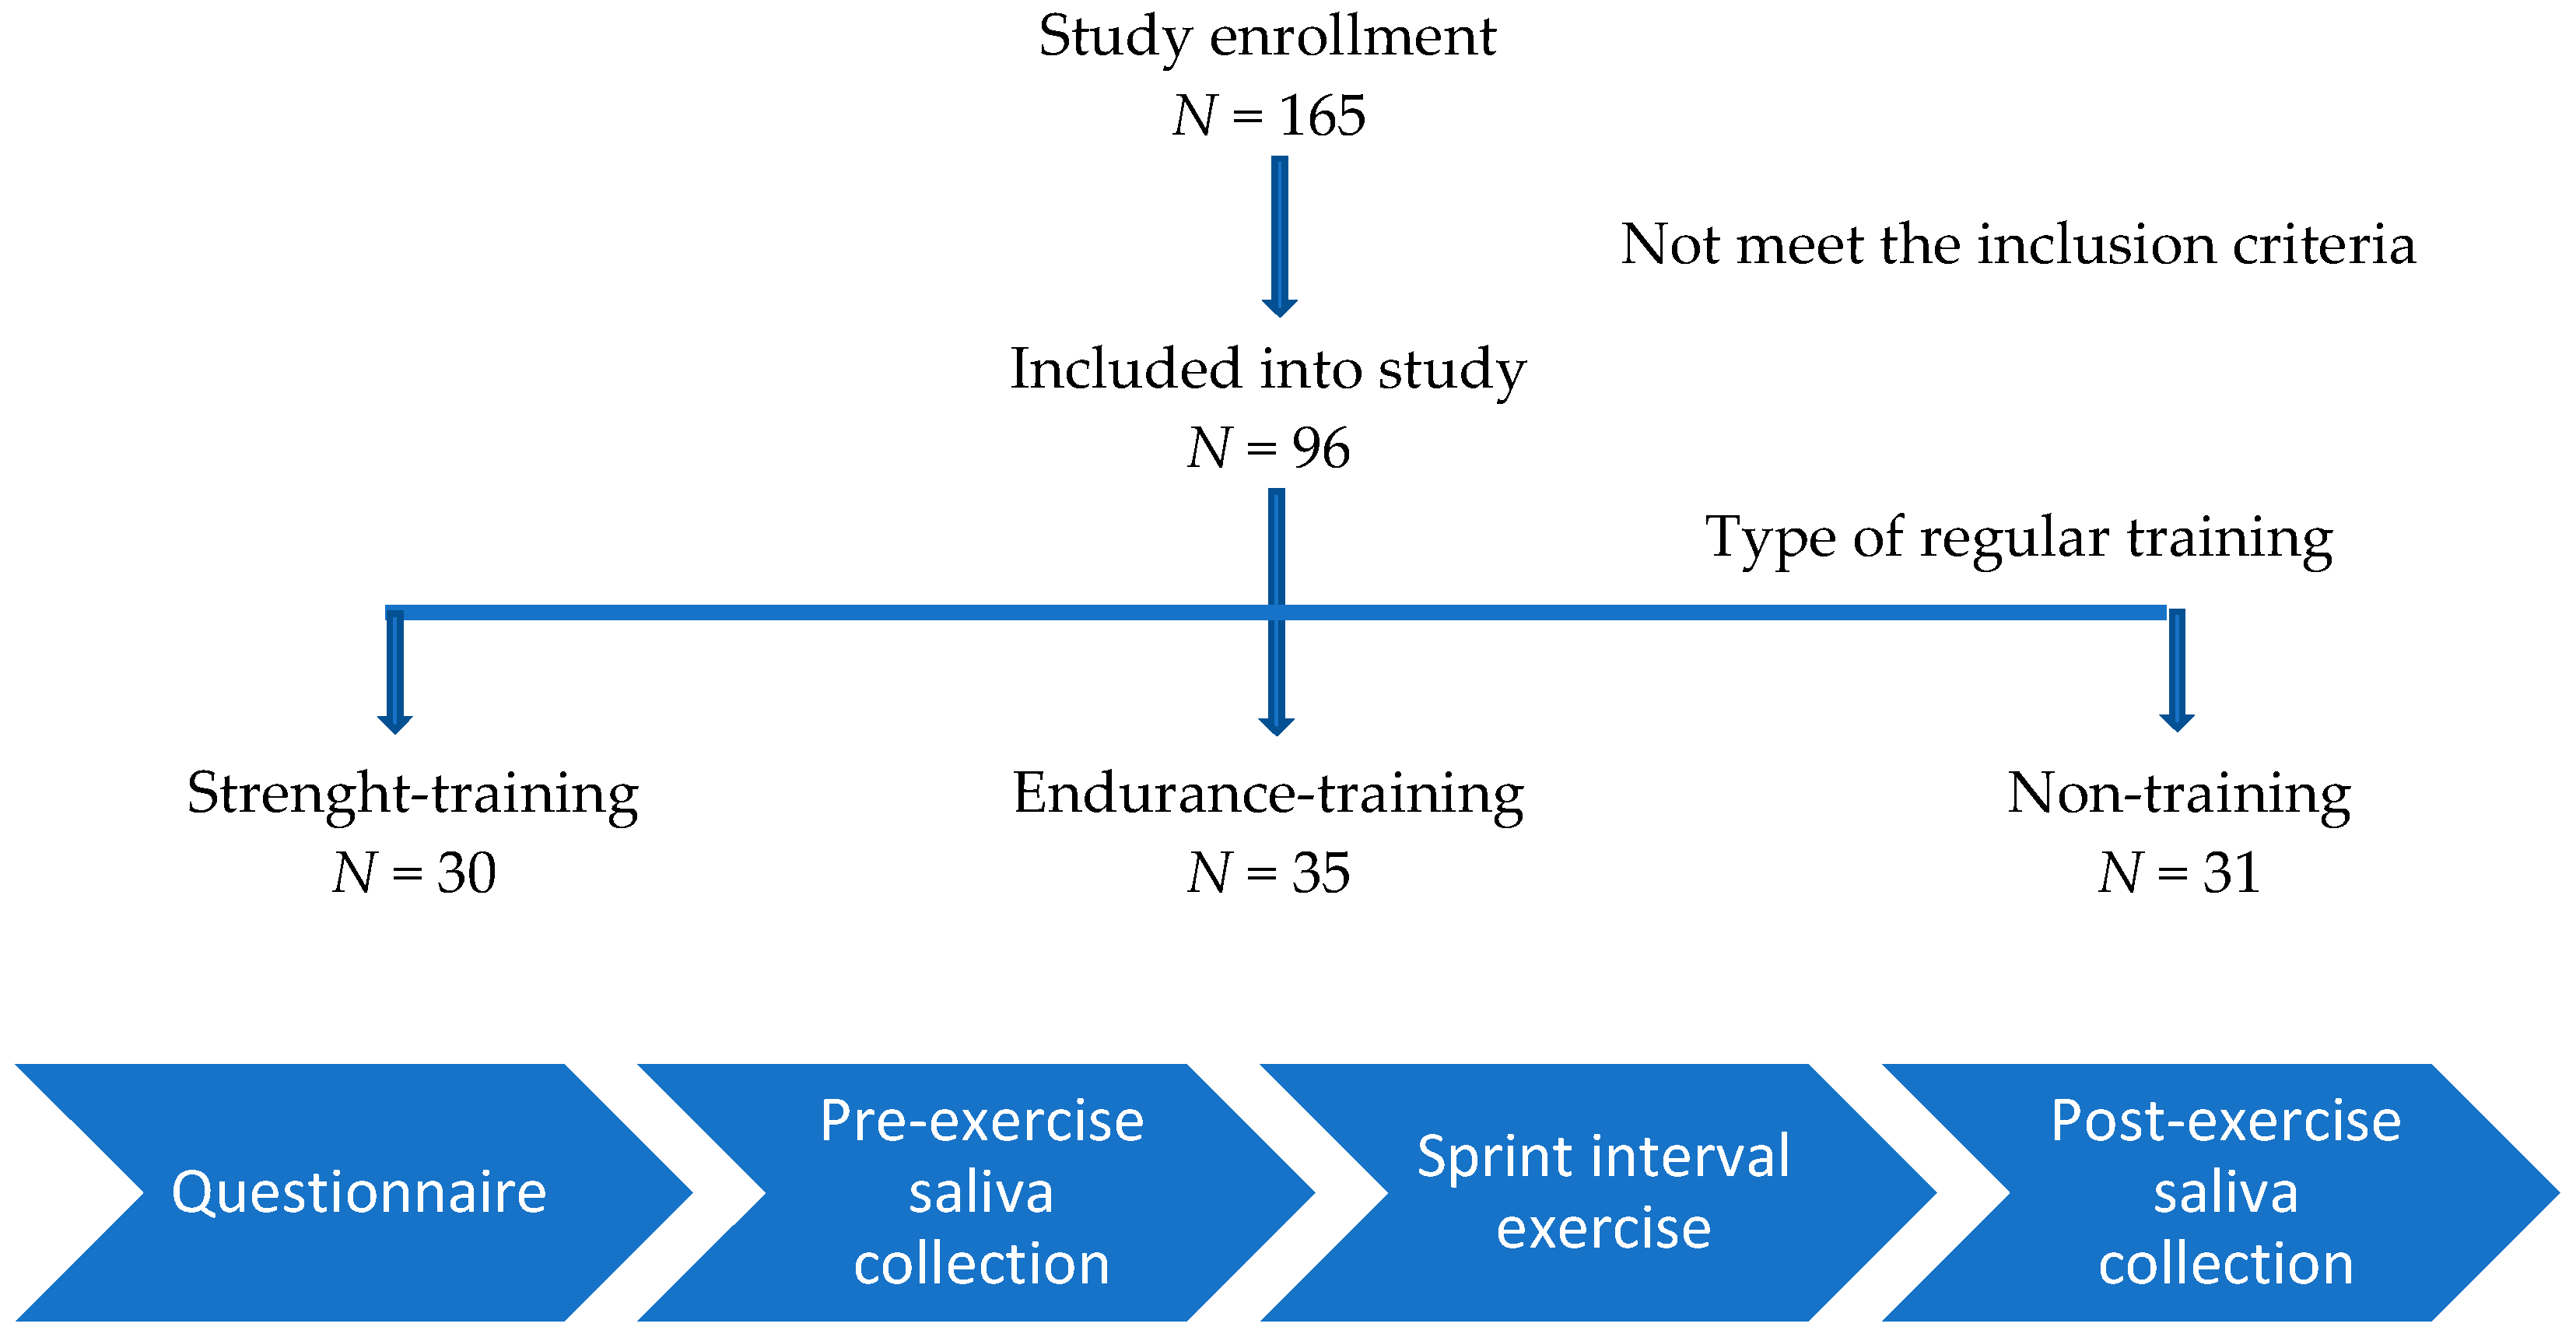
2.1. Participants
2.2. Study Design
2.3. Salivary Hormone Analysis
2.4. Sprint Interval Exercise Sessions (SIE)
2.5. Scales Used
2.5.1. Borg Ratings of Perceived Exertion (RPE) Scale
2.5.2. Dominance Scale
2.6. Statistical Analysis
3. Results
4. Discussion
5. Conclusions
Author Contributions
Funding
Institutional Review Board Statement
Informed Consent Statement
Data Availability Statement
Acknowledgments
Conflicts of Interest
References
- Hayes, L.D.; Elliott, B.T. Short-Term Exercise Training Inconsistently Influences Basal Testosterone in Older Men: A Systematic Review and Meta-Analysis. Front. Physiol. 2019, 9, 1878. [Google Scholar] [CrossRef] [PubMed] [Green Version]
- Dote-Montero, M.; Carneiro-Barrera, A.; Martinez-Vizcaino, V.; Ruiz, J.R.; Amaro-Gahete, F.J. Acute effect of HIIT on testosterone and cortisol levels in healthy individuals: A systematic review and meta-analysis. Scand. J. Med. Sci. Sports 2021, 31, 1722–1744. [Google Scholar] [CrossRef] [PubMed]
- Danek, N.; Smolarek, M.; Michalik, K.; Zatoń, M. Comparison of Acute Responses to Two Different Cycling Sprint Interval Exercise Protocols with Different Recovery Durations. Int. J. Environ. Res. Public Health 2020, 17, 1026. [Google Scholar] [CrossRef] [Green Version]
- Riachy, R.; McKinney, K.; Tuvdendorj, D. Various Factors May Modulate the Effect of Exercise on Testosterone Levels in Men. J. Funct. Morphol. Kinesiol. 2020, 5, 81. [Google Scholar] [CrossRef] [PubMed]
- Kraemer, W.J.; Ratamess, N.A.; Hymer, W.C.; Nindl, B.C.; Fragala, M.S. Growth Hormone(s), Testosterone, Insulin-Like Growth Factors, and Cortisol: Roles and Integration for Cellular Development and Growth with Exercise. Front. Endocrinol. 2020, 11, 33. [Google Scholar] [CrossRef] [PubMed]
- Keizer, H.; Janssen, G.M.E.; Menheere, P.; Kranenburg, G. Changes in Basal Plasma Testosterone, Cortisol, and Dehydroepiandrosterone Sulfate in Previously Untrained Males and Females Preparing for a Marathon. Int. J. Sports Med. 1989, 10, S139–S145. [Google Scholar] [CrossRef]
- Hayes, L.D.; Bickerstaff, G.F.; Baker, J.S. Interactions of cortisol, testosterone, and resistance training: Influence of circadian rhythms. Chronobiol. Int. 2010, 27, 675–705. [Google Scholar] [CrossRef]
- Moreira, A.; Aoki, M.S.; Franchini, E.; Machado, D.; Paludo, A.; Okano, A.H. Mental fatigue impairs technical performance and alters neuroendocrine and autonomic responses in elite young basketball players. Physiol. Behav. 2018, 196, 112–118. [Google Scholar] [CrossRef]
- Mehta, P.H.; Josephs, R.A. Testosterone and cortisol jointly regulate dominance: Evidence for a dual-hormone hypothesis. Horm. Behav. 2010, 58, 898–906. [Google Scholar] [CrossRef]
- Batrinos, M.L. Testosterone and aggressive behavior in man. Int. J. Endocrinol. Metab. 2012, 10, 563–568. [Google Scholar] [CrossRef] [Green Version]
- Carré, J.M.; McCormick, C.M. Aggressive behavior and change in salivary testosterone concentrations predict willingness to engage in a competitive task. Horm. Behav. 2008, 54, 403–409. [Google Scholar] [CrossRef] [PubMed]
- Gibala, M.J.; Hawley, J.A. Sprinting Toward Fitness. Cell Metab. 2017, 25, 988–990. [Google Scholar] [CrossRef] [PubMed]
- Vollaard, N.; Metcalfe, R. Research into the Health Benefits of Sprint Interval Training Should Focus on Protocols with Fewer and Shorter Sprints (Forthcoming/Available Online); Springer: Berlin/Heidelberg, Germany, 2017. [Google Scholar]
- Hardcastle, S.J.; Eray, H.; Beale, L.; Hagger, M. Why sprint interval training is inappropriate for a largely sedentary population. Front. Psychol. 2014, 5, 1505. [Google Scholar] [CrossRef] [PubMed] [Green Version]
- Biddle, S.J.; Batterham, A.M. High-intensity interval exercise training for public health: A big HIT or shall we HIT it on the head? Int. J. Behav. Nutr. Phys. Act. 2015, 12, 95. [Google Scholar] [CrossRef] [Green Version]
- Kujach, S.; Byun, K.; Hyodo, K.; Suwabe, K.; Fukuie, T.; Laskowski, R.; Dan, I.; Soya, H. A transferable high-intensity intermittent exercise improves executive performance in association with dorsolateral prefrontal activation in young adults. NeuroImage 2018, 169, 117–125. [Google Scholar] [CrossRef]
- Kujach, S.; Olek, R.A.; Byun, K.; Suwabe, K.; Sitek, E.; Ziemann, E.; Laskowski, R.; Soya, H. Acute Sprint Interval Exercise Increases Both Cognitive Functions and Peripheral Neurotrophic Factors in Humans: The Possible Involvement of Lactate. Front. Neurosci. 2020, 13, 1455. [Google Scholar] [CrossRef]
- Islam, H.; Townsend, L.K.; Hazell, T.J. Modified sprint interval training protocols. Part I. Physiological responses. Appl. Physiol. Nutr. Metab. 2017, 42, 339–346. [Google Scholar] [CrossRef] [Green Version]
- Martínez-Díaz, I.C.; Carrasco, L. Neurophysiological Stress Response and Mood Changes Induced by High-Intensity Interval Training: A Pilot Study. Int. J. Environ. Res. Public Health 2021, 18, 7320. [Google Scholar] [CrossRef]
- Beaven, C.M.; Gill, N.D.; Cook, C.J. Salivary Testosterone and Cortisol Responses in Professional Rugby Players After Four Resistance Exercise Protocols. J. Strength Cond. Res. 2008, 22, 426–432. [Google Scholar] [CrossRef]
- Granger, D.A.; Shirtcliff, E.A.; Booth, A.; Kivlighan, K.T.; Schwartz, E.B. The “trouble” with salivary testosterone. Psychoneuroendocrinology 2004, 29, 1229–1240. [Google Scholar] [CrossRef]
- Crewther, B.T.; Lowe, T.E.; Ingram, J.; Weatherby, R.P. Validating the salivary testosterone and cortisol concentration measures in response to short high-intensity exercise. J. Sports Med. Phys. Fit. 2010, 50, 85–92. [Google Scholar]
- Allgrove, J.E.; Gomes, E.; Hough, J.; Gleeson, M. Effects of exercise intensity on salivary antimicrobial proteins and markers of stress in active men. J. Sports Sci. 2008, 26, 653–661. [Google Scholar] [CrossRef] [PubMed]
- Kowal, M.; Sorokowski, P.; Żelaźniewicz, A.; Nowak, J.; Orzechowski, S.; Żurek, G.; Żurek, A.; Juszkiewicz, A.; Wojtycka, L.; Sieniuć, W.; et al. No relationship between the digit ratios (2D:4D) and salivary testosterone change: Study on men under an acute exercise. Sci. Rep. 2020, 10, 10068. [Google Scholar] [CrossRef] [PubMed]
- Kowal, M.; Sorokowski, P.; Żelaźniewicz, A.; Nowak, J.; Orzechowski, S.W.; Żurek, A.; Żurek, G. A positive relationship between body height and the testosterone response to physical exercise. Evol. Hum. Behav. 2021, 42, 179–185. [Google Scholar] [CrossRef]
- Williams, N. The Borg Rating of Perceived Exertion (RPE) scale. Occup. Med. 2017, 67, 404–405. [Google Scholar] [CrossRef] [Green Version]
- Kowal, M.; Sorokowski, P.; Żelaźniewicz, A.; Nowak, J.; Orzechowski, S.; Żurek, G.; Żurek, A.; Nawrat, M. Are Beards Honest Signals of Male Dominance and Testosterone? Arch. Sex. Behav. 2021, 50, 3703–3710. [Google Scholar] [CrossRef]
- Mahalanobis, P.C. A method of fractile graphical analysis. Économ. J. Économ. Soc. 1960, 28, 325–351. [Google Scholar] [CrossRef]
- Penny, K.I. Appropriate Critical Values When Testing for a Single Multivariate Outlier by Using the Mahalanobis Distance. J. R. Stat. Soc. Ser. C 1996, 45, 73. [Google Scholar] [CrossRef]
- Luger, A.; Deuster, P.A.; Kyle, S.B.; Gallucci, W.T.; Montgomery, L.C.; Gold, P.W.; Chrousos, G.P. Acute hypothalamic–pituitary–adrenal responses to the stress of treadmill exercise. N. Eng. J. Med. 1987, 316, 1309–1315. [Google Scholar] [CrossRef]
- Spanoudaki, S.; Maridaki, M.; Tsironi, M.; Baltopoulos, G.; Bogdanis, G.; Baltopoulos, P. Immune responses during and after exercise of constant and alternating intensity above the lactate threshold. J. Sports Med. Phys. Fit. 2010, 50, 363. [Google Scholar]
- Lanfranco, F.; Strasburger, C.J. (Eds.) Sports Endocrinology; Karger Medical and Scientific Publishers: Basel, Switzerland, 2016. [Google Scholar]
- Lu, S.S.; Lau, C.P.; Tung, Y.F.; Huang, S.W.; Chen, Y.H.; Shih, H.C.; Wang, P.S. Lactate and the effects of exercise on testosterone secretion: Evidence for the involvement of a cAMP-mediated mechanism. Med. Sci. Sports Exerc. 1997, 29, 1048–1054. [Google Scholar] [CrossRef] [PubMed]
- Tanner, A.V.; Nielsen, B.V.; Allgrove, J. Salivary and plasma cortisol and testosterone responses to interval and tempo runs and a bodyweight-only circuit session in endurance-trained men. J. Sports Sci. 2013, 32, 680–689. [Google Scholar] [CrossRef] [PubMed] [Green Version]
- Wheeler, G.D.; Singh, M.; Pierce, W.D.; Epling, W.F.; Cumming, D.C. Endurance Training Decreases Serum Testosterone Levels in Men without Change in Luteinizing Hormone Pulsatile Release. J. Clin. Endocrinol. Metab. 1991, 72, 422–425. [Google Scholar] [CrossRef] [PubMed]
- Vingren, J.L.; Kraemer, W.J.; Ratamess, N.A.; Anderson, J.M.; Volek, J.S.; Maresh, C.M. Testosterone Physiology in Resistance Exercise and Training. Sports Med. 2010, 40, 1037–1053. [Google Scholar] [CrossRef]
- Kraemer, W.J.; Ratamess, N.A. Hormonal Responses and Adaptations to Resistance Exercise and Training. Sports Med. 2005, 35, 339–361. [Google Scholar] [CrossRef]
- Cadore, E.; Lhullier, F.; Brentano, M.; Silva, E.; Ambrosini, M.; Spinelli, R.; Silva, R.; Kruel, L. Correlations between serum and salivary hormonal concentrations in response to resistance exercise. J. Sports Sci. 2008, 26, 1067–1072. [Google Scholar] [CrossRef]
- Seligman, M.E. Helplessness: On Depression, Development and Death; Scribner: New York, NY, USA, 1975; pp. 35–42. [Google Scholar]
- Rivers, J.J.; Josephs, R.A. The social psychology of power. Domin. Health 2010, 87–112. [Google Scholar]
- Jiménez, M.; Alvero-Cruz, J.R.; Solla, J.; García-Bastida, J.; García-Coll, V.; Rivilla, I.; Ruiz, E.; García-Romero, J.; Carnero, E.A.; Clemente-Suárez, V.J. Competition Seriousness and Competition Level Modulate Testosterone and Cortisol Responses in Soccer Players. Int. J. Environ. Res. Public Health 2020, 17, 350. [Google Scholar] [CrossRef] [Green Version]


| Variables | Endurance Training (N = 35) | Strength Training (N = 30) | Control (N = 31) |
|---|---|---|---|
| Age | 20.71 (1.62) | 21.53 (1.69) | 21.58 (1.96) |
| Body height (cm) | 180.77 (5.55) | 183.72 (7.51) | 174.45 (5.57) |
| Body mass (kg) | 75.59 (11.34) | 80.77 (10.21) | 79.81 (9.05) |
| BMI (kg∙m−2) | 23.11 (3.16) | 24.08 (3.75) | 24.89 (3.55) |
| Physical activity (h per week) | 6.60 (3.61) | 5.25 (2.81) | 4.48 (2.29) |
| HRrest (beats∙min–1) | 68.36 (10.80) | 68.03 (11.81) | 69.41 (9.43) |
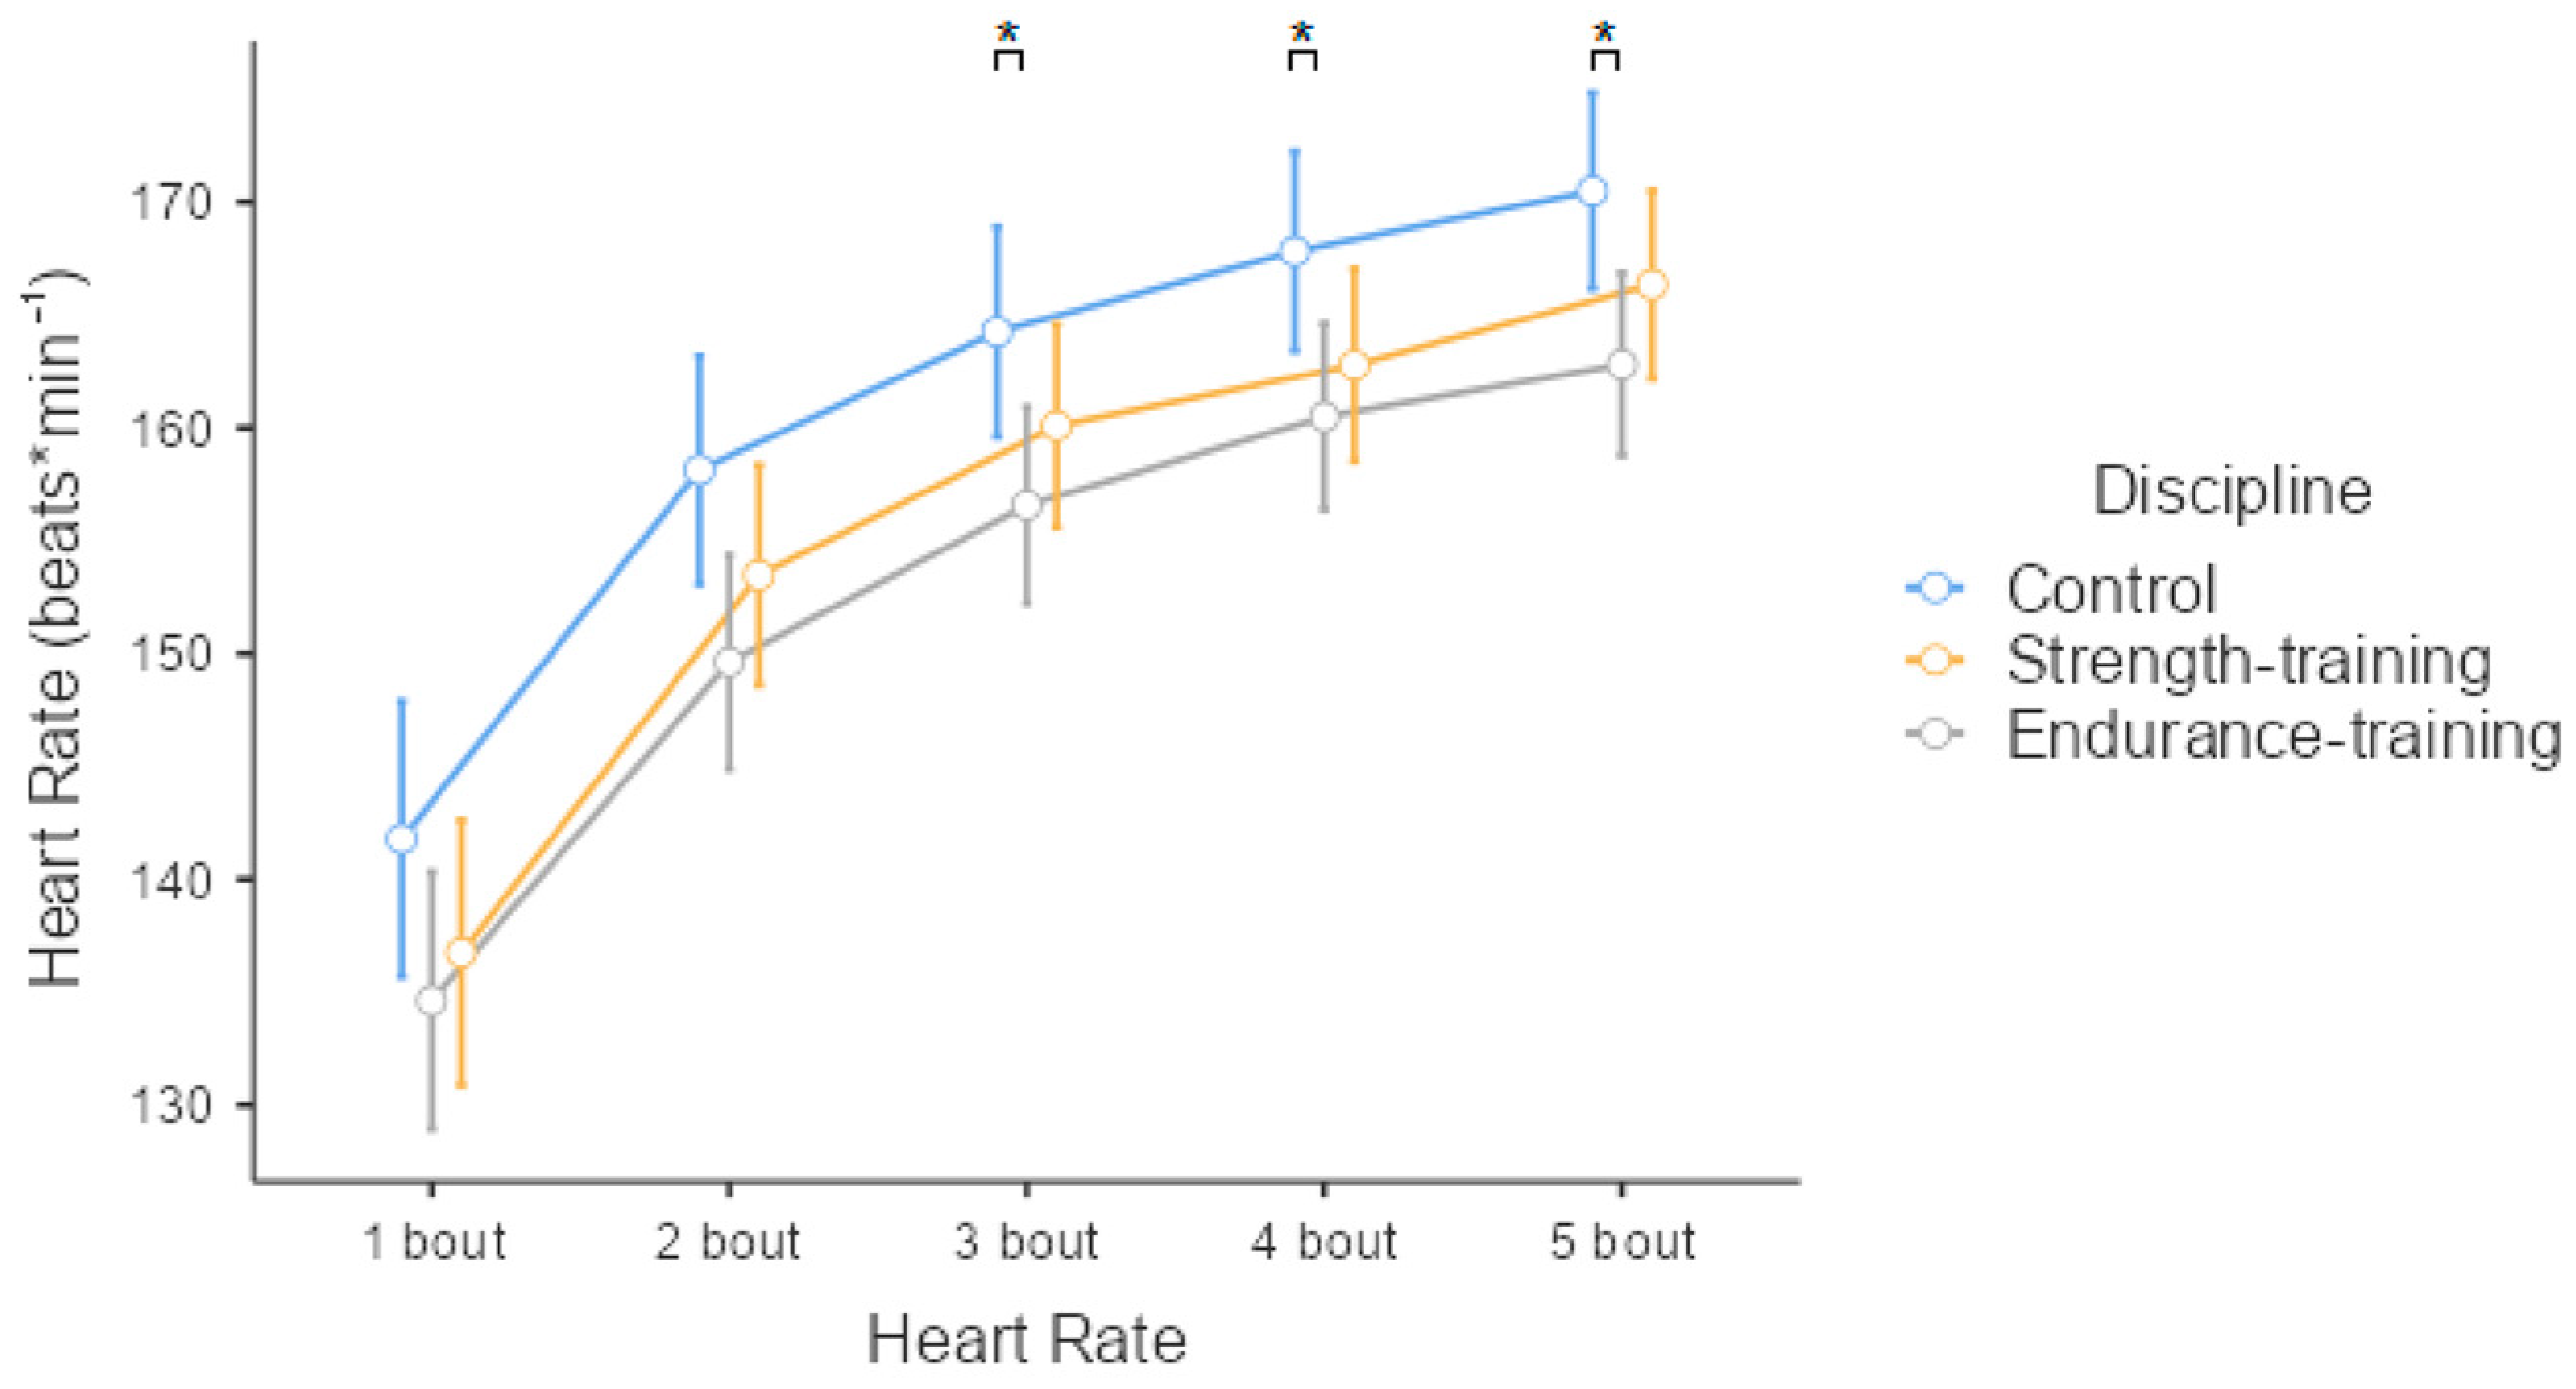
| HRmean (beats∙min–1) | 152.82 (10.76) | 155.83 (13.59) | 160.75 (12.12) |
| Testosterone (pre) Testosterone change (post–pre) | 135.46 (62.15) 9.79 (31.07) | 129.88 (54.21) 20.02 (47.17) | 135.17 (49.05) 18.37 (50.79) |
| Cortisol (pre) Cortisol change (post–pre) | 7.62 (1.75) −0.08 (1.33) | 8.07 (1.56) 0.28 (1.73) | 8.47 (1.72) −0.57 (1.60) |
| T/C (pre) T/C change (post–pre) | 18.02 (7.46) 49.14 (118.69) | 16.32 (6.70) 37.33 (165.49) | 16.37 (6.28) −18.58 (126.41) |
| RPE | 5.16 (1.83) | 5.60 (2.50) | 5.36 (2.19) |
| Self-reported dominance | 3.34 (0.75) | 3.31 (0.71) | 3.23 (0.63) |
| Outcome Variable: Mean Heart Rate | r2 = 0.124, F(5.84) = 3.513, p = 0.006 | |||
|---|---|---|---|---|
| Predictor | β | 95% CI | SE | p |
| Discipline | ||||
| Endurance–Control | −0.698 | [−1.191, −0.204] | 3.127 | 0.006 ** |
| Strength–Control | −0.531 | [−1.041, −0.021] | 3.229 | 0.041 * |
| Testosterone change | 0.075 | [−0.128, 0.278] | 0.030 | 0.466 |
| Cortisol change | 0.233 | [0.023, 0.442] | 0.883 | 0.030 * |
| Self-reported dominance | −0.221 | [−0.420, −0.022] | 1.817 | 0.030 * |
| Outcome Variable: Cortisol Change | r2 = 0.080, F(3.86) = 2.503, p = 0.065 | |||
|---|---|---|---|---|
| Predictor | β | 95% CI | SE | p |
| Discipline | ||||
| Endurance–Control | 0.436 | [−0.067, 0.939] | 0.380 | 0.089 |
| Strength–Control | 0.689 | [0.179, 1.199] | 0.385 | 0.009 ** |
| Self-reported dominance | 0.028 | [−0.178, 0.234] | 0.224 | 0.790 |
| Outcome Variable: Testosterone Change | r2 = 0.156, F(3.86) = 0.711, p = 0.548 | |||
|---|---|---|---|---|
| Predictor | β | 95% CI | SE | p |
| Discipline | ||||
| Endurance–Control | −0.174 | [−0.692, 0.344] | 11.281 | 0.506 |
| Strength–Control | 0.065 | [−0.461, 0.59] | 11.443 | 0.807 |
| Self-reported dominance | 0.120 | [−0.092, 0.332] | 6.657 | 0.264 |
Publisher’s Note: MDPI stays neutral with regard to jurisdictional claims in published maps and institutional affiliations. |
© 2022 by the authors. Licensee MDPI, Basel, Switzerland. This article is an open access article distributed under the terms and conditions of the Creative Commons Attribution (CC BY) license (https://creativecommons.org/licenses/by/4.0/).
Share and Cite
Zurek, G.; Danek, N.; Żurek, A.; Nowak-Kornicka, J.; Żelaźniewicz, A.; Orzechowski, S.; Stefaniak, T.; Nawrat, M.; Kowal, M. Effects of Dominance and Sprint Interval Exercise on Testosterone and Cortisol Levels in Strength-, Endurance-, and Non-Training Men. Biology 2022, 11, 961. https://doi.org/10.3390/biology11070961
Zurek G, Danek N, Żurek A, Nowak-Kornicka J, Żelaźniewicz A, Orzechowski S, Stefaniak T, Nawrat M, Kowal M. Effects of Dominance and Sprint Interval Exercise on Testosterone and Cortisol Levels in Strength-, Endurance-, and Non-Training Men. Biology. 2022; 11(7):961. https://doi.org/10.3390/biology11070961
Chicago/Turabian StyleZurek, Grzegorz, Natalia Danek, Alina Żurek, Judyta Nowak-Kornicka, Agnieszka Żelaźniewicz, Sylwester Orzechowski, Tadeusz Stefaniak, Magdalena Nawrat, and Marta Kowal. 2022. "Effects of Dominance and Sprint Interval Exercise on Testosterone and Cortisol Levels in Strength-, Endurance-, and Non-Training Men" Biology 11, no. 7: 961. https://doi.org/10.3390/biology11070961