Article

N6-Methyladenosine Methylome Profiling of Muscle and Adipose Tissues Reveals Methylase–mRNA Metabolic Regulatory Networks in Fat Deposition of Rex Rabbits

College of Animal Science and Technology, Northwest A&F University, Xianyang 712100, China
*
Author to whom correspondence should be addressed.
Biology 2022, 11(7), 944; https://doi.org/10.3390/biology11070944
Submission received: 20 May 2022 / Revised: 9 June 2022 / Accepted: 17 June 2022 / Published: 21 June 2022

Abstract

:

Simple Summary

N6-methyladenosine is the most prevalent internal form of modification found in recent years and plays an important role in gene regulation, which can regulate many physiological processes, such as fat deposition, immunity, and reproduction. The intramuscular fat content is an important problem to be solved in the development of animal husbandry. In order to find a way to increase the intramuscular fat content of Rex rabbit muscles, we explored the methylation modification genes related to fat deposition in Rex rabbit muscle and adipose tissue. We found 5 differential methylases and 12 key genes for methylation modification related to fat deposition between muscle and adipose tissues samples. In addition, five differential methylases were found to regulate adipogenesis by affecting the expression of screened genes in different ways. These findings provided a theoretical basis for our future research on the function of methylation modification during the growth of fat deposits and provided a new way to increase intramuscular fat in Rex rabbits.

Abstract

N6-methyladenosine (m6A) is the most prevalent internal form of modification in messenger RNA in higher eukaryotes and plays an important role in cancer, immunity, reproduction, development, and fat deposition. Intramuscular fat is the main factor used to measure the meat quality of an animal. The deposition of intramuscular fat and perirenal fat increases with age. However, there is no data on m6A modification of Rex rabbits and its potential biological roles in adipose deposition and muscle growth. Here, we performed two high-throughput sequencing methods, m6A-modified RNA immunoprecipitation sequence (MeRIP-seq) and RNA sequence (RNA-seq), to identify key genes with m6A modification on fat deposition in the muscle and adipose tissues of Rex rabbits. Then, qRT-PCR was used to identify the differently methylated genes related to fat deposition. Our findings showed that there were 12,876 and 10,973 m6A peaks in the rabbit muscle and adipose tissue transcriptomes, respectively. Stop codons, 3′-untranslated regions, and coding regions were found to be mainly enriched for m6A peaks. In addition, we found 5 differential methylases and 12 key genes of methylation modification related to fat deposition between muscle and adipose tissues samples. The expression levels of six random key genes were significantly higher in the fat than that in the muscle of Rex rabbits at different stages (p < 0.01). Finally, five differential methylases were found to regulate adipogenesis by affecting the expression of screened genes in different ways. These findings provided a theoretical basis for our future research on the function of m6A modification during the growth of fat deposits.

1. Introduction

A rabbit is a kind of livestock with fast growth, high reproductive performance, and short generation interval. As an economically important domestic animal, rabbits have fewer fat deposits compared with other mammals, such as swine, cattle, and sheep. In addition, a study found that the fat deposition pattern of perirenal fat and intramuscular fat is the same, which increased with age [1]. Fat deposition exists in both muscle and adipose tissue, but the similarities and differences in the specific regulation mechanisms of fat deposition are not clear. Therefore, the study of rabbit visceral fat development is of great significance to the development of animal husbandry. An increasing number of people have suffered from obesity-related metabolic diseases in recent decades due to excessive intake of high-fat diets. Obesity increases the likelihood of numerous chronic diseases, including type 2 diabetes, hypertension, cardiovascular disease, and cancer in humans [2,3]. Due to the naturally low fat deposition during rabbit growth, rabbits are an ideal model for studying visceral adipose development and have important clinical value. However, there have been few studies addressing the regulatory mechanisms involved in rabbit fat growth and metabolism. Thus, deepening our understanding of the molecular mechanism of fat deposition is of major economic and human health importance.
N6-methylation on adenosine (m6A) is one of the most advanced and popular research directions in the field of life science, which plays an important role in internal mRNA modification of eukaryotes [4,5]. Studies found that m6A is reversible [6]. In addition, m6A regulates0 transcriptome at the RNA level via reversible RNA methylation [7]. The reversibility of m6A is mainly regulated by writing protein, reader proteins, and eraser proteins. The binding proteins [8], demethylases [8], and the methyltransferase complex [9] play the roles of reading, erasing, and writing, respectively, in m6A modification. Much more recently, more and more biological roles of m6A have been found, such as stability, localization, mRNA splicing, translation, and translation efficiency [8]. Furthermore, RNA m6A plays an important role in murine stem cells [10,11]. In addition, m6A modification also plays a key role in biological processes such as cellular differentiation, lipid accumulation, and energy metabolism [4]. Recently, it has been proposed that m6A regulates adipogenesis through mediating mRNA splicing [12]. It has been demonstrated that the fat mass- and obesity-associated gene (FTO) is one of the m6A RNA demethylases and regulates adipogenesis through the modulation of mitotic clonal expansion [13]. Methyltransferase-like 3 (METTL3), a key RNA methyltransferase, has been demonstrated to regulate neurogenesis [14], spermatogenesis [15,16], early embryonic development [17], and stem cell pluripotency in mice [17,18]. However, mRNA m6A modification regulation and genetic mechanisms of METTL14, YTHDC1, YTHDC2, and HNRNPA2B1 regulating fat deposition in Rex rabbits are far from clear.
In this study, we aimed to explore the regulatory mechanism of m6A modification on fat deposition in Rex rabbit muscle and perirenal adipose tissue. First, we identified m6A peaks and differential genes related to methylase and fat deposition by MeRIP-seq and RNA-seq in muscle and adipose tissues of Rex rabbits. Then, six random key genes were selected to validate by performing qRT-PCR in the muscle and adipose tissue of Rex rabbits at different stages. Finally, based on previous studies, five methylases were summarized and analyzed, which can regulate 12 genes related to fat deposition through different ways. These results enhance our understanding of molecular mechanisms associated with m6A modification and provide a basis for us to verify the regulation mechanism of fat deposition in muscle and fat tissue in adipocytes and rabbits.

2. Material and Methods

2.1. Animals and Tissue Collection

Perirenal adipose tissues and longissimus lumborum were collected from three 0-day-old Rex rabbits for MeRIP-seq. 35-day-old, 75-day-old, and 165-day-old female Rex rabbits (n = 3) were used for RT-qPCR, which were raised under standard conditions at the Northwest A&F University farm (Yangling, Shanxi, China). Rabbits were slaughtered with minimal pain.

2.2. RNA Extraction and Fragmentation

Total RNA was extracted using TRIzol reagent (Invitrogen, Carlsbad, CA, USA) following the manufacturer’s procedure. The concentration and quality of the RNA was evaluated using Nano Drop 2000 UV-Vis Spectrophotometer (Thermo Scientific, Waltham, MA, USA). The RNA integrity was assessed by Bioanalyzer 2100 (Agilent, CA, USA) with RIN number > 7.0, and confirmed by electrophoresis with denaturing agarose gel. Poly (A) RNA is purified from 50 μg total RNA using Dynabeads Oligo (dT)25-61005 (Thermo Fisher, CA, USA) using two rounds of purification. Then the poly(A) RNA was fragmented under 86 °C for 7 min.

2.3. M6A Immunoprecipitation and Library Construction

The cleaved RNA fragments were incubated for 2 h at 4 °C with m6A-specific antibody (No. 202003, Synaptic Systems, Germany) in IP (Immunoprecipitation) buffer (50 mM Tris-HCl, 750 mM NaCl and 0.5% Igepal CA-630). Then the IP RNA was reverse transcribed to create the cDNA. An A-base was then added to the blunt ends of each strand, preparing them for ligation to the indexed adapters. and size selection was performed with AMPureXP beads. After the heat-labile UDG enzyme (Baltimore, MD, USA) treatment of the U-labeled second-stranded DNA, the ligated products were amplified with PCR and then undertook final extension at 72 °C for 5 min. The average insert size for the final cDNA library was 300 ± 50 bp. At last, we performed the 2 × 150 bp paired-end sequencing (PE150) on an illumina Novaseq™ 6000 (LC-Bio Technology CO., Ltd., Hangzhou, China) following the vendor’s recommended protocol.

2.4. RNA Extraction and cDNA Synthesis

RNAiso Plus reagent (TaKaRa, Shiga, Japan) was used to extract total RNA following the manufacturer’s instructions. RNA quality and concentration refer to previous studies [19]. In addition, we used the Prime Script RT reagent Kit (Takara, Japan) to synthesize the first-strand cDNA of total RNA according to the manufacturer’s protocol.

2.5. Primer Design and Quantitative Real-Time PCR

PCR primers were designed with the Premier 6 software (http://www.greenxf.com/soft/190969.html, accessed on 5 June 2020) to amplify the entire coding DNA sequence (CDS) according to the reference mRNA sequence of rabbit LPL gene, SNAP23 gene, APMAP gene, ADCY4 gene, PCK2 gene, MAP4K3 gene, and β-actin gene in the GeneBank (GCF_000003625.3). β-actin was used as an internal control to normalize the copy number of each gene by the 2−ΔΔCt method [20] after obtaining the Ct values of each reference gene. The primers information is in Table 1.

2.6. KEGG and Gene Screening

Based on a large amount of literature, we screened genes related to fat deposition and KEGG. In addition, the genes verified by RT-qPCR were randomly selected.

2.7. Quality Control, Mapping and Statistical Analysis

The fastp software (https://github.com/OpenGene/fastp, accessed on 19 May 2022) was used to remove the reads that contained adaptor contamination, low quality bases, and undetermined bases with default parameter. Then sequence quality of IP and input samples were also verified using fastp. Reads were aligned to the reference genome of rabbits using Tophat (v2.0.14). For each gene, the reads count in each window was normalized by the median count of all windows of that gene. MEME [21] (http://meme-suite.org, accessed on 19 May 2022) and HOMER [22] (http://homer.ucsd.edu/homer/motif, accessed on 19 May 2022) were used for de novo and known motif finding followed by localization of the motif with respect to peak summit. Called peaks were annotated by intersection with gene architecture using R package [23] ChIPseeker (https://bioconductor.org/packages/ChIPseeker, accessed on 19 May 2022). In addition, the differentially expressed mRNAs were selected with log2 (fold change) > 1 or log2 (fold change) < −1 and p value < 0.05 by R package edgeR (https://bioconductor.org/packages/edgeR, accessed on 19 May 2022). Then StringTie (https://ccb.jhu.edu/software/stringtie, accessed on 19 May 2022) was used to perform the expression level for all mRNAs from input libraries by calculating FPKM. We used the balltown package of R language to analyze the difference of genes. The results of RT-qPCR were assessed using the GraphPad Prism software 5.0 (La Jolla, a seaside town in San Diego, USA) and presented as mean ± standard deviation (SD). Differences in the mean values between the 2 groups were determined for significance with a Student’s t-test. p < 0.05 and p < 0.01 were deemed to be significant and highly significant, respectively.

3. Results

3.1. Sequencing Statistics and Quality Control

In the process of MeRIP seq, the raw data were trimmed to remove the adaptor and date of low quality, and the clean reads were obtained. As shown in Table 2, the effective reads accounted for 89.94%, 90.48%, 90.77%, 91.02%, 90.69%, and 90.62% in the MeRIP-seq library, respectively. Raw data reads and valid data reads obtained from fat and muscle tissue samples are shown in Table 2. All proportions of effective reads were higher than 90.17%. In addition, all proportions of bases with mass values ≥ 20 were higher than 97.92% (sequencing error rate less than 0.01), all proportions of bases with quality values ≥ 30 were higher than 93.90% (sequencing error rate less than 0.001), and the percentage of GC in adipose tissue was lower than that in muscle tissue.

3.2. Mapping Reads to the Reference Genome

By mapping the reads data to the reference genome, as shown in Table 3, the mapping ratio of valid data in IP samples fat and muscle were more than88.288%. The proportion of the least-unique mapped reads 58.20% in the m6A-seq library. In the RNA-seq library, the mapping ratio of valid reads in input samples of fat and muscle were more than 88.71%. The proportion of unique mapped reads was not less than 62.54%. The proportion of multi-mapped reads is the mapping ratio of valid reads minus the proportion of unique mapped reads in Table 3. According to the region classification of reference genome, the proportion of sequencing sequences located in the exon region was the highest and the proportion of sequencing sequences located in the intergenic region was the lowest in Figure 1.

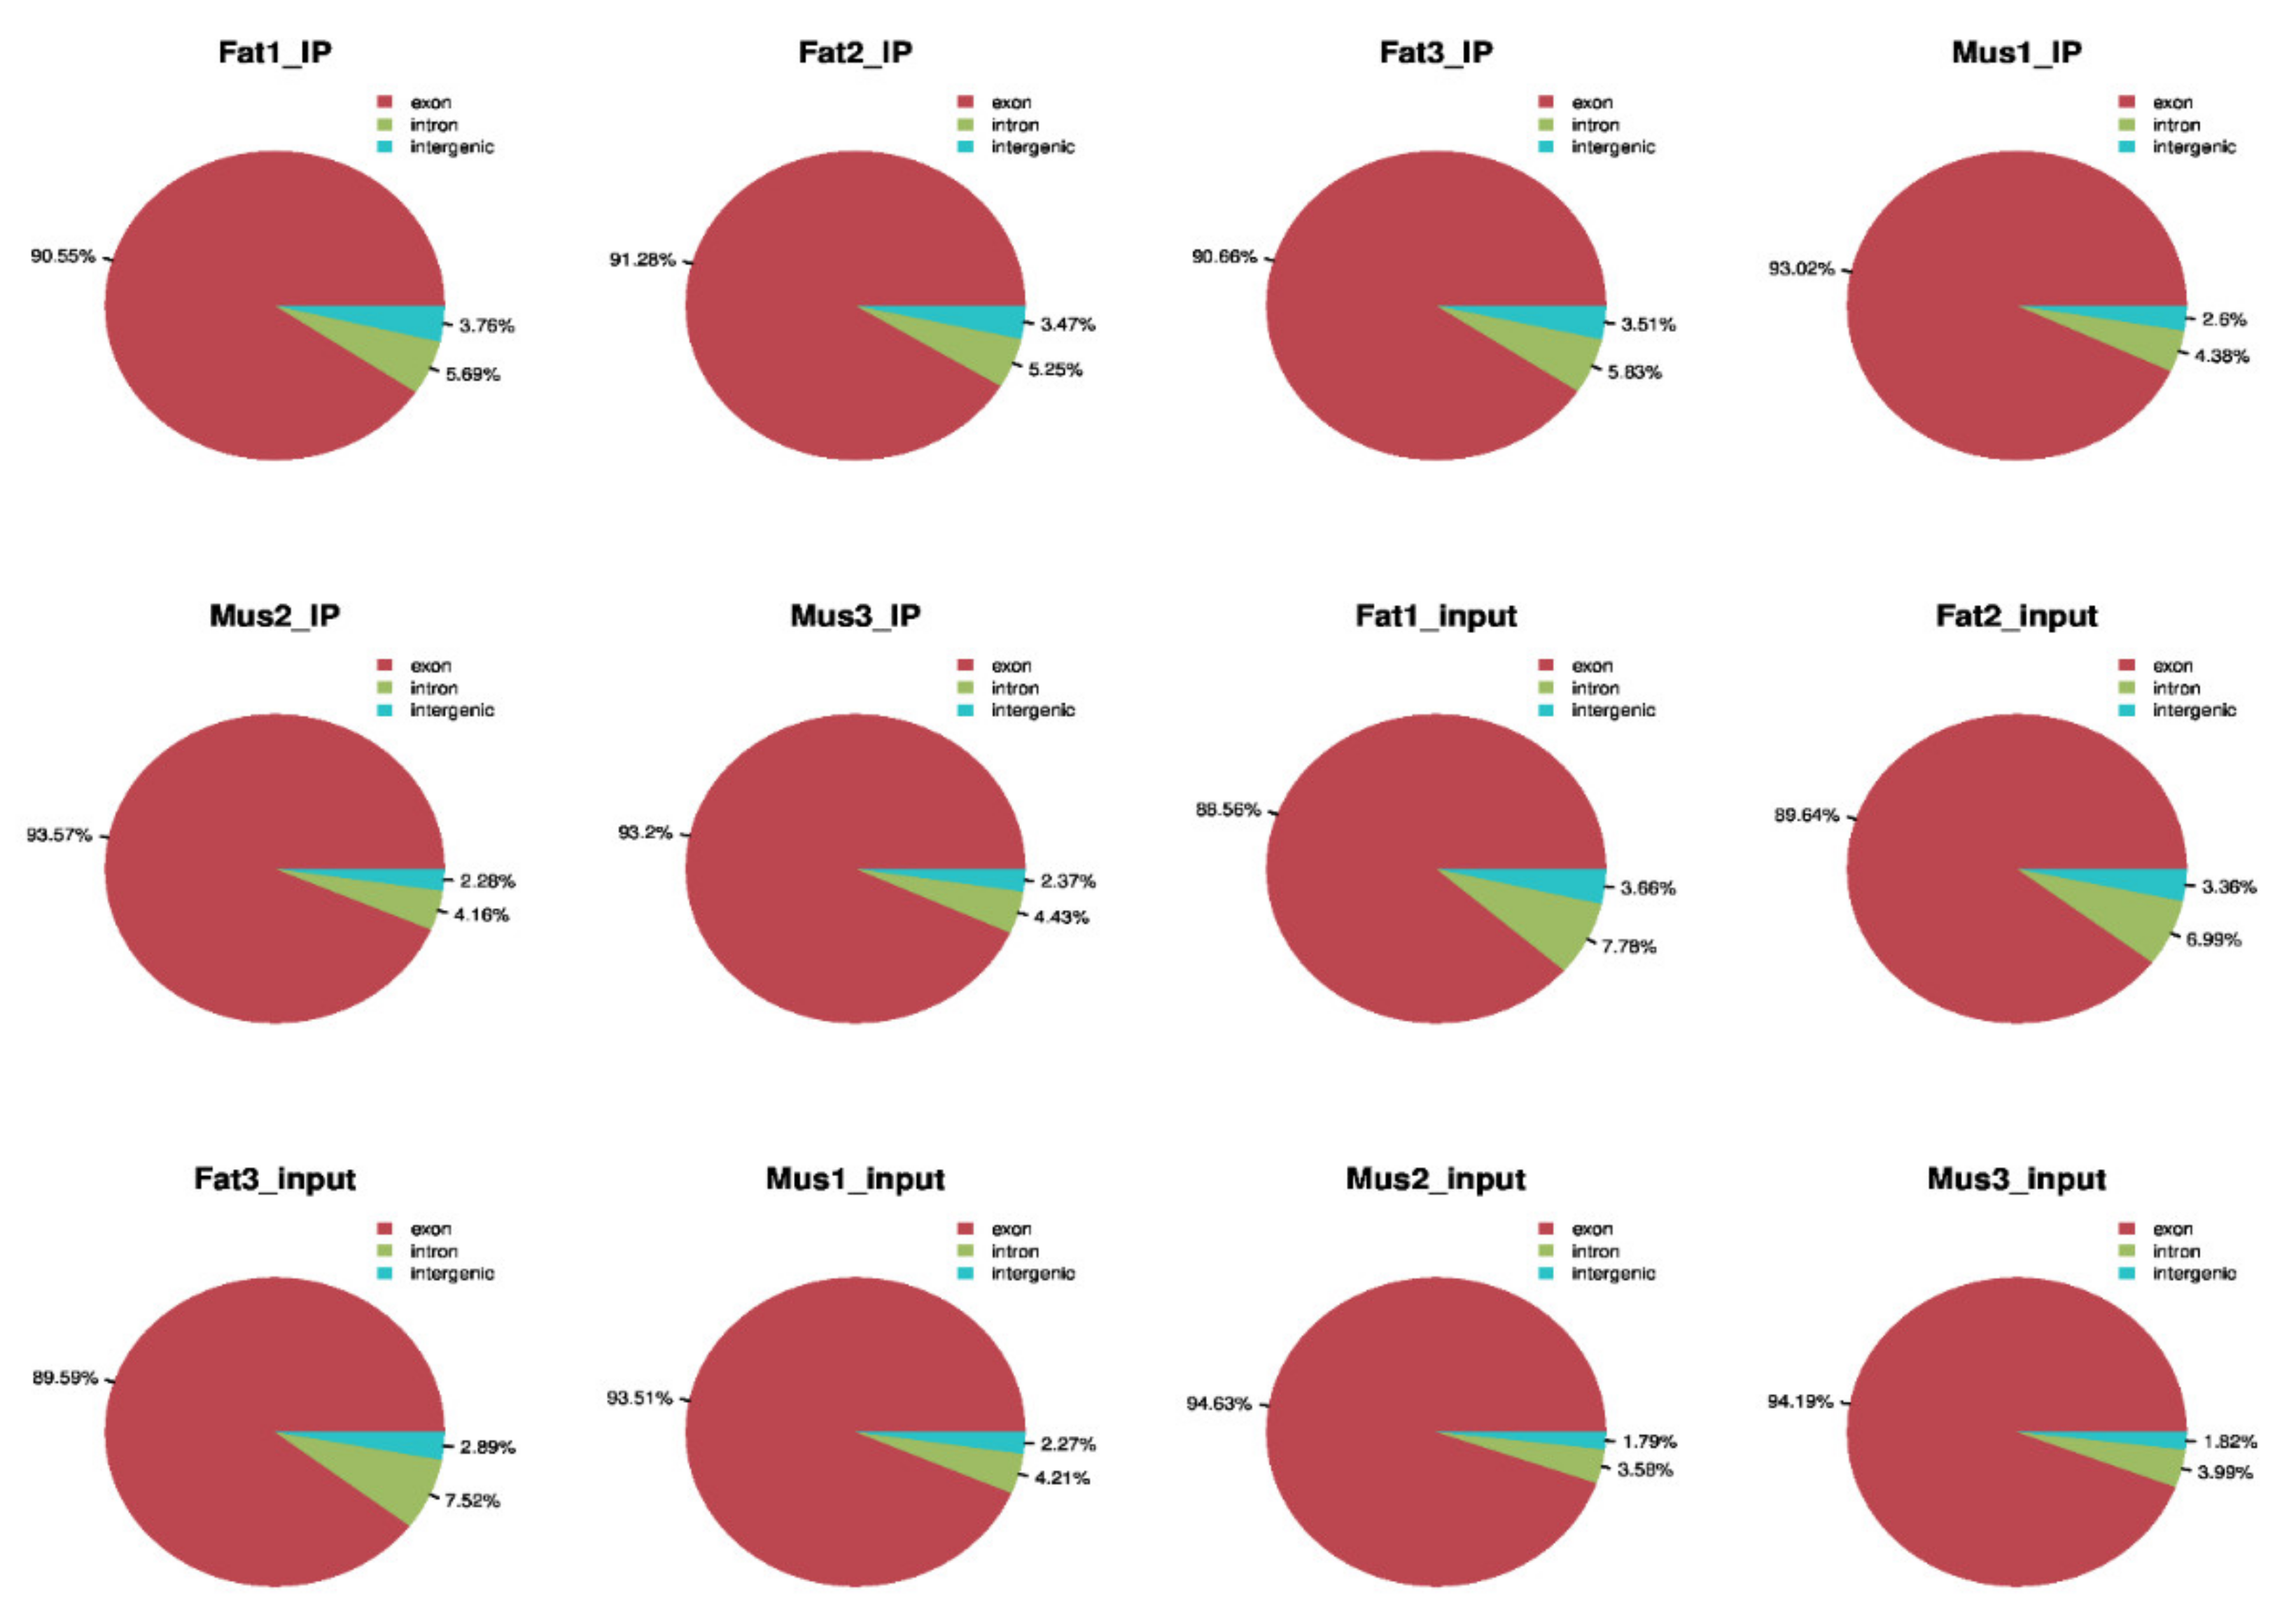
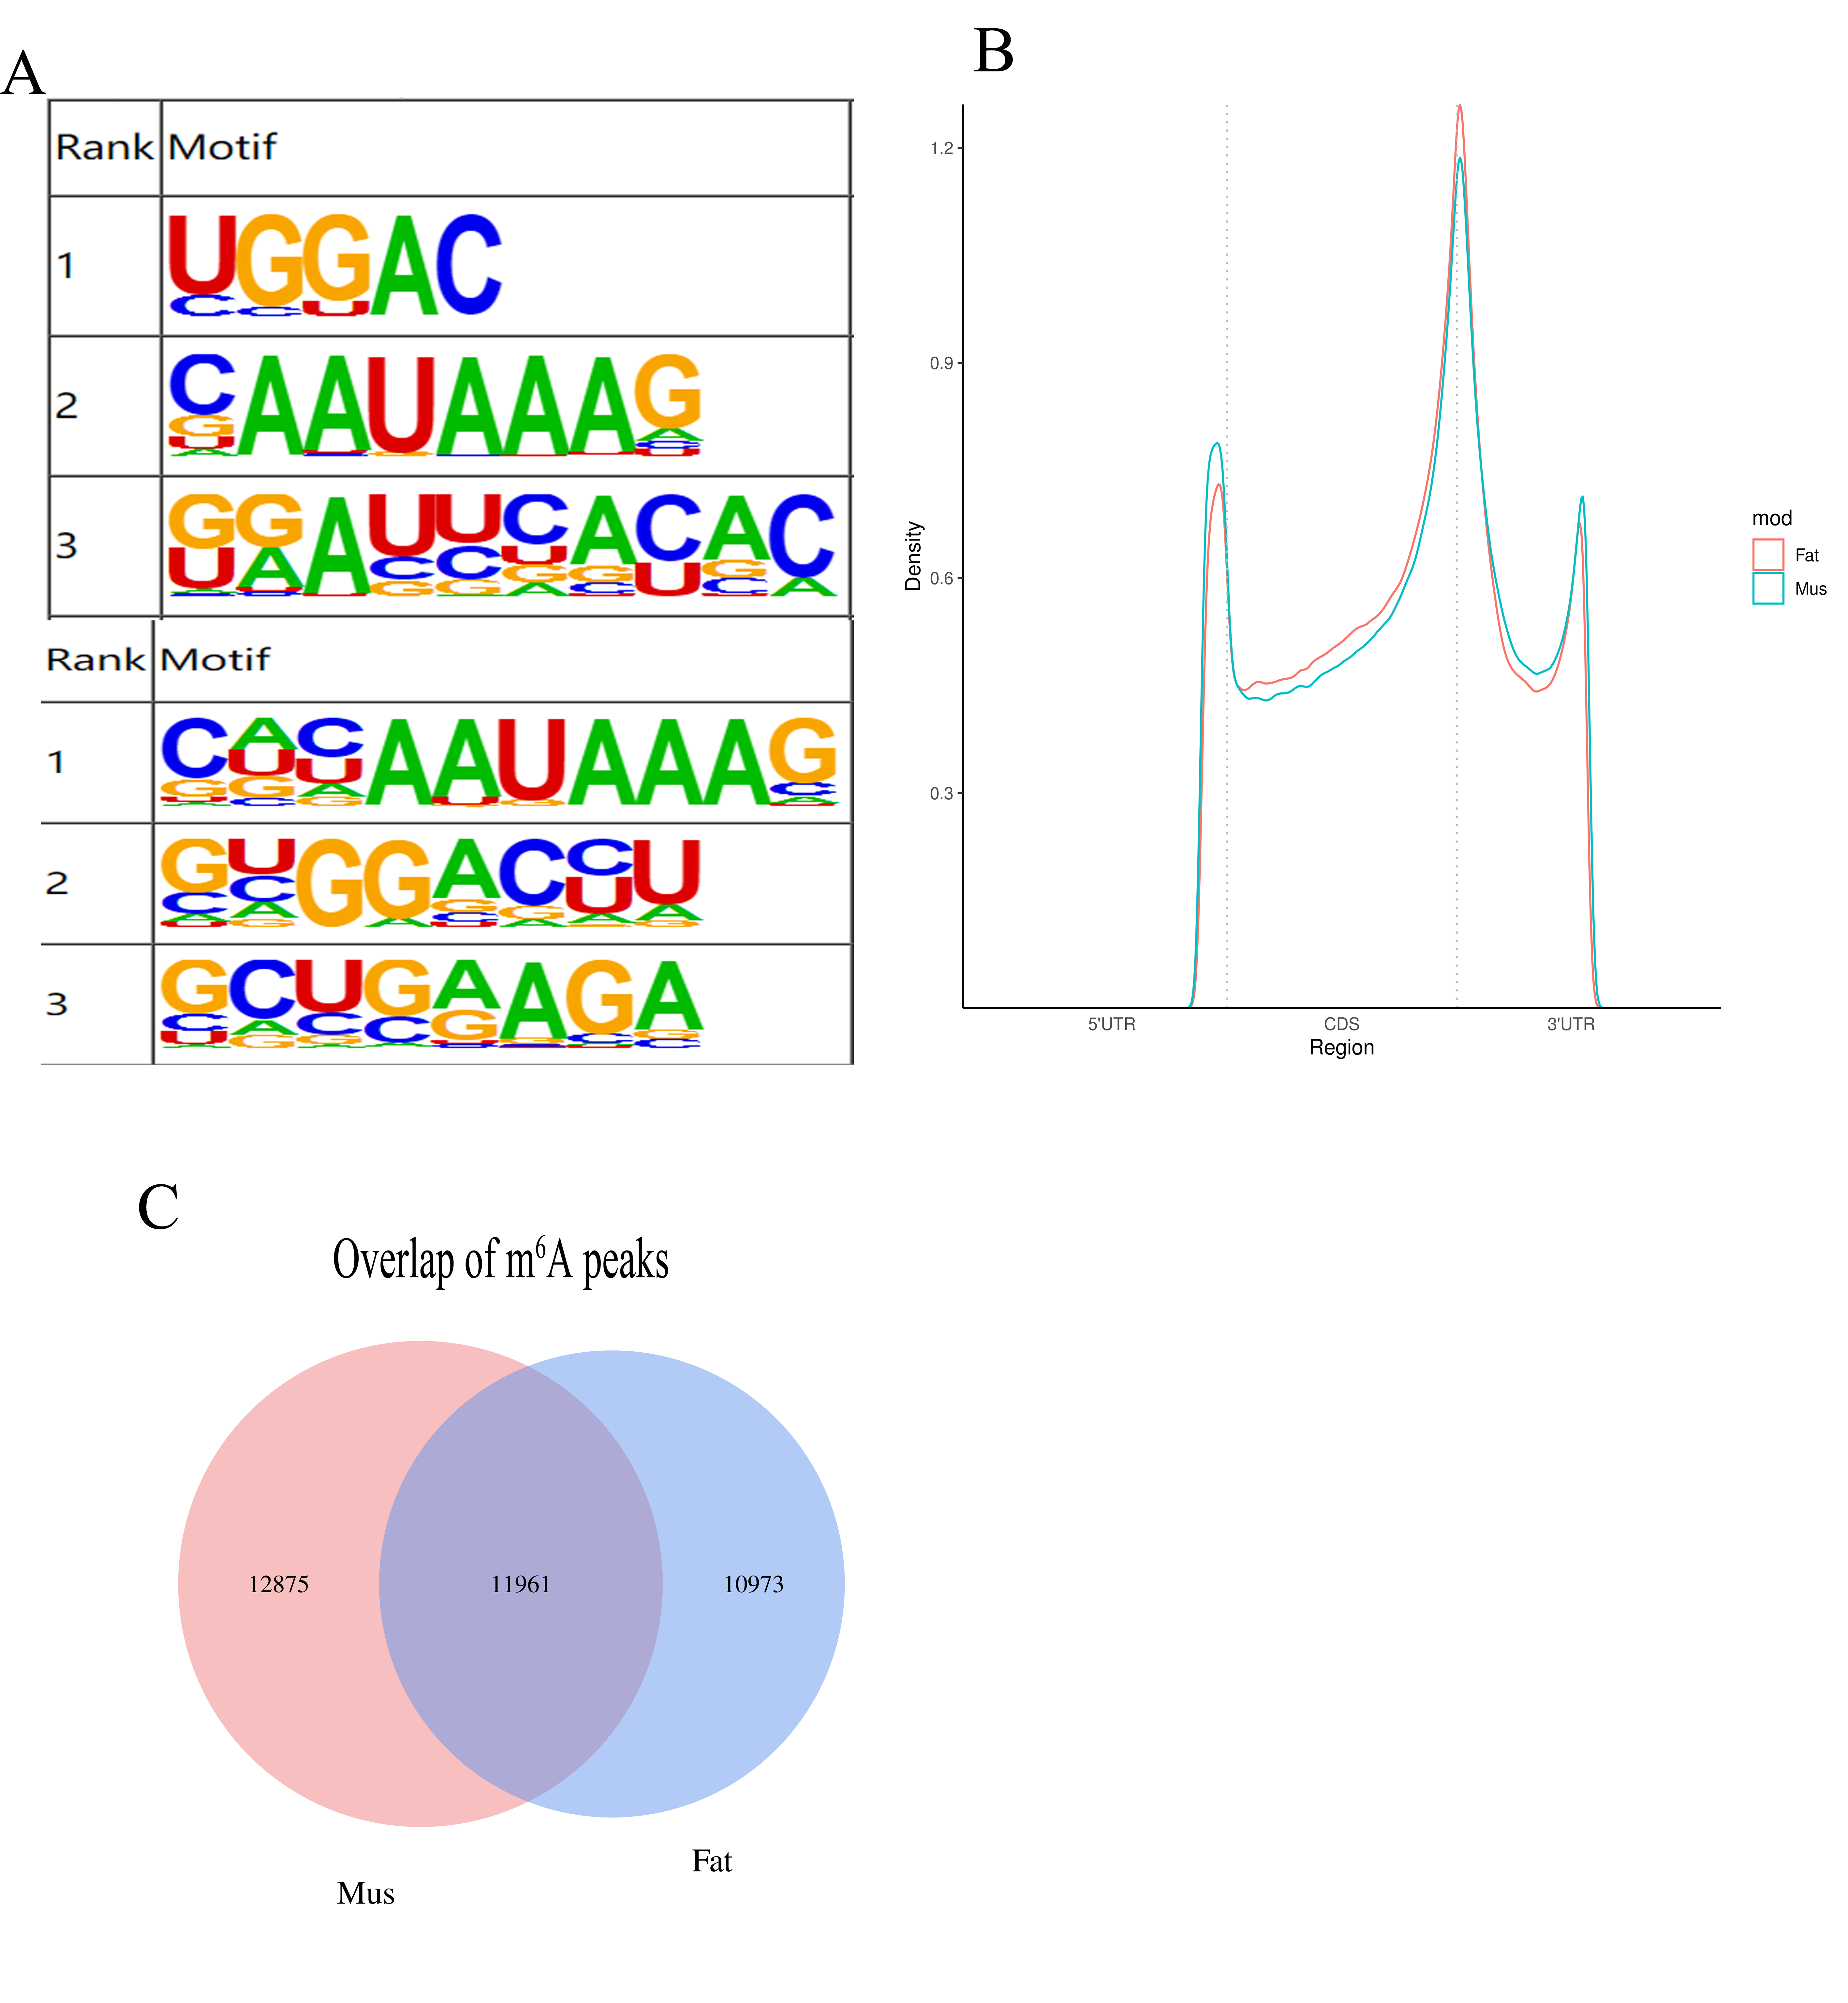
3.3. Transcriptome-Wide Detection and Distribution of m6A Modification in Rex Rabbits

We found m6A modified unique sequence RRACH in the sequencing results (Figure 2A). In addition, the distribution trend of m6A peaks in fat and muscle was similar, but there was significant difference in 5′ UTR; CDs, or only the end of CDs and the beginning of 3′ UTR were higher in fat than in muscle (Figure 2B). To determine the conservation and consequent functional importance of m6A, the expression of methylome from two rabbit tissues were compared. We identified 11,961 common peaks that were present from both tissues (Figure 2C).

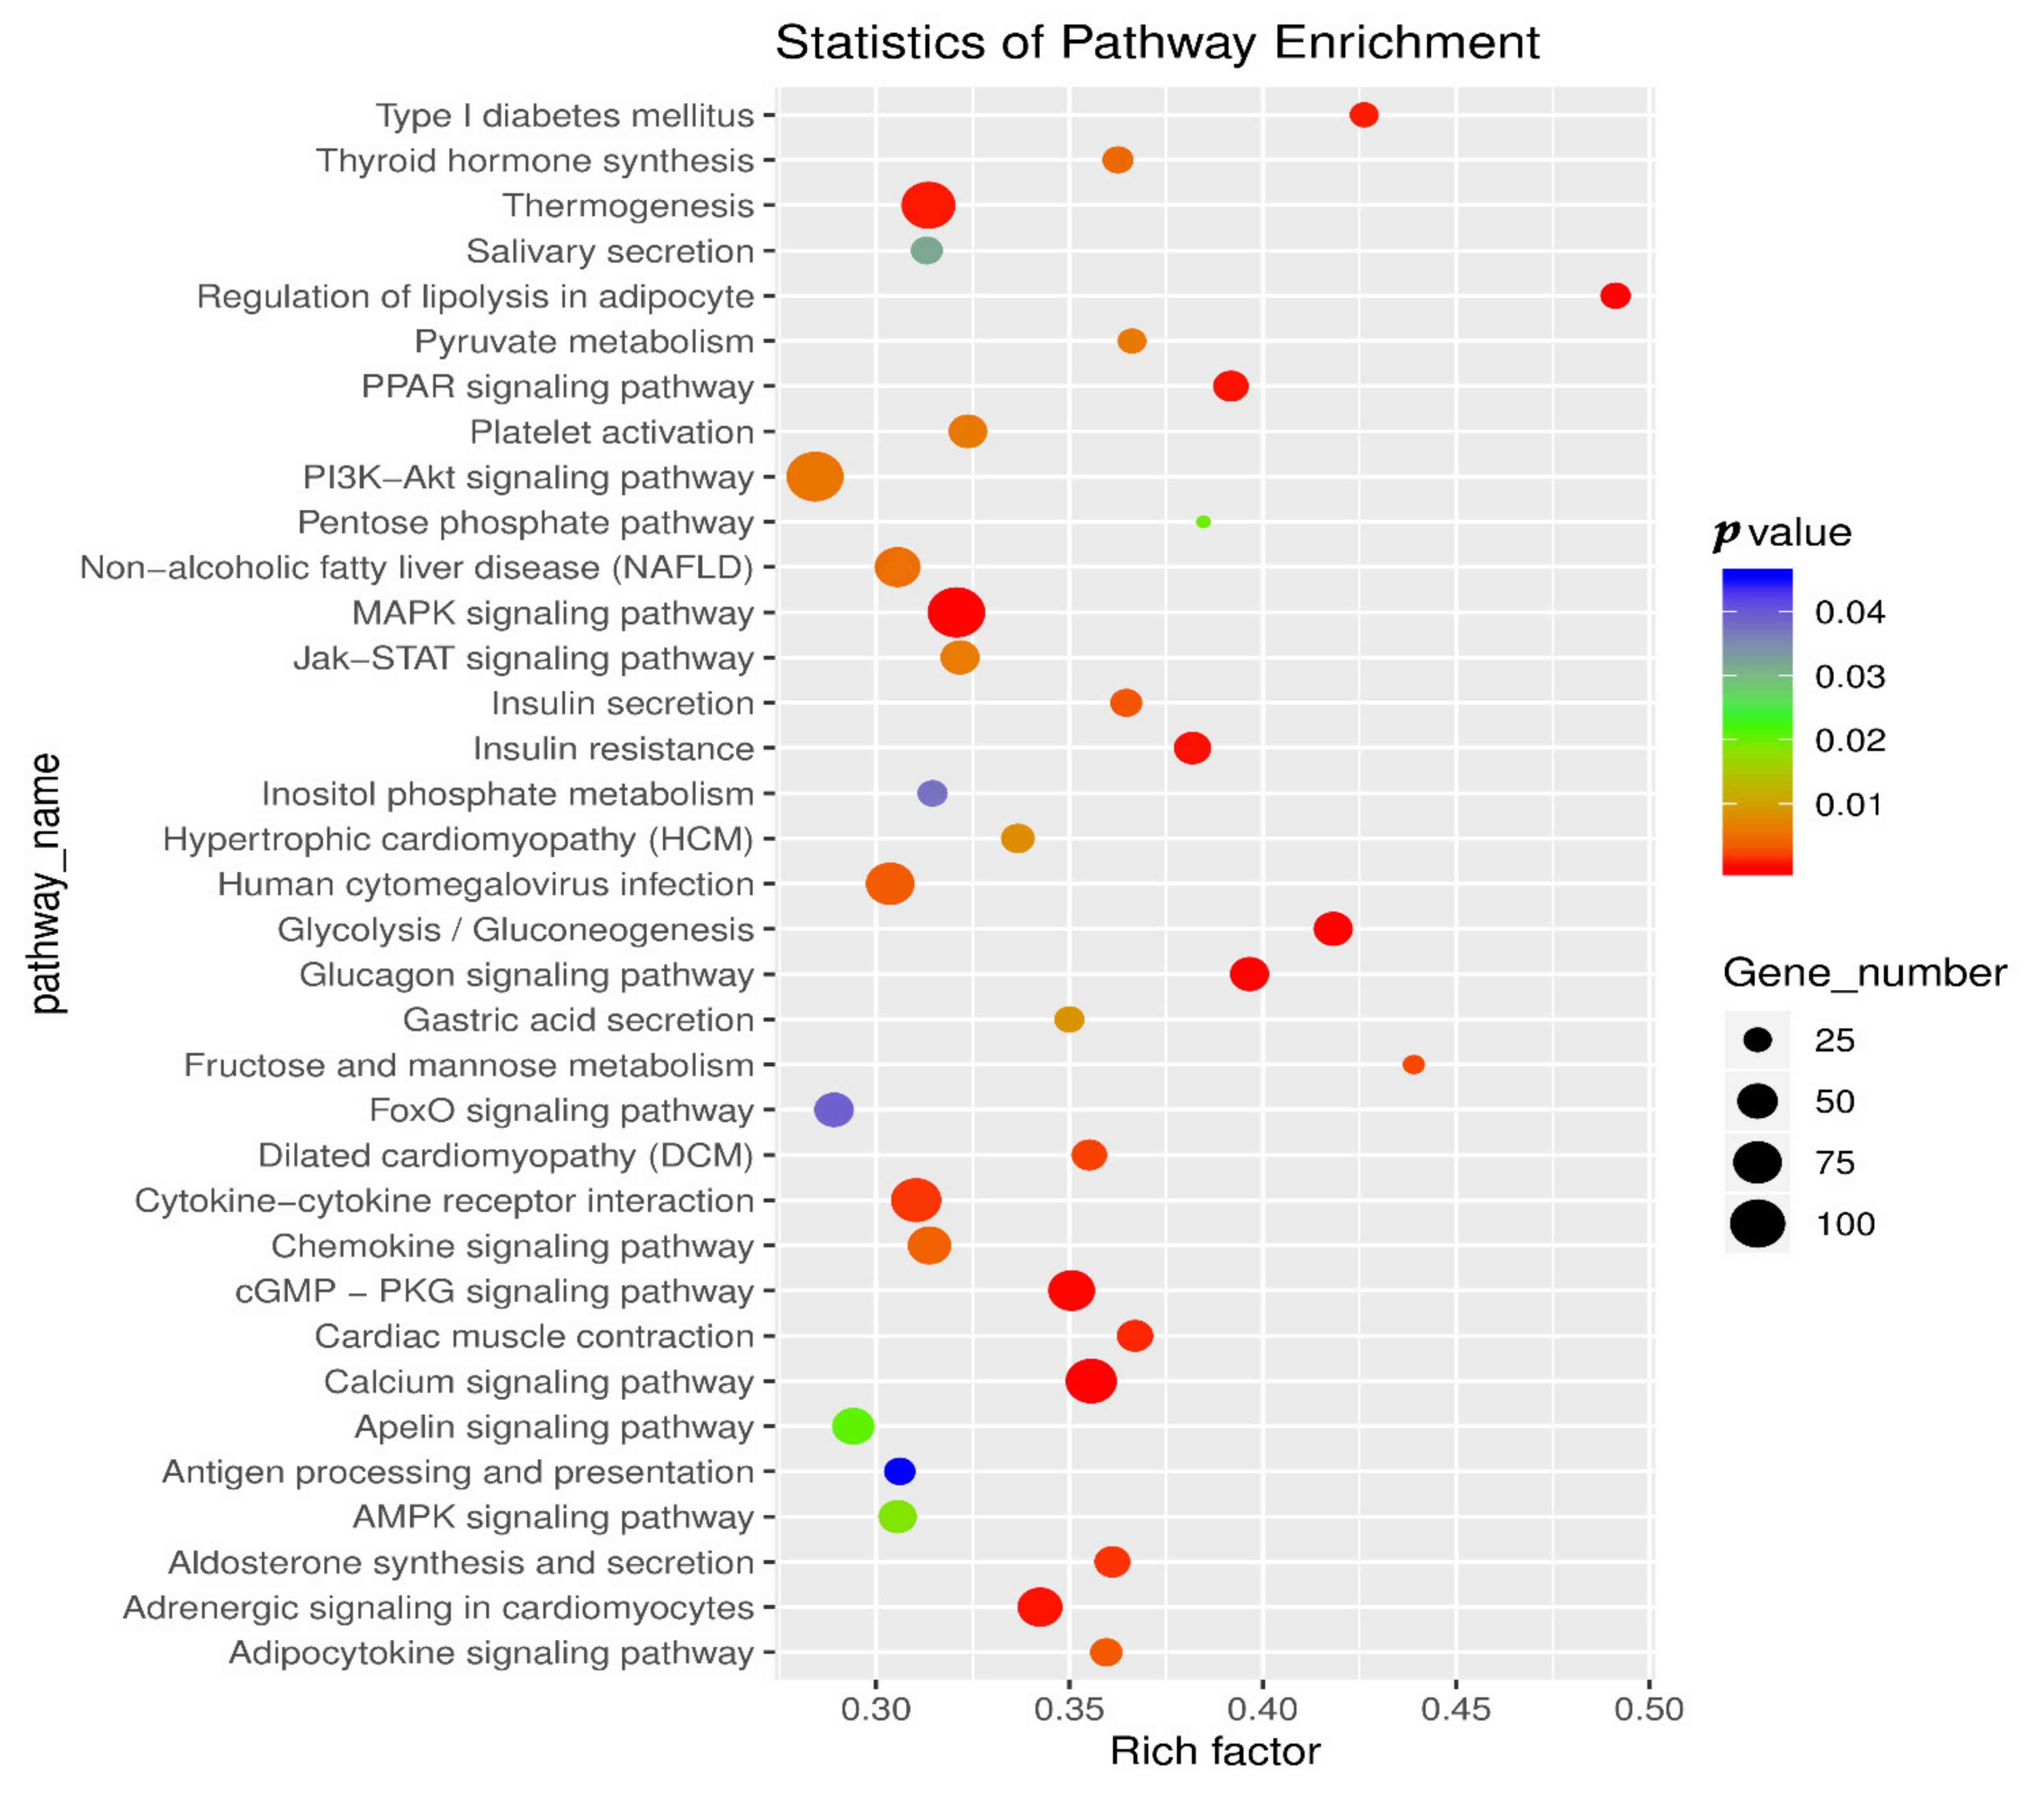
3.4. KEGG Pathway Analysis in Muscle and Adipose Tissue

Based on previous studies, we found that 35 KEGG pathways (Figure 3) are related to fat metabolism and meat quality among the 330 KEGG pathways, including regulation of lipolysis in adipocyte, the MAPK signaling pathway, the PPAR signaling pathway, aldosterone synthesis and secretion, and other signal pathways.

3.5. Gene Screening and Overview of m6A-Modified Genes

Based on sequencing results, we found that 10 genes are hypo-methylation, and 2 genes are hyper-methylation. The distribution of 12 genes on a chromosome and the positions of the peaks in genes are shown in Table 3. Further exploration of these gene peaks revealed that 5 gene peaks covered only one exon among the 12 genes (Table 4). The distance between the peak and TSS, the size of the exon or UTR region that the peak spans or covers, and the initiation site relative to the first methylation initiation site are shown in Table 5. By further exploring the relationship between methylation regulation and gene regulation, we found that 9 genes were up regulated when methylation was down regulated, whereas 1 gene was down regulated when methylation was up regulated (Table 5). In addition, for one gene, methylation and gene expression were down regulated simultaneously, and for the remaining one, both were up regulated at the same time.

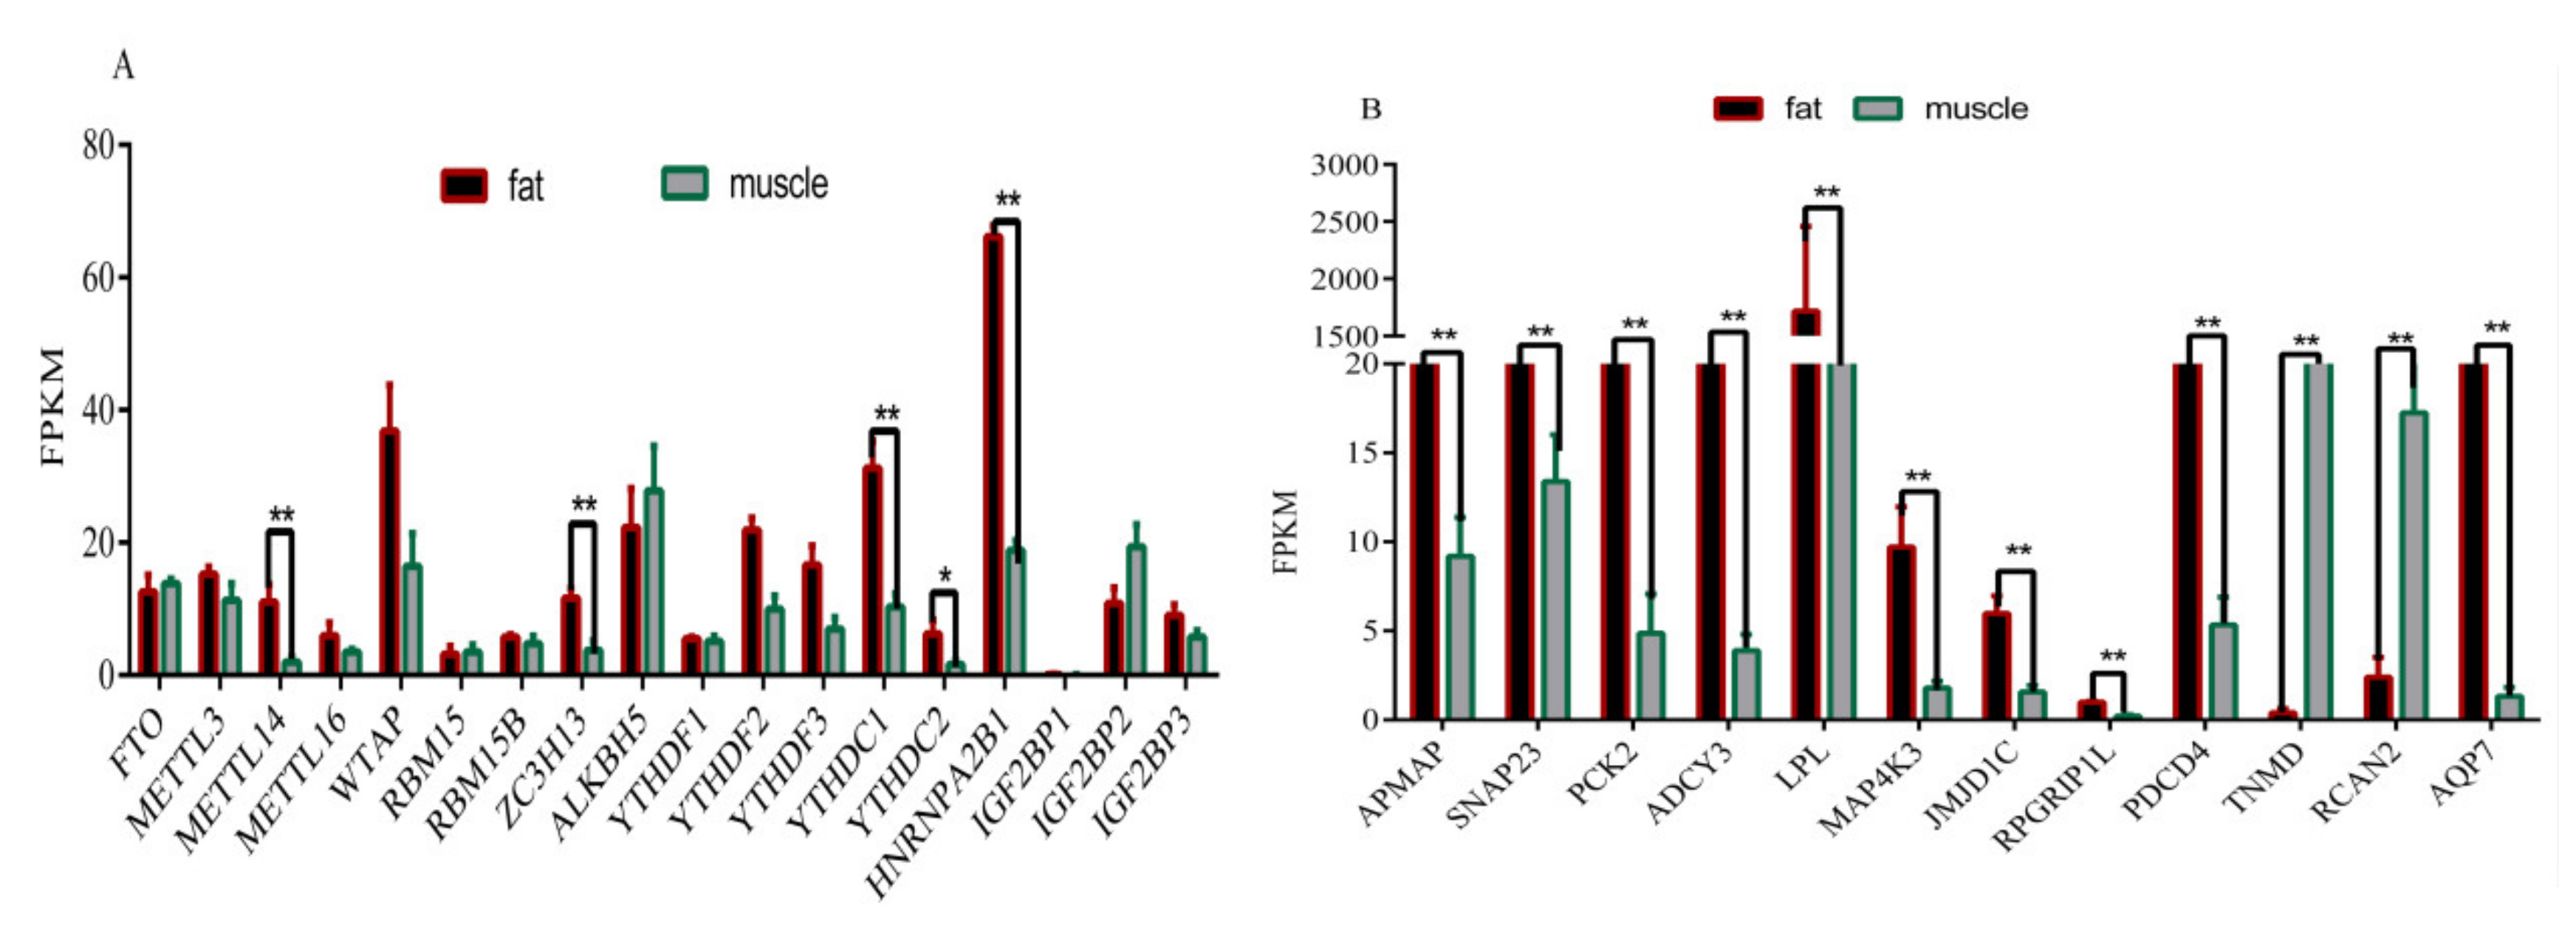
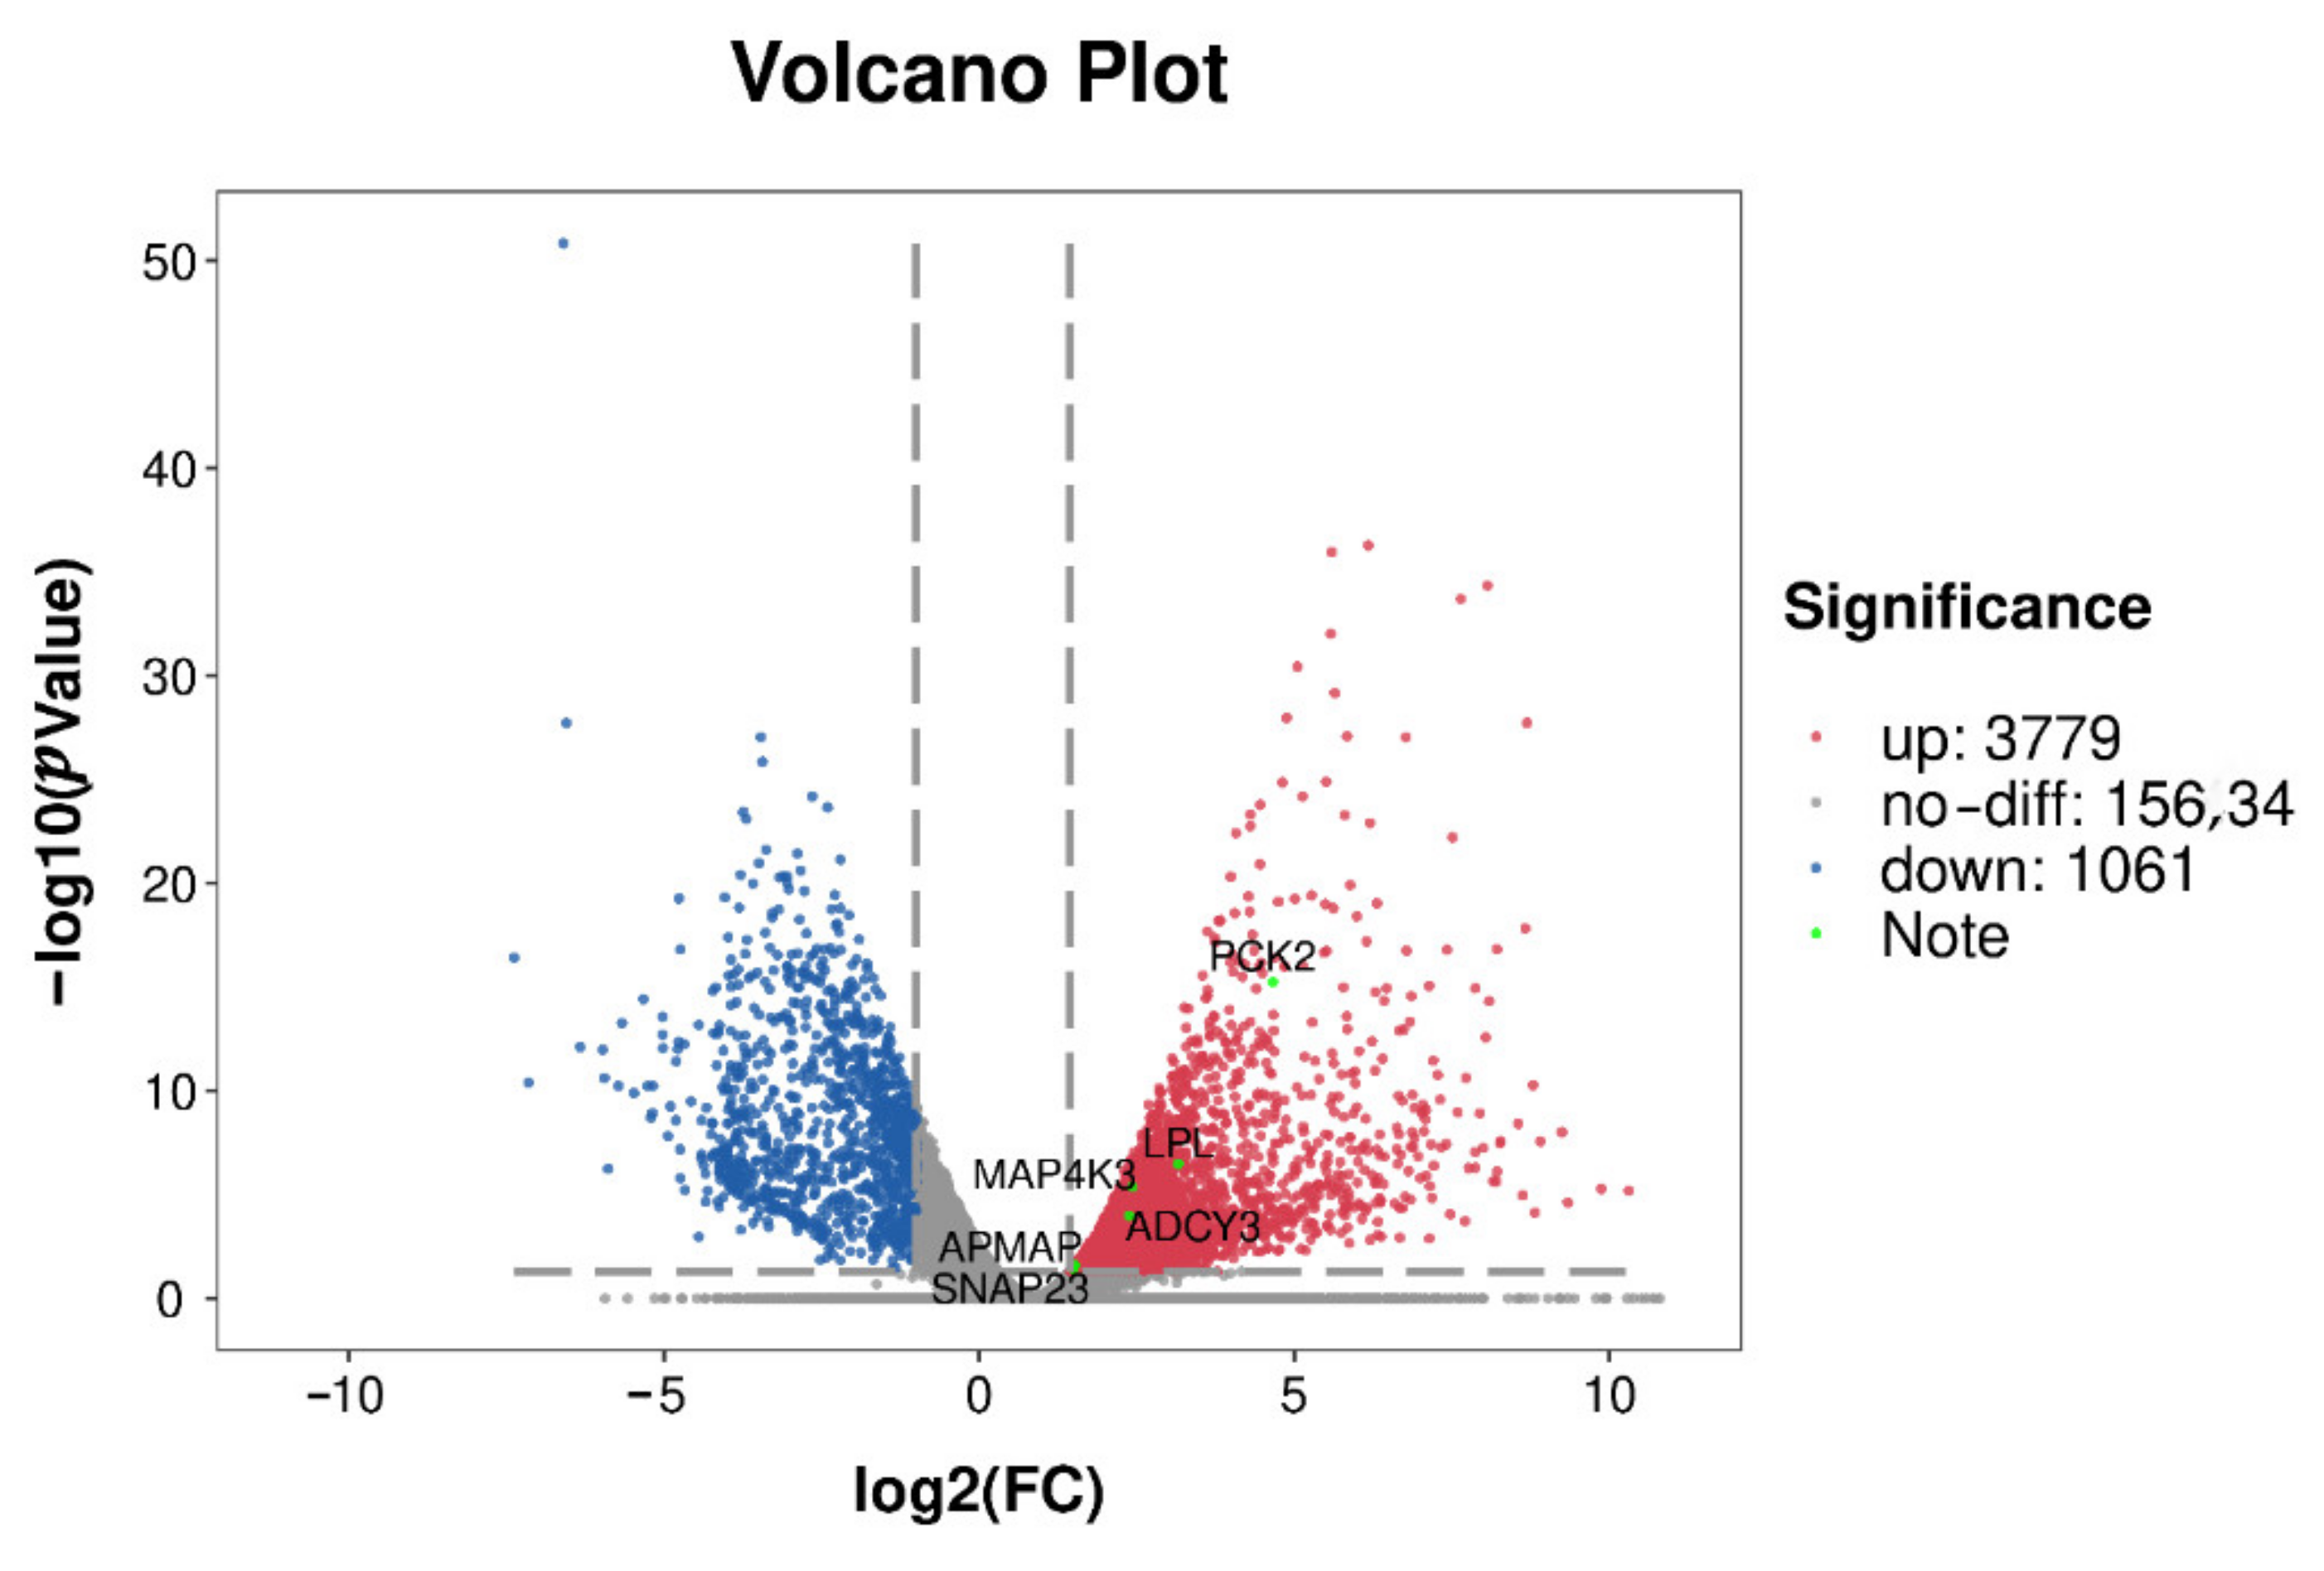
3.6. Overview of Differentially Expressed of Methylase Genes and Genes Related to Fat Deposition and Meat Quality in Muscle and Adipose Tissue Samples

We further explored the expression of methylase and found that expression levels of METTL14, ZC3H13, YTHDC1, and HNRNPA2B1 in muscle tissue were significantly lower than those in adipose tissue (p < 0.01), and the expression level of YTHDC2 was lower than that in adipose tissue (p < 0.05) (Figure 4A). Compared with the expression of muscle tissue, the results of FPKM values showed lower mRNA expression levels of the TNMD gene and RCAN2 gene in adipose tissue (p < 0.01) (Figure 4B). However, the expression levels of the LPL gene, APMAP gene, SNAP23 gene, PCK2 gene, MAP4K3 gene, ADCY3 gene, JMJD1C gene, PDCD4 gene, AQP7 gene, and RPGRIP1L gene in adipose tissue were significantly higher than these in muscle tissue (p < 0.01) (Figure 4B).

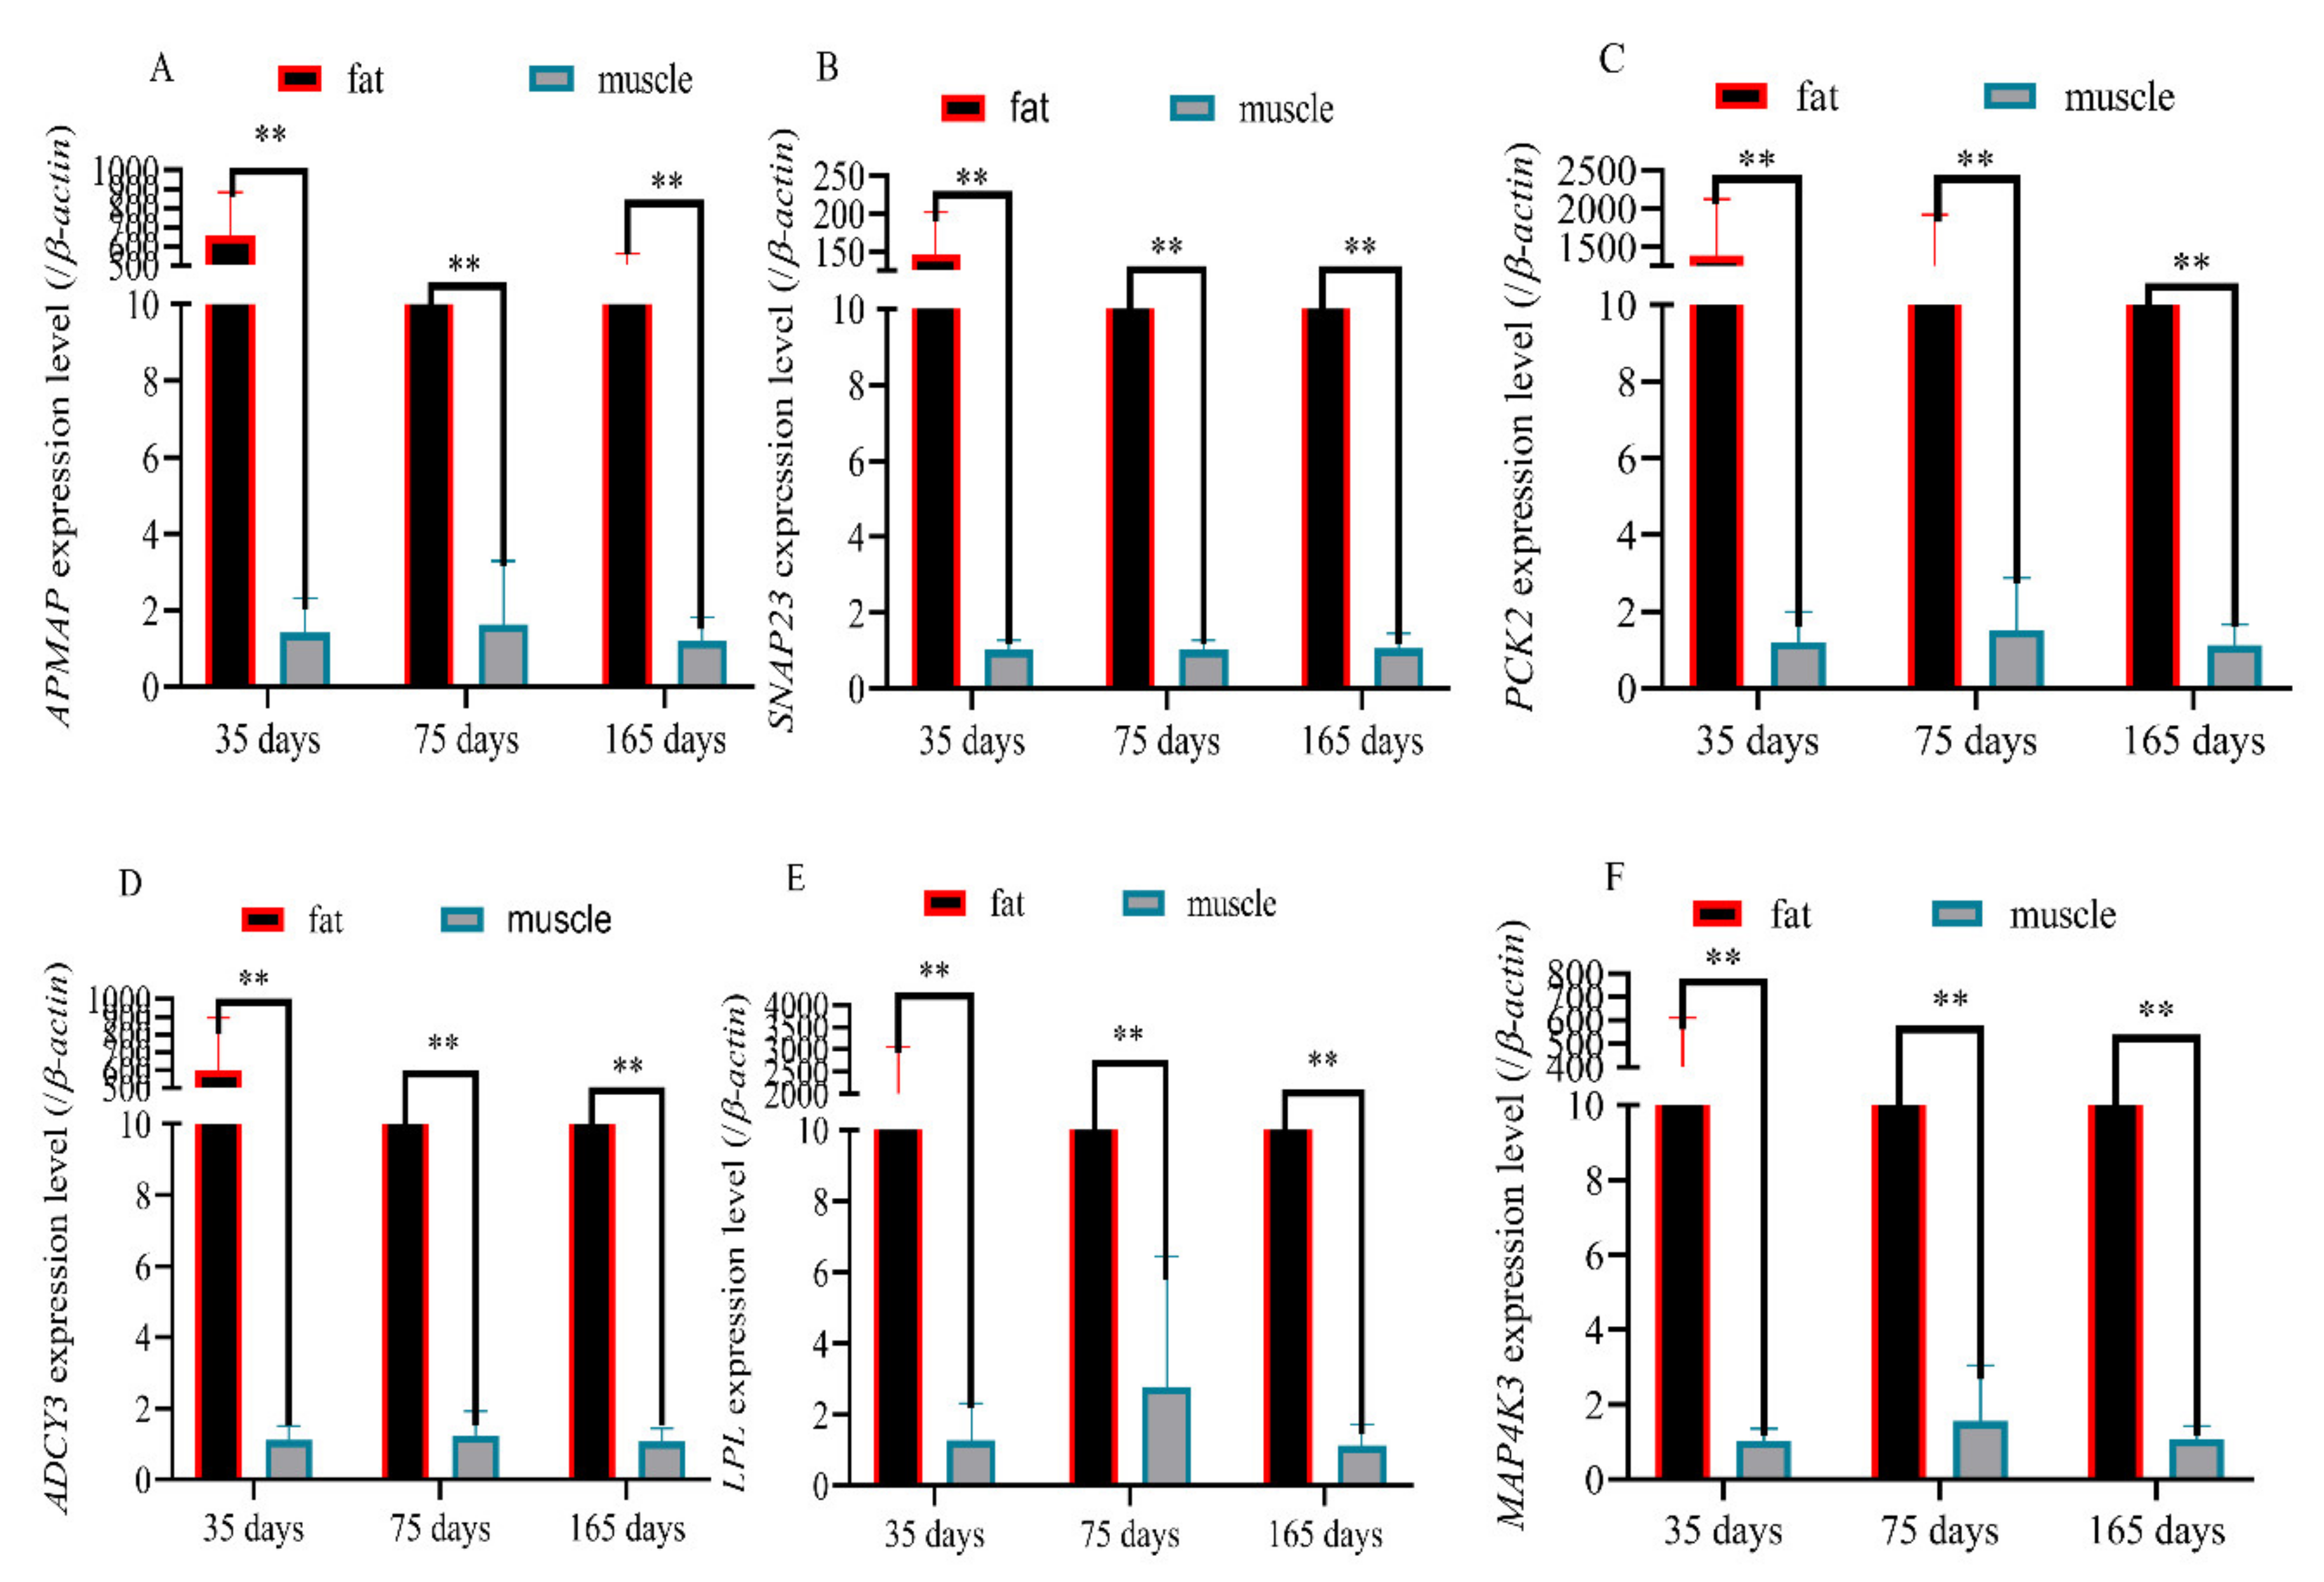
3.7. Validation of Six Randomly Genes Related to Fat Deposition and Meat Quality by RT-qPCR

The expression levels of the LPL gene, SNAP23 gene, PCK2 gene, ADCY3 gene, APMAP gene, and MAP4K3 gene in adipose tissue were significantly higher than in the muscle tissue of Rex rabbits at 35 days of age, 75 days of age, and 165 days of age (p < 0.01) (Figure 5A–F), which was consistent with the results of RNA-seq (Figure 6).

3.8. Validation of Six Randomly Genes Related to Fat Deposition and Meat Quality by RT-qPCR

As shown in Figure 7, we found that METTL14, YTHDC1, ZC3H13, YTHDC2, and HNRNPA2B1 regulated the expression of genes such as the LPL gene, APMAP gene, SNAP23 gene, PCK2 gene, MAP4K3 gene, ADCY3 gene, JMJD1C gene, PDCD4 gene, AQP7 gene, RPGRIP1L gene, TNMD gene, and RCAN2 gene through a variety of pathways based on previous studies.

4. Discussion

M6A, as a new method of gene modification which has attracted more and more attention. However, we found no research on Rex rabbits. In this study, we found many methylation enzymes, methylation modification genes, and m6A peaks through using MeRIP-Seq. The distribution of the m6A peak in genes is similar to that in mice and humans [24,25]. However, the enrichment of the m6A site in plants is very different from that in Rex rabbits [26,27]. These results indicate that m6A modification is conserved only in mammals. In addition, an m6A-modified unique sequence, RRACH [28], was abundant in the sequencing results, indicating that there were a large number of m6A-modified sites.
In this study, methylase METTL14, ZC3H13, YTHDC1, HNRNPA2B1, and YTHDC2 exist simultaneously in adipose tissue and muscle tissue, and the expression in adipose tissue is significantly higher than that in muscle tissue (p < 0.01). Previous studies have shown that METTL14 [29] played an important role in fat deposition. In addition, YTHDC1, ZC3H13, YTHDC2, and HNRNPA2B1 affected fat deposition through PTEN [30,31], AKT [32,33], AKT, and STAT3 [34,35], respectively. However, the pathways of METTL14, YTHDC1, ZC3H13, YTHDC2, and HNRNPA2B1 in regulating fat deposition are still unclear.
In order to further explore the specific regulatory mechanism of m6A modification in fat deposition, we analyzed the sequencing data by KEGG pathway to deduce potential functions of m6A-modified genes and found many of genes related to fat deposition and meat quality that we screened appeared in these signaling pathways. For example, LPL appeared in the cholesterol metabolism pathway; PCK2 appeared in glycolysis/gluconeogenesis and adipocytokine signaling pathway, PI3K-Akt signaling pathway, pyruvate metabolism, AMPK signaling pathway, and FOXO signaling pathways; MAP4K3 appeared in the MAPK signaling pathway; AQP7 appeared in the regulation of lipolysis in the adipocyte and PPAR signaling pathways; and ADCY3 appeared in the calcium signaling, regulation of lipolysis in adipocyte, thermogenesis, aldosterone synthesis and secretion, dilated cardiomyopathy (DCM), insulin secretion, chemokine signaling, thyroid hormone synthesis, platelet activation, gastric acid secretion, salivary secretion, and apelin signaling pathways. In addition, many key genes regulating fat deposition and meat quality appeared in other pathways, such as PTEN, leptin, and IL-6. First, METTL14 can regulate 4 of the 12 key genes. METTL14 promoted the binding of pri-miRNA-19a and pri-miRNA-375 to DGCR8 and subsequent transformation into mature miRNA-19a and miRNA-375 [8]. MiRNA-19a played an important role in regulating the PTEN/AKT/pAKT pathway [36]. The PTEN-regulating miR-26a is amplified in high-grade glioma and miR-26a potently induced apoptosis and downregulated the expressions of MAP4K3 [37,38]. miR-375 increased insulin secretion and insulin increased the activity of NM-IIA in the SNAP23 complex by decreasing the level of SEPTIN7 [39,40]. ZC3H13 regulates AKT via inactivating Ras–ERK signaling [41,42]. Insulin can inhibit the expression of PCK2 by activating the AKT/FOXO1 signaling pathway, which is one of the main ways for insulin to inhibit hepatic gluconeogenesis [43]. FOXO1 mediated leptin on food intake and the central leptin–melanocortin pathway played a pivotal role in the regulation of obesity by ADCY3 [44,45]. Second, YTHDC1 can regulate 7 of the 12 key genes. YTHDC1 increased AKT phosphorylation by promoting PTEN mRNA degradation [30]. As mentioned before, PTEN can regulate the MAP4K3 gene, PCK2 gene, and ADCY3 gene by different pathways. In addition, YTHDC1 facilitated the biogenesis of mature miR-30d via m6A-mediated regulation [46]. miR-30d suppressed the PI3K/AKT pathway to inhibit cell biological progression [47], and the PI3K signaling pathway played an important role in regulating AQP7 expression [48]. At the same times Resistin up-regulates LPL expression through the PPARγ-dependent PI3K/AKT signaling pathway, and PPAR-γ could modulate APMAP function [8]. Besides, Cut-like Homeobox 1 (CUX1) expression was decreased by PI3K inhibitors [49] and CUX1 regulated expression of the retinitis pigmentosa GTPase regulator-interacting protein-1-like (RPGRIP1L) gene [50]. Third, HNRNPA2B1 regulated 3 of the 12 key genes. HNRNPA2B1 can promote the STAT3 pathway [34] and leptin-activated human B cells to secrete IL-6 via the JAK2/STAT3 signaling pathway [51]. IL-6 mediated the transcription of JMJD1C by regulating OCT-4 gene expression [52,53] and reduced the expression of TNMD [54]. Finally, YTHDC2 regulated 3 of the 12 key genes. YTHDC2 is targeted for (HIF-1α) [55] 9 and HIF-1α could inhibit the expression of PDCD4 by upregulating the expression of miR-21 [56,57]. In addition, YTHDC2 could physically bind to insulin-like growth factor 1 receptor (IGF1R) messenger RNA and promote translation initiation of IGF1R mRNA [32]. IGF-IR/PKM2 regulates miR-148a/152 expression [58], and CIRC-TTC3 binds to miR-148a to regulate RCAN2 [59]. These results indicated 4 methylases can regulate 12 key genes in different ways.
In order to further explore the effect of methylase on fat deposition through the key genes we screened, we summarized studies on the regulation of 12 key genes on fat deposition. APMAP is single transmembrane arylesterase which plays a cardinal role in adipogenesis [60]. Lipid droplet size is increased through fusion of primordial droplets, and SNARE proteins, including the SNAP23, are involved in this process [61]. PCK2 is responsible for gluconeogenesis with lactic acid as a substrate [62]. The ADCY3 gene is associated with obesity and lipid metabolism [63,64]. LPL plays an important role in the differentiation and maturation of animal adipocytes and in controlling the distribution of triglycerides in fat and muscle [65]. The percentage of 3T3-L1 preadipocytes differentiated into adipocytes was significantly reduced by interfering with MAP4K3 expression in 3T3-L1 cells [66]. JMJD1C promotes lipogenesis in vivo to increase hepatic and plasma triglyceride levels [67]. CNS abnormalities caused by RPGRIP1L haploinsufficiency may cause obesity in humans [68]. HFD-fed PDCD4−/− mice displayed relatively normal adipocyte morphology [69]. TNMD gene polymorphism is closely related to obesity and glucose metabolism [70]. RCAN2 knockout can resist obesity induced by age and high-energy food, which preliminarily reveals the role of the RCAN2 gene in the regulation process of fat deposition [71]. AQP7 participates in adipogenesis and regulates the transport of triglycerides after hydration [72]. So, we speculated that 12 genes can affect fat deposition and meat quality.

5. Conclusions

In summary, we found 5 methylases and 12 genes associated with fat deposition and meat quality that were methylated. The expression levels of six random key genes were significantly higher in the fat than that in the muscle of Rex rabbits at different stages. Finally, we verified that 5 methylases regulated adipogenesis by 12 key gene in varies signaling pathways base on previous studies. The study provided a theoretical basis for our future research on the function of methylation modification during the growth of fat deposition and provided a new way to increase intramuscular fat in Rex rabbits.

Author Contributions

G.L. cultured cells and wrote the manuscript; Z.R. and S.W. conceived and designed the experiments; J.L. and Y.A. performed samples collection. All authors have read and agreed to the published version of the manuscript.

Funding

This work was supported by the Yangling Demonstration Area Industry University Research and Application Collaborative Innovation Major Project (1017cxy-15), Agricultural Science and Technology Innovation and Tackling Key Projects in Shaanxi Province (2016NY-108), and Integration and Demonstration of Rabbit Breeding and Factory Breeding Technology (2018ZDXM-NY-041).

Institutional Review Board Statement

The study was conducted according to the guidelines of the Declaration of Helsinki and approved by the Institutional Animal Care and Use Committee in College of Animal Science and Technology, Northwest A&F University, Yangling, China under permit No. DK-2019008 in March 2020.

Informed Consent Statement

Not applicable.

Data Availability Statement

The datasets supporting the conclusions of this article are included within the article. The sequencing data has been uploaded to NCBI and the BioProject ID is PRJNA794064 (https://www.ncbi.nlm.nih.gov/Traces/study/?acc=PRJNA794064, accessed on 10 June 2022).

Acknowledgments

We thank the staff at our laboratory for their ongoing assistance.

Conflicts of Interest

The authors declare no conflict of interest.

References

  1. Luo, G.; Mu, J.; Wang, S.; Dong, X.; Ren, Z. Association of blood APMAP content and meat quality trait in Rex rabbits. Anim. Biotechnol. 2021, 30, 1–16. [Google Scholar] [CrossRef] [PubMed]
  2. Kopelman, P.G. Obesity as a medical problem. Nature 2000, 404, 635–643. [Google Scholar] [CrossRef] [PubMed]
  3. Barnett, R. Obesity. Lancet 2005, 365, 1843–1851. [Google Scholar] [CrossRef]
  4. Fu, Y.; Dominissini, D.; Rechavi, G.; He, C. Gene expression regulation mediated through reversible m6A RNA methylation. Nat. Rev. Genet. 2014, 15, 293–306. [Google Scholar] [CrossRef]
  5. Wu, R.; Jiang, D.; Wang, Y.; Wang, X. N(6)-Methyladenosine (m(6)A) Methylation in mRNA with A Dynamic and Reversible Epigenetic Modification. Mol. Biotechnol. 2016, 58, 450–459. [Google Scholar] [CrossRef]
  6. Saletore, Y.; Meyer, K.; Korlach, J.; Vilfan, I.D.; Jaffrey, S.; Mason, C.E. The birth of the Epitranscriptome: Deciphering the function of RNA modifications. Genome Biol. 2012, 13, 175. [Google Scholar] [CrossRef] [Green Version]
  7. Jia, G.; Fu, Y.; Zhao, X.; Dai, Q.; Zheng, G.; Yang, Y. N6-methyladenosine in nuclear RNA is a major substrate of the obesity-associated FTO. Nat. Chem. Biol. 2011, 1, 885–887. [Google Scholar] [CrossRef]
  8. Yang, Y.; Hsu, P.J.; Chen, Y.S.; Yang, Y.G. Dynamic transcriptomic m(6)A decoration: Writers, erasers, readers and functions in RNA metabolism. Cell Res. 2018, 28, 616–624. [Google Scholar] [CrossRef] [Green Version]
  9. Schwartz, S.; Mumbach, M.; Jovanovic, M.; Wang, T.; Maciag, K.; Bushkin, G.G.; Mertins, P.; Ter-Ovanesyan, D.; Habib, N.; Cacchiarelli, D. Perturbation of m6A Writers Reveals Two Distinct Classes of mRNA Methylation at Internal and 5′ Sites. Cell Rep. 2014, 8, 284–296. [Google Scholar] [CrossRef] [Green Version]
  10. Batista, P.M.B.; Wang, J.; Qu, K.; Zhang, J.; Li, L.; Bouley, D.; Lujan, E.; Haddad, B.; Daneshvar, K. m(6)A RNA modification controls cell fate transition in mammalian embryonic stem cells. Cell Stem Cell 2014, 15, 707–719. [Google Scholar] [CrossRef] [Green Version]
  11. Zhao, B.; He, C. Fate by RNA methylation: M 6 A steers stem cell pluripotency. Genome Biol. 2015, 16, 41–43. [Google Scholar] [CrossRef] [Green Version]
  12. Zhao, X.; Yang, Y.; Sun, B.; Shi, Y.; Yang, X.; Xiao, W.; Hao, Y.; Ping, X.; Chen, Y.; Wang, W.; et al. FTO-dependent demethylation of N6-methyladenosine regulates mRNA splicing and is required for adipogenesis. Cell Res. 2014, 24, 1403–1419. [Google Scholar] [CrossRef]
  13. Merkestein, M.; Laber, S.; Mcmurray, F.; Andrew, D.; Sachse, G.; Sanderson, J.; Li, M.; Usher, S.; Sellayah, D.; Ashcroft, F.M. FTO influences adipogenesis by regulating mitotic clonal expansion. Nat. Commun. 2015, 6, 6792–6801. [Google Scholar] [CrossRef] [Green Version]
  14. Ma, C.; Chang, M.; Lv, H.; Zhang, Z.; Zhang, W.; He, X.; Wu, G.; Zhao, S.; Zhang, Y.; Wang, D.; et al. RNA m(6)A methylation participates in regulation of postnatal development of the mouse cerebellum. Genome Biol. 2018, 19, 68. [Google Scholar] [CrossRef] [Green Version]
  15. Lin, Z.; Hsu, P.J.; Xing, X.; Fang, J.; Lu, Z.; Zou, Q.; Zhang, K.; Zhang, X.; Zhou, Y.; Zhang, T.; et al. Mettl3-/Mettl14-mediated mRNA N6-methyladenosine modulates murine spermatogenesis. Cell Res. 2017, 27, 1216–1230. [Google Scholar] [CrossRef]
  16. Xu, K.; Yang, Y.; Feng, G.H.; Sun, B.F.; Chen, J.Q.; Li, Y.F.; Chen, Y.S.; Zhang, X.X.; Wang, C.X.; Jiang, L.Y. Mettl3-mediated m6A regulates spermatogonial differentiation and meiosis initiation. Cell Res. 2017, 27, 1100–1114. [Google Scholar] [CrossRef] [Green Version]
  17. Geula, S.; Moshitch-Moshkovitz, S.; Dominissini, D.; Mansour, A.A.; Kol, N.; Salmon-Divon, M.; Hershkovitz, V.; Peer, E.; Mor, N.; Manor, Y.S. m6A mRNA methylation facilitates resolution of nave pluripotency toward differentiation. Science 2015, 347, 1002–1006. [Google Scholar] [CrossRef]
  18. Ping, X.-L.; Chen, T.; Wang, M.; Li, M.M.; Zhao, X. m(6)A RNA Methylation Is Regulated by MicroRNAs and Promotes Reprogramming to Pluripotency. Cell Stem Cell 2015, 16, 289–301. [Google Scholar]
  19. Luo, G.; Hu, S.; Lai, T.; Wang, J.; Lai, S. MiR-9-5p promotes rabbit preadipocyte differentiation by suppressing leptin gene expression. Lipids Health Dis. 2020, 19, 1–11. [Google Scholar] [CrossRef]
  20. Schmittgen, K.J.L.D. Analysis of Relative Gene Expression Data Using Real-Time Quantitative PCR and the 2−ΔΔCT Method. Methods 2001, 25, 402–408. [Google Scholar]
  21. Bailey, T.L.; Boden, M.; Buske, F.A.; Frith, M.; Grant, C.E.; Clementi, L.; Ren, J.; Li, W.W.; Noble, W.S. MEME Suite: Tools for motif discovery and searching. Nucleic Acids Res. 2009, 37, 202–208. [Google Scholar] [CrossRef] [PubMed]
  22. Heinz, S.; Benner, C.; Spann, N.; Bertolino, E.; Lin, Y.C.; Laslo, P.; Cheng, J.X.; Murre, C.; Singh, H.; Glass, C.K. Simple Combinations of Lineage-Determining Transcription Factors Prime cis-Regulatory Elements Required for Macrophage and B Cell Identities—ScienceDirect. Mol. Cell 2010, 38, 576–589. [Google Scholar] [CrossRef] [PubMed] [Green Version]
  23. Robinson, M.D.; Mccarthy, D.J.; Smyth, G.K. edgeR: A Bioconductor package for differential expression analysis of digital gene expression data. Biogeosciences 2010, 26, 139–140. [Google Scholar] [CrossRef] [PubMed] [Green Version]
  24. Dominissini, D.; Moshitch-Moshkovitz, S.; Schwartz, S.; Salmon-Divon, M.; Ungar, L.; Osenberg, S.; Cesarkas, K.; Jacob-Hirsch, J.; Amariglio, N.; Kupiec, M.; et al. Topology of the human and mouse m6A RNA methylomes revealed by m6A-seq. Nature 2012, 485, 201–206. [Google Scholar] [CrossRef]
  25. Meyer, K.D.; Saletore, Y.; Olivier, Z.P. Comprehensive Analysis of mRNA Methylation Reveals Enrichment in 3′ UTRs and near Stop Codons. Cell 2012, 149, 1635–1646. [Google Scholar] [CrossRef] [Green Version]
  26. Luo, G.Z.; Macqueen, A.; Zheng, G.; Duan, H.; Dore, L.C.; Lu, Z.; Liu, J.; Chen, K.; Jia, G.; Bergelson, J. Unique features of the m6A methylome in Arabidopsis thaliana. Nat. Commun. 2013, 5, 5630–5647. [Google Scholar] [CrossRef] [Green Version]
  27. Li, Y.; Wang, X.; Li, C.; Hu, S.; Yu, J.; Song, S. Transcriptome-wide N6-methyladenosine profiling of rice callus and leaf reveals the presence of tissue-specific competitors involved in selective mRNA modification. RNA Biol. 2014, 11, 1180–1188. [Google Scholar] [CrossRef] [Green Version]
  28. Wang, Y.; Zheng, Y.; Guo, D.; Zhang, X.; Bai, W. m6A Methylation Analysis of Differentially Expressed Genes in Skin Tissues of Coarse and Fine Type Liaoning Cashmere Goats. Front. Genet. 2020, 10, 1318. [Google Scholar] [CrossRef]
  29. Masatoshi, K.; Mitsuru, O.; Takayoshi, S.; Motoharu, A.; Toshihiro, U.; Aya, I.; Naoki, K.; Yukiko, O.; Naoto, K.; Ryo, S. The RNA methyltransferase complex of WTAP, METTL3, and METTL14 regulates mitotic clonal expansion in adipogenesis. Mol. Cell. Biol. 2018, 38, 116–118. [Google Scholar]
  30. Zhang, Z.; Wang, Q.; Zhao, X.; Shao, L.; Xu, R. YTHDC1 mitigates ischemic stroke by promoting Akt phosphorylation through destabilizing PTEN mRNA. Cell Death Dis. 2020, 11, 977. [Google Scholar] [CrossRef]
  31. He, H.; Cai, M.; Zhu, J.; Xiao, W.; Liu, B.; Shi, Y.; Yang, X.; Liang, X.; Zheng, T.; Hu, S. miR-148a-3p promotes rabbit preadipocyte differentiation by targeting PTEN. Vitr. Cell. Dev. Biol. Anim. 2018, 54, 241–249. [Google Scholar] [CrossRef]
  32. He, J.J.; Li, Z.; Rong, Z.X.; Gao, J.; Sun, L.Q. m6A Reader YTHDC2 Promotes Radiotherapy Resistance of Nasopharyngeal Carcinoma via Activating IGF1R/AKT/S6 Signaling Axis. Front. Oncol. 2020, 10, 1166. [Google Scholar] [CrossRef]
  33. Yun, S.J.; Kim, E.K.; Tucker, D.F.; Kim, C.D.; Birnbaum, M.J.; Bae, S.S. Isoform-specific regulation of adipocyte differentiation by Akt/protein kinase Balpha. Biochem. Biophys. Res. Commun. 2008, 371, 138–143. [Google Scholar] [CrossRef]
  34. Hu, Y.; Sun, Z.; Deng, J.; Hu, B.; Yan, W.; Wei, H.; Jiang, J. Splicing factor hnRNPA2B1 contributes to tumorigenic potential of breast cancer cells through STAT3 and ERK1/2 signaling pathway. Tumour Biol. 2017, 39, 1–11. [Google Scholar] [CrossRef] [Green Version]
  35. Wang, D.; Zhou, Y.; Lei, W.; Zhang, K.; Shi, J.; Hu, Y.; Shu, G.; Song, J. Signal transducer and activator of transcription 3 (STAT3) regulates adipocyte differentiation via peroxisome-proliferator-activated receptor γ (PPARγ). Biol. Cell 2010, 102, 1–12. [Google Scholar] [CrossRef]
  36. Zhang, X.; Chen, Y.; Li, Z.; Zhiqing, Z.; Wang, P. MicroRNA-19a functions as an oncogene by regulating PTEN/AKT/pAKT pathway in myeloma. Leuk. Lymphoma 2017, 58, 932–940. [Google Scholar] [CrossRef]
  37. Huse, J.T.; Brennan, C.; Hambardzumyan, D.; Wee, B. The PTEN-regulating microRNA miR-26a is amplified in high-grade glioma and facilitates gliomagenesis in vivo. Genes Dev. 2009, 23, 1327–1337. [Google Scholar] [CrossRef] [Green Version]
  38. Qian, H.; Yang, C.; Yang, Y. MicroRNA-26a inhibits the growth and invasiveness of malignant melanoma and directly targets on MITF gene. Cell Death Discov. 2017, 3, 17028. [Google Scholar] [CrossRef]
  39. Poy, M.N.; Hausser, J.; Trajkovski, M.; Braun, M.; Collins, S.; Rorsman, P.; Zavoian, M.; Stoffel, M. miR-375 maintains normal pancreatic α- and β-cell mass. Proc. Natl. Acad. Sci. USA 2009, 106, 5813–5818. [Google Scholar] [CrossRef] [Green Version]
  40. Wasik, A.A.; Dumont, V.; Tienari, J.; Nyman, T.A.; Fogarty, C.L.; Forsblom, C.; Lehto, M.; Lehtonen, E.; Groop, P.; Lehtonen, S. Septin 7 reduces nonmuscle myosin IIA activity in the SNAP23 complex and hinders GLUT4 storage vesicle docking and fusion—ScienceDirect. Exp. Cell Res. 2017, 350, 336–348. [Google Scholar] [CrossRef]
  41. Zhu, D.; Zhou, J.; Zhao, J.; Jiang, G.; Dong, M. ZC3H13 suppresses colorectal cancer proliferation and invasion via inactivating Ras–ERK signaling. J. Cell. Physiol. 2019, 234, 8899–8907. [Google Scholar] [CrossRef] [PubMed]
  42. Cheung, M.; Sharma, A.; Madhunapantula, S.V.; Robertson, G.P. Akt3 and Mutant V600EB-Raf Cooperate to Promote Early Melanoma Development. Cancer Res. 2008, 68, 3429–3439. [Google Scholar] [CrossRef] [PubMed] [Green Version]
  43. Gomez-Valades, A.G.; Mendez-Lucas, A.; Vidal-Alabro, A.; Blasco, F.X.; Chillon, M.; Bartrons, R.; Bermudez, J.; Perales, J.C. Pck1 Gene Silencing in the Liver Improves Glycemia Control, Insulin Sensitivity, and Dyslipidemia in db/db Mice. Diabetes 2008, 57, 2199–2210. [Google Scholar] [CrossRef] [PubMed] [Green Version]
  44. Kitamura, T.; Feng, Y.; Kitamura, Y.I.; Chua, S.C.; Xu, A.W.; Barsh, G.S.; Rossetti, L.; Accili, D. Forkhead protein FoxO1 mediates Agrp-dependent effects of leptin on food intake. Nat. Med. 2006, 12, 534–540. [Google Scholar] [CrossRef] [PubMed]
  45. Michael, J.K.; Bradford, B.L.; Alastair, S.G. Melanocortin-4 receptor-regulated energy homeostasis. Nat. Neurosci. 2016, 19, 206–219. [Google Scholar]
  46. Hou, Y.; Zhang, Q.; Pang, W.; Hou, L.; Meng, X. YTHDC1-mediated augmentation of miR-30d in repressing pancreatic tumorigenesis via attenuation of RUNX1-induced transcriptional activation of Warburg effect. Cell Death Differ. 2021, 28, 3105–3124. [Google Scholar] [CrossRef]
  47. Ye, C.; Yu, X.; Liu, X.; Dai, M.; Zhang, B. Erratum: miR-30d inhibits cell biological progression of Ewing’s sarcoma by suppressing the MEK/ERK and PI3K/Akt pathways in vitro. Oncol. Lett. 2021, 21, 133. [Google Scholar] [CrossRef]
  48. Mei, G.; Fu, C.; Lin, T.; Peng, Y.; Li, W.; Zhu, X.; Ling, L.; Chen, Y. Apelin-13 Decreases Lipid Storage in Hypertrophic Adipocytes In Vitro Through the Upregulation of AQP7 Expression by the PI3K Signaling Pathway. Med. Sci. Monit. Int. Med. J. Exp. Clin. Res. 2014, 20, 1345–1352. [Google Scholar]
  49. Ripka, S.; Neesse, A.; Riedel, J.; Bug, E.; Aigner, A.; Poulsom, R.; Fulda, S.; Neoptolemos, J.; Greenhalf, W.; Barth, P. CUX1: Target of Akt signalling and mediator of resistance to apoptosis in pancreatic cancer. Gut 2010, 59, 1101–1110. [Google Scholar] [CrossRef]
  50. Stratigopoulos, G.; Leduc, C.A.; Cremona, M.L.; Chung, W.K.; Leibel, R.L. Cut-like Homeobox 1 (CUX1) Regulates Expression of the Fat Mass and Obesity-associated and Retinitis Pigmentosa GTPase Regulator-interacting Protein-1-like (RPGRIP1L) Genes and Coordinates Leptin Receptor Signaling. J. Biol. Chem. 2011, 286, 2155–2170. [Google Scholar] [CrossRef] [Green Version]
  51. Agrawal, S.; Gollapudi, S.; Su, H.; Gupta, S. Leptin Activates Human B Cells to Secrete TNF-α, IL-6, and IL-10 via JAK2/STAT3 and p38MAPK/ERK1/2 Signaling Pathway. J. Clin. Immunol. 2011, 31, 472–478. [Google Scholar] [CrossRef] [Green Version]
  52. Kim, S.Y.; Kang, J.W.; Song, X.; Kim, B.K.; Yoo, Y.D.; Kwon, Y.T.; Lee, Y.J. Role of the IL-6-JAK1-STAT3-Oct-4 pathway in the conversion of non-stem cancer cells into cancer stem-like cells. Cell. Signal. 2013, 25, 961–969. [Google Scholar] [CrossRef] [Green Version]
  53. Katoh, M.; Katoh, M. Comparative integromics on JMJD1C gene encoding histone demethylase: Conserved POU5F1 binding site elucidating mechanism of JMJD1C expression in undifferentiated ES cells and diffuse-type gastric cancer. Int. J. Oncol. 2007, 31, 219–223. [Google Scholar] [CrossRef] [Green Version]
  54. Gaut, L.; Duprez, D. Tendon development and diseases. Wiley Interdiscip. Rev. Dev. Biol. 2016, 5, 5–23. [Google Scholar] [CrossRef] [Green Version]
  55. Tanabe, A.; Tanikawa, K.; Tsunetomi, M.; Takai, K.; Ikeda, H.; Konno, J.; Torigoe, T.; Maeda, H.; Kutomi, G.; Okita, K. RNA helicase YTHDC2 promotes cancer metastasis via the enhancement of the efficiency by which HIF-1α mRNA is translated. Cancer Lett. 2016, 376, 34–42. [Google Scholar] [CrossRef]
  56. Jia, Z.; Lian, W.; Shi, H.; Cao, C.; Han, S.; Wang, K.; Li, M.; Zhang, X. Ischemic Postconditioning Protects Against Intestinal Ischemia/Reperfusion Injury via the HIF-1α/miR-21 Axis. Sci. Rep. 2017, 7, 16190. [Google Scholar] [CrossRef] [Green Version]
  57. Wang, Z. miR-21 promotes migration and invasion by the miR-21-PDCD4-AP-1 feedback loop in human hepatocellular carcinoma. Oncol. Rep. 2012, 27, 1660–1668. [Google Scholar] [CrossRef] [Green Version]
  58. Xu, Q.; Liu, L.Z.; Yin, Y.; He, J.; Li, Q.; Qian, X.; You, Y.; Lu, Z.; Peiper, S.C.; Shu, Y. Regulatory circuit of PKM2/NF-κB/miR-148a/152-modulated tumor angiogenesis and cancer progression. Oncogene 2015, 34, 5482–5493. [Google Scholar] [CrossRef]
  59. Ma, X.; Zhu, G.; Jiao, T.; Shao, F. Effects of circular RNA Ttc3/miR-148a/Rcan2 axis on inflammation and oxidative stress in rats with acute kidney injury induced by sepsis. Life Sci. 2021, 272, 119233. [Google Scholar] [CrossRef]
  60. Bogner-Strauss, J.G.; Prokesch, A.; Sanchez-Cabo, F.; Rieder, D.; Hackl, H.; Duszka, K.; Krogsdam, A.; di Camillo, B.; Walenta, E.; Klatzer, A.; et al. Reconstruction of gene association network reveals a transmembrane protein required for adipogenesis and targeted by PPARγ. Cell. Mol. Life Ences 2010, 67, 4049–4064. [Google Scholar] [CrossRef]
  61. Boström, P.; Andersson, L.; Rutberg, M.; Perman, J.; Lidberg, U.; Johansson, B.R.; Fernandez-Rodriguez, J.; Ericson, J. SNARE proteins mediate fusion between cytosolic lipid droplets and are implicated in insulin sensitivity. Nat. Cell Biol. 2007, 9, 1286–1293. [Google Scholar] [CrossRef] [PubMed]
  62. Modaressi, S.; Brechtel, K.; Christ, B.; Jungermann, K.; Localization, C. Human mitochondrial phosphoenolpyruvate carboxykinase 2 gene. Structure, chromosomal localization and tissue-specific expression. Biochem. J. 1998, 333, 359–366. [Google Scholar] [CrossRef] [Green Version]
  63. Pitman, J.L.; Wheeler, M.C.; Lloyd, D.J.; Walker, J.R.; Glynne, R.J.; Gekakis, N. A Gain-of-Function Mutation in Adenylate Cyclase 3 Protects Mice from Diet-Induced Obesity. PLoS ONE 2014, 9, e110226. [Google Scholar] [CrossRef] [PubMed]
  64. Wu, L.; Shen, C.; Ahmed, M.S. Adenylate cyclase 3: A new target for anti-obesity drug development. Obes. Rev. 2016, 17, 907–921. [Google Scholar] [CrossRef] [PubMed]
  65. Sorisky, A. From Preadipocyte to Adipocyte: Differentiation-Directed Signals of Insulin from the Cell Surface to the Nucleus. Crc Crit. Rev. Clin. Lab. Sci. 1999, 36, 1–34. [Google Scholar] [CrossRef] [PubMed]
  66. Huang, N.; Wang, J.; Xie, W.; Lyu, Q.; Wu, J.; He, J.; Qiu, W.; Xu, N.; Zhang, Y. MiR-378a-3p enhances adipogenesis by targeting mitogen-activated protein kinase 1. Biochem. Biophys. Res. Commun. 2015, 457, 37–42. [Google Scholar] [CrossRef] [PubMed]
  67. Viscarra, J.A.; Wang, Y.; Nguyen, H.P.; Choi, Y.G.; Sul, H.S. Histone demethylase JMJD1C is phosphorylated by mTOR to activate de novo lipogenesis. Nat. Commun. 2020, 11, 1–16. [Google Scholar] [CrossRef] [PubMed]
  68. Thomas, S.; Cantagrel, V.; Mariani, L.; Serre, V.; Lee, J.; Elkhartoufi, N.; de Lonlay, P.; Desguerre, I.; Munnich, A.; Boddaert, N.; et al. Identification of a novel ARL13B variant in a Joubert syndrome-affected patient with retinal impairment and obesity. Eur. J. Hum. Genet. 2015, 23, 621–627. [Google Scholar] [CrossRef] [PubMed] [Green Version]
  69. Wang, Q.; Dong, Z.; Liu, X.; Song, X.; Song, Q.; Shang, Q.; Jiang, Y.; Guo, C.; Zhang, L. Programmed cell death-4 deficiency prevents diet-induced obesity, adipose tissue inflammation, and insulin resistance. Diabetes 2013, 62, 4132–4143. [Google Scholar] [CrossRef] [Green Version]
  70. Tolppanen, A.M.; Pulkkinen, L.; Kolehmainen, M.; Schwab, U.; Lindström, J.; Tuomilehto, J.; Uusitupa, M. Tenomodulin is Associated with Obesity and Diabetes Risk: The Finnish Diabetes Prevention Study. Obesity 2012, 15, 1082–1088. [Google Scholar] [CrossRef] [Green Version]
  71. Sun, X.Y.; Hayashi, Y.; Xu, S.; Kanou, Y.; Takagishi, Y.; Tang, Y.P.; Murata, Y. Inactivation of the Rcan2 Gene in Mice Ameliorates the Age- and Diet-Induced Obesity by Causing a Reduction in Food Intake. PLoS ONE 2011, 6, e14605. [Google Scholar] [CrossRef]
  72. Miyauchi, T.; Yamamoto, H.; Abe, Y.; Yoshida, G.J.; Rojek, A.; Sohara, E.; Uchida, S.; Yasui, M. Dynamic subcellular localization of aquaporin-7 in white adipocytes. Febs Lett. 2015, 589, 608–614. [Google Scholar] [CrossRef] [Green Version]
Figure 1. Refer to the genome to compare the regional distribution.
Biology 11 00944 g001
Figure 2. (A) Sequence logo showing the top motifs enriched across differential m6A peaks identified from muscle and fat samples; (B) distribution of m6A peaks across the length of mRNA; (C) overlap of m6A peaks from fat and muscle tissues. p ≤ 0.05 is statistically significant.
Biology 11 00944 g002
Figure 3. Enrichment pathway of m6A peak related to fat deposition.
Biology 11 00944 g003
Figure 4. Overview of differentially expressed of methylase genes and key genes in muscle and adipose tissue samples. (A) FPKM of the methylase genes in muscle and adipose tissues; (B) FPKM of the key genes in muscle and adipose tissues (“*”, p ≤ 0.05; “**”, p ≤ 0.01).
Biology 11 00944 g004
Figure 5. qPCR results of the 6 differentially m6A-modified genes in muscle and adipose tissue samples. (A) Expression levels of the APMAP gene in the muscle and adipose tissue of 35-, 75-, and 165-day-old Rex rabbits; (B) expression levels of the SNAP23 gene in the muscle and adipose tissue of 35-, 75-, and 165-day-old Rex rabbits; (C) expression levels of the PCK2 gene in the muscle and adipose tissue of 35-, 75-, and 165-day-old Rex rabbits; (D) expression levels of the ADCY3 gene in the muscle and adipose tissue of 35-, 75-, and 165-day-old Rex rabbits; (E) expression levels of the LPL gene in the muscle and adipose tissue of 35-, 75-, and 165-day-old Rex rabbits; (F) expression levels of the MAP4K3 gene in the muscle and adipose tissue of 35-, 75-, and 165-day-old Rex rabbits (“**”, p ≤ 0.01).
Biology 11 00944 g005
Figure 6. Volcanic map of differentially expressed genes.
Biology 11 00944 g006
Figure 7. Pathway map of key genes regulated by methylase.
Biology 11 00944 g007
Table 1. Primer pairs used for RT-qPCR.
NamePrimer SequenceTemperature (°C)Product Size (bp)Gene ID
APMAP5’-GCTGCTGGATTCTCCCATAG-3′60163100339857
5’-AAACATCACGTCCCCGATAT-3′
β-actin5’-GGAGATCGTGCGGGACAT-3′61.4318100009272
5’-GTTGAAGGTGGTCTCGTGGAT-3′
SNAP235’-CCTGGCAATGTGGTGTCTAA-3′59.5250100008776
5’-TGGTGTCAGCCTTTTCTGTAAT-3′
PCK25’-AACAGGAGGTGCGTGACATT-3′60.2250100144327
5’-GGGACAGGGAGTGTGAGAAG-3′
ADCY35’-TGGGCGTCATGTCCTACTAC-3′60238100343958
5’-ACATTCTCGTGGCGGTACAT-3′
LPL5’-GACATTGGGGAGTTGCTGAT-3′60.5214100340171
5’ACTTGTCGTGGCATTTCACA-3′
MAP4K35’-ATGTGGGGCACTCCAAACTA-3′59.5182100356354
5’-TGAAGTCTCGCCCTCTACTG-3′
Table 2. Summary of reads quality control.
SampleRaw_ReadsValid_ReadsValid%Q20%Q30%GC%
Fat1_IP815623947959026289.9498.0794.1749.20
Fat2_IP742686567269790090.4898.0294.0849.93
Fat3_IP756350767419491090.7797.9293.9050.64
Mus1_IP10199810210030902091.0298.1794.4553.73
Mus2_IP1008584609891089690.6998.0994.2553.14
Mus3_IP775399347621319490.6298.0894.2453.00
Fat1_input676213386667132290.5998.0994.1648.59
Fat2_input723423847142413290.4898.1794.3649.85
Fat3_input722985447124122090.1798.1694.4051.05
Mus1_input788914967805353891.0598.1894.4552.35
Mus2_input10216720210087789690.4998.0494.1853.68
Mus3_input920622369078955090.6498.2594.6253.62
Parameter description: Q20%, proportion of bases with a mass value ≥ 20; Q30%, proportion of bases with a mass value ≥ 30; GC, proportion of GC content.
Table 3. Summary of reads mapping to the rabbit reference genome.
SampleValid ReadsMapped ReadsUnique Mapped ReadsMulti Mapped Reads
Fat1_IP7862649871401305 (90.81%)50564672 (64.31%)20836633 (26.50%)
Fat2_IP7198945465126746 (90.47%)49953050 (69.39%)15173696 (21.08%)
Fat3_IP7361664665572313 (89.07%)49524600 (67.27%)16047713 (21.80%)
Mus1_IP10001348283125913 (83.11%)58211564 (58.20%)24914349 (24.91%)
Mus2_IP9855947881835114 (83.03%)59331136 (60.20%)22503978 (22.83%)
Mus3_IP7586596062874564 (82.88%)46707280 (61.57%)16167284 (21.31%)
Fat1_input6503369860764764 (93.44%)43533958 (66.94%)17230806 (26.50%)
Fat2_input6932507464450485 (92.97%)48831496 (70.44%)15618989 (22.53%)
Fat3_input7028412064559775 (91.86%)48476357 (68.97%)16083418 (22.88%)
Mus1_input7729658669248163 (89.59%)48632494 (62.92%)20615669 (26.67%)
Mus2_input9995796688668893 (88.71%)62516927 (62.54%)26151966 (26.16%)
Mus3_input6503369860764764 (93.44%)43533958 (66.94%)17230806 (26.50%)
Table 4. M6A peaks of 12 genes related to fat deposition.
Gene Namelog2(fc)Methylation RegulationChromosomePeak RegionPeak StarPeak Endp-Value
APMAP1.52Hypo-methylation653’ UTR1,160,6781,161,1231 × 1042
SNAP231.49Hypo-methylation17Exon29,652,64929,656,5425.01 × 10−37
PCK24.67Hypo-methylation173’ UTR44,153,72144,154,2261.58 × 10−33
ADCY32.38Hypo-methylation2Exon173,934,224173,934,8195.01 × 10−26
LPL3.16Hypo-methylation155’ UTR4,554,0624,554,3010.0041
MAP4K32.43Hypo-methylation25’ UTR146,895,441146,925,8620.008
JMJD1C1.93Hypo-methylation18Exon23,014,02923,014,9600.00017
RPGRIP1L2.18Hypo-methylation55’ UTR10,022,61410,027,5080.0093
PDCD42.1Hyper-methylation185’ UTR58,499,21358,499,9030.012
TNMD−6.59Hyper-methylation22Exon88,793,70788,793,9900.05
RCAN2−2.85Hypo-methylation12Exon35,531,62135,531,6800.027
AQP75.58Hypo-methylation13’ UTR20,078,65320,078,8020.022
Table 5. Candidate m6A-modified genes related to fat deposition and difference peaks.
Gene NameGene IDM6A RegulationGene RegulationBlock CountBlock SizesBlock StartsDistance To TSS
APMAP100339857Downup1446041,647
SNAP23100008776Downup327, 145, 370, 2495, 385730,071
PCK2100144341Downup150609040
ADCY3100343958Downup257, 94,0, 50272,693
LPL100340171Downup1240030
MAP4K3100356354Downup2195, 15,0, 304070
JMJD1C100350438Downup292, 2980, 634262,502
RPGRIP1L100354520Downup458, 92, 44, 470, 2264, 2782, 4848239
PDCD4100354557upup254, 1840, 5070
TNMD100125994upDown272, 480, 2360
RCAN2100343905DownDown1600303,927
AQP7100350611Downup1150011,448
Publisher’s Note: MDPI stays neutral with regard to jurisdictional claims in published maps and institutional affiliations.

