Article

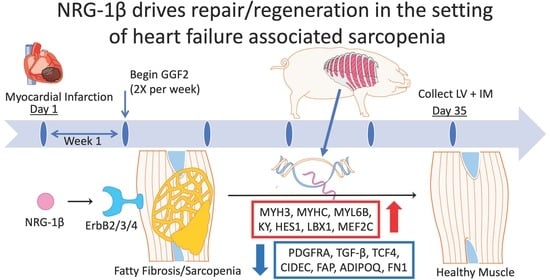
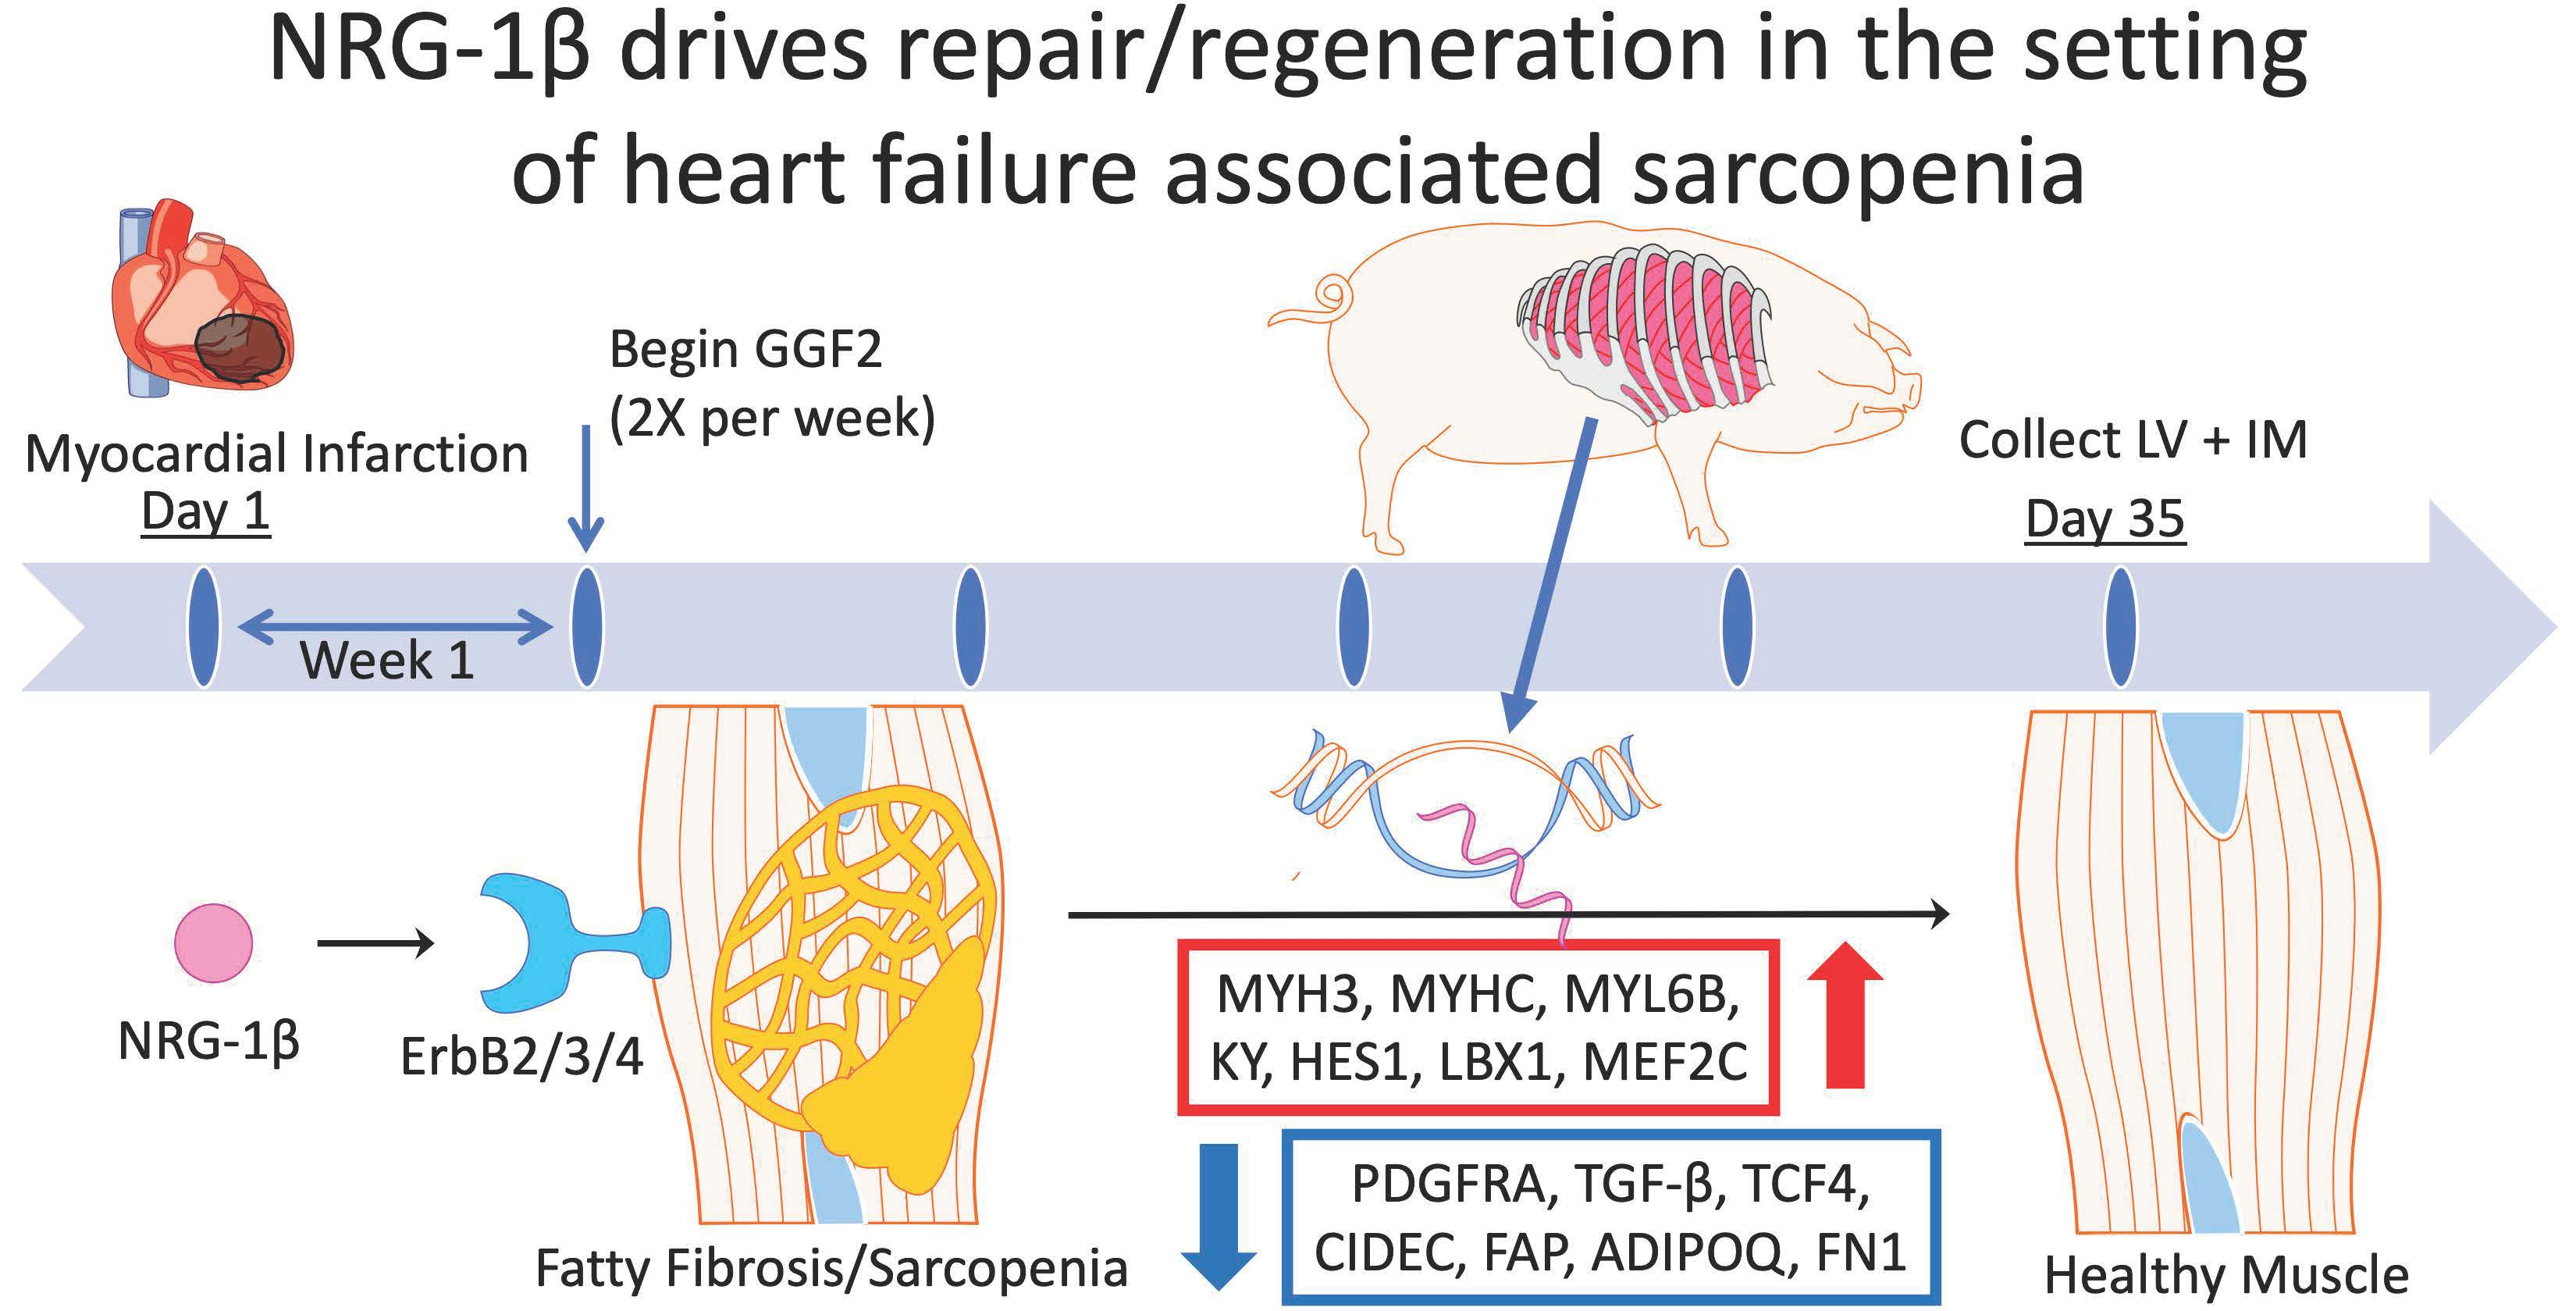
Neuregulin (NRG-1β) Is Pro-Myogenic and Anti-Cachectic in Respiratory Muscles of Post-Myocardial Infarcted Swine

1
Department of Biology, Ogden College of Science & Engineering, Western Kentucky University, Bowling Green, KY 42101, USA
2
Centennial Heart at Skyline, 3443 Dickerson Pike, Suite 430, Nashville, TN 37207, USA
3
Department of Cardiac Services, Maine Medical Center, Scarborough, ME 04074, USA
*
Authors to whom correspondence should be addressed.
Biology 2022, 11(5), 682; https://doi.org/10.3390/biology11050682
Submission received: 26 February 2022 / Revised: 31 March 2022 / Accepted: 1 April 2022 / Published: 29 April 2022

Abstract

:

Simple Summary

Neuregulin is a growth factor that has been shown to prevent adverse remodeling in the heart and may represent a therapeutic for patients with systolic heart failure. A common symptom in heart failure is shortness of breath, which has been related in part to impaired skeletal muscle function. Since neuregulin directly activates skeletal muscle, in addition to heart tissue, we hypothesized that neuregulin might directly affect intercostal muscle gene expression changes in heart disease. We tested this hypothesis by performing global gene expression analysis of intercostal muscle tissue collected from pigs treated with recombinant neuregulin after the induction of myocardial infarction, an experimental model clinically similar to a human heart attack. We found that neuregulin-treated pigs had massive changes in global gene expression consistent with new muscle cell formation, as compared to untreated pigs. These data suggest that neuregulin is an important mediator of muscle function that can potentially be used to study heart disease-associated muscle dysfunction and the development of new therapeutics aimed at muscle repair in heart failure, as well as other diseases associated with muscle dysfunction and weakness.

Abstract

Neuregulin-1β (NRG-1β) is a growth and differentiation factor with pleiotropic systemic effects. Because NRG-1β has therapeutic potential for heart failure and has known growth effects in skeletal muscle, we hypothesized that it might affect heart failure-associated cachexia, a severe co-morbidity characterized by a loss of muscle mass. We therefore assessed NRG-1β’s effect on intercostal skeletal muscle gene expression in a swine model of heart failure using recombinant glial growth factor 2 (USAN-cimaglermin alfa), a version of NRG-1β that has been tested in humans with systolic heart failure. Animals received one of two intravenous doses (0.67 or 2 mg/kg) of NRG-1β bi-weekly for 4 weeks, beginning one week after infarct. Based on paired-end RNA sequencing, NRG-1β treatment altered the intercostal muscle gene expression of 581 transcripts, including genes required for myofiber growth, maintenance and survival, such as MYH3, MYHC, MYL6B, KY and HES1. Importantly, NRG-1β altered the directionality of at least 85 genes associated with cachexia, including myostatin, which negatively regulates myoblast differentiation by down-regulating MyoD expression. Consistent with this, MyoD was increased in NRG-1β-treated animals. In vitro experiments with myoblast cell lines confirmed that NRG-1β induces ERBB-dependent differentiation. These findings suggest a NRG-1β-mediated anti-atrophic, anti-cachexia effect that may provide additional benefits to this potential therapy in heart failure.

Graphical Abstract

1. Introduction

Chronic heart failure (CHF) is a complex clinical syndrome resulting from any disorder that impairs cardiac function such as ventricular filling or the ejection of blood into the systemic circulation. Impaired muscle formation can be a cause of several muscle-related [1] diseases as well as age-related muscle deterioration, also known as sarcopenia [2,3]. Although the precise mechanisms are not fully understood, some studies recently showed that systemic oxidative stress [4], exercise intolerance [5], a low grade of inflammation, abnormal energy metabolism, transition of myofibers, mitochondrial dysfunction, a reduction in muscular strength, and muscle atrophy play an important role in skeletal muscle dysfunction/abnormalities in the setting of CHF [6,7]. However, abnormalities in skeletal muscle metabolism, total muscle mass, and peak functional capacity in patients with CHF cannot be fully explained by lowered cardiac output [8] or inadequate skeletal muscle oxygenation [9].
The neuregulin (NRG) family is a large class of neuronal growth factors that induce signaling via type I epidermal growth factor receptor (EGFR) tyrosine kinases (ErbB2, ErbB3, and ErbB4). NRG-1 is essential for the development of the sympathetic nervous system [10] and is required for the formation and maintenance of neuromuscular synapses. In postembryonic skeletal muscles, local production of NRG-1 by motor neurons increases acetylcholine receptor expression and accumulation at motor nerve terminals [11]. Several NRG-1 isoforms, including NRG-1α, NRG-1β Type I, and NRG-1β type II (also called glial growth factor 2, GGF2), were shown to stimulate myoblast differentiation in immortalized and primary myoblasts [12,13,14]. Additionally, ErbB3 is induced during muscle cell differentiation [15] and regulates muscle progenitor cell fate and thus the balance between stem cell renewal and differentiation [16].
We previously reported results from a pre-clinical trial of the effects of a pharmaceutical grade of NRG-1/GGF2 (cimaglermin alfa) using a swine model of heart failure. In this previously published study [17], a balloon was inserted into the descending coronary artery of pigs to induce myocardial infarction. GGF2 was administrated intravenously twice weekly, starting at 1 week after infarction. Tissues were collected 35 days thereafter, and left ventricular tissue remote from the infarct was interrogated for global gene expression using microarrays. GGF2-treated animals exhibited better cardiac function, including less maladaptive myocardial remodeling, reduced fibrosis, and gene expression changes consistent with better cardiomyocyte survival but less myofibroblast-driven extracellular matrix remodeling. In the study presented here, we performed deep sequencing on intercostal muscles of these same pigs to determine the effects of GGF2 treatment on post-MI skeletal muscle function. We also compared these results with GGF2-mediated expression changes in cardiac muscle and myopathic genes obtained by analyzing repository expression data. As detailed herein, our results support a role for exogenously delivered GGF2 in skeletal muscle remodeling and repair after cardiac injury.

2. Materials and Methods

Animals: Intercostal muscle samples were acquired from swine that were used to test the efficacy of NRG treatment on swine after myocardial infarction, the details of which were previously published [17]. Briefly, eight pigs underwent balloon occlusion surgery to introduce a left ventricular infarct. At one week post-MI, five of the animals received biweekly intravenous injections of GGF2 (three at a dose of 0.67 mg/kg and two at 2 mg/kg). The remaining swine served as untreated controls. As reported previously [17,18,19], high-dose treatment was associated with symptomatic hypoglycemia. In consultation with veterinary staff and IACUC, dose adjustment was made for the remaining swine in the treatment group.
Sequencing: Total RNA was isolated using RNeasy Mini kit (Qiagen), following the manufacturer’s instructions, RNA integrity was confirmed using Agilent Bioanalyzer, and RNA sequencing was performed by the Vanderbilt Technologies for Advanced Genomics core on a total of eight animals, all of which received myocardial infarction as previously described [17]. RNA libraries were constructed using the Illumina TruSeq Stranded Total RNA kit with Ribo-Zero Gold. Samples were sequenced on the Illumina HiSeq 2500 using v3 SBS chemistry. Libraries were sequenced on paired-end-50 flow cell runs at ~35 M PF reads per sample.
Data analysis: Sequences were aligned to the susScr3 assembly of the pig genome and analyzed using the Tophat2 + CuffDiff platform provided by DNAnexus, Inc. (Mountain View, CA, USA). Genes were annotated using the Ensemble, UCSC, and NCBI iGenomes datasets. Partek Genomics Suite 6.6 was also used to perform statistical analyses of aligned sequences, as well as hierarchical clustering and principal components analysis (PCA). Differential sequences that were determined to be statistically significant (multiple hypothesis-corrected p-value < 0.05 and fold-difference > 2.0) among the three different groups of animals were compiled into a single list and the annotations were manually verified using information from UCSC, Ensemble, and NCBI databases. For uncharacterized transcripts, the differential Sus scrofa sequences were queried against the human reference genome using the BLAT tool provided on the UCSC Genome Browser website to identify orthologous human genes. Uncharacterized transcripts were included in the final list if they were at least 75% similar to an annotated human gene.
Functional enrichment analysis with Bonferroni multiple hypothesis adjustment was performed using GSEA, available online from the BROAD Institute. Individual gene functions were identified using public databases and literature reports. Functional subgroups of genes that were detected by exhaustive, manual annotation could generally be recapitulated using statistical functional analysis tools but were missed due to lower significance relative to hundreds of other, largely redundant ontological categories (e.g., “tissue development”). To better identify these potentially relevant functional groups while minimizing user bias, we also organized genes hierarchically according to their biological processes within the Gene Ontology Consortium classification system. The top three non-redundant biological processes were chosen based on the numbers of differential genes included and functional specificity, whereby non-informative categories, such as “Regulation of Cell Process”, were ignored. A divisive hierarchical clustering approach was applied for consecutive subgrouping. All ontologies generated from the gene lists, irrespective of statistical significance, were examined to gain a complete functional overview; however, a statistically significant overlap (Bonferroni-adjusted p-value < 0.05) was required for inclusion in the subsequently generated functional hierarchy reported herein.
Cell Culture: C2C12 cells and L6 myoblasts were cultured in growth media (GM) consisting of Dulbecco’s modified Eagle’s medium (DMEM) (25 mM glucose) supplemented with 10% fetal bovine serum (FBS) and 1% antibiotics (penicillin + streptomycin). GM was changed every alternate day until cells were 90% confluent. GM was then changed to differentiation media (DM) consisting of DMEM (25 mM glucose) supplemented with 2% horse serum and 1% antibiotics. Compounds or vehicle controls were added at Day 0 (i.e., the time at which the cells were switched from GM to DM). The additional methodology is provided in Supplementary Figures S1–S7.
Quantification of myoblast fusion and myotube numbers. C2C12 or L6 cells were differentiated according to the conditions of described experiments and fixed in 4% paraformaldehyde for 25 min. Next, the cells were stained with Jenner–Giemsa dyes as described in (Velica). The multiple microphotographs of stained cells were taken using an inverted microscope, and at least 4 different fields were used to estimate the total number of cells and the number of myotubes. The cells with more than 3 nuclei were counted as the number of myotubes. The fusion index was determined as the number of cells with more than 3 nuclei per cell divided by the total number of cells. In some experiments, the myotube numbers were estimated without the cell staining based on microphotographs of growing cells.
Western blot and immunoprecipitation analysis. The cells were solubilized by scraping into the cold NP-40 lysis buffer (10 mM Tris-HCl, pH 7.5, 150 mM NaCl, 1% Nonidet P-40 containing protease inhibitors, and 1 mM Na3VO4). The lysates were then clarified by centrifugation (14,000× g, 10 min). Aliquots containing equal amounts of protein were subjected to 4–20% gradient SDS-PAGE. Subsequently, proteins were transferred to nitrocellulose membranes, and the membrane was blocked by incubation with Odyssey blocking buffer (LI-COR) for 1 h at room temperature. The membrane was then incubated overnight at 4 °C with the indicated antibody in the same blocking solution washed 3 times in the TBS buffer containing 0.05% Tween 20 (TBSTw) and incubated for 1 h with HRP-conjugated secondary antibody in SEA BLOCK blocking buffer (Thermo Fisher, Waltham, MA, USA). The membranes were then washed three times with the TBSTw buffer and visualized using the Fujifilm LAS-4000 imaging system. For immunoprecipitation, the cells were grown and differentiated in 10 cm tissue culture dishes and lysed in 0.5 mL of cold NP-40 lysis buffer. The lysates were precleared by incubation with 100 μL of protein A agarose beads (Santa-Cruz, Dallas, TX, USA) for 2 h at 4 °C and then incubated with 5 µg of C-18 antibodies against ErbB-2 and 50 μL of protein A agarose overnight at 4 °C. The beads were washed 3 times in TBSTw, then boiled in 1× Laemmli sample buffer for 2 min, and subjected to Western blot.

3. Results

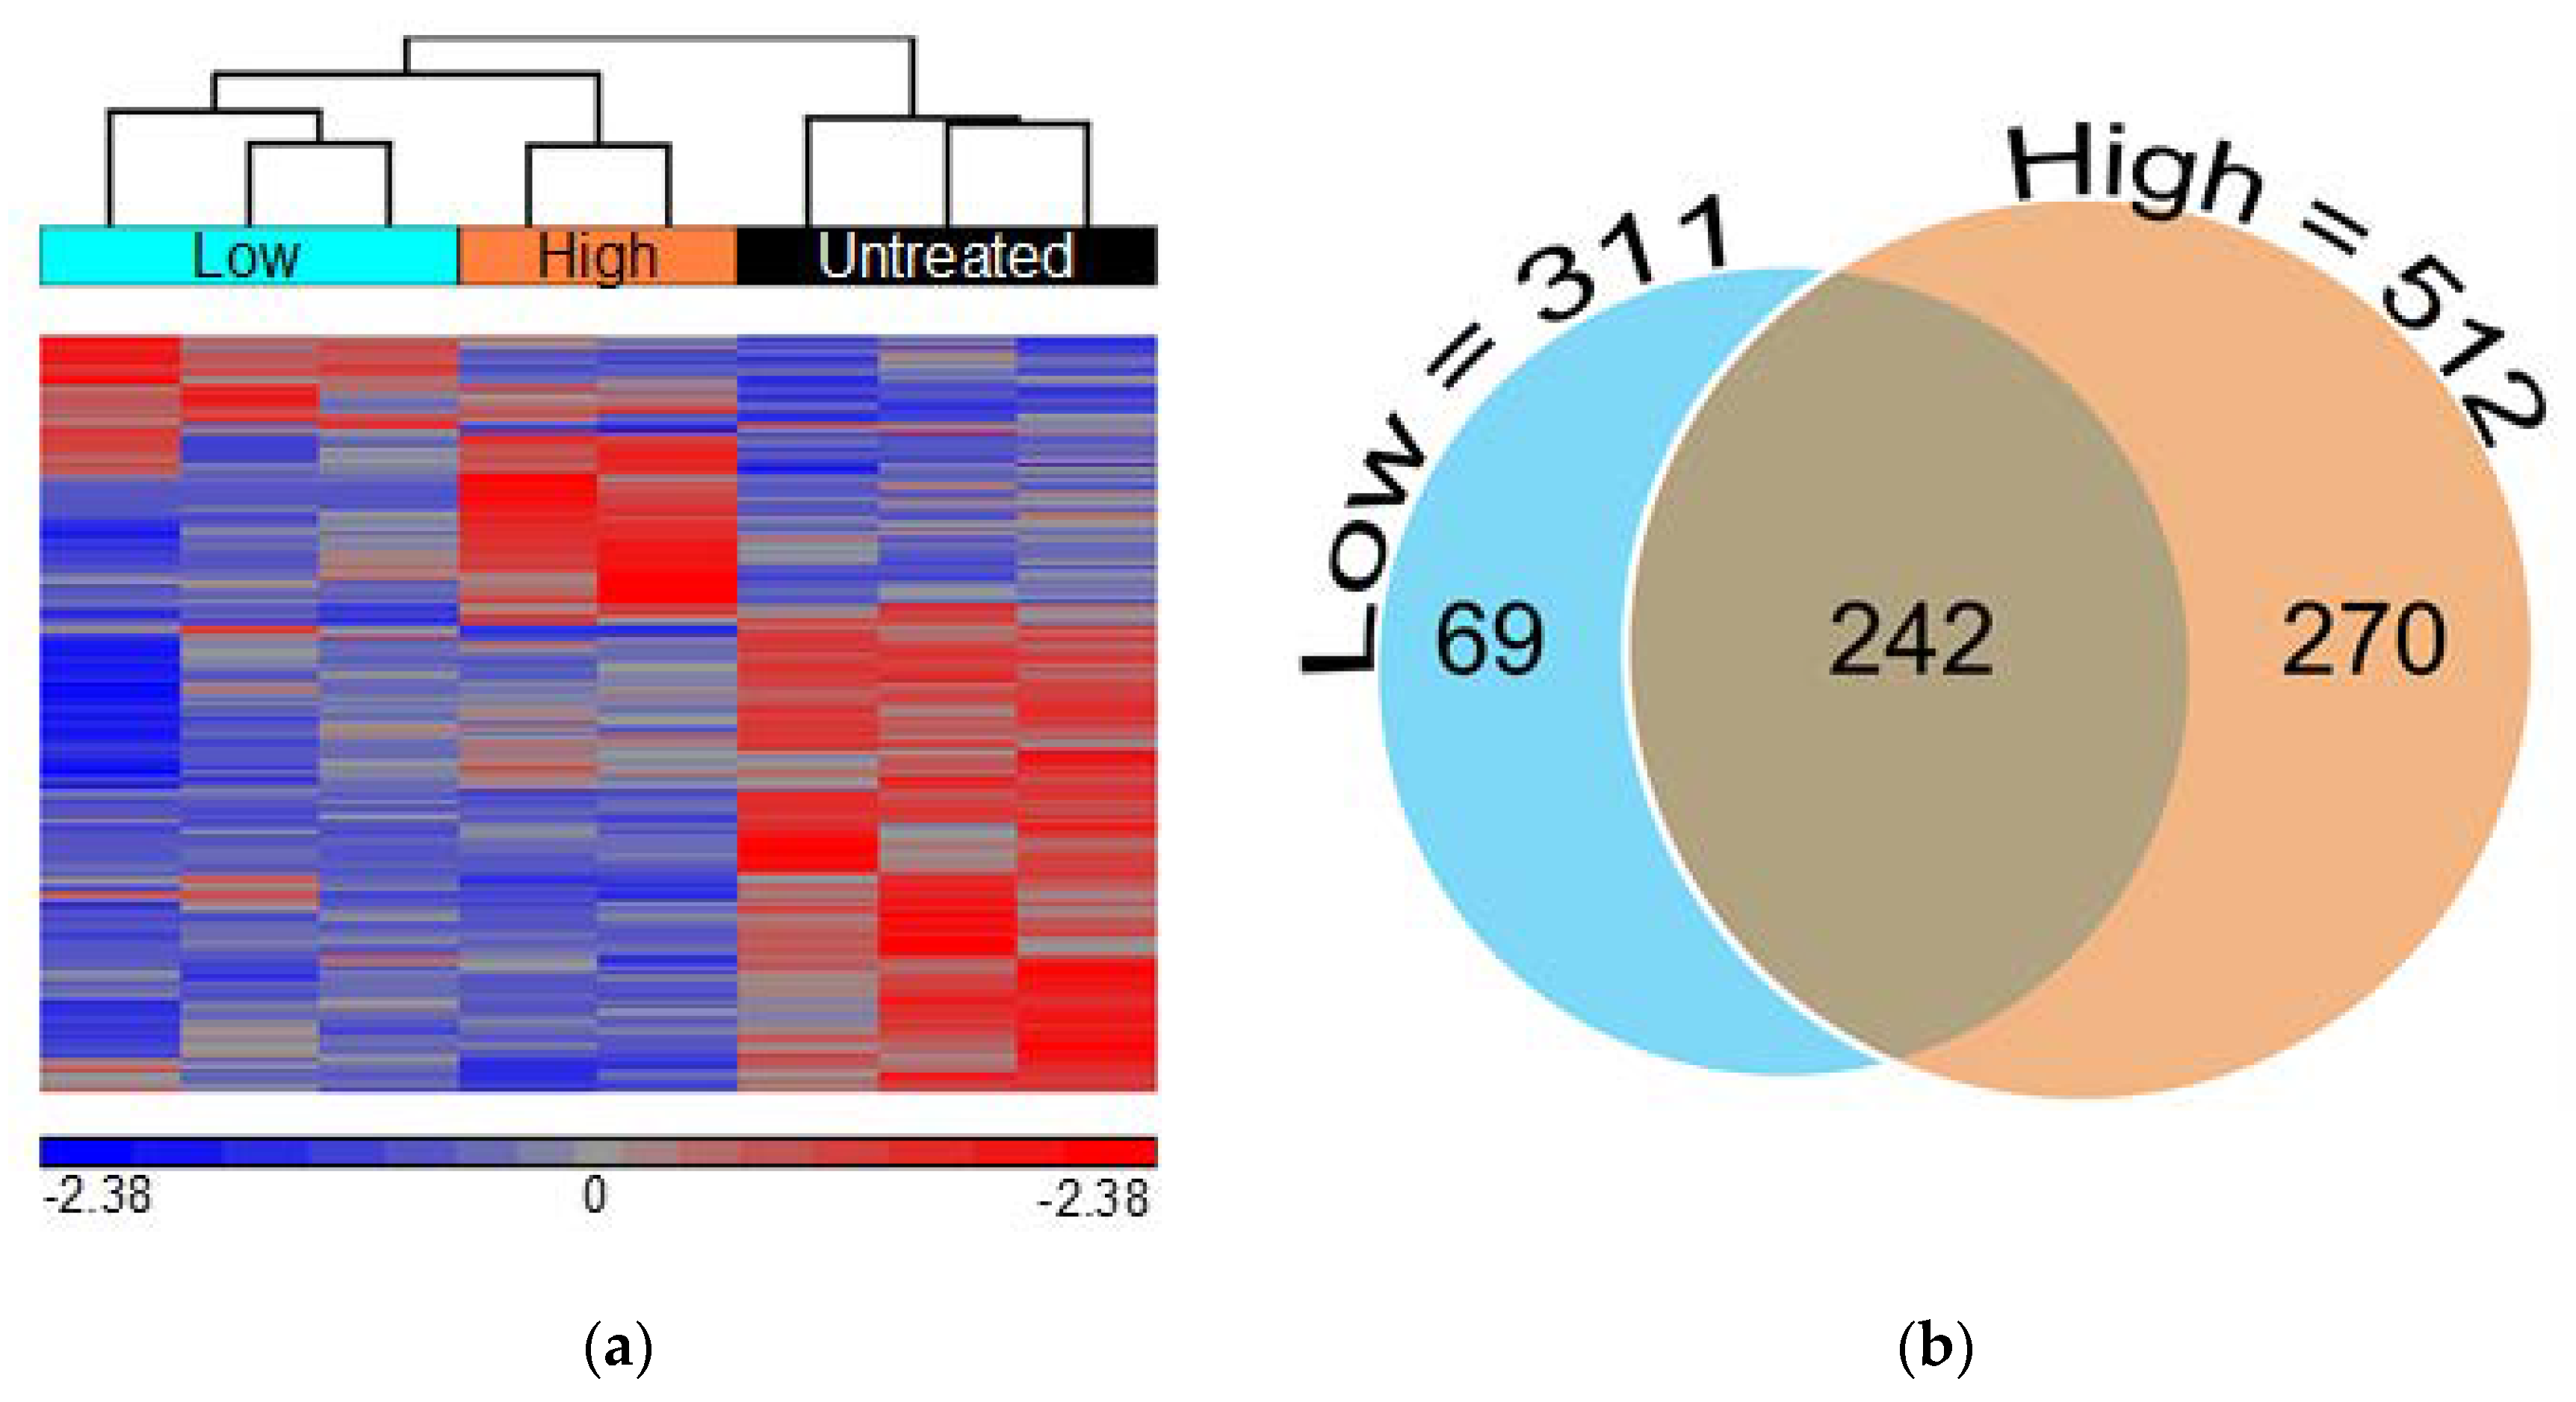
3.1. GGF2 Alters Intercostal Muscle Gene Expression

Comparison of GGF2-treated and untreated pigs yielded a total of 581 differentially expressed transcripts including 500 annotated swine genes and 81 uncharacterized transcripts with at least 75% similarity to an annotated human gene (Supplementary Table S1). Not surprisingly, there were nearly twice as many transcriptional changes in animals treated with the high dose of GGF2 (512 genes) compared to the post-MI swine that received the lower dose (311 genes) versus untreated controls. These dose-dependent differences resulted in a clear separation of the two groups from one another, secondarily to untreated samples, upon hierarchical clustering of standardized hybridization values (Figure 1a). Of the 242 genes differentially expressed between treated and untreated swine at both doses (Figure 1b), only one transcript was altered in disparate directions compared to controls (MYLIP, down-regulated 1.7-fold in low dose-treated and up-regulated two-fold in high dose-treated animals, Supplementary Table S1). Of the remaining 241 similarly altered genes, 91 and 150 were up and down-regulated in treated animals, respectively (Supplementary Table S1).

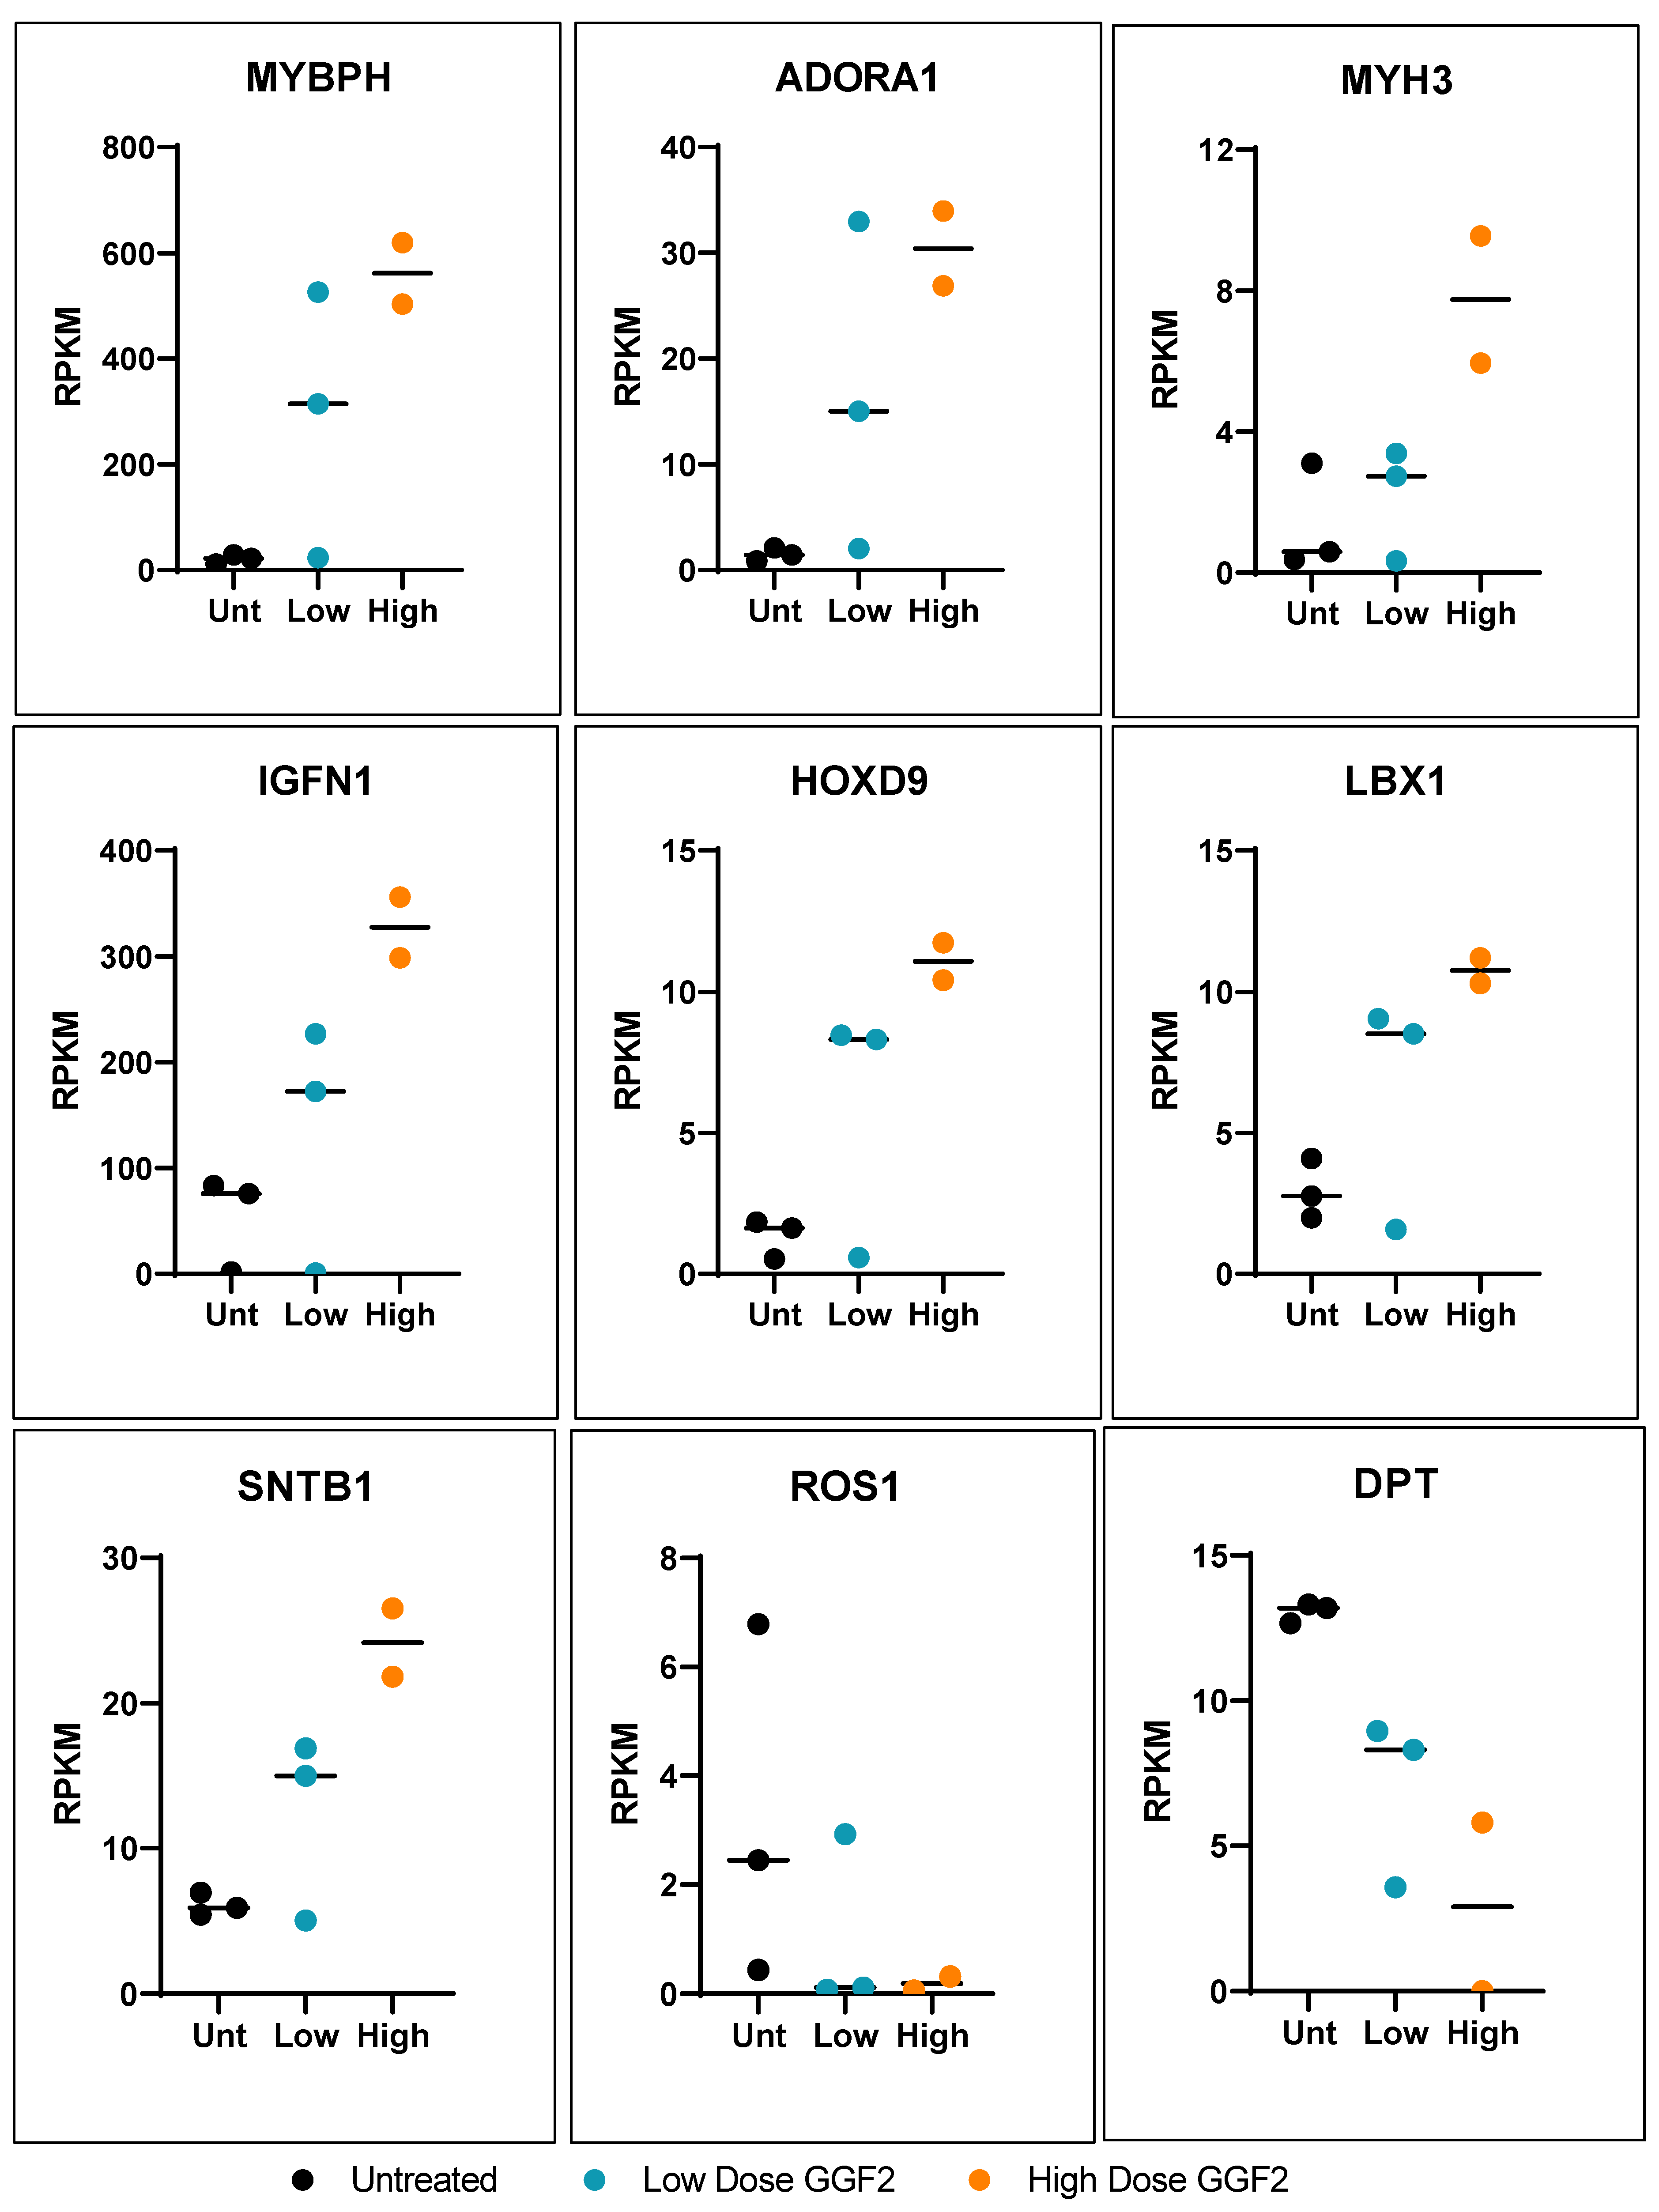
3.2. Dose-Dependent Effects of GGF2

More than half of the genes that were altered in both low dose and high dose GGF2-treated swine (133 out of 242) exhibited a “dose-like” expression pattern (61 up-regulated and 72 down-regulated transcripts). Notable examples of up-regulated genes were those important for muscle cell development and contraction, as well as genes involved in amino acid and carbohydrate metabolism. Down-regulated genes displaying a “dose-like” response included those involved in lipid metabolism and insulin signaling, ECM structure and maintenance, and regulation of vascular functions. Notable dose-specific genes included those important for myofiber growth and muscle growth maintenance, such as slow-twitch MYL6B (down-regulated) and myosin heavy chain genes MYH3 and MYHC (up-regulated). The gene encoding ladybird homeobox 1 (LBX1), which is a key regulator of migratory muscle-specific stem cell precursors required for the development of forelimb muscles, including the diaphragm, was also up-regulated (Figure 2).

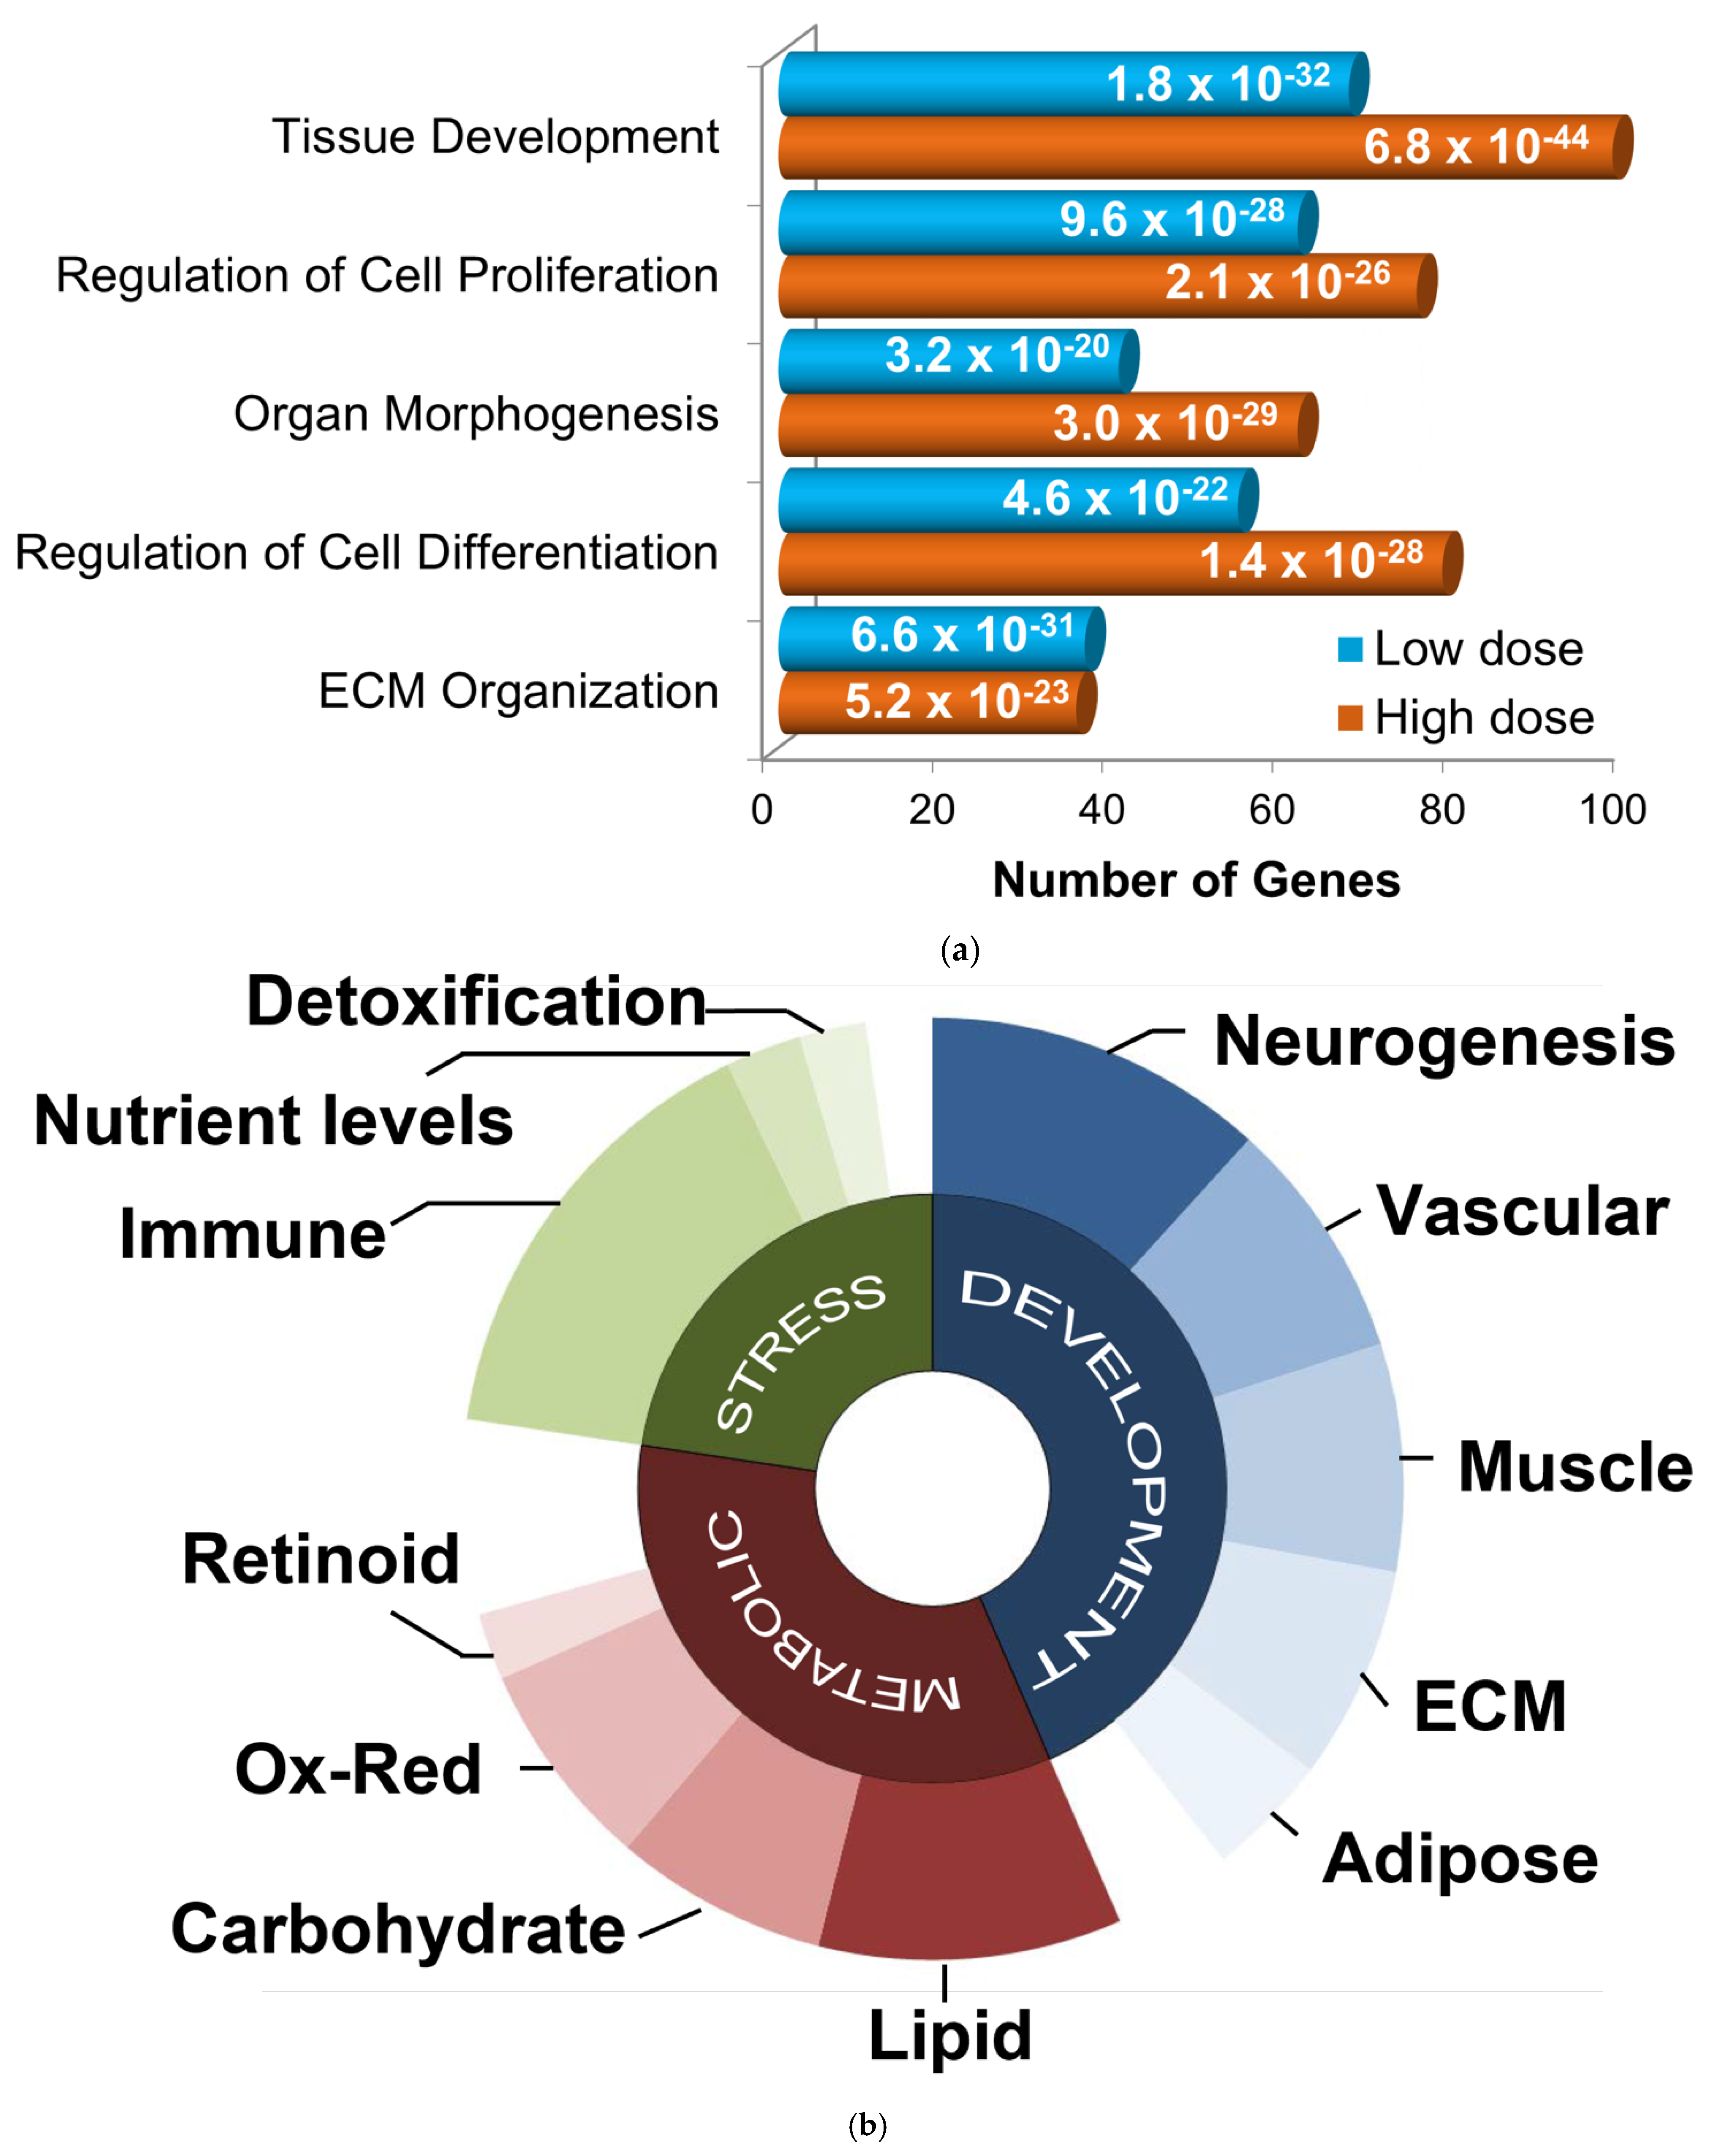
3.3. Functional Enrichment of GGF2 Altered Genes

Although many more genes were altered in post-MI pigs that received the higher dose than those treated with low dose GGF2, enriched functions were similar. The most significantly over-represented biological processes for both gene lists were tissue development, cellular proliferation and differentiation, organ morphogenesis, and ECM organization (Figure 3a). Functional analysis of the larger gene set (500+ genes altered in either of the two doses) resulted in nearly identical results. The gene lists were therefore combined for further analyses and the average fold-change and p-values were used where applicable.
To identify relevant functional subgroups of GGF2-altered genes and thereby obtain more specific mechanistic information, genes were hierarchically ordered based on their official Gene Ontology Consortium classifications. Based on this heuristic approach, the top non-redundant biological processes encompassing 445 out of all 581 differentially expressed genes were (1) developmental process (267 genes, p = 1 × 10⁻²¹, enrichment score (ES) = 1.8), (2) regulation of primary metabolic process (208 genes, p = 1.8 × 10⁻³, ES = 1.4), and (3) response to stress (139 genes, p = 1 × 10⁻², ES = 1.5). Some genes were classified in more than one of these categories and thus were “counted” more than once for subsequent functional subdivisions (i.e., 267 + 208 + 139 = 614 ≠ 445 genes). Developmental genes were further parsed by tissue type (neurogenesis, vascular, muscular, ECM, and adipose), as were metabolic and stress response genes (Figure 3b).
Notably, more than two dozen GGF2-altered genes have known roles in fat cell metabolism or signaling. For example, adiponectin (ADIPOQ), predicted gene with 89.7% similarity to human adiponectin receptor 1 (ADIPOR1), predicted gene with 83.7% similarity to human adipogenesis regulatory factor (ADIRF), CCAAT/enhancer binding protein (C/EBP), alpha (CEBPA), perilipin (PLIN1) and peroxisome proliferator-activated receptor gamma (PPARG), which were all down-regulated (2.9–28.2-fold, Supplementary Table S1) encode markers of adipogenesis. Consistent with lowered adipogenesis, genes encoding lipid sensors and fatty acid metabolism were altered, as were genes associated with carbohydrate metabolism and insulin signaling. ECM genes were also mainly down-regulated, whereas muscle-associated transcripts were generally up-regulated (Supplementary Table S1).

3.4. Genes Altered in Skeletal and Cardiac Muscles of GGF2-Treated Post-MI Pigs

We previously analyzed gene expression in left ventricular tissues remote from infarct in these same animals using Sus scrofa microarrays [17]. This prior study indicated that GGF2 treatments reduced profibrotic transcripts, lowered percentages of activated fibroblasts, and inhibited cardiac fibrosis [17]. We thus compared our prior ventricular data to transcriptional changes in intercostal skeletal muscle tissues to identify potentially “global” GGF2-mediated alterations. As shown in Table 1, there were 32 genes that were similarly altered in skeletal and cardiac muscle of GGF2-treated post-MI pigs, 18 of which were previously shown to be functionally relevant specifically in skeletal muscle and/or the cardiovascular system [20,21,22,23,24,25,26,27,28,29,30,31,32,33,34,35,36,37,38,39,40,41,42,43,44,45,46,47,48,49,50,51,52,53]. To determine whether these commonly altered genes are functionally associated, we performed protein–protein interaction network functional enrichment analysis, using the publicly available online tool, STRING. For context, we also included NRG1 and relevant ErbB receptors (ErbB2-4). The resulting network included 24 of the input proteins, with three subgroups based on K means clustering (Figure 4).

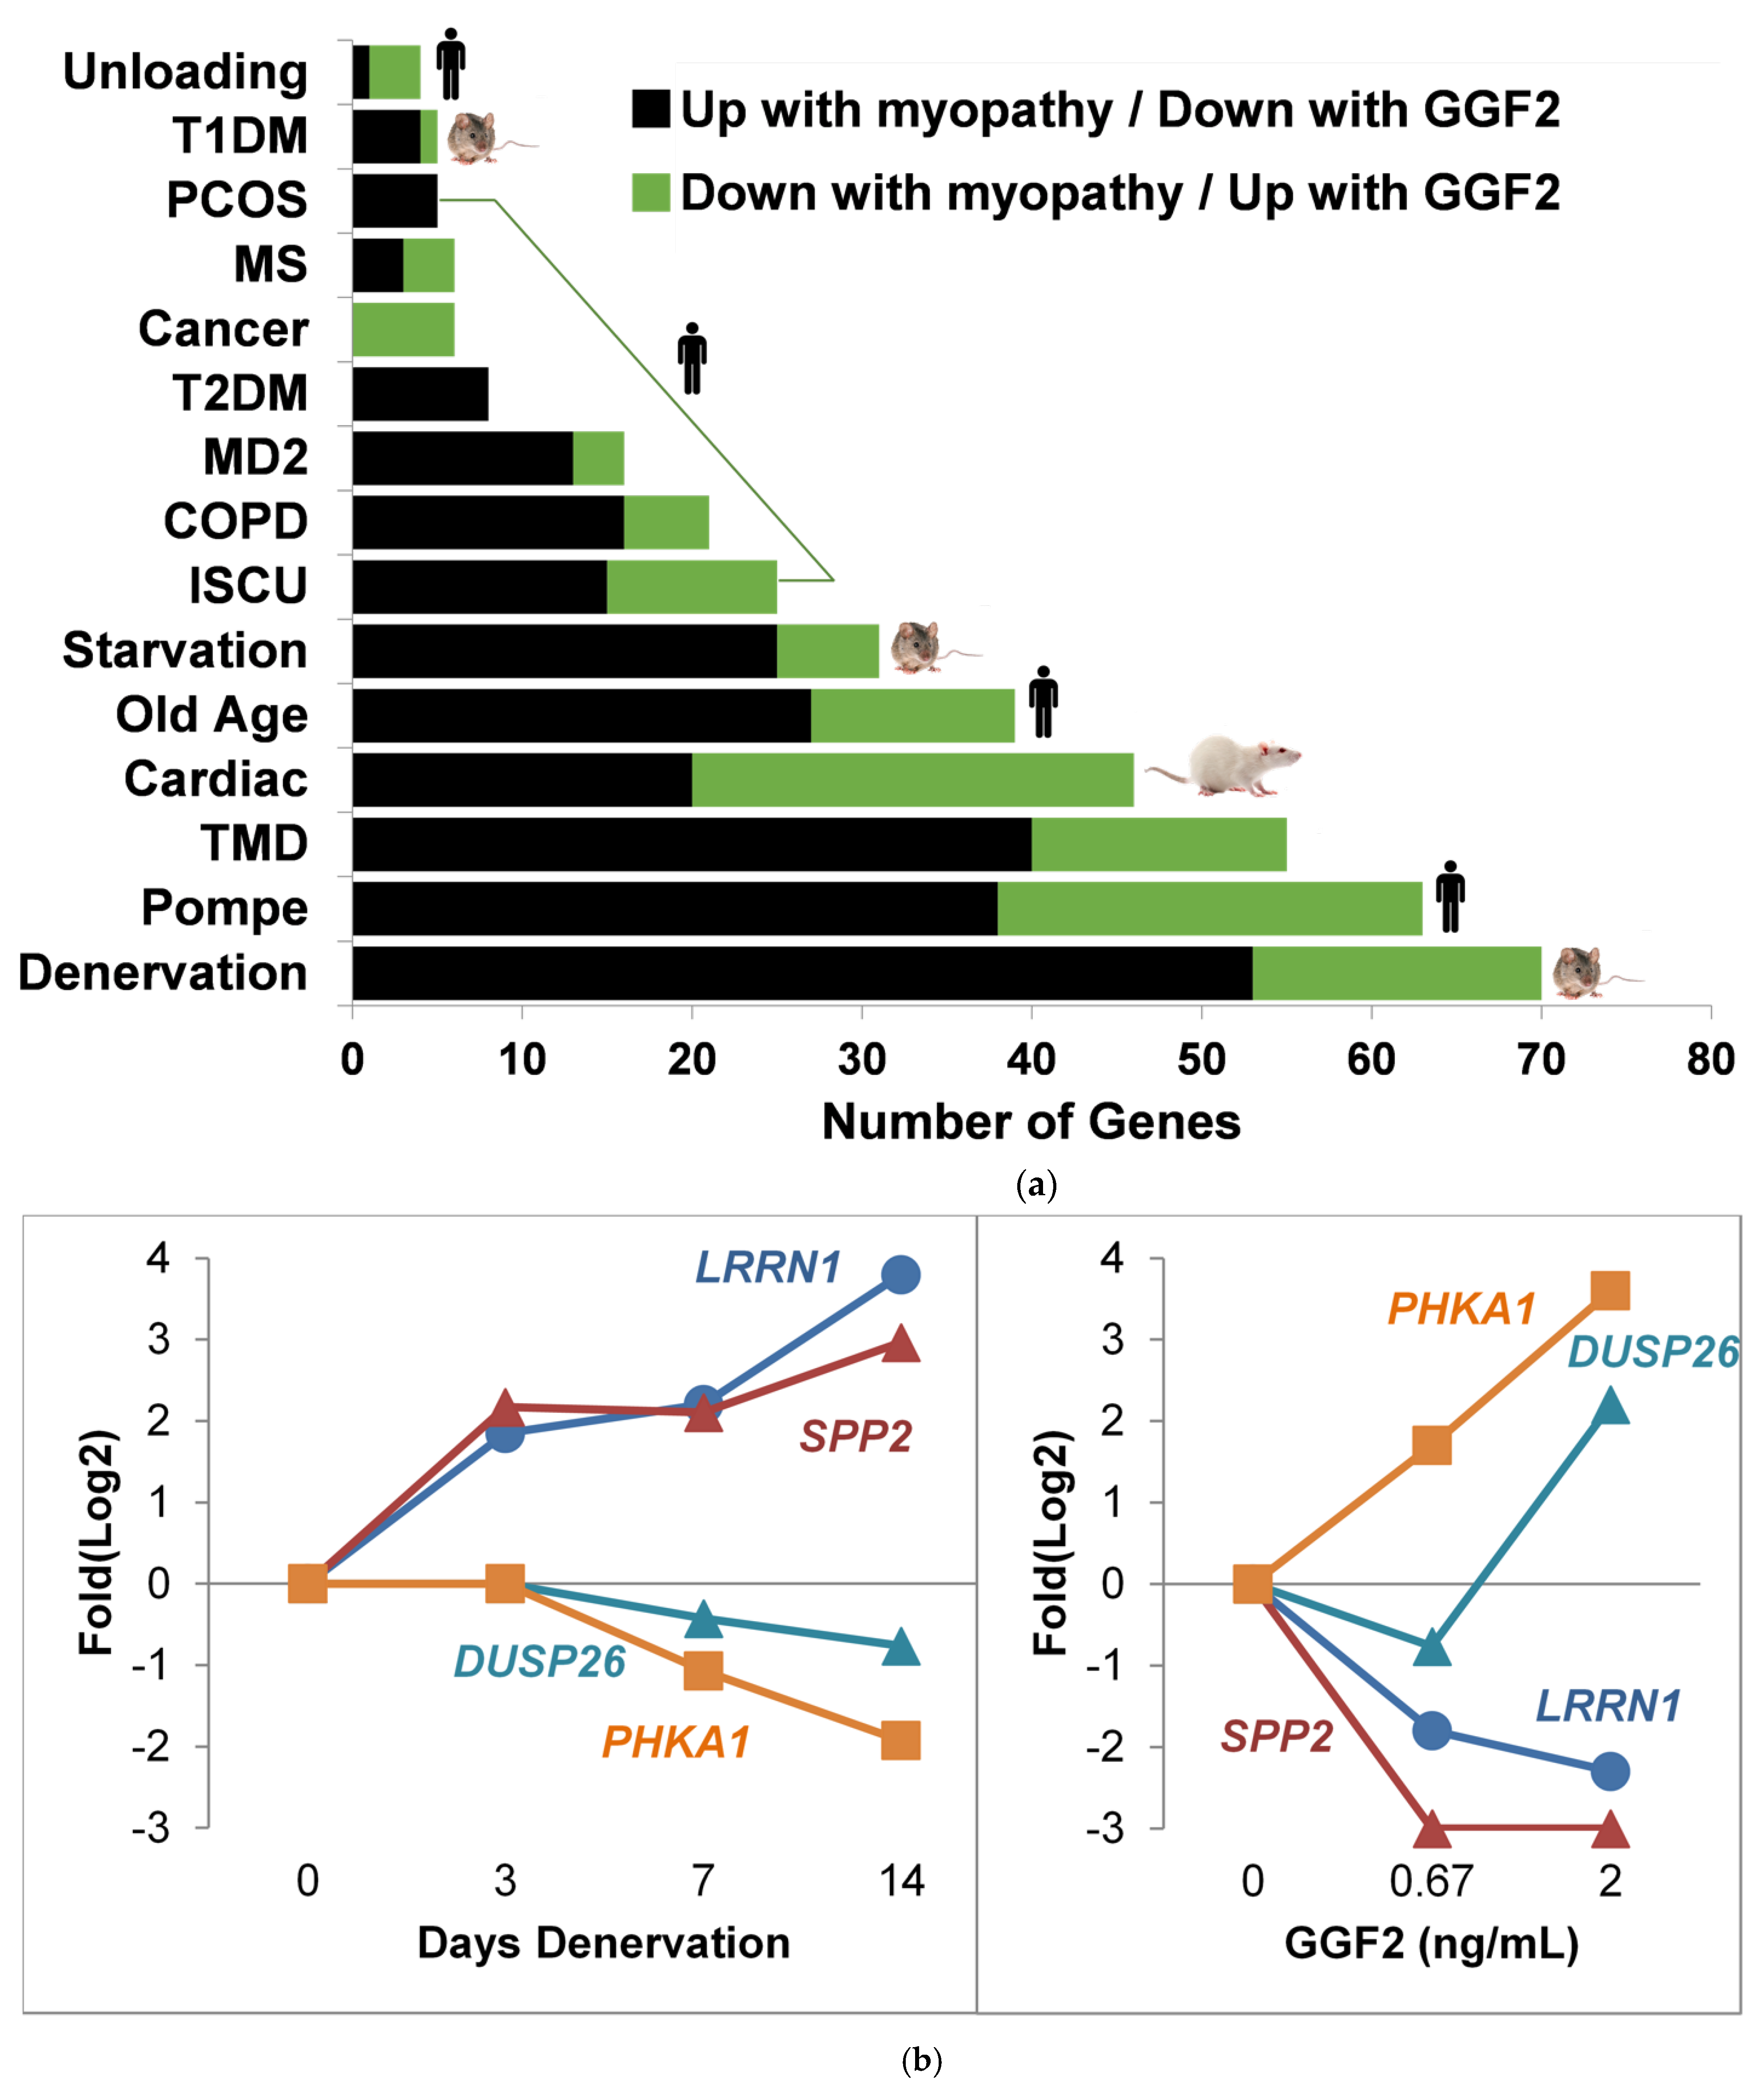
3.5. Comparison to Skeletal Muscle Myopathies

GGF2-altered genes important for muscle development included those that have been previously implicated in myocyte cell dysfunction, gross alterations in muscle mass, and heart disease (Table 1). We therefore compared GGF2-altered genes to four animal models of skeletal myopathy and 11 human myopathies (Table 2) and found 230 cachexia transcripts reversibly altered in GGF2-treated pigs (e.g., up-regulated in myopathic skeletal muscle and down-regulated in GGF2-treated pigs). The greatest overlap among experimental animal studies was the mouse denervation model of myopathy (70 genes), followed by cardiac cachexia (46 genes) and 24 h starvation (31 genes) (Figure 5a). Conversely, only five of the genes differentially expressed in rats with experimental Type I diabetes, compared to non-diabetic controls, were altered in the reverse direction in GGF2-treated versus untreated pigs. A similar situation was observed for Type II diabetes in humans (only 8 overlapping genes). Interestingly, the greatest overlap observed for human diseases was for Pompe disease (63 genes), followed closely by tibial muscular dystrophy (55 genes).
Notable examples of overlapping transcripts included the gene encoding thrombospondin 4 (THBS4), which was down-regulated 2.6-fold in GGF2-treated swine (p = 0.001) and up-regulated in denervated animal muscles (1.6-fold, p = 0.048) and in humans with Pompe (2-fold, p = 0.046), tibial muscular dystrophy (3.1-fold, p = 0.011), iron-sulfur cluster myopathy (2-fold, p = 0.046) and old age (1.6-fold, p = 0.039). Other myotrophic genes that were reversibly down-regulated in response to GGF2 treatment were CHRNA1, which encodes the alpha subunit of the nicotinic cholinergic receptor, syndecan 4 (SDC4), dermatopontin (DPT), the stem cell marker KIT, the cardiac muscle myofibrillar stretch-sensor ankyrin repeat domain 1 (ANKRD1), matrix metalloproteinase 2 (MMP2) and a negative regulator of insulin secretion (GPR137B). GGF2 also induced the expression of genes that are down-regulated in humans and/or animal experimental models of myopathy, including KLF10 (encodes Kruppel-like factor 10), purinergic receptor P2Y (P2RY1), the gene encoding the lactate transporter MCT4 (SLC16A3), retinoid receptor γ (RXRG), triadin (TRDN), myosin heavy chain (MYH1), epidermal growth factor (EGF), and the skeletal muscle isoform of phosphorylase kinase (PHKA1) that when mutated causes muscle glycogenosis (Figure 5b).

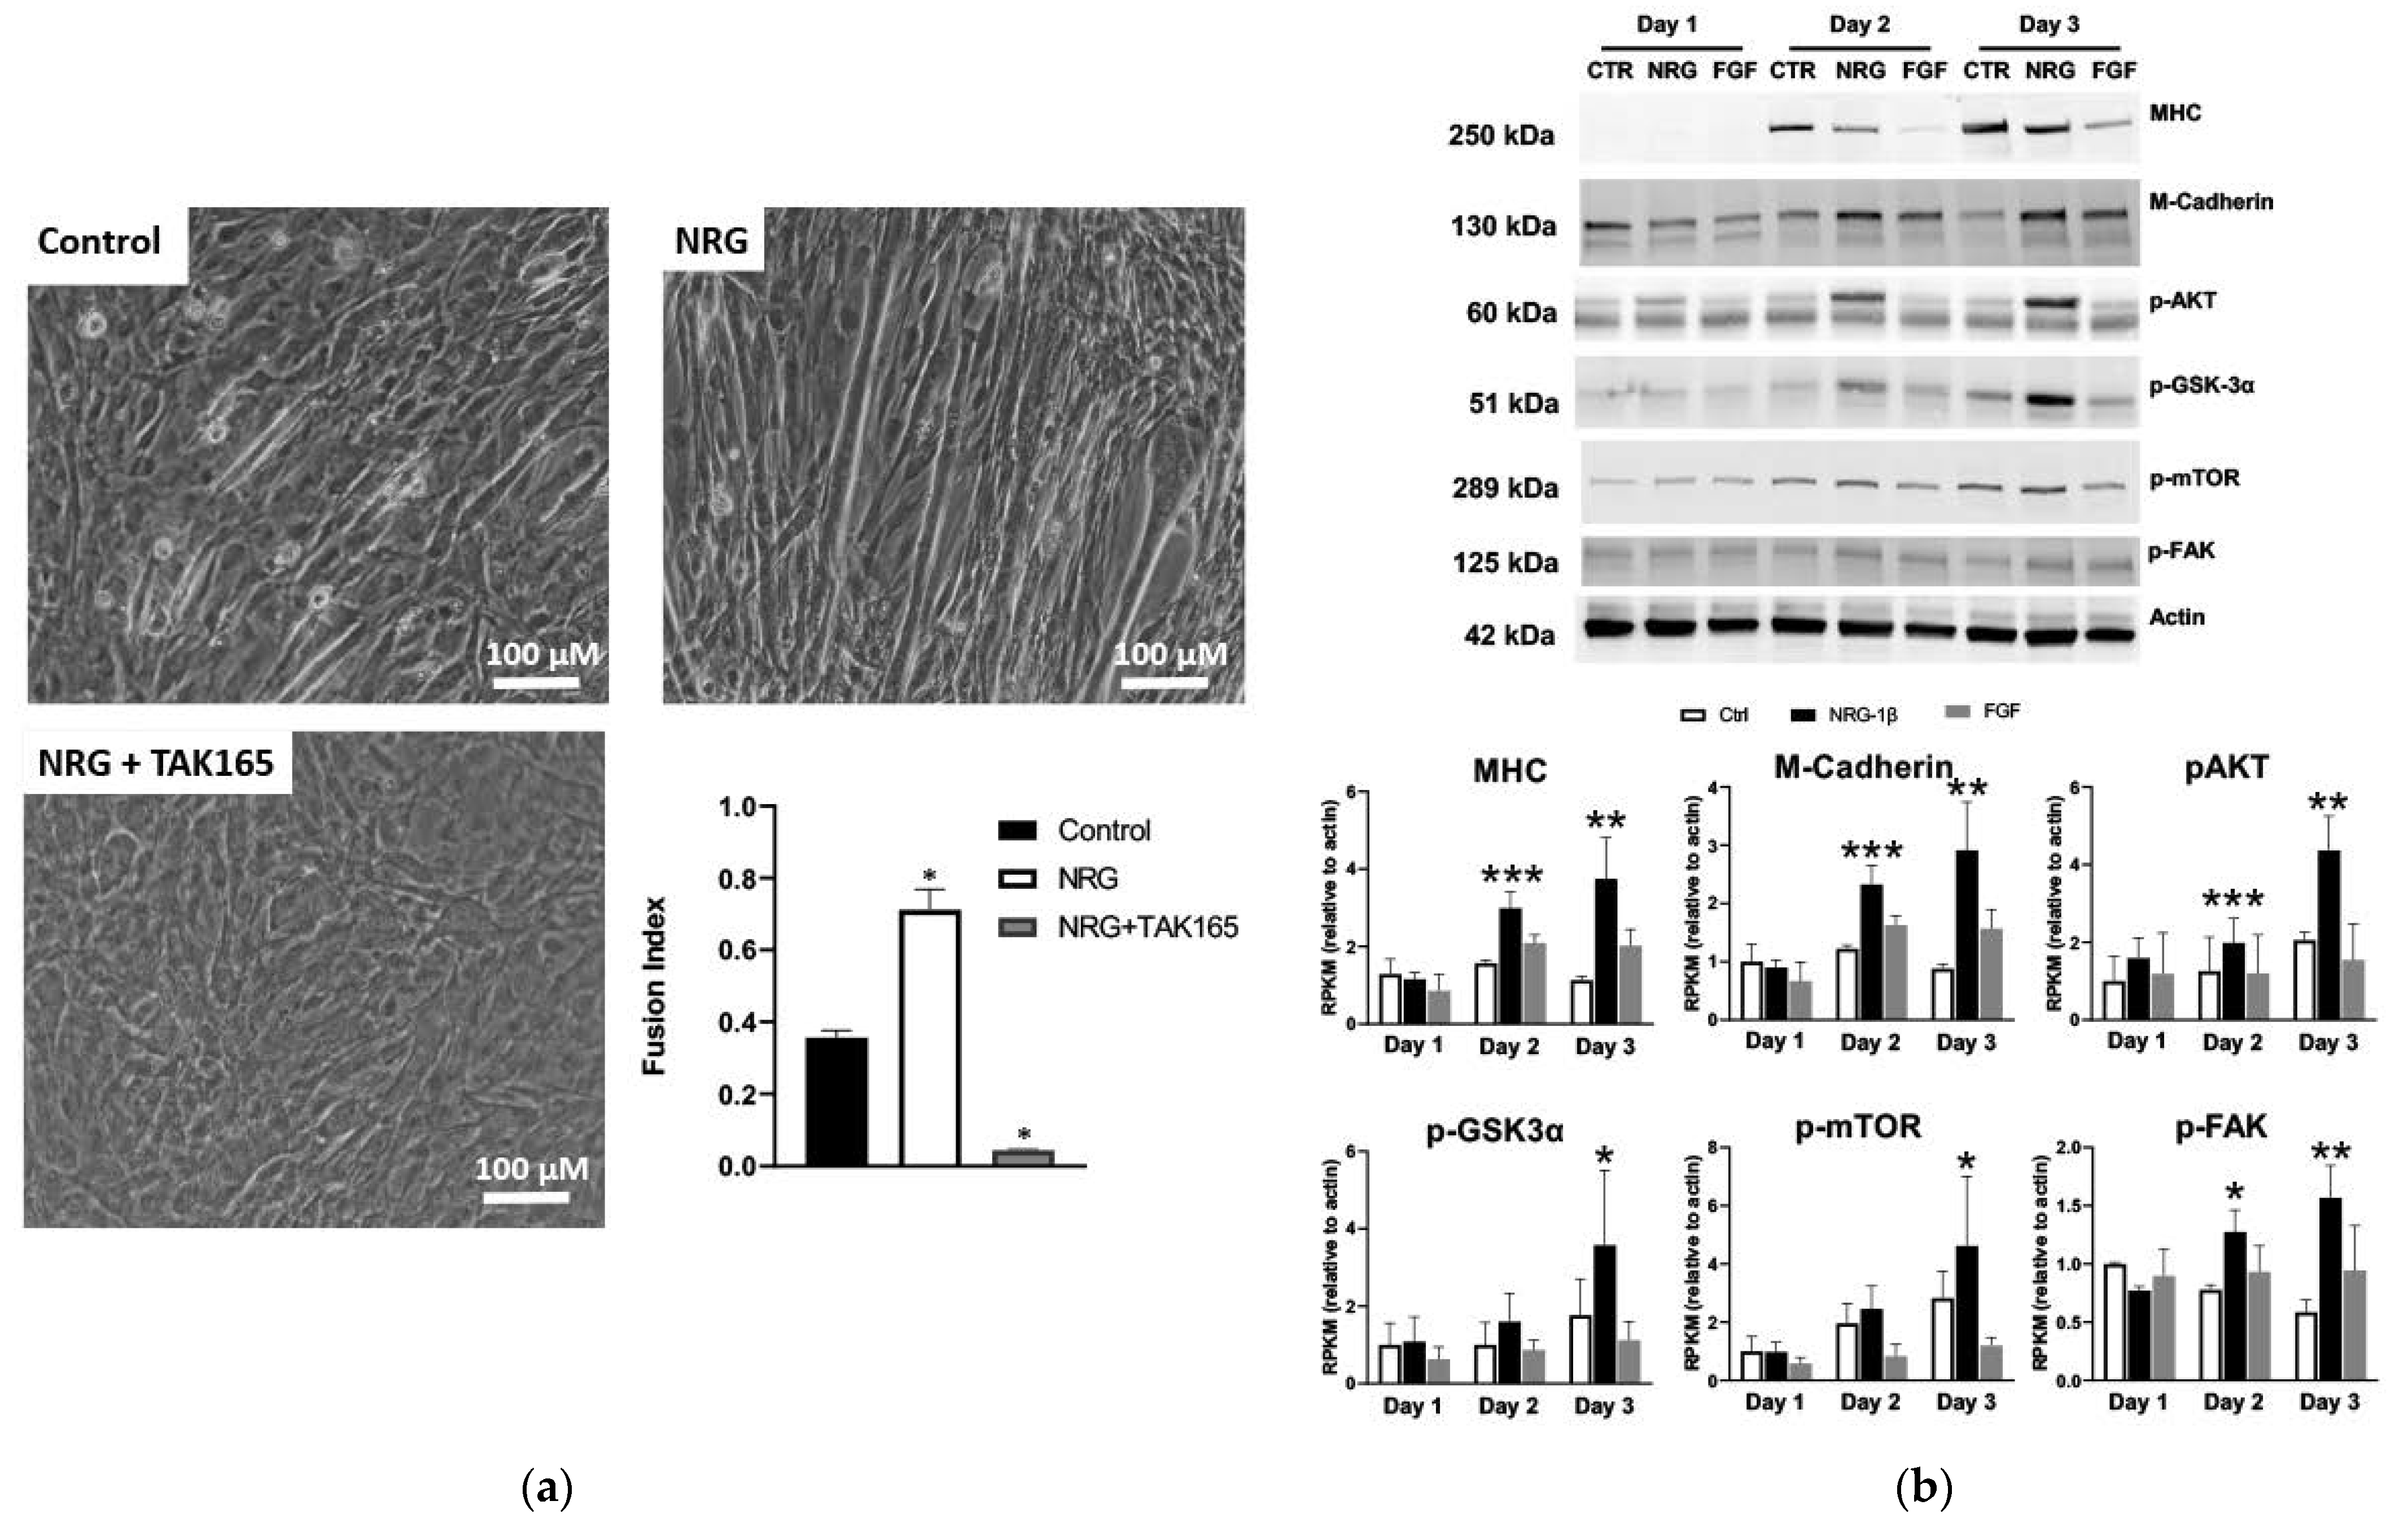
3.6. GGF2/NRG-1β Stimulates ErbB2-Dependent Myoblast Differentiation

To validate NRG-induced myogenesis, immature L6 or C2C12 myoblasts were cultured in differentiation media and treated with GGF2 or recombinant human NRG-1β for 5–6 days. Consistent with previous studies [12,13,81], NRG-1β and GGF2 enhanced myoblast fusion and myotube formation (Figure 6a and Figure S1). GGF2/NRG-1β-induced muscle cell differentiation was accompanied by increased protein levels of differentiation markers, including myosin heavy chain (MHC) and myotubule (M)-cadherin, as well as phosphorylated AKT, glycogen synthase kinase 3-α (GSK-3α), and focal adhesion kinase (FAK) (Figure 6b and Figure S1). ErbB2 expression and phosphorylation were increased during differentiation (Figure S2), and differentiation was abrogated by the addition of the ErbB2 inhibitor TAK165 (Figure 6a), as well as by other pharmacological inhibitors or siRNA (Figures S3–S7).

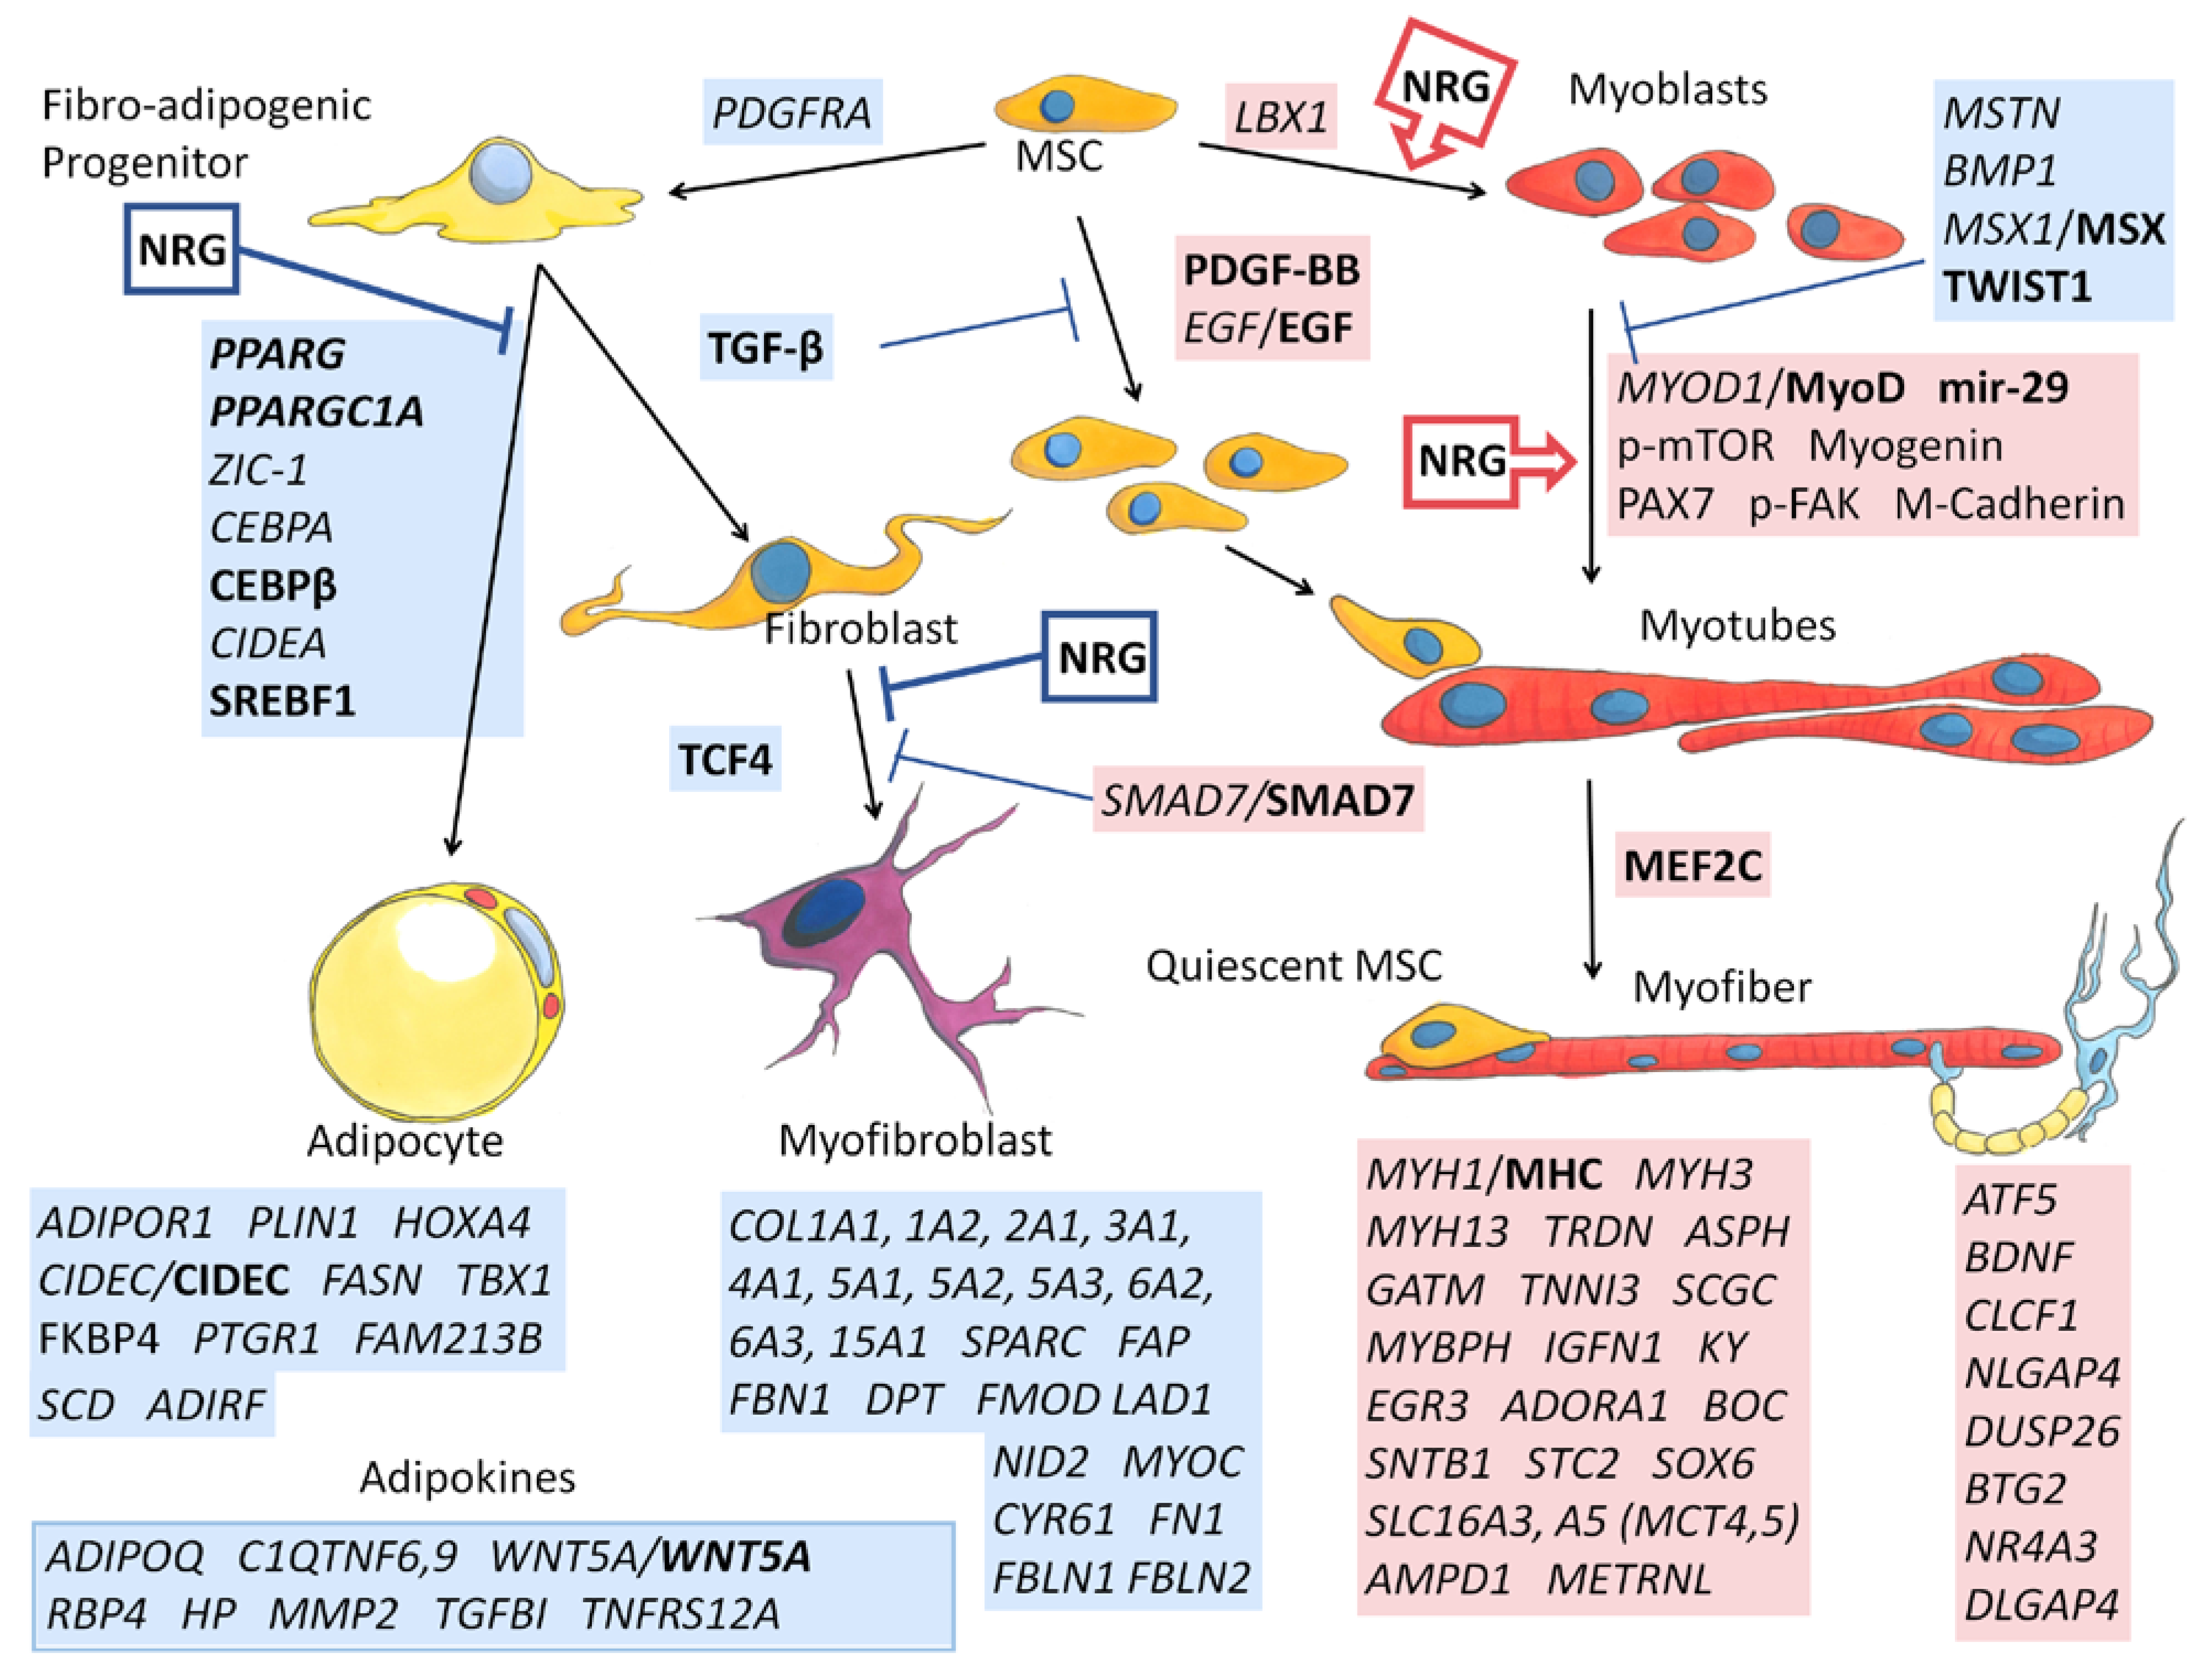
3.7. A Putative GGF2-Induced Skeletal Muscle Signaling Pathway

Based on gene set enrichment analysis (GSEA), top transcription factors for GGF2-altered genes included the pro-adipogenic factor CCAAT enhancer binding protein β (C/EBP-β, 101 genes, FDR q value = 3.8 × 10⁻³³), as well as the myogenic differentiation factors myoblast determination protein 1 (MYOD, 19 genes, FDR q value = 5.4 × 10⁻⁹) and myocyte enhancer factor-2 (MEF2, 21 genes, FDR q value = 1.1 × 10⁻⁸). A more comprehensive functional analysis using Ingenuity Pathway Analysis (IPA) software likewise identified these same three factors, as well as all three relevant ERBB receptors (Table 3), suggesting that more than one skeletal muscle cell type contributed to the observed transcriptional changes. Similarly, 45 genes were altered downstream of fibroblast growth factor (FGF2, p = 4.8 × 10⁻²⁰, Table 3), which is a known regulator of skeletal muscle proliferation and differentiation and additionally influences intramuscular adiposity by regulating trans-differentiation of fibro-adipogenic progenitors [82].
In addition to providing significance (p-value), IPA functional analysis additionally predicts directionality for some upstream factors (Table 3), based on known regulatory information derived from the scientific literature and other knowledge repositories. This information, along with manual searches of differentially expressed genes using PubMed and various online gene, protein, and signaling pathway databases, was used to construct a potentially meaningful functional network (Figure 7). This heuristic approach resulted in a clear pattern of down-regulated versus up-regulated genes, proteins, and predicted regulatory factors which generally correlated to cell types. Using these results as a guide, cell-type-specific proliferation and differentiation was inferred beginning with mesenchymal stem cells (MSC), which normally proliferate in response to platelet derived growth factor-BB (PDGF BB, 36 downstream genes altered, p = 3.7 × 10⁻²², activation Z score = 1.6, Table 3) and epidermal growth factor (EGF, transcriptionally up-regulated 3.5-fold, Supplementary Table S1 and 49 downstream genes affected, Table 3) and differentiate into fibro-adipogenic progenitors or myoblasts in response to platelet-derived growth factor receptor alpha (PDGFRA, transcriptionally downregulated -2.1-fold, Supplementary Table S1) and ladybird homeobox 1 (LBX1, transcriptionally upregulated 3.4-fold, Supplementary Table S1), respectively.
Concomitantly, myogenesis inhibitor Twist1 was also predicted as inhibited (Z = −2.4, Table 3). Twist 1 maintains skeletal muscle progenitors, in part by inhibiting transactivation of myocyte enhancer factor 2C (MEF2C), which was predicted as being activated in GGF2-treated post-MI pig skeletal muscle (Z = 2.9, Table 3). Continuing this process revealed generalized decreases in adipocyte and fibroblast lineages (blue boxes, Figure 7), along with increased MSCs and myoblast lineages (red boxes, Figure 7).

4. Discussion

The results presented herein show that exogenous delivery of a pharmaceutical-grade version of NRG/GGF2 not only improves post-MI cardiac function but may also promote better intercostal skeletal muscle function via shifting the balance of stem-cell derived differentiated cell types. The global expression profiles exhibited in muscles of treated post-MI pigs were overwhelmingly consistent with fewer adipocytes and myofibroblasts and conversely with higher numbers of myofibers. The combined methodologies comparing transcript levels with basic functional analyses, a meta-analysis of previously published muscle studies, and manual review of public databases and scientific literature provided a surprisingly complete and plausible molecular signature relevant to NRG-mediated multi-organ responses to cardiac injury.
In addition to predictive alterations in the activity levels of local transcription factors and intracellular signaling molecules, the functional analysis identified multiple circulating factors that could account for some of the observed transcriptional changes in skeletal muscle. Inhibition of TGF-β1, for example, might reflect systemic changes given that TGF-β is generally increased with chronic inflammation and has been proposed as a biomarker of coronary artery disease in the setting of acute heart failure [83]. Local skeletal muscle responses to lower circulating levels of AGT might likewise result from GGF2-mediated alterations in blood volume and blood pressure within the cardiovascular system. In support of this, GGF2 treatment altered several genes consistent with effects of the nonsteroidal anti-inflammatory drug clopidogrel (11 genes, p = 4.6 × 10⁻⁷, Z = 3.302, Table 3) and the hypertension drug enalapril (13 genes, p = 9.3 × 10⁻¹¹, Z = 3.073, Table 3). The SERCA2 inhibitor thapsigargin was similarly identified based on the directionality and expression of a cluster of 20 genes (6.5 × 10⁻⁸, Z = 3.450), suggesting that in skeletal muscle GGF2 mimics some of the cardioprotective actions associated with commonly used heart medications, possibly involving prolonged calcium-induced contractions and increased blood flow.
Although this study did not include sequencing of small RNAs, several micro-RNAs were nonetheless predicted as being present at the local tissue level or in the circulation. For instance, miR-29b-3p was predicted as being activated based on functional analysis (Z = 3.1, Table 3), which is notable, because miR-29b-3p promotes muscle differentiation by reducing myoblast proliferation and inducing myotube formation [84,85]. Similarly predicted as activated (Z = 2.8, Table 3), miR-335-3p was reported to play a role in muscle regeneration, influencing both myoblast differentiation and fiber type transformation [86,87]. On the other hand, sarcopenia-associated miR-21 [88,89] was predicted to be inhibited, based on the alteration of 17 mRNA targets in post-MI pigs (Table), which is of interest because mir-21 was recently reported to be a circulating biomarker for accelerated sarcopenia in patients with chronic heart failure [88]. GGF2 might also influence heart failure-associated muscle dysfunction via increased mir-30c-5p, which might represent a therapeutic target based on protection against myocardial ischemia-reperfusion injury in rats [90] and decreased plasma levels in patients with coronary heart disease [91].
Considered together, the data presented here strongly support the role of NRG/GGF2 in skeletal muscle maintenance and turnover in general and especially in the setting of cardiac injury and heart failure. Systemic treatments with circulating growth facts, such as NRG, may be problematic due to diverse effects, given the importance of NRG in multiple interrelated systems. On the other hand, these types of growth factor-based treatment have the benefit of potentially correcting abnormalities in multiple organs. In this study, we provide insights into the underlying molecular mechanisms of NRG-mediated effects inducible by cardiac injury-mediated stress in an “unrelated” tissue that is affected secondarily by heart dysfunction. Future studies will be aimed at dissecting cell-level effects of NRG/GGF2 and further investigating those identified downstream factors that might represent putative and highly specific therapeutic candidates for other muscle-involved disorders. In addition, future investigation examining respiratory muscle function will be needed to understand the potential clinical benefits of NRG/GGF2′s actions in skeletal muscle in this context.

5. Patents

There are no patents associated with this study.

Supplementary Materials

The following are available online at https://www.mdpi.com/article/10.3390/biology11050682/s1, Table S1: Differentially expressed genes in GGF2 treated post-MI pigs. Figures S1–S7: Supplementary methods for cell culture experiments. Figures S8–S14: Western blot membranes of (a) MHC (~250 kDa) protein detected with anti-MHC (MF20; 1:1000; R&D, Minneapolis, MN, USA) antibody, (b) M-Cadherin (~130 kDa) protein detected with anti-M Cadherin (D4B9L; 1:1000, Cell Signaling Technology, Danvers, MA, USA) antibody, (c) p-AKT (~60 kDa) protein detected with anti-phospho-AKT (Ser473, D9E; 1:1000, Cell Signaling Technology, Danvers, MA, USA) antibody (d) p-GSK3α (~51 kDa) protein detected with anti-GSK-3α (Ser21; 1:1000, Cell Signaling Technology, Danvers, MA, USA) antibody (e) p-mTOR (~289 kDa) protein detected with anti-phosho-mTOR (Ser2448; 1:1000, Cell Signaling Technology, Danvers, MA, USA) antibody (f) p-FAK (~125 kDa) protein detected with anti-phospho-FAK (Tyr576/577; 1:1000, Cell Signaling Technology, Danvers, MA, USA) antibody (g) actin (~kDa) protein detected with anti-actin (C-11; 1:1000, Santa Cruz Biotechnology, Inc., Dallas, TX, USA) antibody.

Author Contributions

Conceptualization, D.B.S.; methodology, D.B.S. and C.L.G.; software, C.L.G.; validation, V.T.N., B.H. and E.E.; formal analysis, C.L.G.; investigation, J.H.C.; resources, D.B.S.; data curation, C.L.G.; writing—original draft preparation, D.B.S. and C.L.G.; writing—review and editing, D.B.S., C.L.G., V.T.N., B.H. and E.E.; visualization, D.B.S. and C.L.G.; supervision, D.B.S.; project administration, D.B.S.; funding acquisition, D.B.S. and C.L.G. All authors have read and agreed to the published version of the manuscript.

Funding

This research was funded by the Ogden College of Science at WKU, National Institutes of Health National Heart Lung and Blood Institute (P20 HL101425, U01 HL100398, K01 HL121045–01) and of General Medical Sciences (P20GM103436), the National Science Foundation (EPSCoR) and Acorda Therapeutics, Inc. The APC was waived by the journal.

Institutional Review Board Statement

This study was approved by the Vanderbilt Institutional Animal Care and Use Committee (IACUC, protocol number M/10/117) and conducted according to Association for the Accreditation of Laboratory Animal Care (AAALAC) International standards.

Informed Consent Statement

Not applicable.

Data Availability Statement

Original study data are available in the Gene Expreassion Omnibus under Accession series number GSE48255 (https://www.ncbi.nlm.nih.gov/bioproject/PRJNA209383). Data were accessed June 2017 and February 2022.

Acknowledgments

The authors would like to thank Andrew Celso Gutierrez for providing the custom, hand-drawn cell illustrations displayed in Figure 7.

Conflicts of Interest

The authors declare no conflict of interest. The funders had no role in the design of the study; in the collection, analyses, or interpretation of data; in the writing of the manuscript, or in the decision to publish the results.

References

  1. Kharraz, Y.; Guerra, J.; Pessina, P.; Serrano, A.L.; Muñoz-Cánoves, P. Understanding the Process of Fibrosis in Duchenne Muscular Dystrophy. BioMed Res. Int. 2014, 2014, 965631. [Google Scholar] [CrossRef] [PubMed]
  2. Larsson, L.; Degens, H.; Li, M.; Salviati, L.; Lee, Y.I.; Thompson, W.; Kirkland, J.L.; Sandri, M. Sarcopenia: Aging-Related Loss of Muscle Mass and Function. Physiol. Rev. 2019, 99, 427–511. [Google Scholar] [CrossRef] [PubMed]
  3. Seene, T.; Kaasik, P. Muscle weakness in the elderly: Role of sarcopenia, dynapenia, and possibilities for rehabilitation. Eur. Rev. Aging Phys. Act. 2012, 9, 109–117. [Google Scholar] [CrossRef] [Green Version]
  4. Yokota, T.; Kinugawa, S.; Hirabayashi, K.; Yamato, M.; Takada, S.; Suga, T.; Nakano, I.; Fukushima, A.; Matsushima, S.; Okita, K.; et al. Systemic oxidative stress is associated with lower aerobic capacity and impaired skeletal muscle energy metabolism in heart failure patients. Sci. Rep. 2021, 11, 2272. [Google Scholar] [CrossRef] [PubMed]
  5. Zizola, C.; Schulze, P.C. Metabolic and structural impairment of skeletal muscle in heart failure. Heart Fail. Rev. 2013, 18, 623–630. [Google Scholar] [CrossRef] [Green Version]
  6. Keller-Ross, M.L.; Larson, M.; Johnson, B.D. Skeletal Muscle Fatigability in Heart Failure. Front. Physiol. 2019, 10, 129. [Google Scholar] [CrossRef] [Green Version]
  7. Kinugawa, S.; Takada, S.; Matsushima, S.; Okita, K.; Tsutsui, H. Skeletal Muscle Abnormalities in Heart Failure. Int. Heart J. 2015, 56, 475–484. [Google Scholar] [CrossRef] [Green Version]
  8. Maskin, C.S.; Forman, R.; Sonnenblick, E.H.; Frishman, W.H.; LeJemtel, T.H. Failure of dobutamine to increase exercise capacity despite hemodynamic improvement in severe chronic heart failure. Am. J. Cardiol. 1983, 51, 177–182. [Google Scholar] [CrossRef]
  9. Mancini, D.M.; Coyle, E.; Coggan, A.; Beltz, J.; Ferraro, N.; Montain, S.; Wilson, J.R. Contribution of intrinsic skeletal muscle changes to 31P NMR skeletal muscle metabolic abnormalities in patients with chronic heart failure. Circulation 1989, 80, 1338–1346. [Google Scholar] [CrossRef] [Green Version]
  10. Britsch, S.; Li, L.; Kirchhoff, S.; Theuring, F.; Brinkmann, V.; Birchmeier, C.; Riethmacher, D. The ErbB2 and ErbB3 receptors and their ligand, neuregulin-1, are essential for development of the sympathetic nervous system. Genes Dev. 1998, 12, 1825–1836. [Google Scholar] [CrossRef] [Green Version]
  11. Sandrock, A.W., Jr.; Goodearl, A.D.; Yin, Q.W.; Chang, D.; Fischbach, G.D. ARIA is concentrated in nerve terminals at neuromuscular junctions and at other synapses. J. Neurosci. 1995, 15, 6124–6136. [Google Scholar] [CrossRef] [PubMed]
  12. Florini, J.R.; Samuel, D.S.; Ewton, D.Z.; Kirk, C.; Sklar, R.M. Stimulation of myogenic differentiation by a neuregulin, glial growth factor 2. Are neuregulins the long-sought muscle trophic factors secreted by nerves? J. Biol. Chem. 1996, 271, 12699–12702. [Google Scholar] [CrossRef] [PubMed] [Green Version]
  13. Kim, D.; Chi, S.; Lee, K.H.; Rhee, S.; Kwon, Y.K.; Chung, C.H.; Kwon, H.; Kang, M.S. Neuregulin stimulates myogenic differentiation in an autocrine manner. J. Biol. Chem. 1999, 274, 15395–15400. [Google Scholar] [CrossRef] [Green Version]
  14. Ford, B.D.; Han, B.; Fischbach, G.D. Differentiation-dependent regulation of skeletal myogenesis by neuregulin-1. Biochem. Biophys. Res. Commun. 2003, 306, 276–281. [Google Scholar] [CrossRef]
  15. Jo, S.A.; Zhu, X.; Marchionni, M.A.; Burden, S.J. Neuregulins are concentrated at nerve-muscle synapses and activate ACh–receptor gene expression. Nature 1995, 373, 158–161. [Google Scholar] [CrossRef] [PubMed]
  16. Van Ho, A.T.; Hayashi, S.; Brohl, D.; Aurade, F.; Rattenbach, R.; Relaix, F. Neural crest cell lineage restricts skeletal muscle progenitor cell differentiation through Neuregulin1-ErbB3 signaling. Dev. Cell 2011, 21, 273–287. [Google Scholar] [CrossRef]
  17. Galindo, C.L.; Kasasbeh, E.; Murphy, A.; Ryzhov, S.; Lenihan, S.; Ahmad, F.A.; Williams, P.; Nunnally, A.; Adcock, J.; Song, Y.; et al. Anti-remodeling and anti-fibrotic effects of the neuregulin-1beta glial growth factor 2 in a large animal model of heart failure. J. Am. Heart Assoc. 2014, 3, e000773. [Google Scholar] [CrossRef] [Green Version]
  18. Huang, Z.; Sawyer, D.B.; Troy, E.L.; McEwen, C.; Cleator, J.H.; Murphy, A.; Caggiano, A.O.; Eisen, A.; Parry, T.J. Species-specific effects of neuregulin-1beta (cimaglermin alfa) on glucose handling in animal models and humans with heart failure. Toxicol. Appl. Pharmacol. 2017, 332, 92–99. [Google Scholar] [CrossRef]
  19. Parry, T.J.; Ganguly, A.; Troy, E.L.; Luis Guerrero, J.; Iaci, J.F.; Srinivas, M.; Vecchione, A.M.; Button, D.C.; Hackett, C.S.; Zolty, R.; et al. Effects of neuregulin GGF2 (cimaglermin alfa) dose and treatment frequency on left ventricular function in rats following myocardial infarction. Eur. J. Pharmacol. 2017, 796, 76–89. [Google Scholar] [CrossRef]
  20. Liu, Q.; Zhu, X.; Xu, L.; Fu, Y.; Garvey, W.T. 6-Mercaptopurine augments glucose transport activity in skeletal muscle cells in part via a mechanism dependent upon orphan nuclear receptor NR4A3. Am. J. Physiol.-Endocrinol. Metab. 2013, 305, E1081–E1092. [Google Scholar] [CrossRef] [Green Version]
  21. Pearen, M.A.; Ryall, J.G.; Maxwell, M.A.; Ohkura, N.; Lynch, G.S.; Muscat, G.E. The orphan nuclear receptor, NOR-1, is a target of beta-adrenergic signaling in skeletal muscle. Endocrinology 2006, 147, 5217–5227. [Google Scholar] [CrossRef] [PubMed] [Green Version]
  22. Guo, Z.; Luo, C.; Zhu, T.; Li, L.; Zhang, W. Elevated c-fos expression is correlated with phenotypic switching of human vascular smooth muscle cells derived from lower limb venous varicosities. J. Vasc. Surg. Venous Lymphat. Disord. 2021, 9, 242–251. [Google Scholar] [CrossRef] [PubMed]
  23. Trouche, D.; Grigoriev, M.; Lenormand, J.-L.; Robin, P.; Alexandre Leibovitch, S.; Sassone-Corsi, P.; Harel-Bellan, A. Repression of c-fos promoter by MyoD on muscle cell differentiation. Nature 1993, 363, 79–82. [Google Scholar] [CrossRef] [PubMed]
  24. Zhao, L.; Ouyang, Y.; Bai, Y.; Gong, J.; Liao, H. miR-155-5p inhibits the viability of vascular smooth muscle cell via targeting FOS and ZIC3 to promote aneurysm formation. Eur. J. Pharmacol. 2019, 853, 145–152. [Google Scholar] [CrossRef]
  25. Shah, V.O.; Dominic, E.A.; Moseley, P.; Pickett, G.; Fleet, M.; Ness, S.; Raj, D.S.C. Hemodialysis Modulates Gene Expression Profile in Skeletal Muscle. Am. J. Kidney Dis. 2006, 48, 616–628. [Google Scholar] [CrossRef]
  26. Tamboli, R.A.; Hajri, T.; Jiang, A.; Marks-Shulman, P.A.; Williams, D.B.; Clements, R.H.; Melvin, W.; Bowen, B.P.; Shyr, Y.; Abumrad, N.N.; et al. Reduction in inflammatory gene expression in skeletal muscle from Roux-en-Y gastric bypass patients randomized to omentectomy. PLoS ONE 2011, 6, e28577. [Google Scholar] [CrossRef] [Green Version]
  27. Pestov, N.B.; Adams, G.; Shakhparonov, M.I.; Modyanov, N.N. Identification of a novel gene of the X,K-ATPase beta-subunit family that is predominantly expressed in skeletal and heart muscles. FEBS Lett. 1999, 456, 243–248. [Google Scholar] [CrossRef] [Green Version]
  28. Pestov, N.B.; Zhao, H.; Basrur, V.; Modyanov, N.N. Isolation and characterization of BetaM protein encoded by ATP1B4—A unique member of the Na,K-ATPase β-subunit gene family. Biochem. Biophys. Res. Commun. 2011, 412, 543–548. [Google Scholar] [CrossRef]
  29. Roediger, M.; Miosge, N.; Gersdorff, N. Tissue distribution of the laminin β1 and β2 chain during embryonic and fetal human development. J. Mol. Histol. 2010, 41, 177–184. [Google Scholar] [CrossRef] [Green Version]
  30. Radmanesh, F.; Caglayan, A.O.; Silhavy, J.L.; Yilmaz, C.; Cantagrel, V.; Omar, T.; Rosti, B.; Kaymakcalan, H.; Gabriel, S.; Li, M.; et al. Mutations in LAMB1 cause cobblestone brain malformation without muscular or ocular abnormalities. Am. J. Hum. Genet. 2013, 92, 468–474. [Google Scholar] [CrossRef] [Green Version]
  31. Engebretsen, K.V.; Lunde, I.G.; Strand, M.E.; Waehre, A.; Sjaastad, I.; Marstein, H.S.; Skrbic, B.; Dahl, C.P.; Askevold, E.T.; Christensen, G.; et al. Lumican is increased in experimental and clinical heart failure, and its production by cardiac fibroblasts is induced by mechanical and proinflammatory stimuli. FEBS J. 2013, 280, 2382–2398. [Google Scholar] [CrossRef] [PubMed]
  32. Mohammadzadeh, N.; Lunde, I.G.; Andenæs, K.; Strand, M.E.; Aronsen, J.M.; Skrbic, B.; Marstein, H.S.; Bandlien, C.; Nygård, S.; Gorham, J.; et al. The extracellular matrix proteoglycan lumican improves survival and counteracts cardiac dilatation and failure in mice subjected to pressure overload. Sci. Rep. 2019, 9, 9206. [Google Scholar] [CrossRef] [PubMed]
  33. Li, Y.; Song, D.; Mao, L.; Abraham, D.M.; Bursac, N. Lack of Thy1 defines a pathogenic fraction of cardiac fibroblasts in heart failure. Biomaterials 2020, 236, 119824. [Google Scholar] [CrossRef] [PubMed]
  34. Cheng, K.; Ibrahim, A.; Hensley, M.T.; Shen, D.; Sun, B.; Middleton, R.; Liu, W.; Smith, R.R.; Marbán, E. Relative roles of CD90 and c-kit to the regenerative efficacy of cardiosphere-derived cells in humans and in a mouse model of myocardial infarction. J. Am. Heart Assoc. 2014, 3, e001260. [Google Scholar] [CrossRef] [PubMed] [Green Version]
  35. Hamada, T.; Wessagowit, V.; South, A.P.; Ashton, G.H.; Chan, I.; Oyama, N.; Siriwattana, A.; Jewhasuchin, P.; Charuwichitratana, S.; Thappa, D.M.; et al. Extracellular matrix protein 1 gene (ECM1) mutations in lipoid proteinosis and genotype-phenotype correlation. J. Investig. Dermatol. 2003, 120, 345–350. [Google Scholar] [CrossRef] [Green Version]
  36. Hardy, S.A.; Mabotuwana, N.S.; Murtha, L.A.; Coulter, B.; Sanchez-Bezanilla, S.; Al-Omary, M.S.; Senanayake, T.; Loering, S.; Starkey, M.; Lee, R.J.; et al. Novel role of extracellular matrix protein 1 (ECM1) in cardiac aging and myocardial infarction. PLoS ONE 2019, 14, e0212230. [Google Scholar] [CrossRef] [Green Version]
  37. Uitte de Willige, S.; Keane, F.M.; Bowen, D.G.; Malfliet, J.; Zhang, H.E.; Maneck, B.; McCaughan, G.W.; Leebeek, F.W.G.; Rijken, D.C.; Gorrell, M.D. Circulating fibroblast activation protein activity and antigen levels correlate strongly when measured in liver disease and coronary heart disease. PLoS ONE 2017, 12, e0178987. [Google Scholar] [CrossRef] [Green Version]
  38. Li, M.; Cheng, X.; Rong, R.; Gao, Y.; Tang, X.; Chen, Y. High expression of fibroblast activation protein (FAP) predicts poor outcome in high-grade serous ovarian cancer. BMC Cancer 2020, 20, 1032. [Google Scholar] [CrossRef]
  39. Solano-Iturri, J.D.; Beitia, M.; Errarte, P.; Calvete-Candenas, J.; Etxezarraga, M.C.; Loizate, A.; Echevarria, E.; Badiola, I.; Larrinaga, G. Altered expression of fibroblast activation protein-α (FAP) in colorectal adenoma-carcinoma sequence and in lymph node and liver metastases. Aging 2020, 12, 10337–10358. [Google Scholar] [CrossRef]
  40. Kim, T.; Ahmad, K.; Shaikh, S.; Jan, A.T.; Seo, M.-G.; Lee, E.J.; Choi, I. Dermatopontin in Skeletal Muscle Extracellular Matrix Regulates Myogenesis. Cells 2019, 8, 332. [Google Scholar] [CrossRef] [Green Version]
  41. Bastos, A.N.; Alves, M.M.; Monte-Alto-Costa, A.; Machado, D.G.; Cavalcante, G.J.; Panico, M.; Porto, L.C. α-smooth muscle actin, fibrillin-1, apoptosis and proliferation detection in primary varicose lower limb veins of women. Int. Angiol. 2011, 30, 262–271. [Google Scholar] [PubMed]
  42. Chen, L.; Ge, Q.; Black, J.L.; Deng, L.; Burgess, J.K.; Oliver, B.G. Differential regulation of extracellular matrix and soluble fibulin-1 levels by TGF-β₁ in airway smooth muscle cells. PLoS ONE 2013, 8, e65544. [Google Scholar] [CrossRef] [PubMed]
  43. Franken, R.; Teixido-Tura, G.; Brion, M.; Forteza, A.; Rodriguez-Palomares, J.; Gutierrez, L.; Garcia Dorado, D.; Pals, G.; Mulder, B.J.; Evangelista, A. Relationship between fibrillin-1 genotype and severity of cardiovascular involvement in Marfan syndrome. Heart 2017, 103, 1795–1799. [Google Scholar] [CrossRef] [PubMed]
  44. McNiven, V.; Ito, Y.A.; Hartley, T.; Kernohan, K.; Miller, E.; Armour, C.M. NID1 variant associated with occipital cephaloceles in a family expressing a spectrum of phenotypes. Am. J. Med. Genet. Part A 2019, 179, 837–841. [Google Scholar] [CrossRef] [PubMed]
  45. Zimmermann, K.; Hoischen, S.; Hafner, M.; Nischt, R. Genomic sequences and structural organization of the human nidogen gene (NID). Genomics 1995, 27, 245–250. [Google Scholar] [CrossRef]
  46. Kim, E.H.; Galchev, V.I.; Kim, J.Y.; Misek, S.A.; Stevenson, T.K.; Campbell, M.D.; Pagani, F.D.; Day, S.M.; Johnson, T.C.; Washburn, J.G.; et al. Differential protein expression and basal lamina remodeling in human heart failure. Proteom. Clin. Appl. 2016, 10, 585–596. [Google Scholar] [CrossRef] [Green Version]
  47. Wadley, G.D.; Lamon, S.; Alexander, S.E.; McMullen, J.R.; Bernardo, B.C. Noncoding RNAs regulating cardiac muscle mass. J. Appl. Physiol. 2018, 127, 633–644. [Google Scholar] [CrossRef]
  48. Chen, L.; Bai, J.; Li, Y. miR-29 mediates exercise-induced skeletal muscle angiogenesis by targeting VEGFA, COL4A1 and COL4A2 via the PI3K/Akt signaling pathway. Mol. Med. Rep. 2020, 22, 661–670. [Google Scholar] [CrossRef]
  49. Labelle-Dumais, C.; Schuitema, V.; Hayashi, G.; Hoff, K.; Gong, W.; Dao, D.Q.; Ullian, E.M.; Oishi, P.; Margeta, M.; Gould, D.B. COL4A1 Mutations Cause Neuromuscular Disease with Tissue-Specific Mechanistic Heterogeneity. Am. J. Hum. Genet. 2019, 104, 847–860. [Google Scholar] [CrossRef] [Green Version]
  50. Meienberg, J.; Rohrbach, M.; Neuenschwander, S.; Spanaus, K.; Giunta, C.; Alonso, S.; Arnold, E.; Henggeler, C.; Regenass, S.; Patrignani, A.; et al. Hemizygous deletion of COL3A1, COL5A2, and MSTN causes a complex phenotype with aortic dissection: A lesson for and from true haploinsufficiency. Eur. J. Hum. Genet. 2010, 18, 1315–1321. [Google Scholar] [CrossRef] [Green Version]
  51. Meng, X.Y.; Shi, M.J.; Zeng, Z.H.; Chen, C.; Liu, T.Z.; Wu, Q.J.; Li, S.; Li, S. The Role of COL5A2 in Patients with Muscle-Invasive Bladder Cancer: A Bioinformatics Analysis of Public Datasets Involving 787 Subjects and 29 Cell Lines. Front. Oncol. 2018, 8, 659. [Google Scholar] [CrossRef] [PubMed]
  52. Wenzel, K.; Zabojszcza, J.; Carl, M.; Taubert, S.; Lass, A.; Harris, C.L.; Ho, M.; Schulz, H.; Hummel, O.; Hubner, N.; et al. Increased susceptibility to complement attack due to down-regulation of decay-accelerating factor/CD55 in dysferlin-deficient muscular dystrophy. J. Immunol. 2005, 175, 6219–6225. [Google Scholar] [CrossRef] [PubMed] [Green Version]
  53. Kuivaniemi, H.; Tromp, G. Type III collagen (COL3A1): Gene and protein structure, tissue distribution, and associated diseases. Gene 2019, 707, 151–171. [Google Scholar] [CrossRef] [PubMed]
  54. Li, Y.H.; Ghavampur, S.; Bondallaz, P.; Will, L.; Grenningloh, G.; Pu Schel, A.W. Rnd1 regulates axon extension by enhancing the microtubule destabilizing activity of SCG10. J. Biol. Chem. 2009, 284, 363–371. [Google Scholar] [CrossRef] [PubMed] [Green Version]
  55. Song, Y.; Liu, S.; Zhao, Z.; Zhang, Y.; Yang, Y.; Luo, B. Relationship between PPP1R15A gene polymorphism (rs611251) and Epstein-Barr virus-associated tumors. Acta Virol. 2017, 61, 445–452. [Google Scholar] [CrossRef] [PubMed]
  56. Ishikawa, Y.; Sakurai, H. Heat-induced expression of the immediate-early gene IER5 and its involvement in the proliferation of heat-shocked cells. FEBS J. 2015, 282, 332–340. [Google Scholar] [CrossRef]
  57. Nakamura, M.; Basavarajaiah, P.; Rousset, E.; Beraud, C.; Latreille, D.; Henaoui, I.S.; Lassot, I.; Mari, B.; Kiernan, R. Spt6 levels are modulated by PAAF1 and proteasome to regulate the HIV-1 LTR. Retrovirology 2012, 9, 13. [Google Scholar] [CrossRef] [Green Version]
  58. Liu, J.; Luo, C.; Yin, Z.; Li, P.; Wang, S.; Chen, J.; He, Q.; Zhou, J. Downregulation of let-7b promotes COL1A1 and COL1A2 expression in dermis and skin fibroblasts during heat wound repair. Mol. Med. Rep. 2016, 13, 2683–2688. [Google Scholar] [CrossRef]
  59. Camaj, P.; Seeliger, H.; Ischenko, I.; Krebs, S.; Blum, H.; De Toni, E.N.; Faktorova, D.; Jauch, K.W.; Bruns, C.J. EFEMP1 binds the EGF receptor and activates MAPK and Akt pathways in pancreatic carcinoma cells. Biol. Chem. 2009, 390, 1293–1302. [Google Scholar] [CrossRef] [Green Version]
  60. Lei, B.; Wan, B.; Peng, J.; Yang, Y.; Lv, D.; Zhou, X.; Shu, F.; Li, F.; Zhong, L.; Wu, H.; et al. PRPS2 Expression Correlates with Sertoli-Cell Only Syndrome and Inhibits the Apoptosis of TM4 Sertoli Cells. J. Urol. 2015, 194, 1491–1497. [Google Scholar] [CrossRef]
  61. Miao, W.; Wang, Y. Targeted Quantitative Kinome Analysis Identifies PRPS2 as a Promoter for Colorectal Cancer Metastasis. J. Proteome Res. 2019, 18, 2279–2286. [Google Scholar] [CrossRef] [PubMed]
  62. Kim, S.; Song, J.; Ernst, P.; Latimer, M.N.; Ha, C.-M.; Goh, K.Y.; Ma, W.; Rajasekaran, N.-S.; Zhang, J.; Liu, X.; et al. MitoQ regulates redox-related noncoding RNAs to preserve mitochondrial network integrity in pressure-overload heart failure. Am. J. Physiol. Heart Circ. Physiol. 2020, 318, H682–H695. [Google Scholar] [CrossRef] [PubMed]
  63. Son, G.H.; Park, S.H.; Kim, Y.; Kim, J.Y.; Kim, J.W.; Chung, S.; Kim, Y.H.; Kim, H.; Hwang, J.J.; Seo, J.S. Postmortem mRNA expression patterns in left ventricular myocardial tissues and their implications for forensic diagnosis of sudden cardiac death. Mol. Cells 2014, 37, 241–247. [Google Scholar] [CrossRef] [PubMed] [Green Version]
  64. Nauck, M.A.; Quast, D.R.; Wefers, J.; Meier, J.J. GLP-1 receptor agonists in the treatment of type 2 diabetes–state-of-the-art. Mol. Metab. 2021, 46, 101102. [Google Scholar] [CrossRef] [PubMed]
  65. Wang, T.; Zhong, H.; Qin, Y.; Wei, W.; Li, Z.; Huang, M.; Luo, X. ARMCX Family Gene Expression Analysis and Potential Prognostic Biomarkers for Prediction of Clinical Outcome in Patients with Gastric Carcinoma. BioMed Res. Int. 2020, 2020, 3575038. [Google Scholar] [CrossRef]
  66. Wellner, M.; Dechend, R.; Park, J.K.; Shagdarsuren, E.; Al-Saadi, N.; Kirsch, T.; Gratze, P.; Schneider, W.; Meiners, S.; Fiebeler, A.; et al. Cardiac gene expression profile in rats with terminal heart failure and cachexia. Physiol. Genom. 2005, 20, 256–267. [Google Scholar] [CrossRef] [Green Version]
  67. Soares, R.J.; Cagnin, S.; Chemello, F.; Silvestrin, M.; Musaro, A.; De Pitta, C.; Lanfranchi, G.; Sandri, M. Involvement of microRNAs in the regulation of muscle wasting during catabolic conditions. J. Biol. Chem. 2014, 289, 21909–21925. [Google Scholar] [CrossRef] [Green Version]
  68. Screen, M.; Jonson, P.H.; Raheem, O.; Palmio, J.; Laaksonen, R.; Lehtimaki, T.; Sirito, M.; Krahe, R.; Hackman, P.; Udd, B. Abnormal splicing of NEDD4 in myotonic dystrophy type 2: Possible link to statin adverse reactions. Am. J. Pathol. 2014, 184, 2322–2332. [Google Scholar] [CrossRef] [Green Version]
  69. Crooks, D.R.; Natarajan, T.G.; Jeong, S.Y.; Chen, C.; Park, S.Y.; Huang, H.; Ghosh, M.C.; Tong, W.H.; Haller, R.G.; Wu, C.; et al. Elevated FGF21 secretion, PGC-1alpha and ketogenic enzyme expression are hallmarks of iron-sulfur cluster depletion in human skeletal muscle. Hum. Mol. Genet. 2014, 23, 24–39. [Google Scholar] [CrossRef] [Green Version]
  70. Palermo, A.T.; Palmer, R.E.; So, K.S.; Oba-Shinjo, S.M.; Zhang, M.; Richards, B.; Madhiwalla, S.T.; Finn, P.F.; Hasegawa, A.; Ciociola, K.M.; et al. Transcriptional response to GAA deficiency (Pompe disease) in infantile-onset patients. Mol. Genet. Metab. 2012, 106, 287–300. [Google Scholar] [CrossRef]
  71. Gallagher, I.J.; Stephens, N.A.; MacDonald, A.J.; Skipworth, R.J.; Husi, H.; Greig, C.A.; Ross, J.A.; Timmons, J.A.; Fearon, K.C. Suppression of skeletal muscle turnover in cancer cachexia: Evidence from the transcriptome in sequential human muscle biopsies. Clin. Cancer Res. Off. J. Am. Assoc. Cancer Res. 2012, 18, 2817–2827. [Google Scholar] [CrossRef] [PubMed] [Green Version]
  72. Screen, M.; Raheem, O.; Holmlund-Hampf, J.; Jonson, P.H.; Huovinen, S.; Hackman, P.; Udd, B. Gene expression profiling in tibial muscular dystrophy reveals unfolded protein response and altered autophagy. PLoS ONE 2014, 9, e90819. [Google Scholar] [CrossRef] [PubMed]
  73. Raue, U.; Trappe, T.A.; Estrem, S.T.; Qian, H.R.; Helvering, L.M.; Smith, R.C.; Trappe, S. Transcriptome signature of resistance exercise adaptations: Mixed muscle and fiber type specific profiles in young and old adults. J. Appl. Physiol. 2012, 112, 1625–1636. [Google Scholar] [CrossRef] [PubMed] [Green Version]
  74. Lanza, I.R.; Short, D.K.; Short, K.R.; Raghavakaimal, S.; Basu, R.; Joyner, M.J.; McConnell, J.P.; Nair, K.S. Endurance exercise as a countermeasure for aging. Diabetes 2008, 57, 2933–2942. [Google Scholar] [CrossRef] [Green Version]
  75. Urso, M.L.; Scrimgeour, A.G.; Chen, Y.W.; Thompson, P.D.; Clarkson, P.M. Analysis of human skeletal muscle after 48 h immobilization reveals alterations in mRNA and protein for extracellular matrix components. J. Appl. Physiol. 2006, 101, 1136–1148. [Google Scholar] [CrossRef] [Green Version]
  76. Reich, K.A.; Chen, Y.W.; Thompson, P.D.; Hoffman, E.P.; Clarkson, P.M. Forty-eight hours of unloading and 24 h of reloading lead to changes in global gene expression patterns related to ubiquitination and oxidative stress in humans. J. Appl. Physiol. 2010, 109, 1404–1415. [Google Scholar] [CrossRef]
  77. Poelkens, F.; Lammers, G.; Pardoel, E.M.; Tack, C.J.; Hopman, M.T. Upregulation of skeletal muscle inflammatory genes links inflammation with insulin resistance in women with the metabolic syndrome. Exp. Physiol. 2013, 98, 1485–1494. [Google Scholar] [CrossRef]
  78. Skov, V.; Glintborg, D.; Knudsen, S.; Jensen, T.; Kruse, T.A.; Tan, Q.; Brusgaard, K.; Beck-Nielsen, H.; Hojlund, K. Reduced expression of nuclear-encoded genes involved in mitochondrial oxidative metabolism in skeletal muscle of insulin-resistant women with polycystic ovary syndrome. Diabetes 2007, 56, 2349–2355. [Google Scholar] [CrossRef] [Green Version]
  79. Skov, V.; Glintborg, D.; Knudsen, S.; Tan, Q.; Jensen, T.; Kruse, T.A.; Beck-Nielsen, H.; Hojlund, K. Pioglitazone enhances mitochondrial biogenesis and ribosomal protein biosynthesis in skeletal muscle in polycystic ovary syndrome. PLoS ONE 2008, 3, e2466. [Google Scholar] [CrossRef]
  80. Jin, W.; Goldfine, A.B.; Boes, T.; Henry, R.R.; Ciaraldi, T.P.; Kim, E.Y.; Emecan, M.; Fitzpatrick, C.; Sen, A.; Shah, A.; et al. Increased SRF transcriptional activity in human and mouse skeletal muscle is a signature of insulin resistance. J. Clin. Investig. 2011, 121, 918–929. [Google Scholar] [CrossRef] [Green Version]
  81. Suarez, E.; Bach, D.; Cadefau, J.; Palacin, M.; Zorzano, A.; Guma, A. A novel role of neuregulin in skeletal muscle. Neuregulin stimulates glucose uptake, glucose transporter translocation, and transporter expression in muscle cells. J. Biol. Chem. 2001, 276, 18257–18264. [Google Scholar] [CrossRef] [PubMed] [Green Version]
  82. Mathes, S.; Fahrner, A.; Ghoshdastider, U.; Rudiger, H.A.; Leunig, M.; Wolfrum, C.; Krutzfeldt, J. FGF-2-dependent signaling activated in aged human skeletal muscle promotes intramuscular adipogenesis. Proc. Natl. Acad. Sci. USA 2021, 118. [Google Scholar] [CrossRef] [PubMed]
  83. Qiu, X.; Ma, F.; Zhang, H. Circulating Levels of IL-13, TGF-beta1, and Periostin as Potential Biomarker for Coronary Artery Disease with Acute Heart Failure. Evid.-Based Complement. Altern. Med. 2021, 2021, 1690421. [Google Scholar] [CrossRef] [PubMed]
  84. Qin, C.Y.; Cai, H.; Qing, H.R.; Li, L.; Zhang, H.P. Recent advances on the role of long non-coding RNA H19 in regulating mammalian muscle growth and development. Yi chuan = Hereditas 2017, 39, 1150–1157. [Google Scholar] [CrossRef]
  85. Wei, W.; He, H.B.; Zhang, W.Y.; Zhang, H.X.; Bai, J.B.; Liu, H.Z.; Cao, J.H.; Chang, K.C.; Li, X.Y.; Zhao, S.H. miR-29 targets Akt3 to reduce proliferation and facilitate differentiation of myoblasts in skeletal muscle development. Cell Death Dis. 2013, 4, e668. [Google Scholar] [CrossRef] [Green Version]
  86. Greco, S.; De Simone, M.; Colussi, C.; Zaccagnini, G.; Fasanaro, P.; Pescatori, M.; Cardani, R.; Perbellini, R.; Isaia, E.; Sale, P.; et al. Common micro-RNA signature in skeletal muscle damage and regeneration induced by Duchenne muscular dystrophy and acute ischemia. FASEB J. 2009, 23, 3335–3346. [Google Scholar] [CrossRef] [Green Version]
  87. Huang, B.; Jiao, Y.; Zhu, Y.; Ning, Z.; Ye, Z.; Li, Q.X.; Hu, C.; Wang, C. Putative MicroRNA-mRNA Networks Upon Mdfi Overexpression in C2C12 Cell Differentiation and Muscle Fiber Type Transformation. Front. Mol. Biosci. 2021, 8, 675993. [Google Scholar] [CrossRef]
  88. Qaisar, R.; Karim, A.; Muhammad, T.; Shah, I.; Khan, J. Circulating MicroRNAs as Biomarkers of Accelerated Sarcopenia in Chronic Heart Failure. Glob. Heart 2021, 16, 56. [Google Scholar] [CrossRef]
  89. Yanai, K.; Kaneko, S.; Ishii, H.; Aomatsu, A.; Ito, K.; Hirai, K.; Ookawara, S.; Ishibashi, K.; Morishita, Y. MicroRNAs in Sarcopenia: A Systematic Review. Front. Med. 2020, 7, 180. [Google Scholar] [CrossRef]
  90. Sun, M.; Guo, M.; Ma, G.; Zhang, N.; Pan, F.; Fan, X.; Wang, R. MicroRNA-30c-5p protects against myocardial ischemia/reperfusion injury via regulation of Bach1/Nrf2. Toxicol. Appl. Pharmacol. 2021, 426, 115637. [Google Scholar] [CrossRef]
  91. Meng, S.; Hu, Y.; Zhu, J.; Feng, T.; Quan, X. miR-30c-5p acts as a therapeutic target for ameliorating myocardial ischemia-reperfusion injury. Am. J. Transl. Res. 2021, 13, 2198–2212. [Google Scholar] [PubMed]
Figure 1. Low and high doses of GGF2 alter intercostal skeletal muscle transcription. (a) Hierarchical clustering of 581 genes significantly differentially expressed between GGF2-treated and untreated post-MI swine. Columns represent individual samples for each group, and rows represent individual probes/genes. Red, blue, and gray represent the highest, lowest, and medial fluorescent signal values, respectively. (b) Venn diagram showing numbers of genes differentially expressed in post-MI swine treated with GGF2 at low (teal circle, 311 genes) and high doses (orange circle, 512 genes) compared to untreated control animals.
Biology 11 00682 g001
Figure 2. Dose-like response genes altered in GGF-2 treated pigs post-MI. Dot plots show relative counts as reads per kilobase per transcript, per million mapped reads (RPKM) for genes exhibiting fold-differences for GGF2 versus untreated pigs (y-axis). Individual samples are indicated on the x-axis and by color. Black represents untreated (Unt), teal represents low-dose (0.67 mg/kg/day), and high dose (2 mg/kg/day) is shown in orange.
Biology 11 00682 g002
Figure 3. Functional categorization of GGF2-altered genes. (a) Bar chart showing functions enriched in differentially expressed gene lists from GGF-2 treated versus untreated LV tissues, identified using Ingenuity Pathway Analysis software. Functions are listed on the y-axis, and the x-axis indicates the number of differentially expressed genes in each category. Teal and orange represent low and high doses of GGF2, respectively. Enrichment p-value is indicated on each bar. (b) Pie chart showing top gene ontology categories for GGF-2 altered genes manually grouped into three generalized associative categories: development (blue), metabolic (red), and stress response (green). Uncharacterized and poorly characterized transcripts were excluded.
Biology 11 00682 g003
Figure 4. Genes commonly altered in cardiac and intercostal skeletal muscle encode functionally associated proteins. A vector graphic network created using STRING network version 11.5 with K means clustering of proteins encoded by differentially expressed genes commonly altered in both skeletal muscle and cardiac tissues of GGF2-treated post-MI pigs is shown. Full gene names with functions are provided in Table 1, except for NRG1 (neuregulin 1) and its receptors (ERBB2-4). Bubbles represent individual proteins, and lines represent associations between proteins. Line thickness indicates edge confidence, low (0.150), medium (0.400), high (0.700) and highest (0.900). Line shape indicates the predicted mode of action. Each color represents an individual cluster.
Biology 11 00682 g004
Figure 5. GGF2 reversibly alters myopathic genes identified through meta-analysis of repository gene expression data. (a) Bar chart showing numbers of genes (x-axis) significantly altered in various myopathies (study details listed in Table 2) that were reversibly expressed in GGF2-treated post-MI pigs. Species indicated by an icon at end of bar. Color of bar indicates directionality in listed experimental conditions relative to respective controls. Abbreviations are T1DM = (Type I Diabetes Model), PCOS = polycystic ovary syndrome, MS, T2DM = Type II diabetes mellitus, MD2 = myotonic dystrophy type II, COPD = chronic obstructive pulmonary disease, ISCU = iron-sulfur cluster scaffold homolog myopathy, and TMD = tibial muscular dystrophy. (b) Line graphs comparing alterations in four genes after denervation in an animal model of cachexia (left panel, GSE52676) and the same genes reversibly altered in GGF2-treated pigs (right panel). Log2 fold difference (Experiment vs. Control) is shown on the y axis, and time (in days) or dose (in ng/mL) is labeled on the x-axis. Colored lines correspond to genes, as labeled. LRRN1 = Leucine Rich Repeat Neuronal 1, SPP2 = Secreted Phosphoprotein 2, DUSP26 = Dual Specificity Phosphatase 26, PHKA1 = Phosphorylase Kinase Regulatory Subunit Alpha 1.
Biology 11 00682 g005
Figure 6. NRG-1β treatment of cultured myoblasts enhances differentiation. (a) C2C12 cells were cultured in differentiation media (DMEM + 2% horse serum) for 5 days in the absence (control) or presence of 10 ng/mL of recombinant neuregulin-1β (NRG, 10 ng/mL) or with both NRG and 0.2 μM of the ErbB2 receptor inhibitor TAK164. (b) Western blots of lysates from C2C12 cells grown in differentiation media for 5 days in the absence (control, CTR) or presence of recombinant NRG-1β (NRG) or fibroblast growth factor (FGF). Full blots provided as Supplementary Figures S8–S14. Bar graphs, grouped by day, show results of quantification by densitometry for the indicated proteins (n = 2, n = 3 for p-FAK). Bar colors indicate treatment type: CTRL = white, NRG-1β = black, and FGF = gray. Asterisks indicate statistical significance, * p value < 0.05), ** p value < 0.005), *** p < 0.0005).
Biology 11 00682 g006
Figure 7. Depiction of inferred relationships of altered genes in GGF2-treated post-MI pigs. Transcripts that were up-regulated (highlighted in red) or down-regulated (blue) in intercostal muscle of neuregulin-treated pigs are italicized. Proteins identified as altered or activated based on Western blot analyses are also indicated. Bold indicates protein level inference based on functional analyses as described in the text. Known effects of neuregulin (NRG) on cell transitions based on published in vitro studies are indicated in red boxes with arrows (for promoting) or in blue (for inhibiting). Transcript abbreviations are official gene (italic) or protein symbols, and p- indicates phosphorylation (determined by Western blotting of lysates from NRG-treated myoblasts). MSC = mesenchymal stem cell; mir-29 = microRNA 29. Commissioned illustrations by Andrew Celso Gutierrez.
Biology 11 00682 g007
Table 1. Genes differentially expressed in cardiac and skeletal muscle of GGF2-treated post-MI pigs.
GeneNameSMLVFunction
NR4A3Nuclear Receptor Subfamily 4 Group A Member 310.412.8β-adrenergic inducible, Regulates transcription of fatty acid and muscle mass genes [20,21]
FOSFos Proto-Oncogene, AP-1 Transcription Factor Subunit4.95.0Activate phospholipid synthesis, Regulators of cell proliferation, muscle cell differentiation, and Transformation [22,23,24]
RNDRho Family GTPase3.62.6Regulate the organization of the actin cytoskeleton in response to extracellular growth factors [54]
BTG2BTG Anti-Proliferation Factor 23.34.1Cell cycle regulation, cell proliferation in skeletal muscle [25]
PPP1R15AProtein Phosphatase 1 Regulatory Subunit 15A2.81.7Down-regulates the TGF-beta, growth arrest and DNA damage-inducible protein, promoting cell death [55]
IER5Immediate Early Response 52.64.3Cell regulation, proliferation, and resistance to thermal stress. Dephosphorylates HSF1, and ribosomal protein S6 [56]
PAAF1Proteasomal ATPase Associated Factor 12.41.5Associated with Heart Conduction Disease, regulation of association of proteasome components [26,57]
ATP1B4ATPase Na+/K+ Transporting Family Member Beta 42.01.5Transporting protein, Transcriptional coregulator during muscle development [27,28]
COL1A2Collagen Type 1 Alpha 2 Chain−1.8−2.7Fibrillar forming collagen, putative down-regulated c-Myc target gene, or upregulate let-7b in skin fibroblasts [58].
EFEMP1EGF Containing Fibulin Extracellular Matrix Protein 1−1.8−1.7Binds EGFR receptor, autophosphorylation and the activation of downstream signaling pathways, Negative regulator of chondrocyte differentiation [59].
LAMB1Laminin Subunit Beta 1−1.8−1.5Cell adhesion, Differentiation, Encoding laminin subunit beta-1, are associated with COB with variable muscular or ocular abnormalities, Expressed in skeletal muscle [29,30]
LUMLumican−2.0−1.9A collagen binding proteoglycan with increased expression in hearts, Regulate tissue repair, collagen fibril organization [31,32]
THY1Thy-1 Cell Surface Antigen −2.0−2.6Cell surface glycoprotein and A pathogenic CF fraction in cardiac fibrosis [33,34]
ECM1Extracellular Matrix Protein 1−2.1−2.2Response to elevated platelet cytosolic Ca2+ and ERK Signaling, Upregulated in cardiac aging and myocardial infarction [35,36]
FAPFibroblast Activation Protein Alpha−2.2−1.8Expressed in stromal fibroblasts of epithelial cancers, tissue remodeling, healing wounds, Correlate coronary heart disease [37,38,39]
DPTDermatopontin−2.3−2.1Extracellular matrix proteins involved in cell-matrix interaction, Postulated to modify the behavior of TGF-beta [40]
FBN1Fibrillin 1−2.3−2.6Calcium ion binding and extracellular matrix structural constituent, Differential regulation in smooth muscle cells [41,42,43]
PRPS2Phosphoribosyl Pyrophosphate Synthetase 2−2.3−1.7Phosphoribosyl pyrophosphate synthetase, protein homodimerization activity, and carbohydrate catabolic process-related genes [60,61]
NID1Nidogen 1−2.4−1.8Basement membrane glycoproteins, Laminin interactions in the heart [44,45,46]
PLSCR4Phospholipid Scramblase 4−2.5−2.3Protein coding gene; upregulated in hypertrophic mouse hearts [47,62]
WNT5AWnt Family Member 5A−2.5−1.5Canonical and non-canonical wnt pathways, Regulating developmental pathways during embryogenesis
FSCN1Fascin Actin-Bundling Protein 1−2.5−1.5Organize F-actin; Involved in cell migration, motility, adhesion, and cellular interactions
COL4A1Collagen Type IV Alpha 1 Chain−2.6−1.6Alpha protein of Type IV collagen, components of basement membranes, Upregulated in the skeletal muscle response [48,49]
ACER3Alkaline Ceramidase 3−2.6−1.5Protein coding gene
COL5A2Nidogen 1−2.6−2.5Alpha chain for fibrillar collagen; cardiac repair and involved in Muscle-Invasive Bladder [48,50,51]
PRTFDC1Phosphoribosyl Transferase Domain Containing 1−2.7−2.3Protein Coding gene, protein homodimerization activity, and magnesium ion binding
CD55CD55 molecule (Cromer Blood Group)Reduced−2.2Glycoprotein; Regulates cell decay dysferlin is expressed in skeletal and cardiac muscles [52]
COL3A1Collagen Type III Alpha 1 Chain−2.8−1.9 Fibrillar collagen found in extensible connective tissues and the vascular system [53]
HBBHemoglobin Subunit Beta−3.0−5.9Oxygen transport from the lung, Endogenous inhibitor of enkephalin-degrading enzymes such as DPP3, and as a selective antagonist of the P2RX3 receptor which is involved in pain signaling [63]
HBAHemoglobin Subunit Alpha−3.6−5.9Iron ion binding and oxygen transport from the lung to the various peripheral tissue [64]
ARMCX2Armadillo Repeat Containing X-Linked 2−3.7−1.8Regulate the dynamics and distribution of mitochondria in neural cells; involved in tissue development and tumorigenesis [65]
Yellow highlighted rows indicate those with relevant muscle and/or heart functions. SM = skeletal (intercostal) muscle, LV = left ventricular (cardiac muscle).
Table 2. Gene Expression Omnibus (GEO) myopathy studies included in meta-analysis.
GEO Study IDDescriptionTissueSpecies
GSE1557 [66]Cardiac cachexia (n = 4)Left ventricleRat
GSE52676 [67] Starvation (n = 6)
Denervation (n = 9)
Type 1 Diabetes (n = 3)
SoleusMouse
GSE45331 [68]Myotonic dystrophy type 2 (n = 6)
Control (n = 4)
Vastus lat.Human
GSE48574 [69]ISCU (n = 3) vs. Control (n = 5)Vastus lat.Human
GSE38680 [70]Pompe (n = 9) vs. Control (n = 10)
Pompe (n = 11) vs. Control (n = 7)
Biceps
Quad
Human
GSE34111 [71]Cancer cachexia (n = 12) vs. Control (n = 6)QuadHuman
GSE42806 [72]Tibial muscular dystrophy (n = 7) vs. Healthy (n = 5)Extensor digitorum longusHuman
GSE25941 [73]Female: old (78 ± 1 years, n = 11) vs.
young (25 ± 1 years, n = 8)
Male: old (78 ± 1 years, n = 10) vs.
young (25 ± 1 years, n = 7)
Vastus lat.Human
GSE9103 [74]Old (n = 65.1 ±1.5, n = 10) vs.
young (22.7 ± 0.7, n = 10)
Vastus lat.Human
GSE5110 [75]48 h immobilization vs. control:
male subjects (n = 5)
Vastus lat.Human
GSE21496 [76]48 h suspension vs. control:
sedentary male subjects (n = 7)
Vastus lat.Human
GSE43760 [77]Metabolic syndrome (n = 6) vs.
healthy (n = 6)
Vastus lat.Human
GSE27536COPD low BMI (n = 6) vs. healthy (n = 12)
COPD normal BMI (n = 8) vs. healthy (n = 12)
Vastus lat.Human
GSE6798 [78]Obese + PCOS (n = 16) vs. Control (n = 13)Vastus lat.Human
GSE8157 [79]Obese + PCOS (n = 10) vs. Control (n = 13)Vastus lat.Human
GSE19420Type 2 diabetes (n = 10) vs.
normoglycemic subjects (n = 12)
Vastus lat.Human
GSE25462 [80]Type 2 diabetes (n = 10) vs. normoglycemic + no family history of diabetes (n = 15)
Type 2 diabetes (n = 10) vs. normoglycemic + family history of type 2 diabetes (n = 25)
QuadHuman
Table 3. Predicted upstream regulators for GGF2-altered Genes.
Upstream RegulatorGene
Expression
No. Downstream
Targets Altered
(p-Value)
Z Score
(Predicted State)
Transforming growth factor β1 (TGF-β1)-114 (1.6 × 10⁻²³)Z = −2.297 (Inhibited)
Platelet derived growth factor-BB (PDGF BB)-36 (3.7 × 10⁻²²)Z = 1.567
Angiotensinogen (AGT)−3.867 (8.5 × 10⁻²⁰)Z = −3.032 (Activated)
Fibroblast growth factor 2 (FGF2)-45 (4.8 × 10⁻²⁰)nd
CAMP Responsive Element Binding Protein 1 (CREB1)-46 (3.5 × 10⁻¹⁹)Z = 2.424 (Activated)
Erb-B2 Receptor Tyrosine Kinase 2 (ERBB2)-60 (5.7 × 10⁻¹⁹)nd
PPARG coactivator 1 α (PCG-1α)-37 (4.4 × 10⁻¹⁸)Z = 1.877
Aryl hydrocarbon receptor (AHR)-45 (4.5 × 10⁻¹⁷)Z = 3.63 (Activated)
Twist family BHLH transcription factor 1 (TWIST1)-23 (6.7 × 10⁻¹⁷)Z = −2.449 (Inhibited)
Epidermal growth factor (EGF)3.549 (5.3 × 10⁻¹⁶)nd
Cadherin associated protein α1 (α-catenin)-19 (3.0 × 10⁻¹⁵)Z = 3.118 (Activated)
Erb-B3 Receptor Tyrosine Kinase 3 (ERRB3)-18 (2.5 × 10⁻¹³)nd
Mothers against DPP homolog 7 (SMAD7)2.418 (3.3 × 10⁻¹²)Z = 3.11 (Activated)
CCAAT enhancer binding protein β (C/EBP-β)-37 (1.1 × 10⁻¹¹)Z = −2.091 (Inhibited)
AKT serine/threonine kinase 1 (AKT1)-26 (1.9 × 10⁻¹¹)Z = −1.855
Enalapril (Hypertension medication)-13 (9.3 × 10⁻¹¹)Z = 3.073 (Activated)
CCAAT enhancer binding protein α (C/EBP-α)−9.328 (2.5 × 10⁻¹¹)Z = −1.812
Brain-derived neurotrophic factor (BDNF) 30 (6.7 × 10⁻¹¹)nd
Transforming growth factor β3 (TGF-β3)-17 (7.6 × 10⁻¹¹)Z = −1.937
Myocilin (MYOC)−2.513 (1.7 × 10⁻¹⁰)nd
Myocyte enhancer factor 2C (MEF2C)-15 (3.7 × 10⁻¹⁰)Z = 2.912 (Activated)
Peroxisome proliferator activated receptor γ (PPAR-γ)−5.436 (8.6 × 10⁻¹⁰)Z = −1.987
Sterol regulatory element-binding transcription factor 1 (SREBF1)-20 (2.4 × 10⁻⁹)Z = −1.937
Erb-B3 Receptor Tyrosine Kinase 3 (ERRB4)-12 (3.4 × 10⁻⁸)Z = 2.388 (Activated)
Transforming growth factor β1 (TGF-β1)-15 (4.3 × 10⁻⁸)Z = −1.634
microRNA-29b-3p (miR-29b-3p) -13 (4.8 × 10⁻⁸)Z = 3.097 (Activated)
Thapsigargin (Calcium reuptake inhibitor)-20 (6.5 × 10⁻⁸)Z = 3.450 (Activated)
microRNA-335-3p (miR-335-3p)-8 (6.7 × 10⁻⁸)Z = 2.828 (Activated)
CCAAT enhancer binding protein δ (C/EBP-δ)-13 (1.3 × 10⁻⁷)Z = −1.813
Peroxisome proliferator activated receptor α (PPAR-α)-30 (2.5 × 10⁻⁷)Z = −1.363
Clopidogrel
(antiplatelet blood-thinning medication)
11 (4.6 × 10⁻⁷)Z = 3.302 (Activated)
microRNA lethal 7a-5p (Let-7a-5p)-17 (1.4 × 10⁻⁶)Z = 3.682 (Activated)
Myocardin (MYOCD)-9 (4.4 × 10⁻⁶)Z = 2.759 (Activated)
Cell death inducing DFFA like effector C (CIDEC)−9.46 (1.1 × 10⁻⁵)nd
Msh homeobox 1 (MSX1)−1.75 (1.8 × 10⁻⁵)Z = −1.982
microRNA-30c-5p (miR-30c-5p)-17 (2.1 × 10⁻⁵)Z = 3.117 (Activated)
sterol regulatory element binding transcription factor 2 (SREBF2)-9 (5.8 × 10⁻⁵)Z = −2.394 (Inhibited)
microRNA-21 (miR-21)-17 (3.3 × 10⁻⁵)Z = −2.668 (Inhibited)
Myogenic differentiation 1 (MYOD1)2.216 (3.7 × 10⁻⁵)nd
Wnt family member 5a (WNT5a)−2.510 (8.8 × 10⁻⁵)Z = −2.394 (Inhibited)
Peroxisome proliferator activated receptor δ (PPAR-δ)-15 (8.5 × 10⁻⁴)Z = −1.214
26s Proteosome (protein complex)-11 (5.5 × 10⁻⁴)Z = −2.035 (Inhibited)
Transcription factor 4 (TCF4)-18 (8.7 × 10⁻⁴)Z = −1.554
PPARG coactivator 1 β (PCG-1β)-5 (1.6 × 10⁻²)Z = −2.186 (Inhibited)
Publisher’s Note: MDPI stays neutral with regard to jurisdictional claims in published maps and institutional affiliations.

