
Optimizing Light Flash Sequence Duration to Shift Human Circadian Phase

Abstract
:Simple Summary
Abstract
1. Introduction
2. Materials and Methods
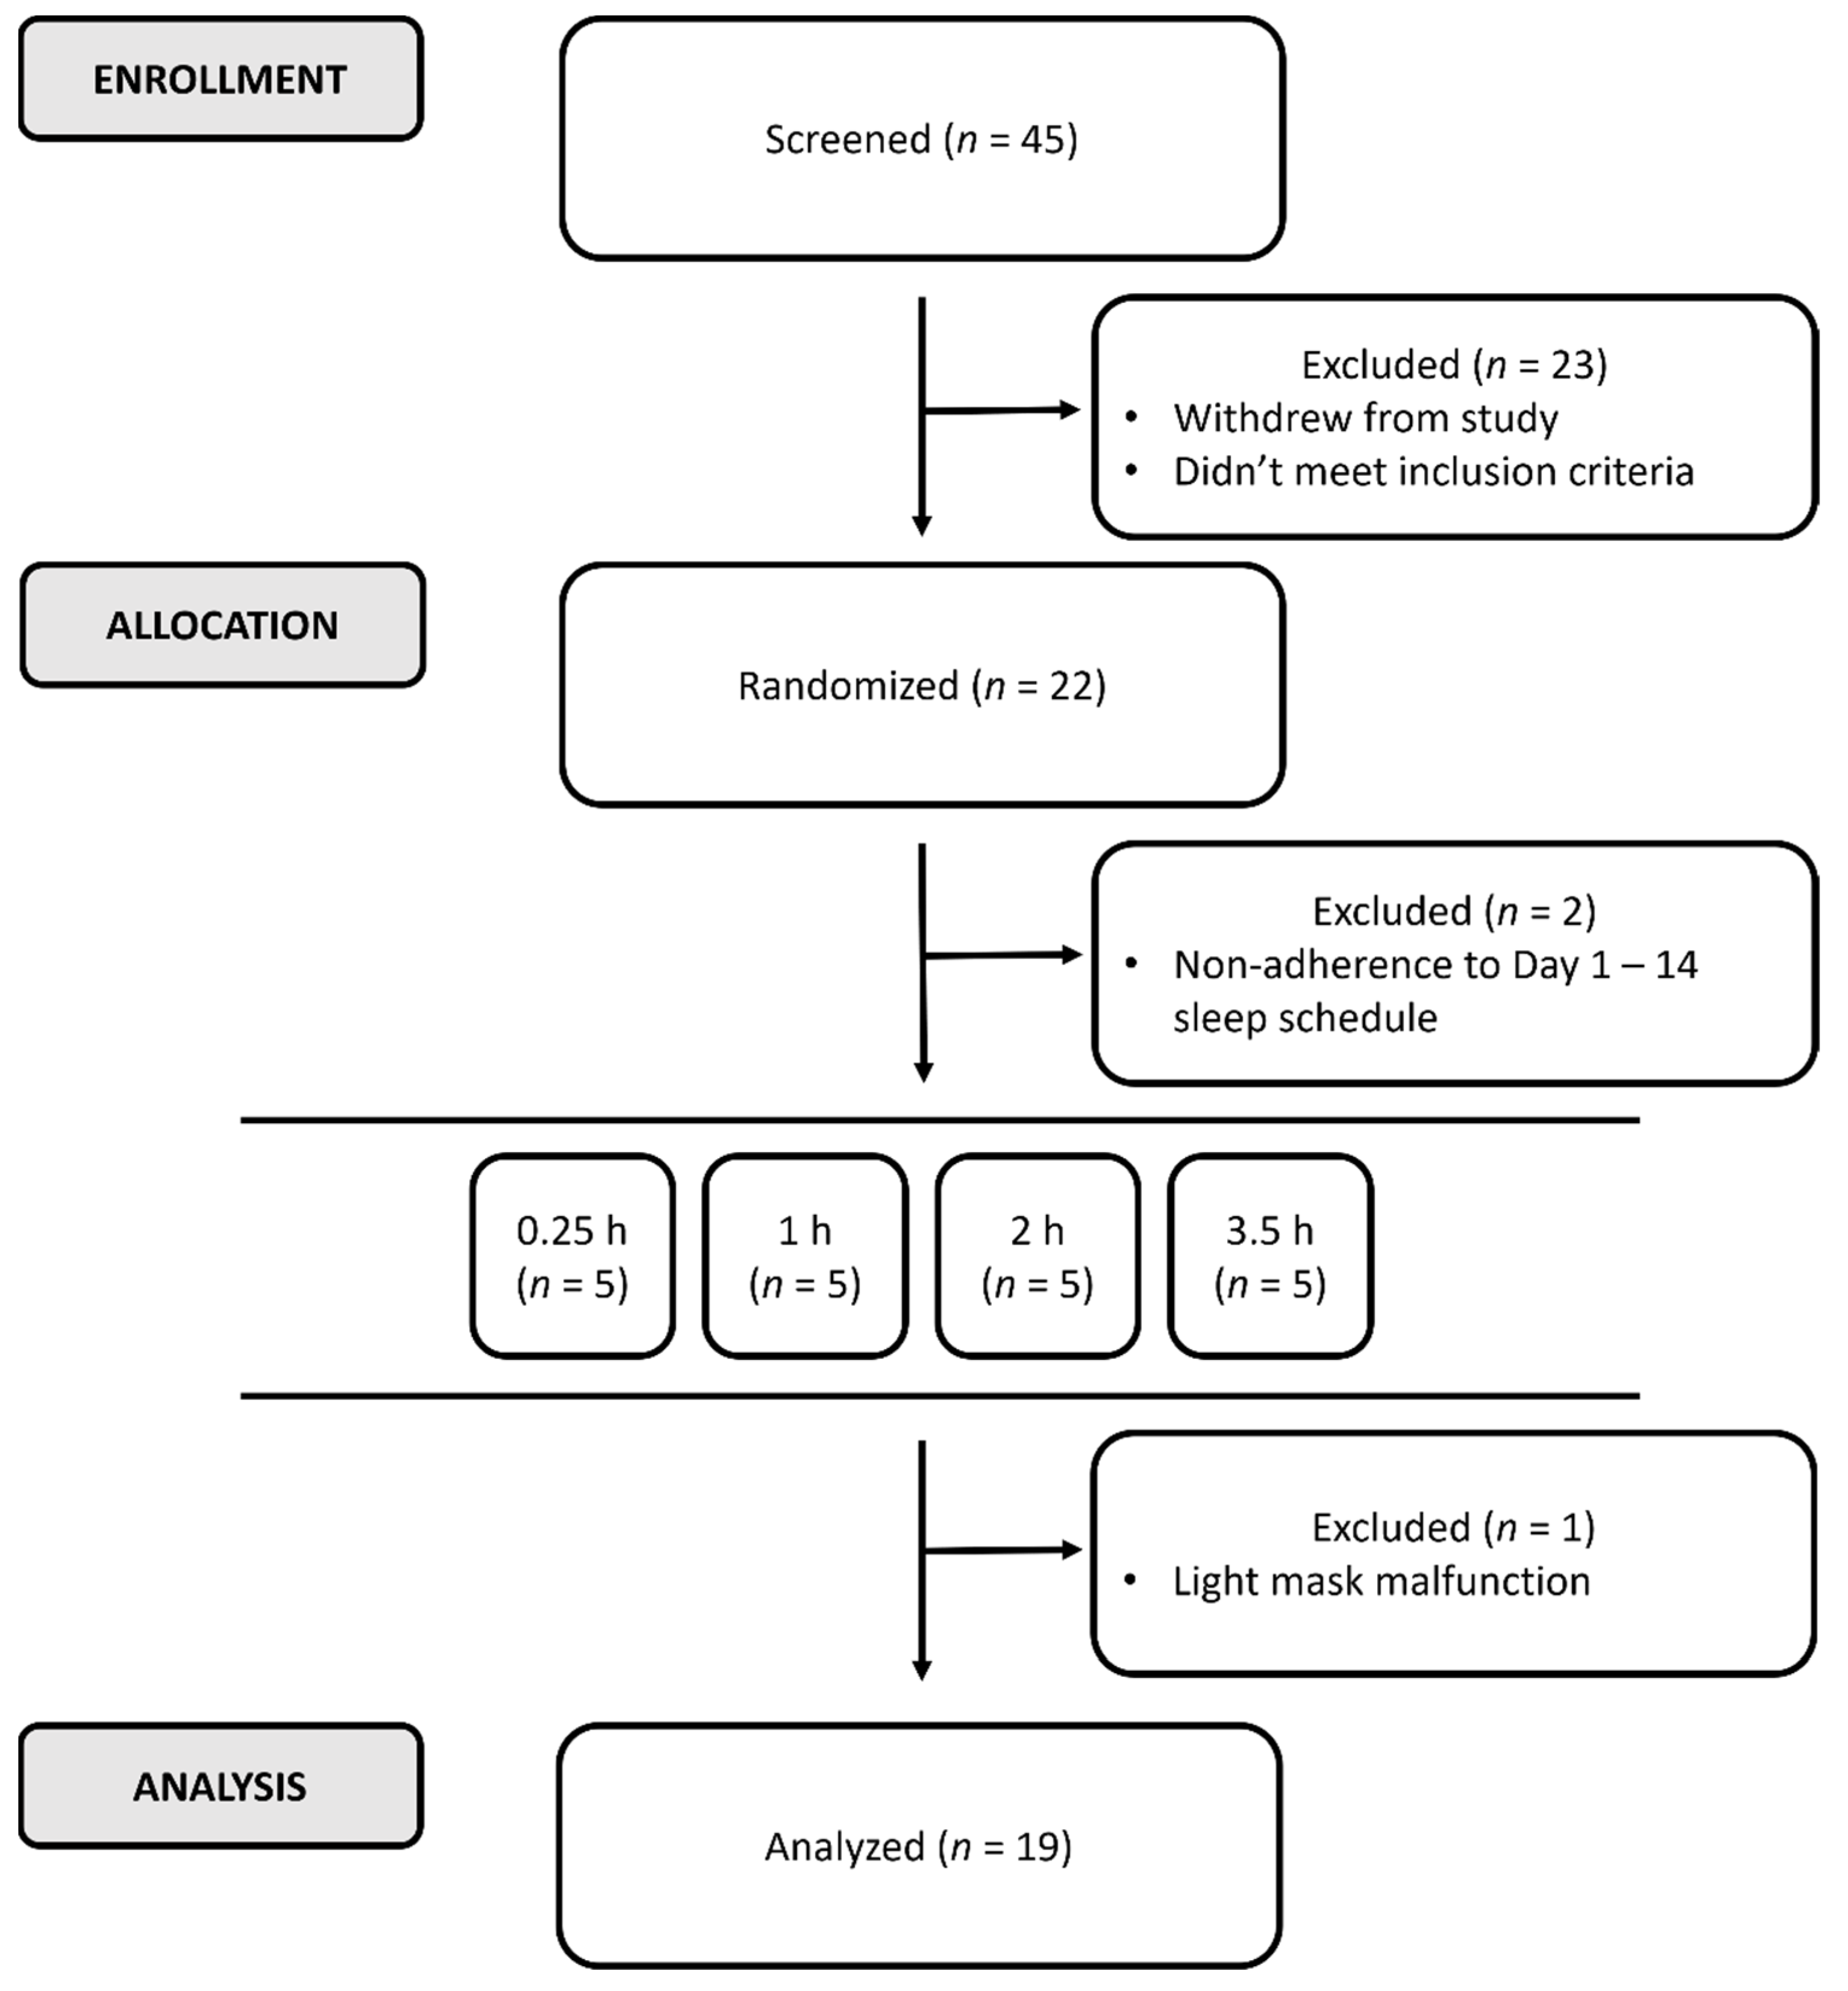
2.1. Participants
2.2. Procedures
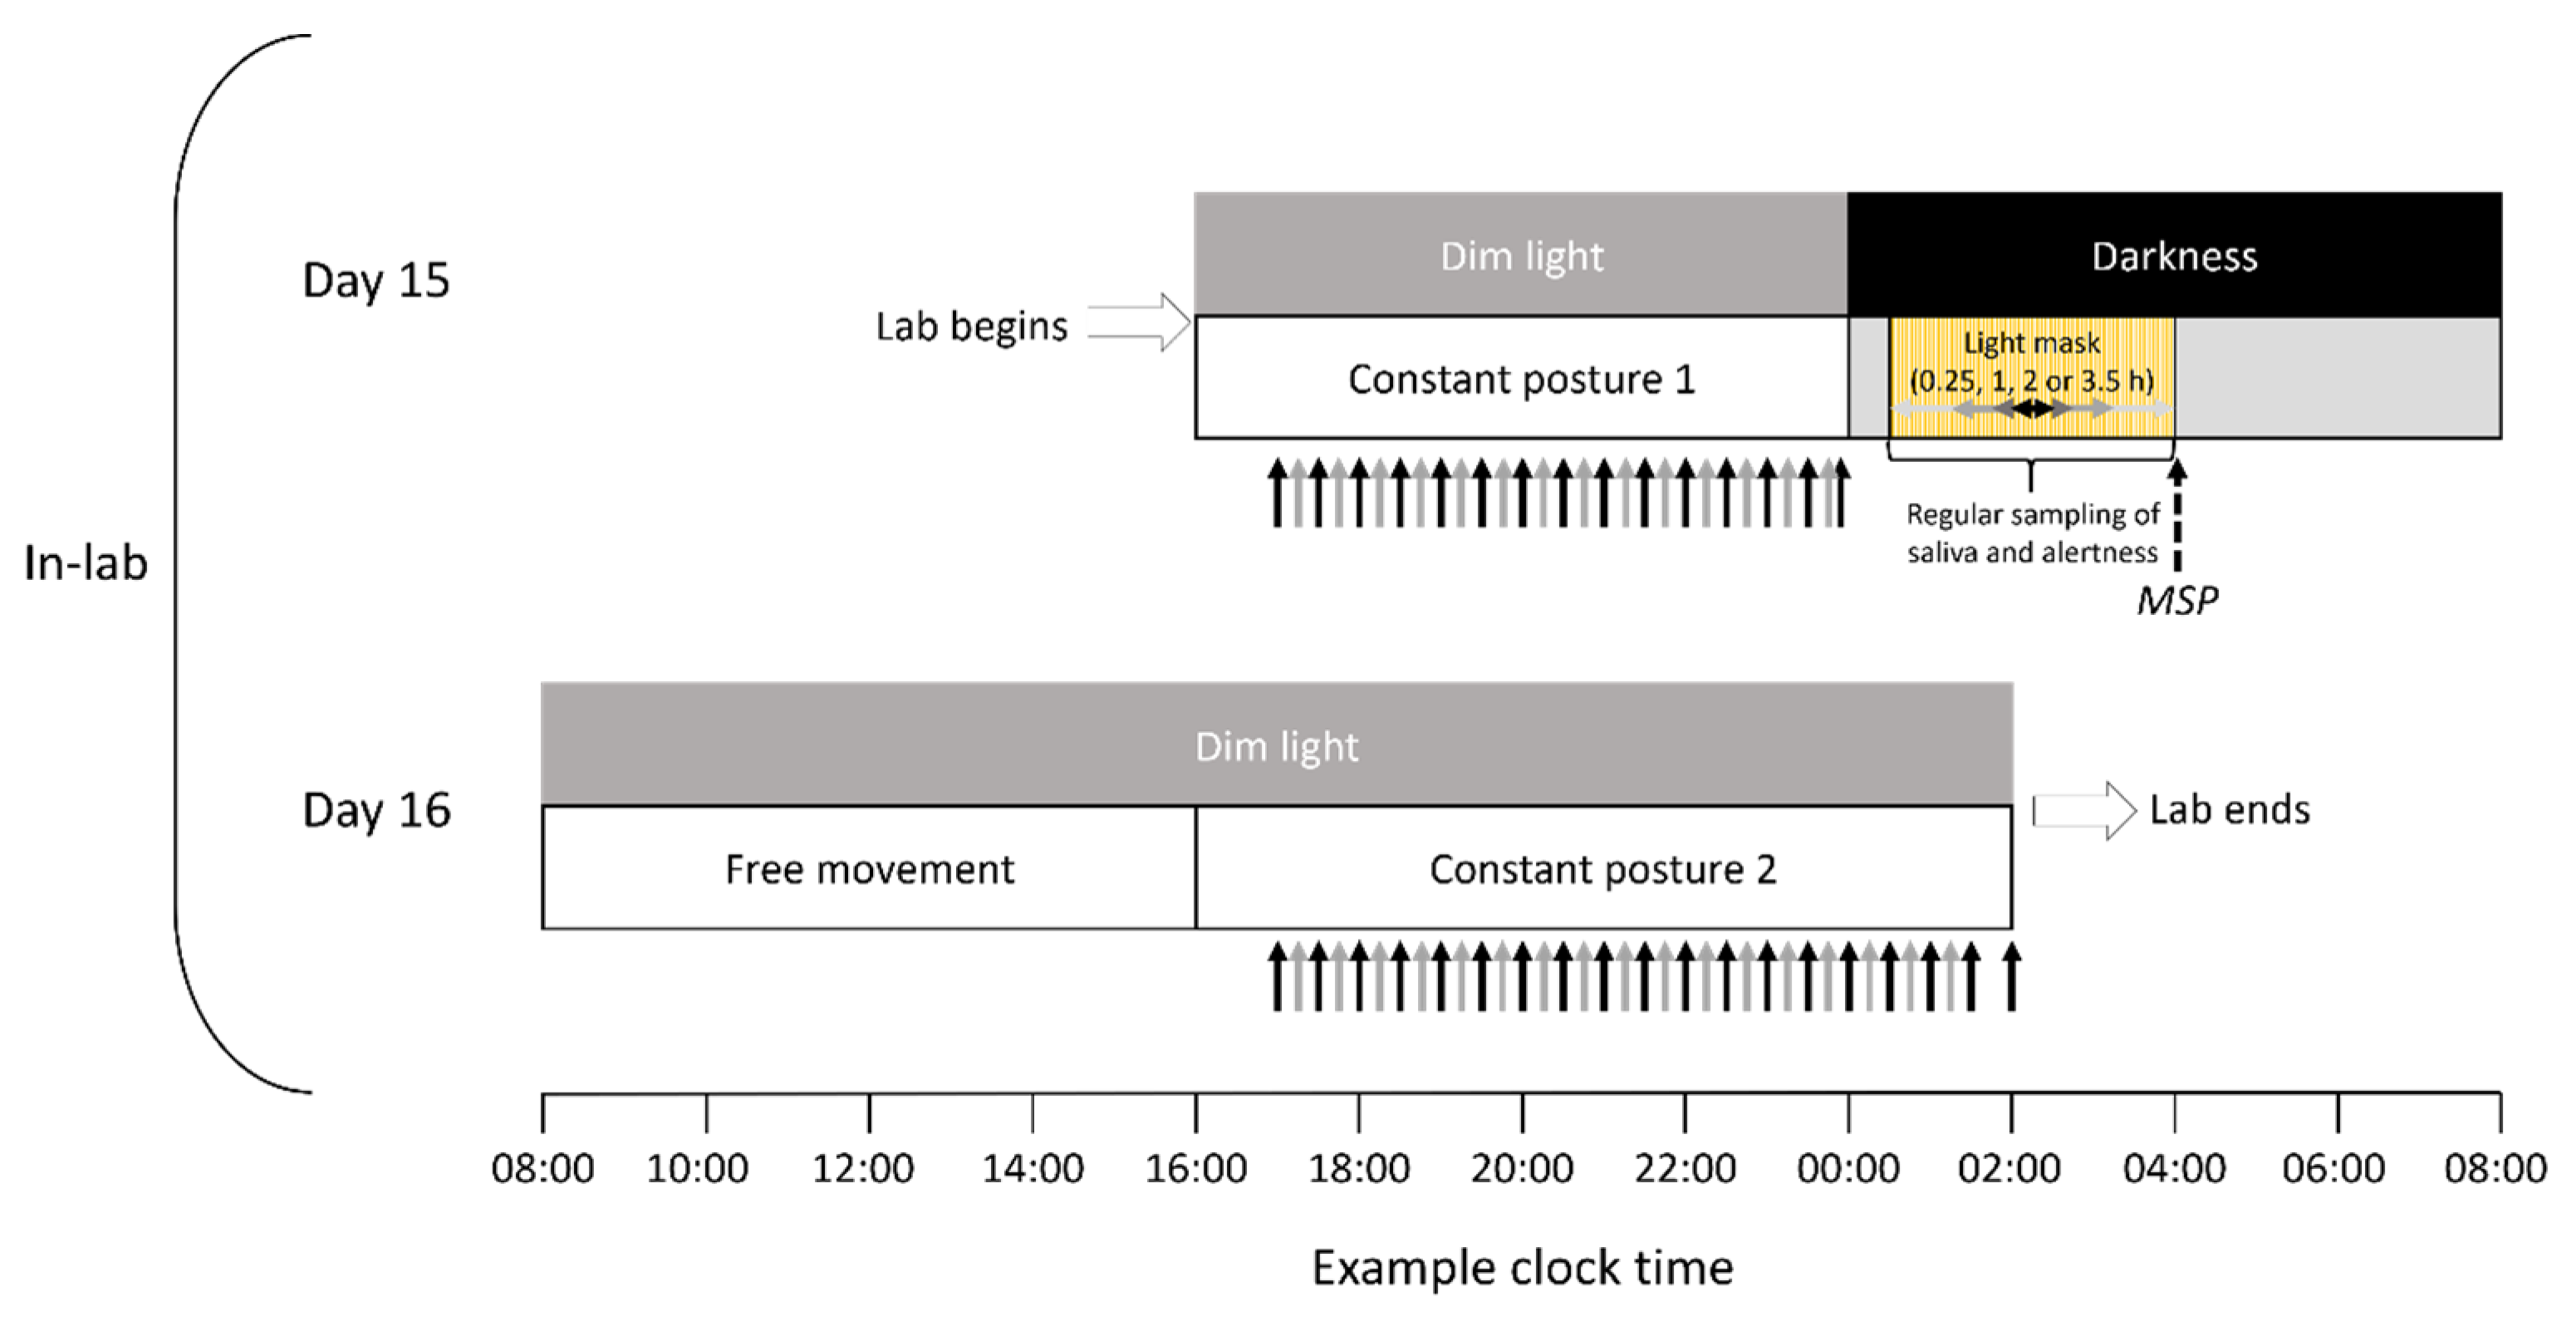
2.2.1. Protocol
2.2.2. Light Stimulation and Timing
2.2.3. Assessment of Melatonin
2.2.4. Assessment of Alertness and Sleepiness
2.2.5. Statistics
3. Results
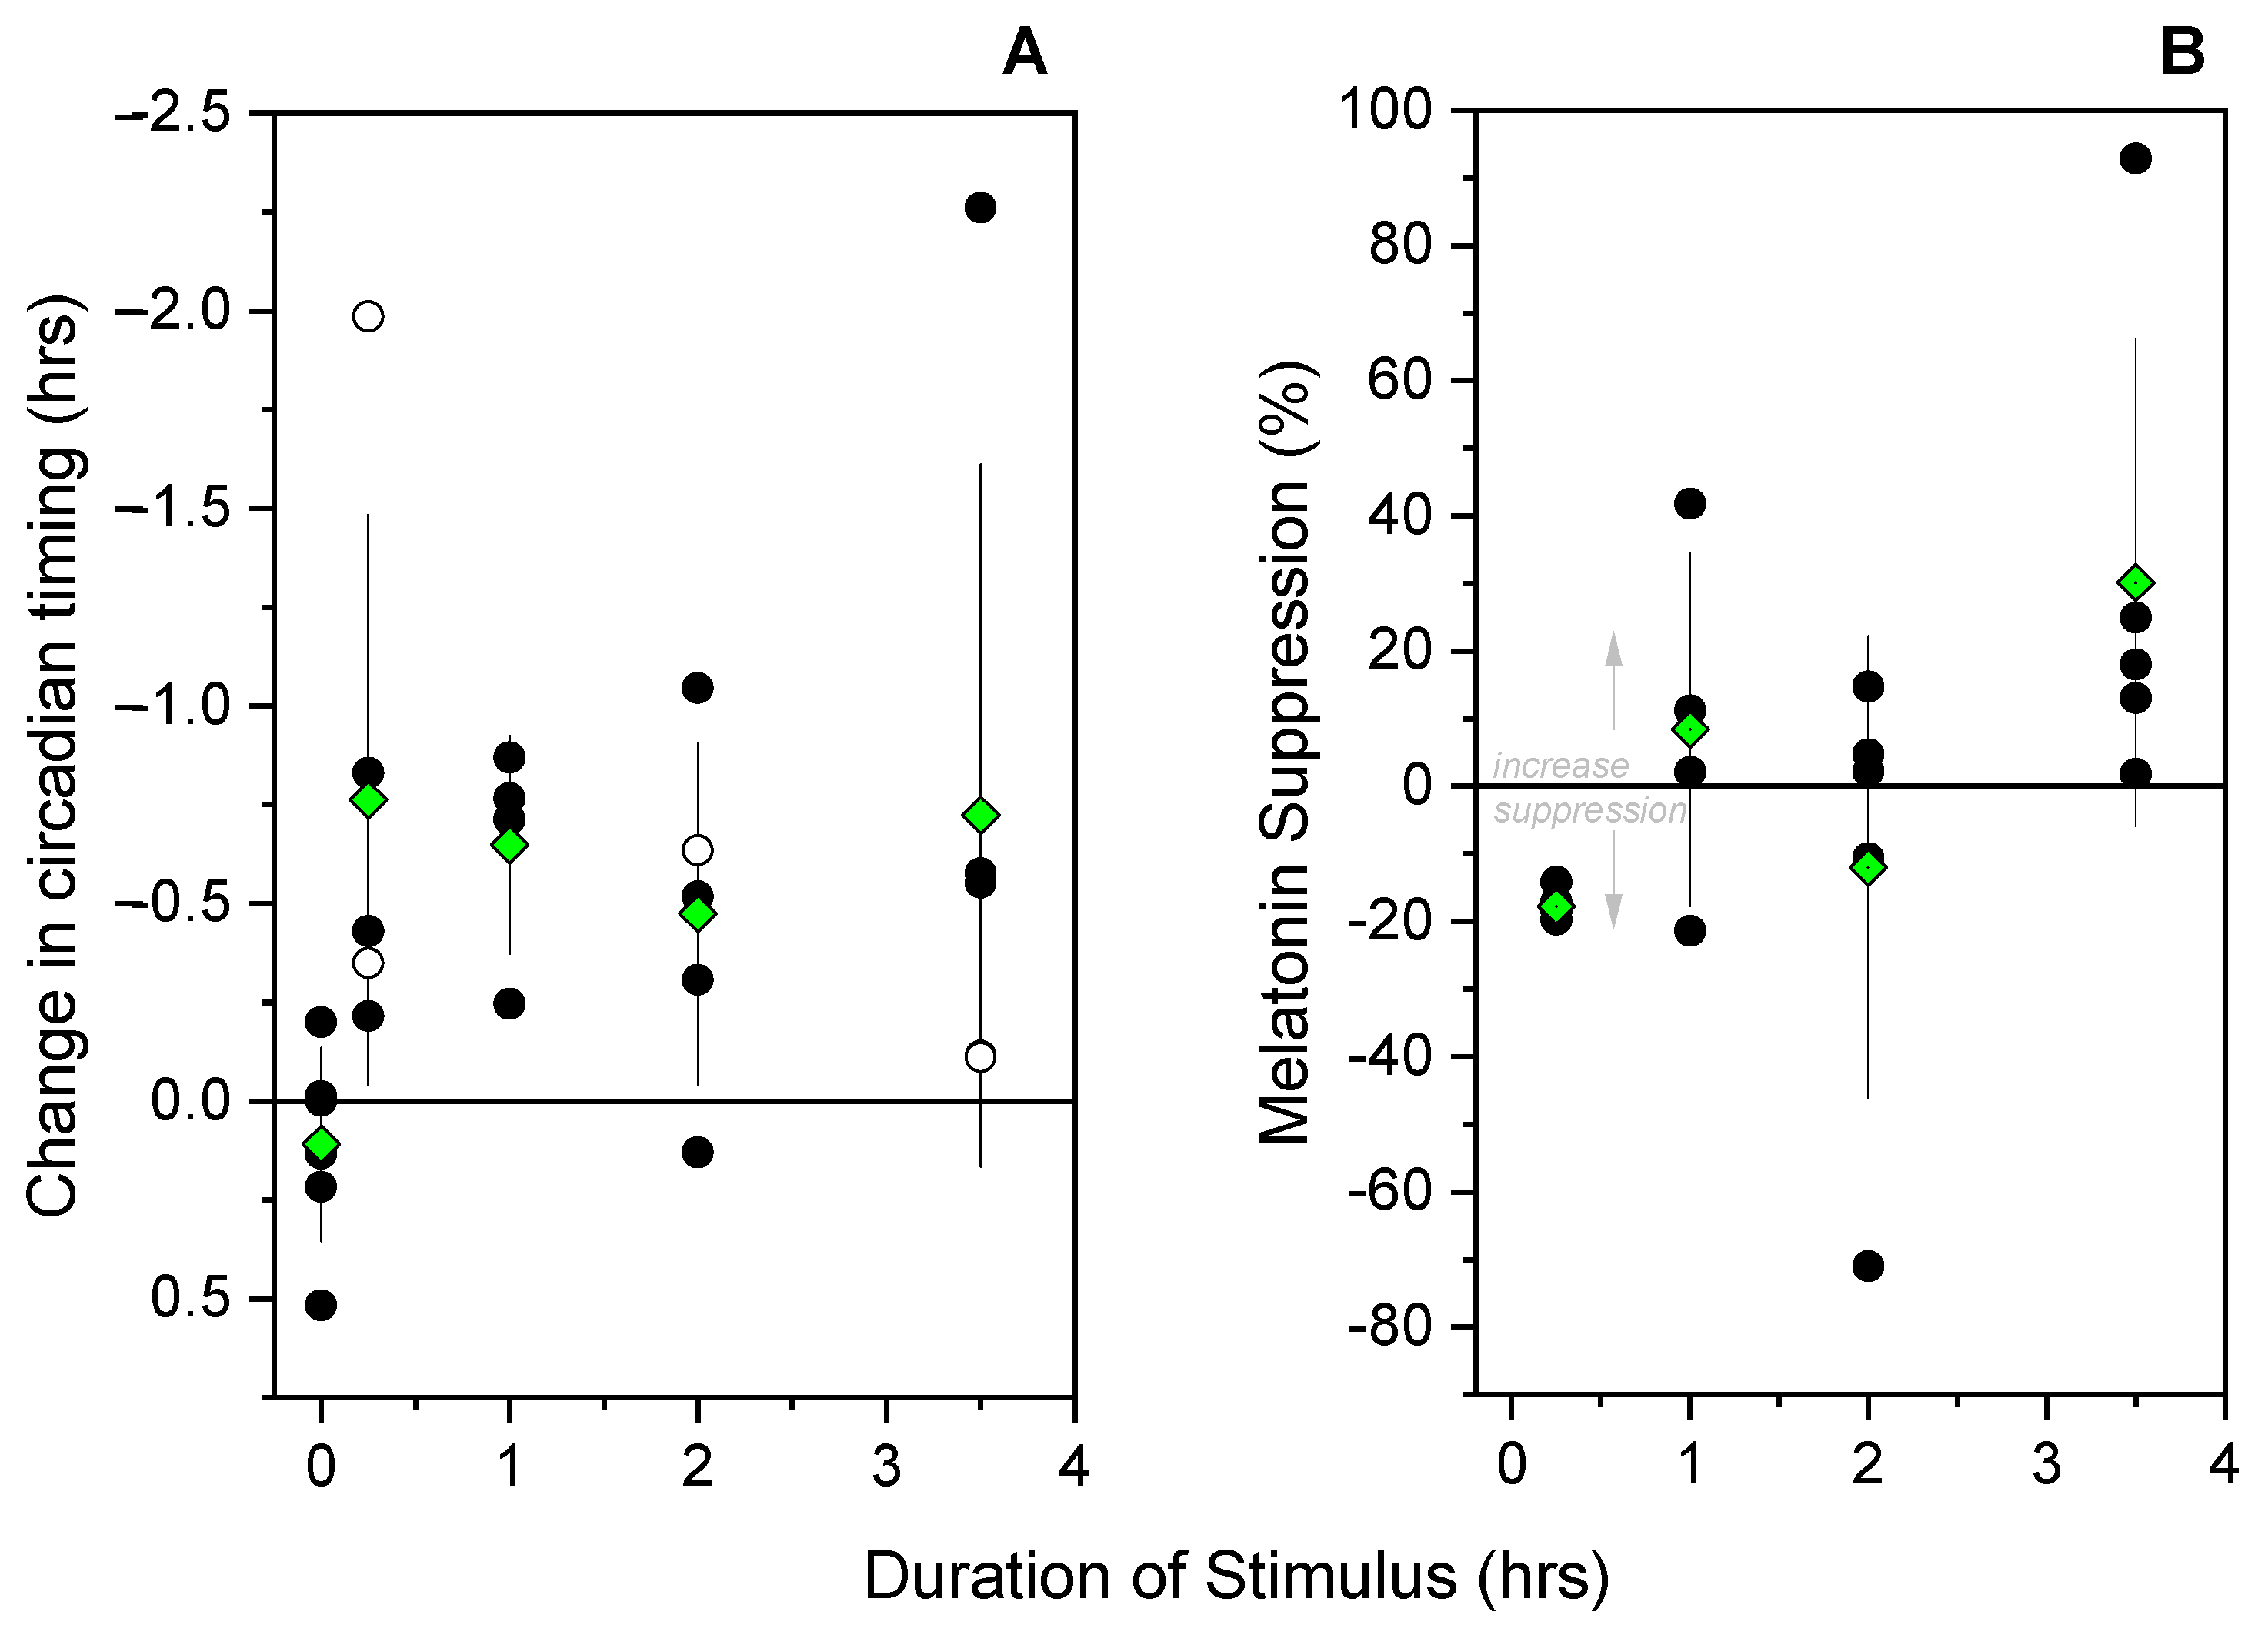
3.1. Melatonin Phase Shifts
3.2. Melatonin Suppression
3.3. Subjective Alertness
3.4. Objective Alertness
4. Discussion
5. Conclusions
Author Contributions
Funding
Institutional Review Board Statement
Informed Consent Statement
Data Availability Statement
Acknowledgments
Conflicts of Interest
References
- Gamlin, P.D.R.; McDougal, D.H.; Pokorny, J.; Smith, V.C.; Yau, K.W.; Dacey, D.M. Human and macaque pupil responses driven by melanopsin-containing retinal ganglion cells. Vision Res. 2007, 47, 946–954. [Google Scholar] [CrossRef] [PubMed] [Green Version]
- Allen, A.E.; Storchi, R.; Martial, F.P.; Petersen, R.S.; Montemurro, M.A.; Brown, T.M.; Lucas, R.J. Melanopsin-driven light adaptation in mouse vision. Curr. Biol. 2014, 24, 2481–2490. [Google Scholar] [CrossRef] [Green Version]
- Milosavljevic, N.; Storchi, R.; Eleftheriou, C.G.; Colins, A.; Petersen, R.S.; Lucas, R.J. Photoreceptive retinal ganglion cells control the information rate of the optic nerve. Proc. Natl. Acad. Sci. USA 2018, 115, E11817–E11826. [Google Scholar] [CrossRef] [Green Version]
- Joyce, D.S.; Feigl, B.; Cao, D.; Zele, A.J. Temporal characteristics of melanopsin inputs to the human pupil light reflex. Vision Res. 2015, 107, 58–66. [Google Scholar] [CrossRef]
- Joyce, D.S.; Feigl, B.; Zele, A.J. Melanopsin-mediated post-illumination pupil response in the peripheral retina. J. Vis. 2016, 16, 5. [Google Scholar] [CrossRef] [PubMed] [Green Version]
- Spitschan, M.; Lucas, R.J.; Brown, T.M. Chromatic clocks: Color opponency in non-image-forming visual function. Neurosci. Biobehav. Rev. 2017, 78, 24–33. [Google Scholar] [CrossRef] [PubMed] [Green Version]
- Berson, D.M.; Dunn, F.A.; Takao, M. Phototransduction by retinal ganglion cells that set the circadian clock. Science 2002, 295, 1070–1073. [Google Scholar] [CrossRef] [Green Version]
- Zeitzer, J.M.; Ruby, N.F.; Fisicaro, R.A.; Heller, H.C. Response of the human circadian system to millisecond flashes of light. PLoS ONE 2011, 6, e22078. [Google Scholar] [CrossRef] [PubMed] [Green Version]
- Zeitzer, J.M.; Dijk, D.-J.; Kronauer, R.E.; Brown, E.N.; Czeisler, C.A. Sensitivity of the human circadian pacemaker to nocturnal light: Melatonin phase resetting and suppression. J. Physiol. 2000, 526, 695–702. [Google Scholar] [CrossRef] [PubMed]
- Najjar, R.P.; Zeitzer, J.M. Temporal integration of light flashes by the human circadian system. J. Clin. Investig. 2016, 126, 938–947. [Google Scholar] [CrossRef] [Green Version]
- Chang, A.-M.; Santhi, N.; St Hilaire, M.; Gronfier, C.; Bradstreet, D.S.; Duffy, J.F.; Lockley, S.W.; Kronauer, R.E.; Czeisler, C.A. Human responses to bright light of different durations. J. Physiol. 2012, 590, 3103–3112. [Google Scholar] [CrossRef] [Green Version]
- Rahman, S.A.; Hilaire, M.A.S.; Chang, A.-M.; Santhi, N.; Duffy, J.F.; Kronauer, R.E.; Czeisler, C.A.; Lockley, S.W.; Klerman, E.B. Circadian phase resetting by a single short-duration light exposure. JCI Insight 2017, 2, e89494. [Google Scholar] [CrossRef] [PubMed] [Green Version]
- Buysse, D.J.; Reynolds III, C.F.; Monk, T.H.; Berman, S.R.; Kupfer, D.J. The Pittsburgh Sleep Quality Index: A new instrument for psychiatric practice and research. Psychiatry Res. 1989, 28, 193–213. [Google Scholar] [CrossRef] [PubMed]
- Babor, T.F.; de la Fuente, J.R.; Saunders, J.; Grant, M. The Alcohol Use Disorders Identification Test: Guidelines for Use in Primary Care; World Health Organization: Department of Mental Health and Substance Dependence: Geneva, Switzerland, 2001. [Google Scholar]
- Radloff, L.S. The CES-D Scale: A self-report depression scale for research in the general population. Appl. Psychol. Meas. 1977, 1, 385–401. [Google Scholar] [CrossRef]
- Adan, A.; Almirall, H. Horne & Östberg morningness-eveningness questionnaire: A reduced scale. Pers. Individ. Dif. 1991, 12, 241–253. [Google Scholar] [CrossRef]
- Ishihara, S. Ishihara’s Tests for Colour Deficiency; Kanehara Trading Inc.: Tokyo, Japan, 2007. [Google Scholar]
- Moher, D.; Schulz, K.F.; Altman, D. The CONSORT statement: Revised recommendations for improving the quality of reports of parallel-group randomized trials. JAMA 2001, 285, 1987–1991. [Google Scholar] [CrossRef]
- Carney, C.E.; Buysse, D.J.; Ancoli-Israel, S.; Edinger, J.D.; Krystal, A.D.; Lichstein, K.L.; Morin, C.M. The Consensus Sleep Diary: Standardizing prospective sleep self-monitoring. Sleep 2012, 35, 287–302. [Google Scholar] [CrossRef] [PubMed] [Green Version]
- Duffy, J.F.; Dijk, D.-J. Getting through to circadian oscillators: Why use constant routines? J. Biol. Rhythms 2002, 17, 4–13. [Google Scholar] [CrossRef]
- Mifflin, M.D.; St Jeor, S.T.; Hill, L.A.; Scott, B.J.; Daugherty, S.A.; Koh, Y.O. A new predictive equation for resting energy expenditure in healthy individuals. Am. J. Clin. Nutr. 1990, 51, 241–247. [Google Scholar] [CrossRef] [Green Version]
- Joyce, D.S.; Spitschan, M.; Zeitzer, J.M. Duration invariance and intensity dependence of the human circadian system phase shifting response to brief light flashes. Proc. Biol. Sci. 2022, 289, 20211943. [Google Scholar] [CrossRef]
- St Hilaire, M.A.; Gooley, J.J.; Khalsa, S.B.S.; Kronauer, R.E.; Czeisler, C.A.; Lockley, S.W. Human phase response curve to a 1 h pulse of bright white light. J. Physiol. 2012, 590, 3035–3045. [Google Scholar] [CrossRef] [PubMed]
- Voultsios, A.; Kennaway, D.J.; Dawson, D. Salivary Melatonin as a Circadian Phase Marker: Validation and Comparison to Plasma Melatonin. J. Biol. Rhythms 1997, 12, 457–466. [Google Scholar] [CrossRef] [PubMed]
- Hoddes, E.; Zarcone, V.; Smythe, H.; Phillips, R.; Dement, W.C. Quantification of sleepiness: A new approach. Psychophysiology 1973, 10, 431–437. [Google Scholar] [CrossRef]
- Dinges, D.F.; Powell, J.W. Microcomputer analyses of performance on a portable, simple visual RT task during sustained operations. Behav. Res. Methods Instrum. Comput. 1985, 17, 652–655. [Google Scholar] [CrossRef]
- Gabel, V.; Kass, M.; Joyce, D.S.; Spitschan, M.; Zeitzer, J.M. Auditory psychomotor vigilance testing in older and young adults: A revised threshold setting procedure. Sleep Breath. 2019, 23, 1021–1025. [Google Scholar] [CrossRef] [PubMed]
- Basner, M.; Mollicone, D.; Dinges, D.F. Validity and sensitivity of a brief psychomotor vigilance test (PVT-B) to total and partial sleep deprivation. Acta Astronaut. 2011, 69, 949–959. [Google Scholar] [CrossRef] [PubMed] [Green Version]
- Dacey, D.M.; Liao, H.-W.; Peterson, B.B.; Robinson, F.R.; Smith, V.C.; Pokorny, J.; Yau, K.-W.; Gamlin, P.D. Melanopsin-expressing ganglion cells in primate retina signal colour and irradiance and project to the LGN. Nature 2005, 433, 749–754. [Google Scholar] [CrossRef] [PubMed]
- Wong, K.Y.; Fernandez, F.-X. Circadian responses to light-flash exposure: Conceptualization and new data guiding future directions. Front. Neurol. 2021, 12, 627550. [Google Scholar] [CrossRef]
- Gooley, J.J.; Rajaratnam, S.M.; Brainard, G.C.; Kronauer, R.E.; Czeisler, C.A.; Lockley, S.W. Spectral responses of the human circadian system depend on the irradiance and duration of exposure to light. Sci. Transl. Med. 2010, 2, 31ra33. [Google Scholar] [CrossRef] [PubMed] [Green Version]
- Ruby, N.F.; Brennan, T.J.; Xie, X.; Cao, V.; Franken, P.; Heller, H.C.; O’Hara, B.F. Role of melanopsin in circadian responses to light. Science 2002, 298, 2211–2213. [Google Scholar] [CrossRef]
- Brown, T.M. Melanopic illuminance defines the magnitude of human circadian light responses under a wide range of conditions. J. Pineal Res. 2020, 69, e12655. [Google Scholar] [CrossRef] [PubMed] [Green Version]
- Kaladchibachi, S.; Negelspach, D.C.; Zeitzer, J.M.; Fernandez, F. Optimization of circadian responses with shorter and shorter millisecond flashes. Biol. Lett. 2019, 15, 20190371. [Google Scholar] [CrossRef] [PubMed] [Green Version]
- Muindi, F.; Colas, D.; Ikeme, J.; Ruby, N.F.; Heller, H.C. Loss of Melanopsin Photoreception and Antagonism of the Histamine H3 Receptor by Ciproxifan Inhibit Light-Induced Sleep in Mice. PLoS ONE 2015, 10, e0128175. [Google Scholar] [CrossRef] [PubMed] [Green Version]
- Lucas, R.J.; Peirson, S.N.; Berson, D.M.; Brown, T.M.; Cooper, H.M.; Czeisler, C.A.; Figueiro, M.G.; Gamlin, P.D.; Lockley, S.W.; O’Hagan, J.B.; et al. Measuring and using light in the melanopsin age. Trends Neurosci. 2014, 37, 1–9. [Google Scholar] [CrossRef] [PubMed]


| % Lapses | Median Reaction Time | Fastest 10% | ||||
|---|---|---|---|---|---|---|
| Pre | Post | Pre | Post | Pre | Post | |
| 15-min | 2.56 ± 2.46% | 1.04 ± 1.48% | 440 ± 127 ms | 386 ± 75.7 ms | 315 ± 52.8 ms | 289 ± 53.2 ms |
| 1-h | 5.28 ± 4.20% | 2.40 ± 2.91% | 351 ± 30.7 ms | 343 ± 13.2 ms | 265 ± 15.7 ms | 266 ± 17.8 ms |
| 2-h | 2.27 ± 1.68% | 2.93 ± 2.23% | 336 ± 61.8 ms | 333 ± 95.4 ms | 265 ± 41.3 ms | 262 ± 65.8 ms |
| 3.5-h | 0.541 ± 1.21% | 2.09 ± 2.22% | 504 ± 213 ms | 420 ± 13.6 ms | 373 ± 145 ms | 321 ± 32.5 ms |
Publisher’s Note: MDPI stays neutral with regard to jurisdictional claims in published maps and institutional affiliations. |
© 2022 by the authors. Licensee MDPI, Basel, Switzerland. This article is an open access article distributed under the terms and conditions of the Creative Commons Attribution (CC BY) license (https://creativecommons.org/licenses/by/4.0/).
Share and Cite
Joyce, D.S.; Spitschan, M.; Zeitzer, J.M. Optimizing Light Flash Sequence Duration to Shift Human Circadian Phase. Biology 2022, 11, 1807. https://doi.org/10.3390/biology11121807
Joyce DS, Spitschan M, Zeitzer JM. Optimizing Light Flash Sequence Duration to Shift Human Circadian Phase. Biology. 2022; 11(12):1807. https://doi.org/10.3390/biology11121807
Chicago/Turabian StyleJoyce, Daniel S., Manuel Spitschan, and Jamie M. Zeitzer. 2022. "Optimizing Light Flash Sequence Duration to Shift Human Circadian Phase" Biology 11, no. 12: 1807. https://doi.org/10.3390/biology11121807