
The Relative Abundance and Occurrence of Sharks off Ocean Beaches of New South Wales, Australia


Abstract
:Simple Summary
Abstract
1. Introduction
2. Materials and Methods
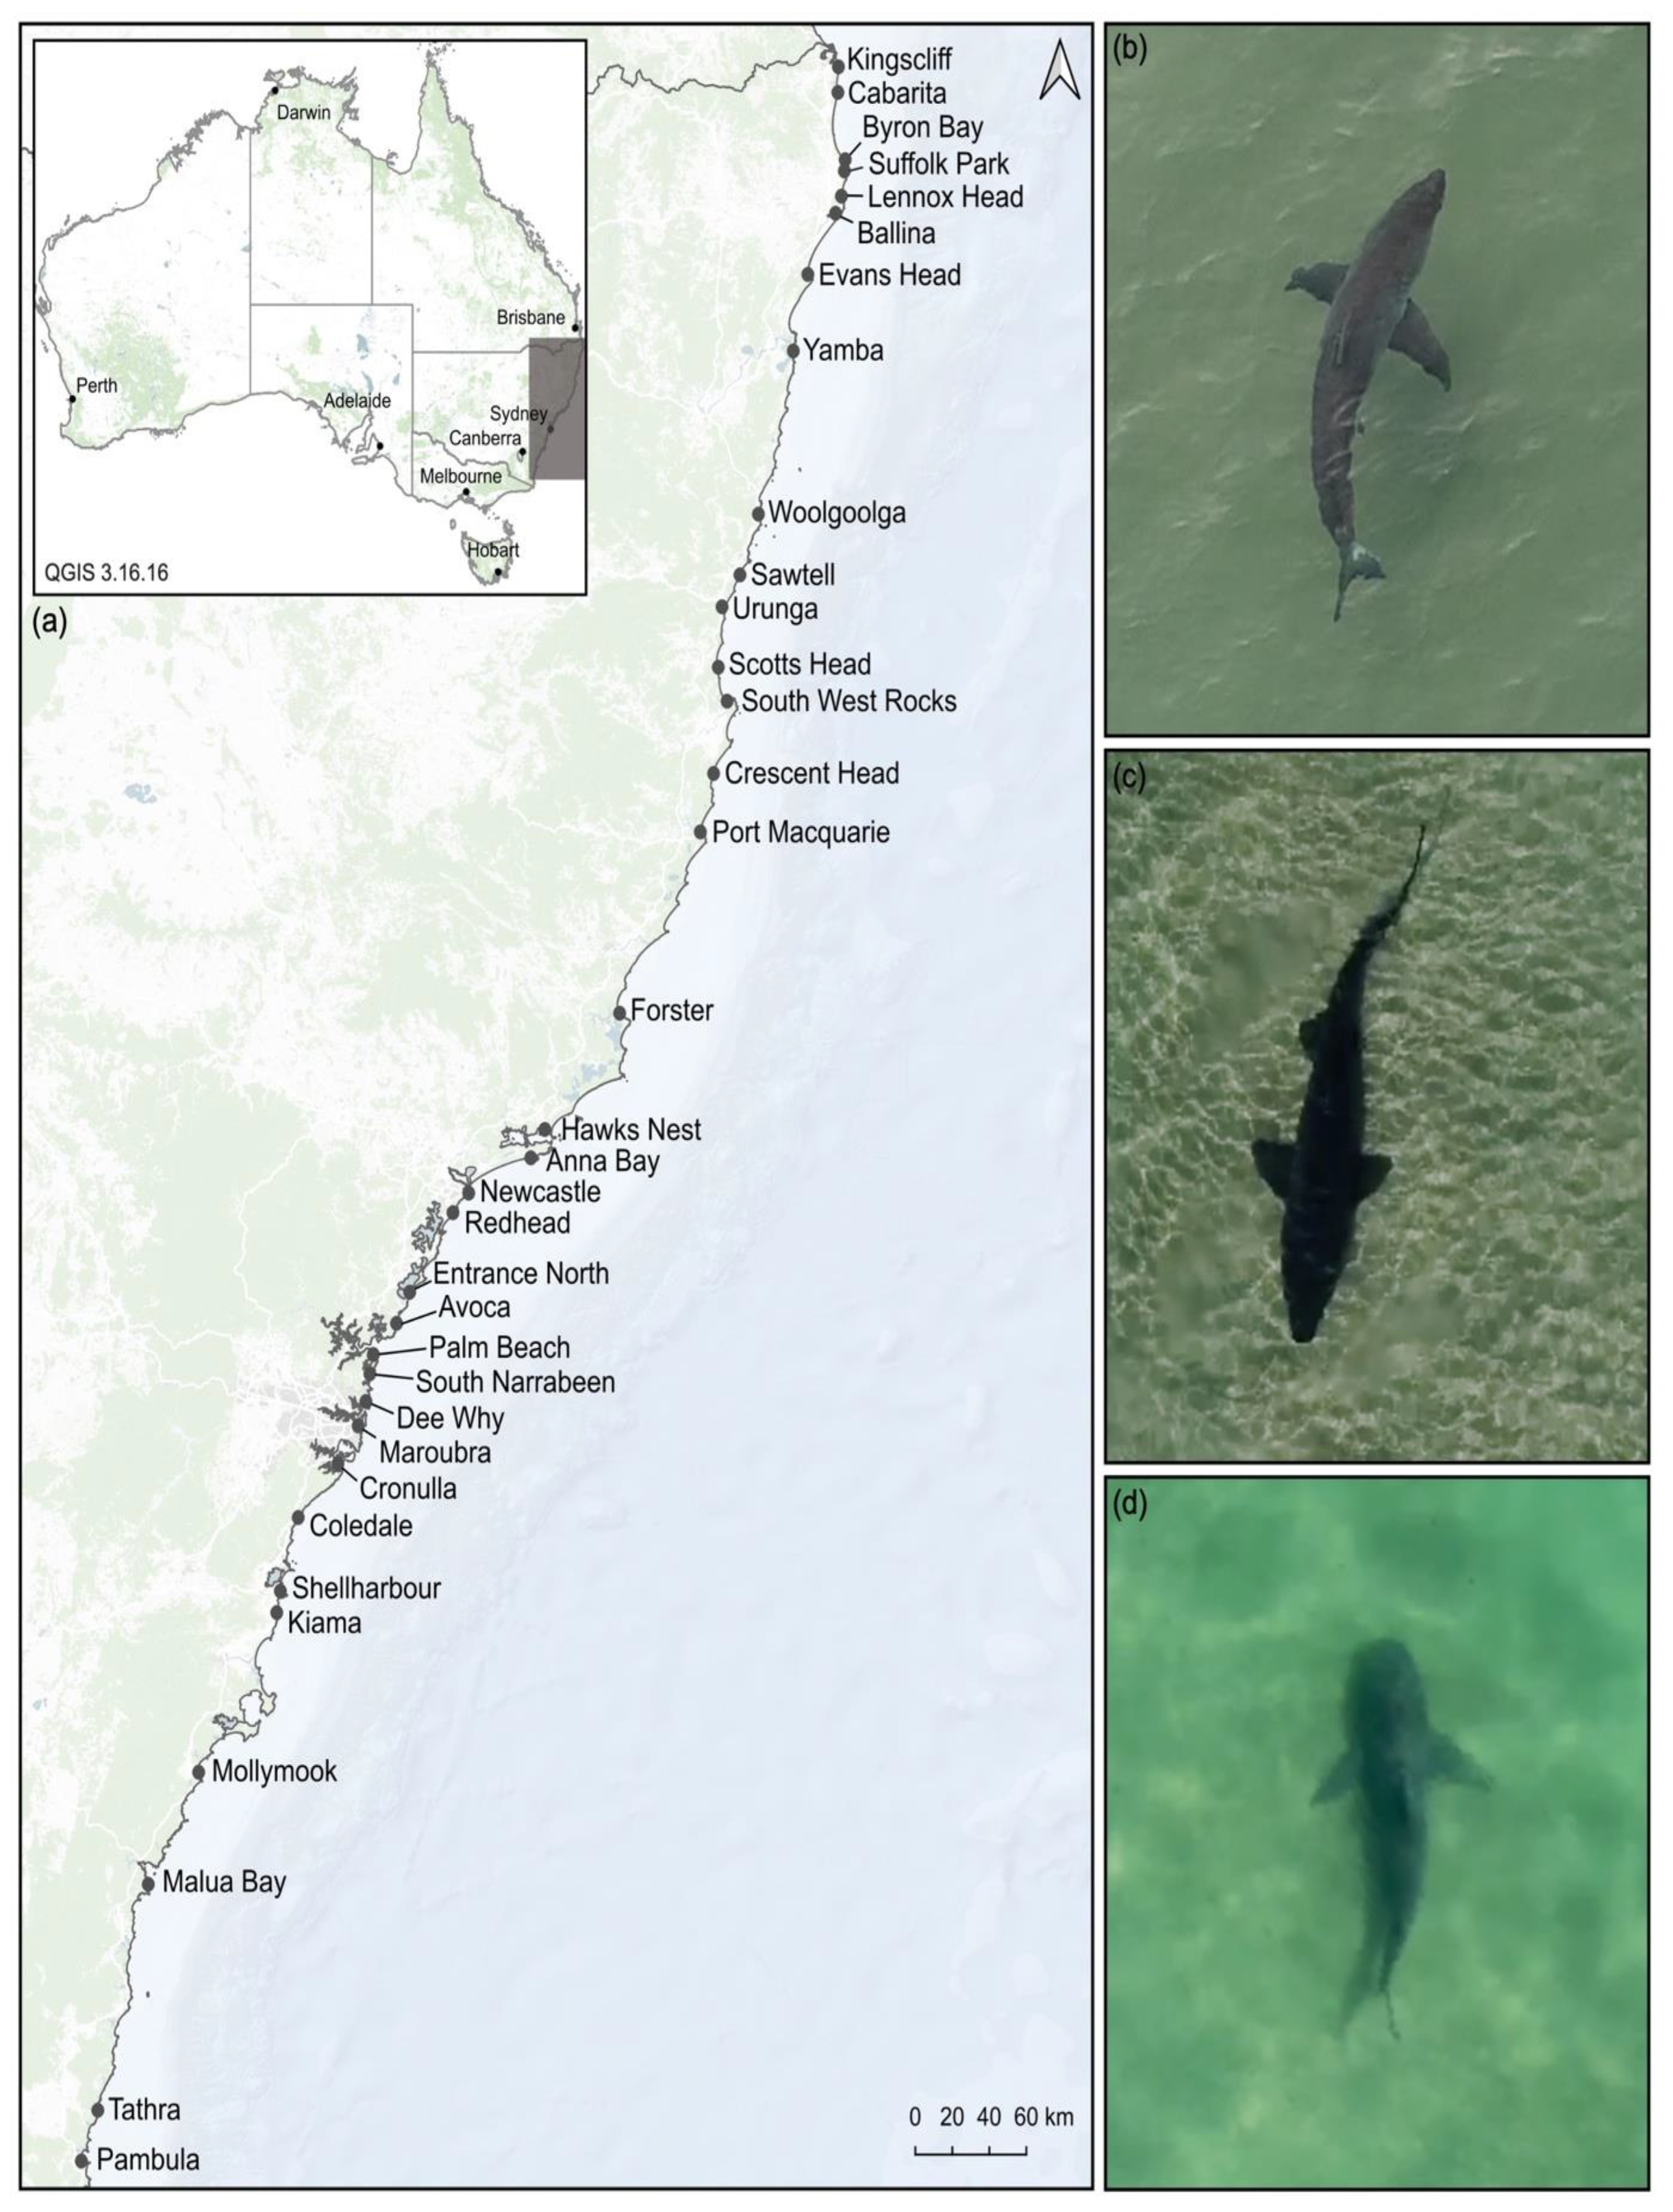
2.1. Study Locations
2.2. Survey Methods
2.3. Video Analysis of Drone Footage
2.4. Environmental Factors
2.5. Statistical Analyses
3. Results
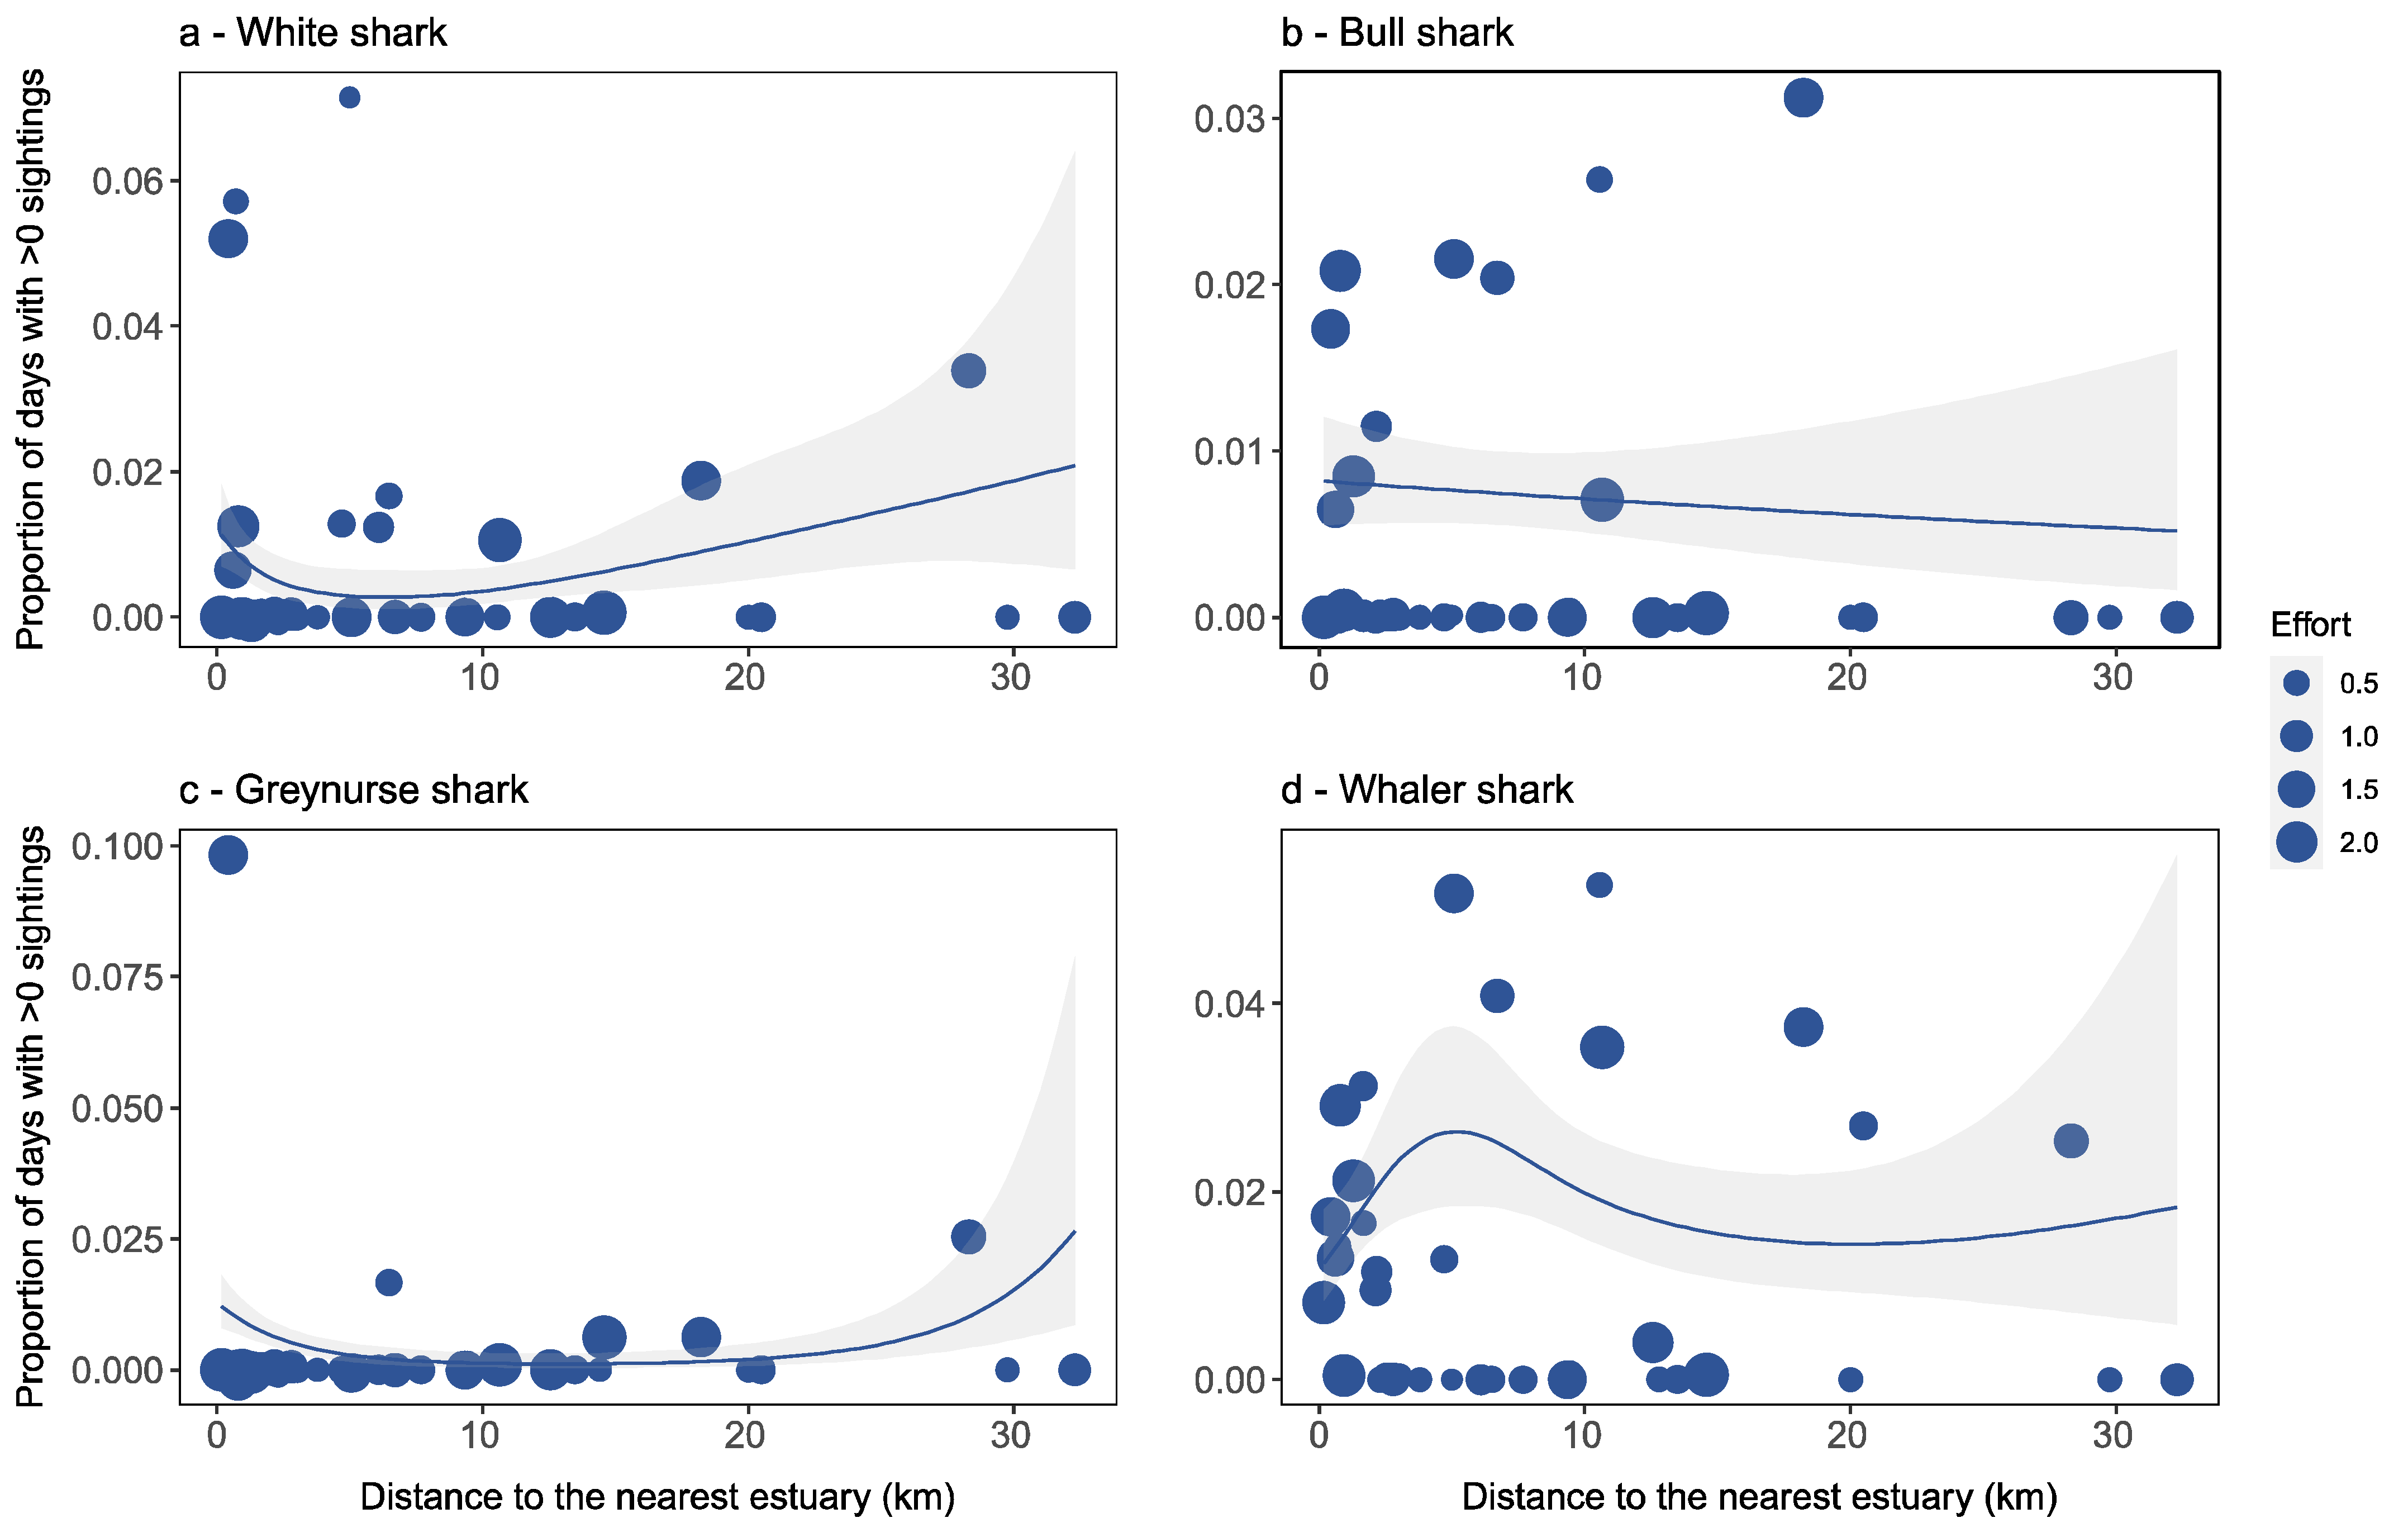
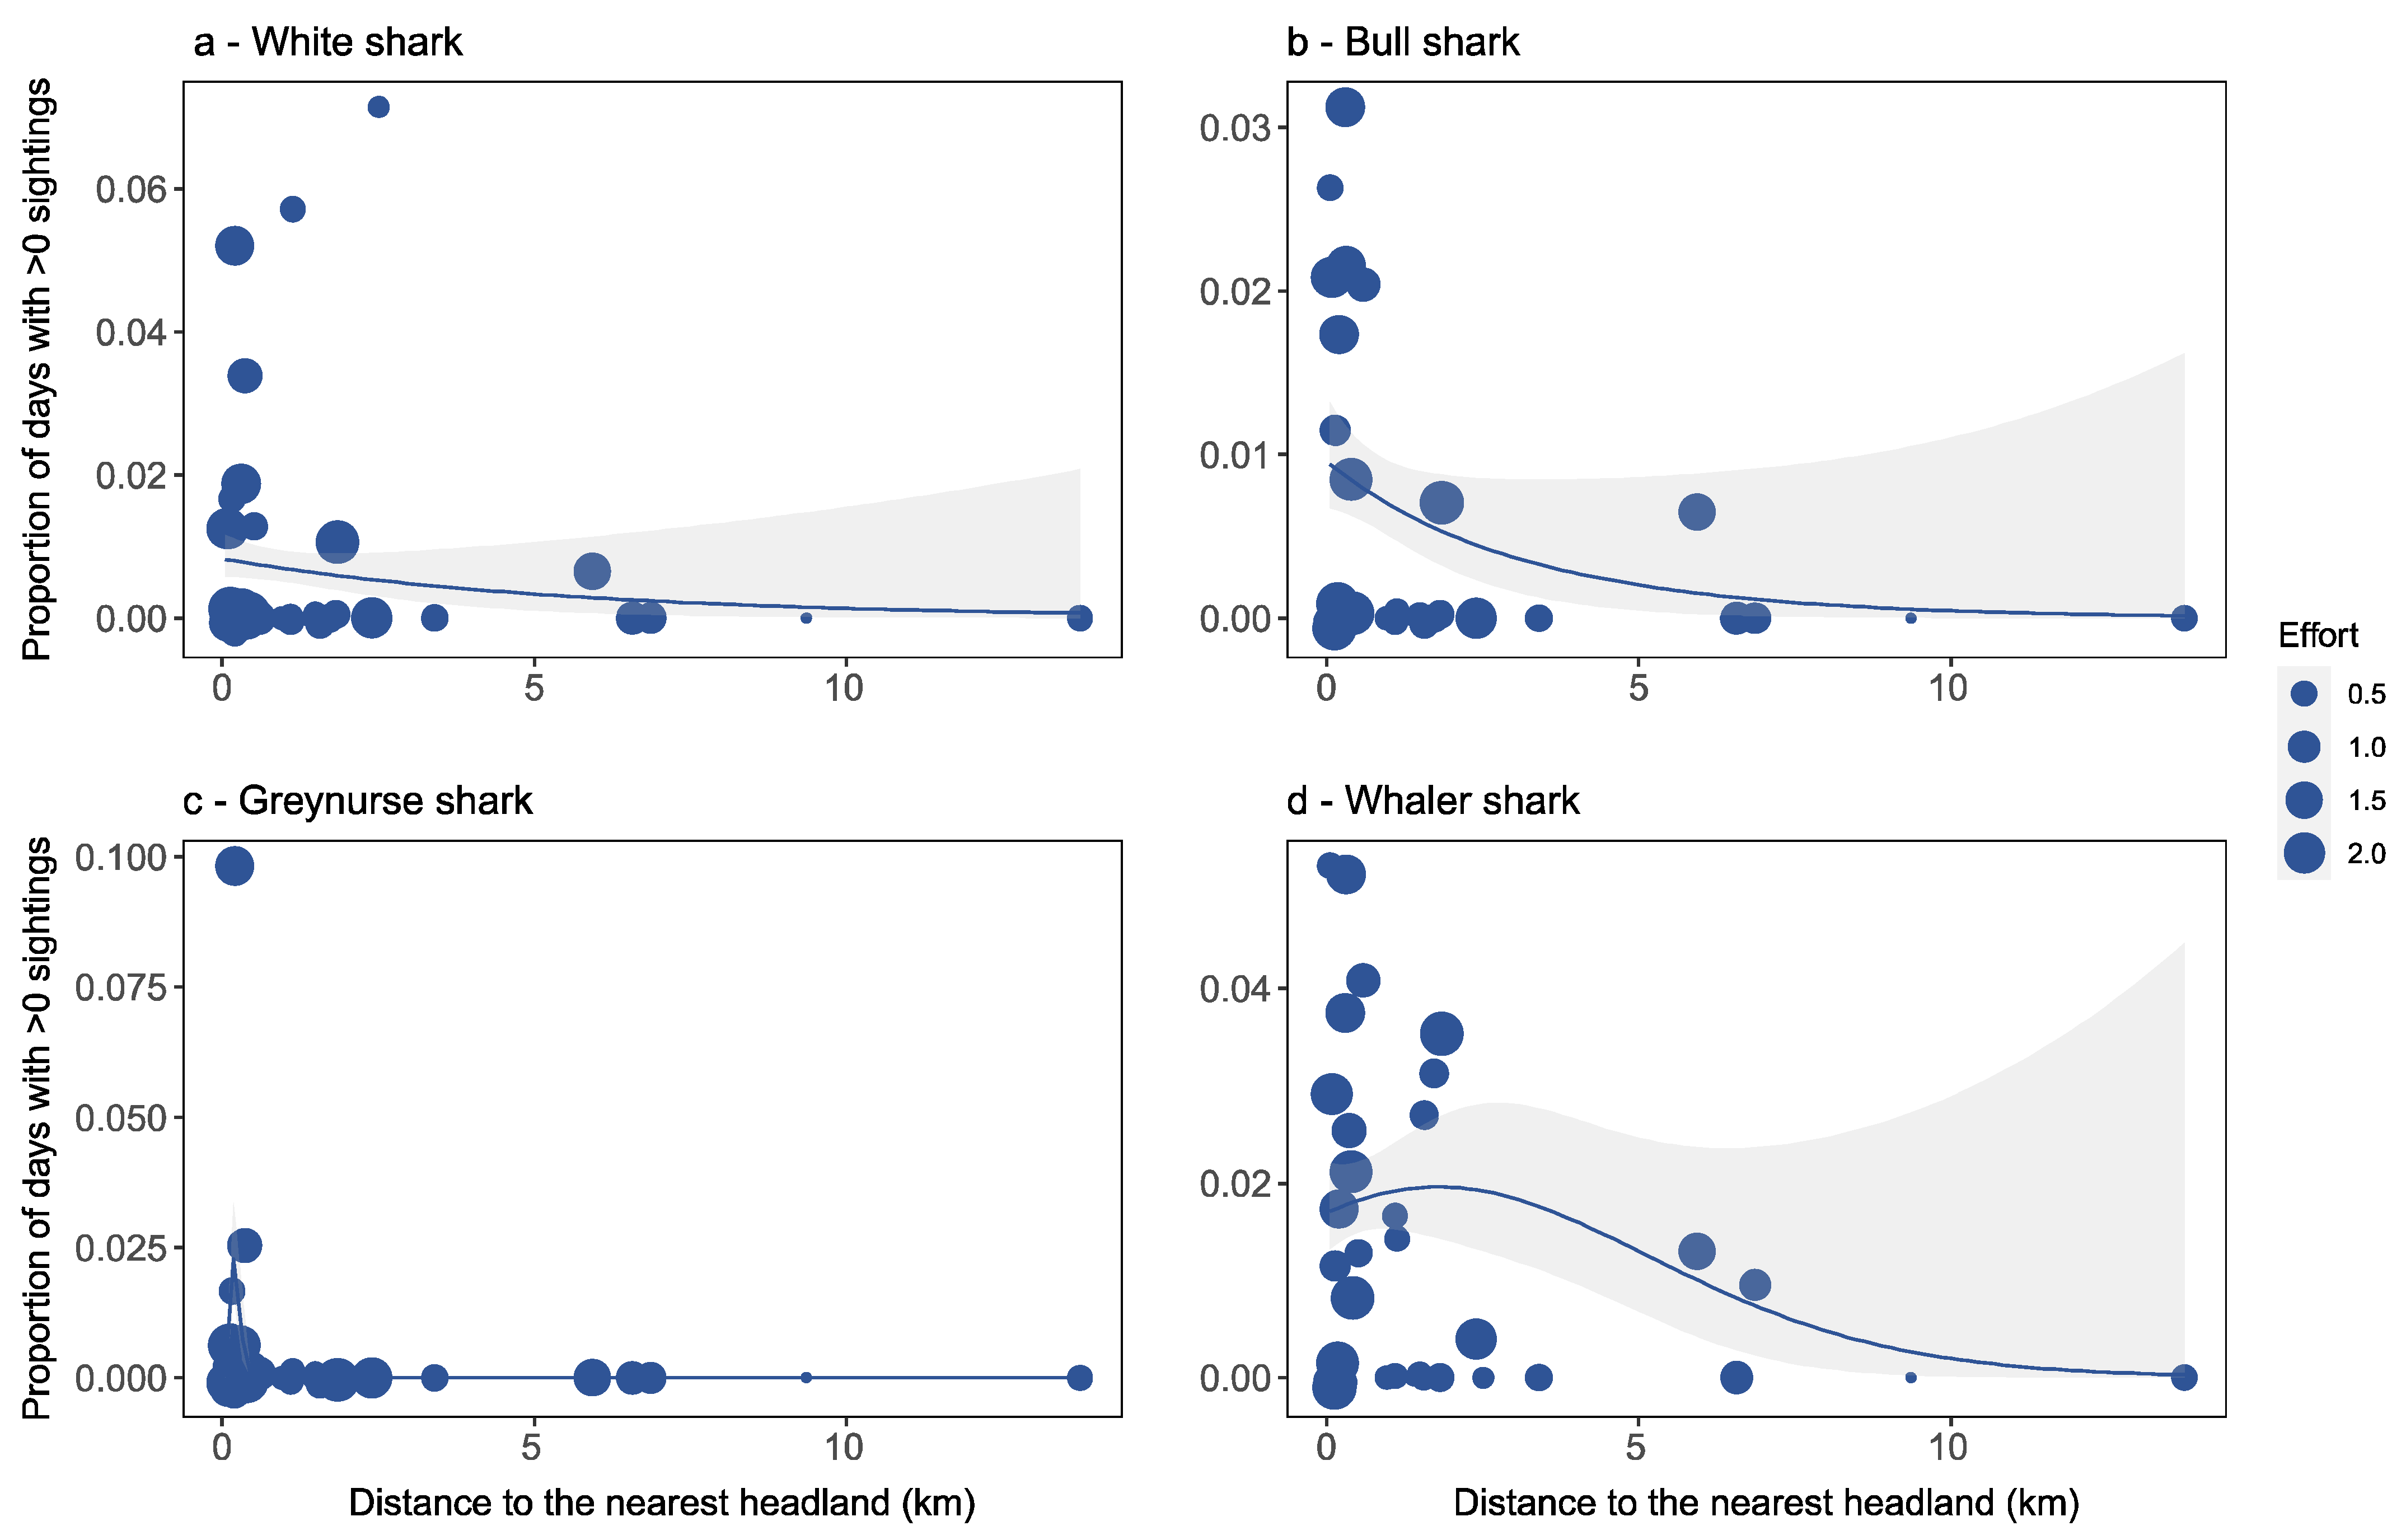
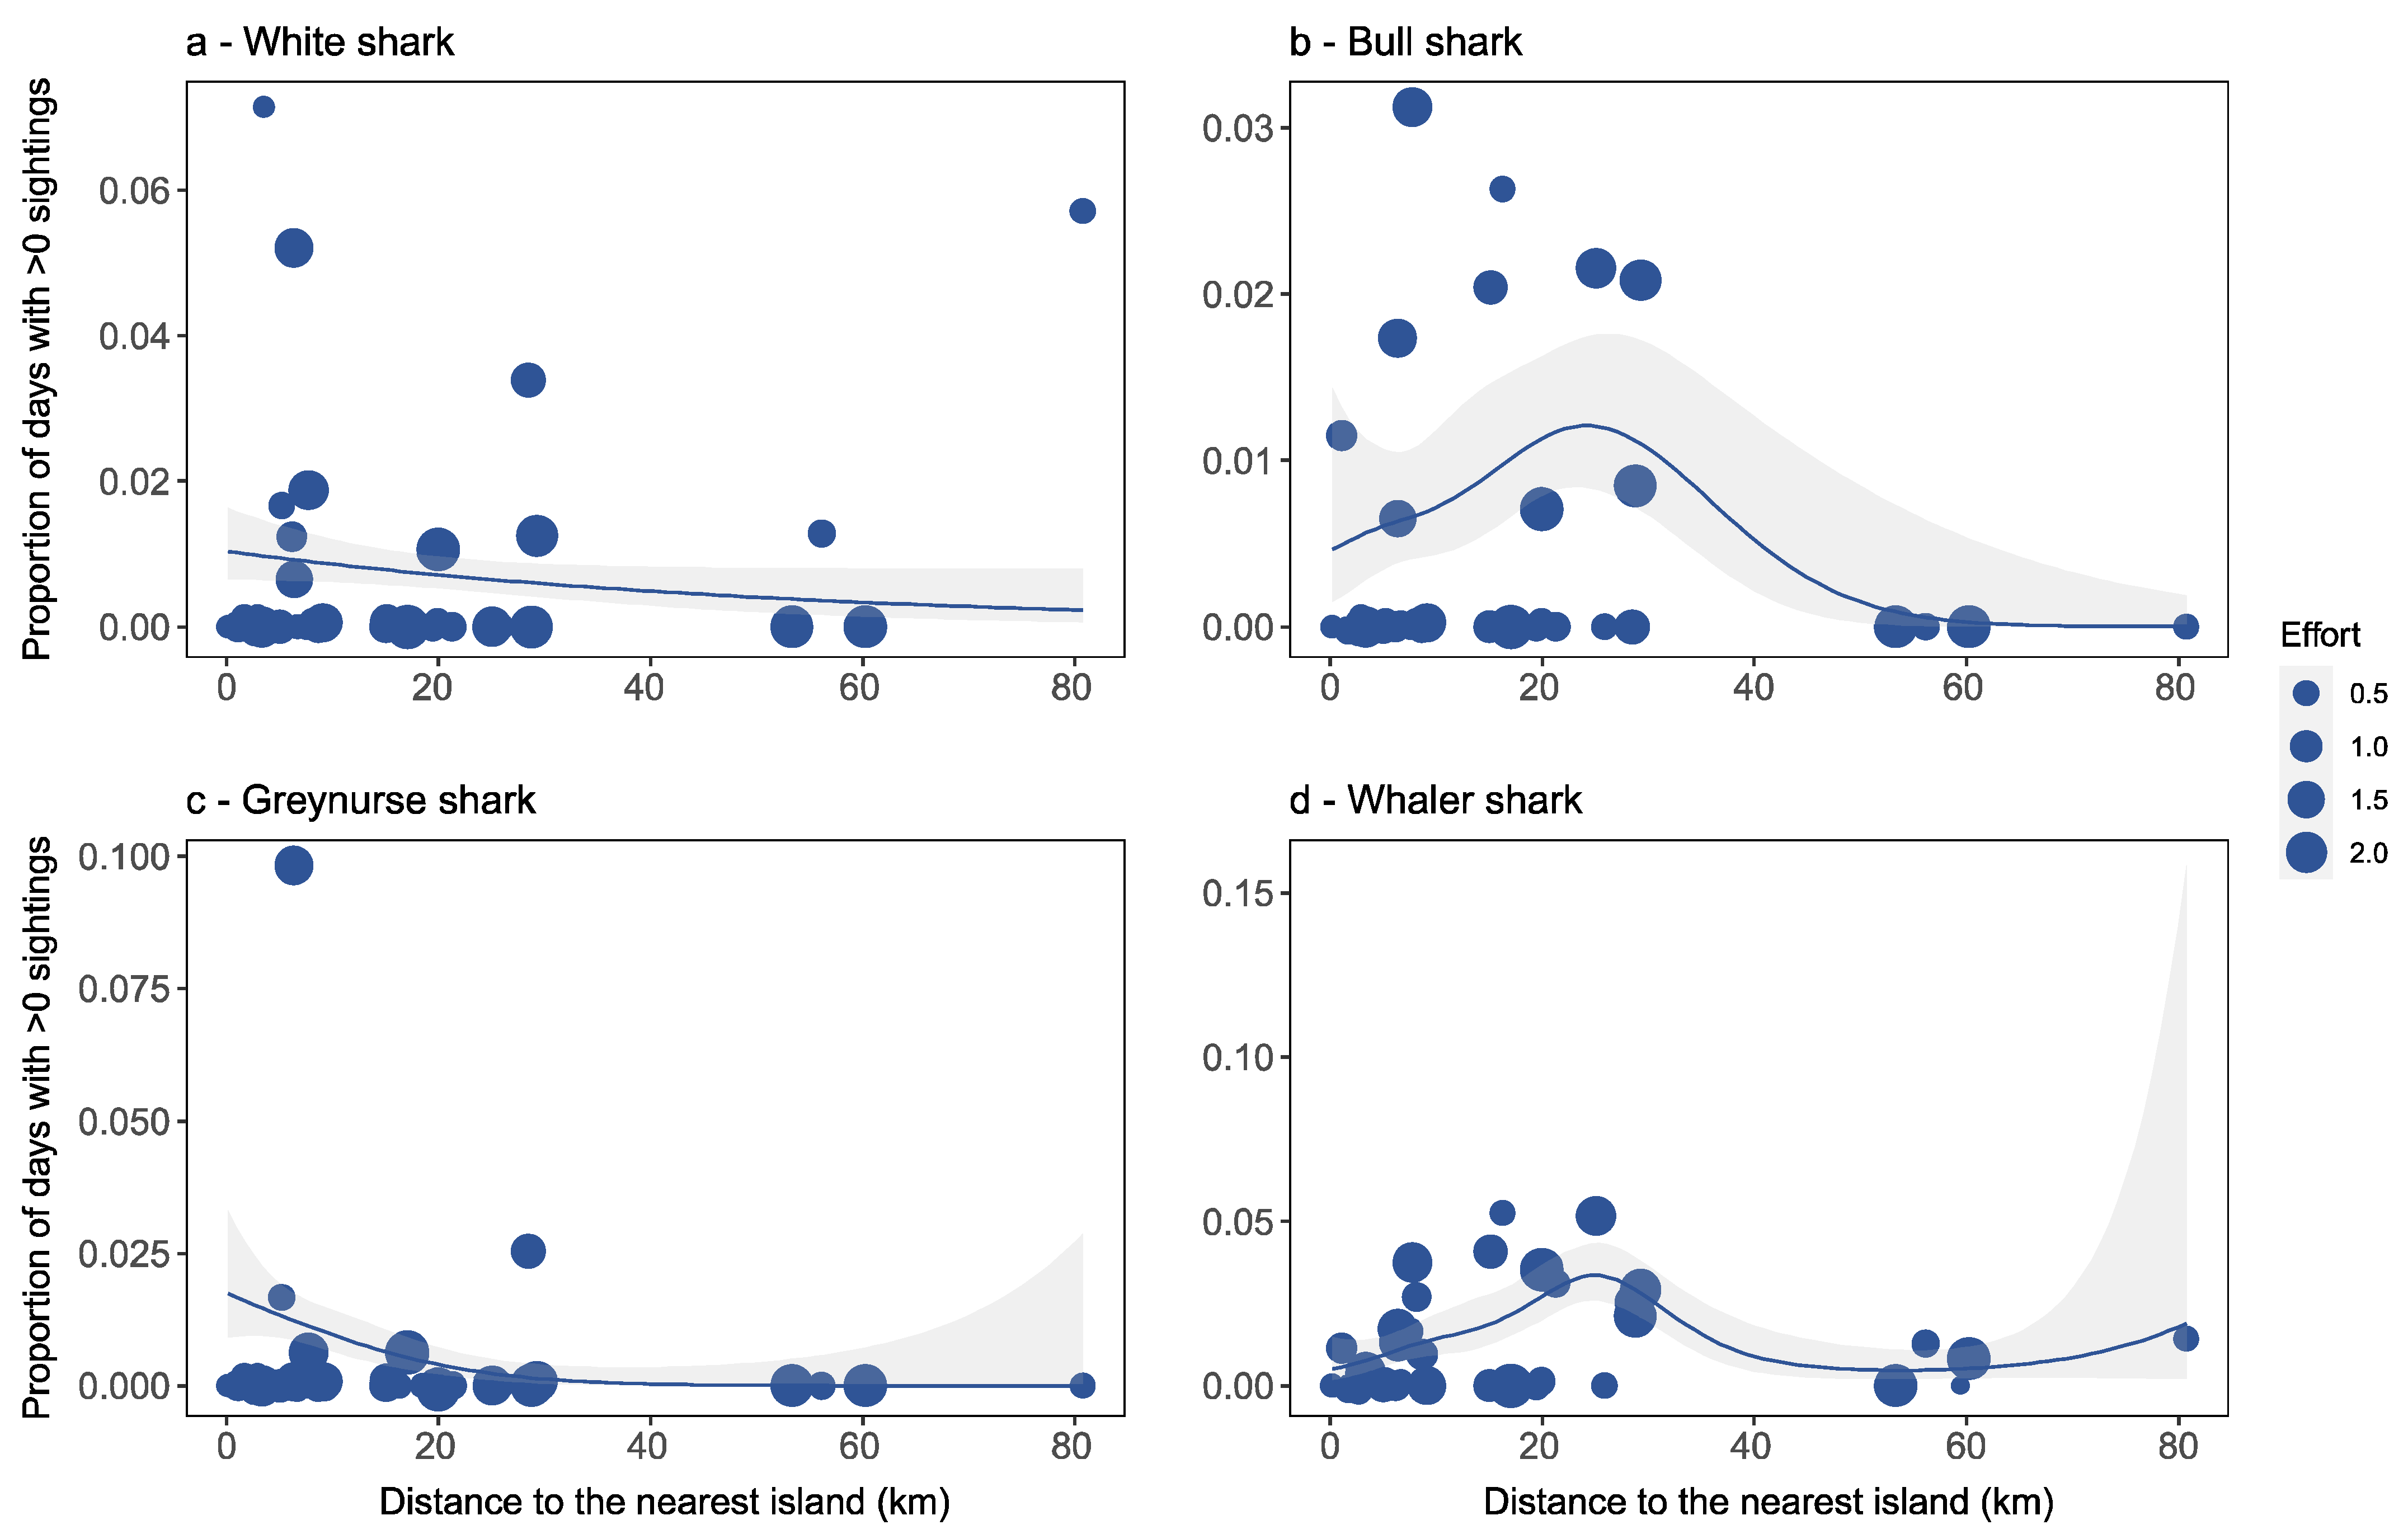
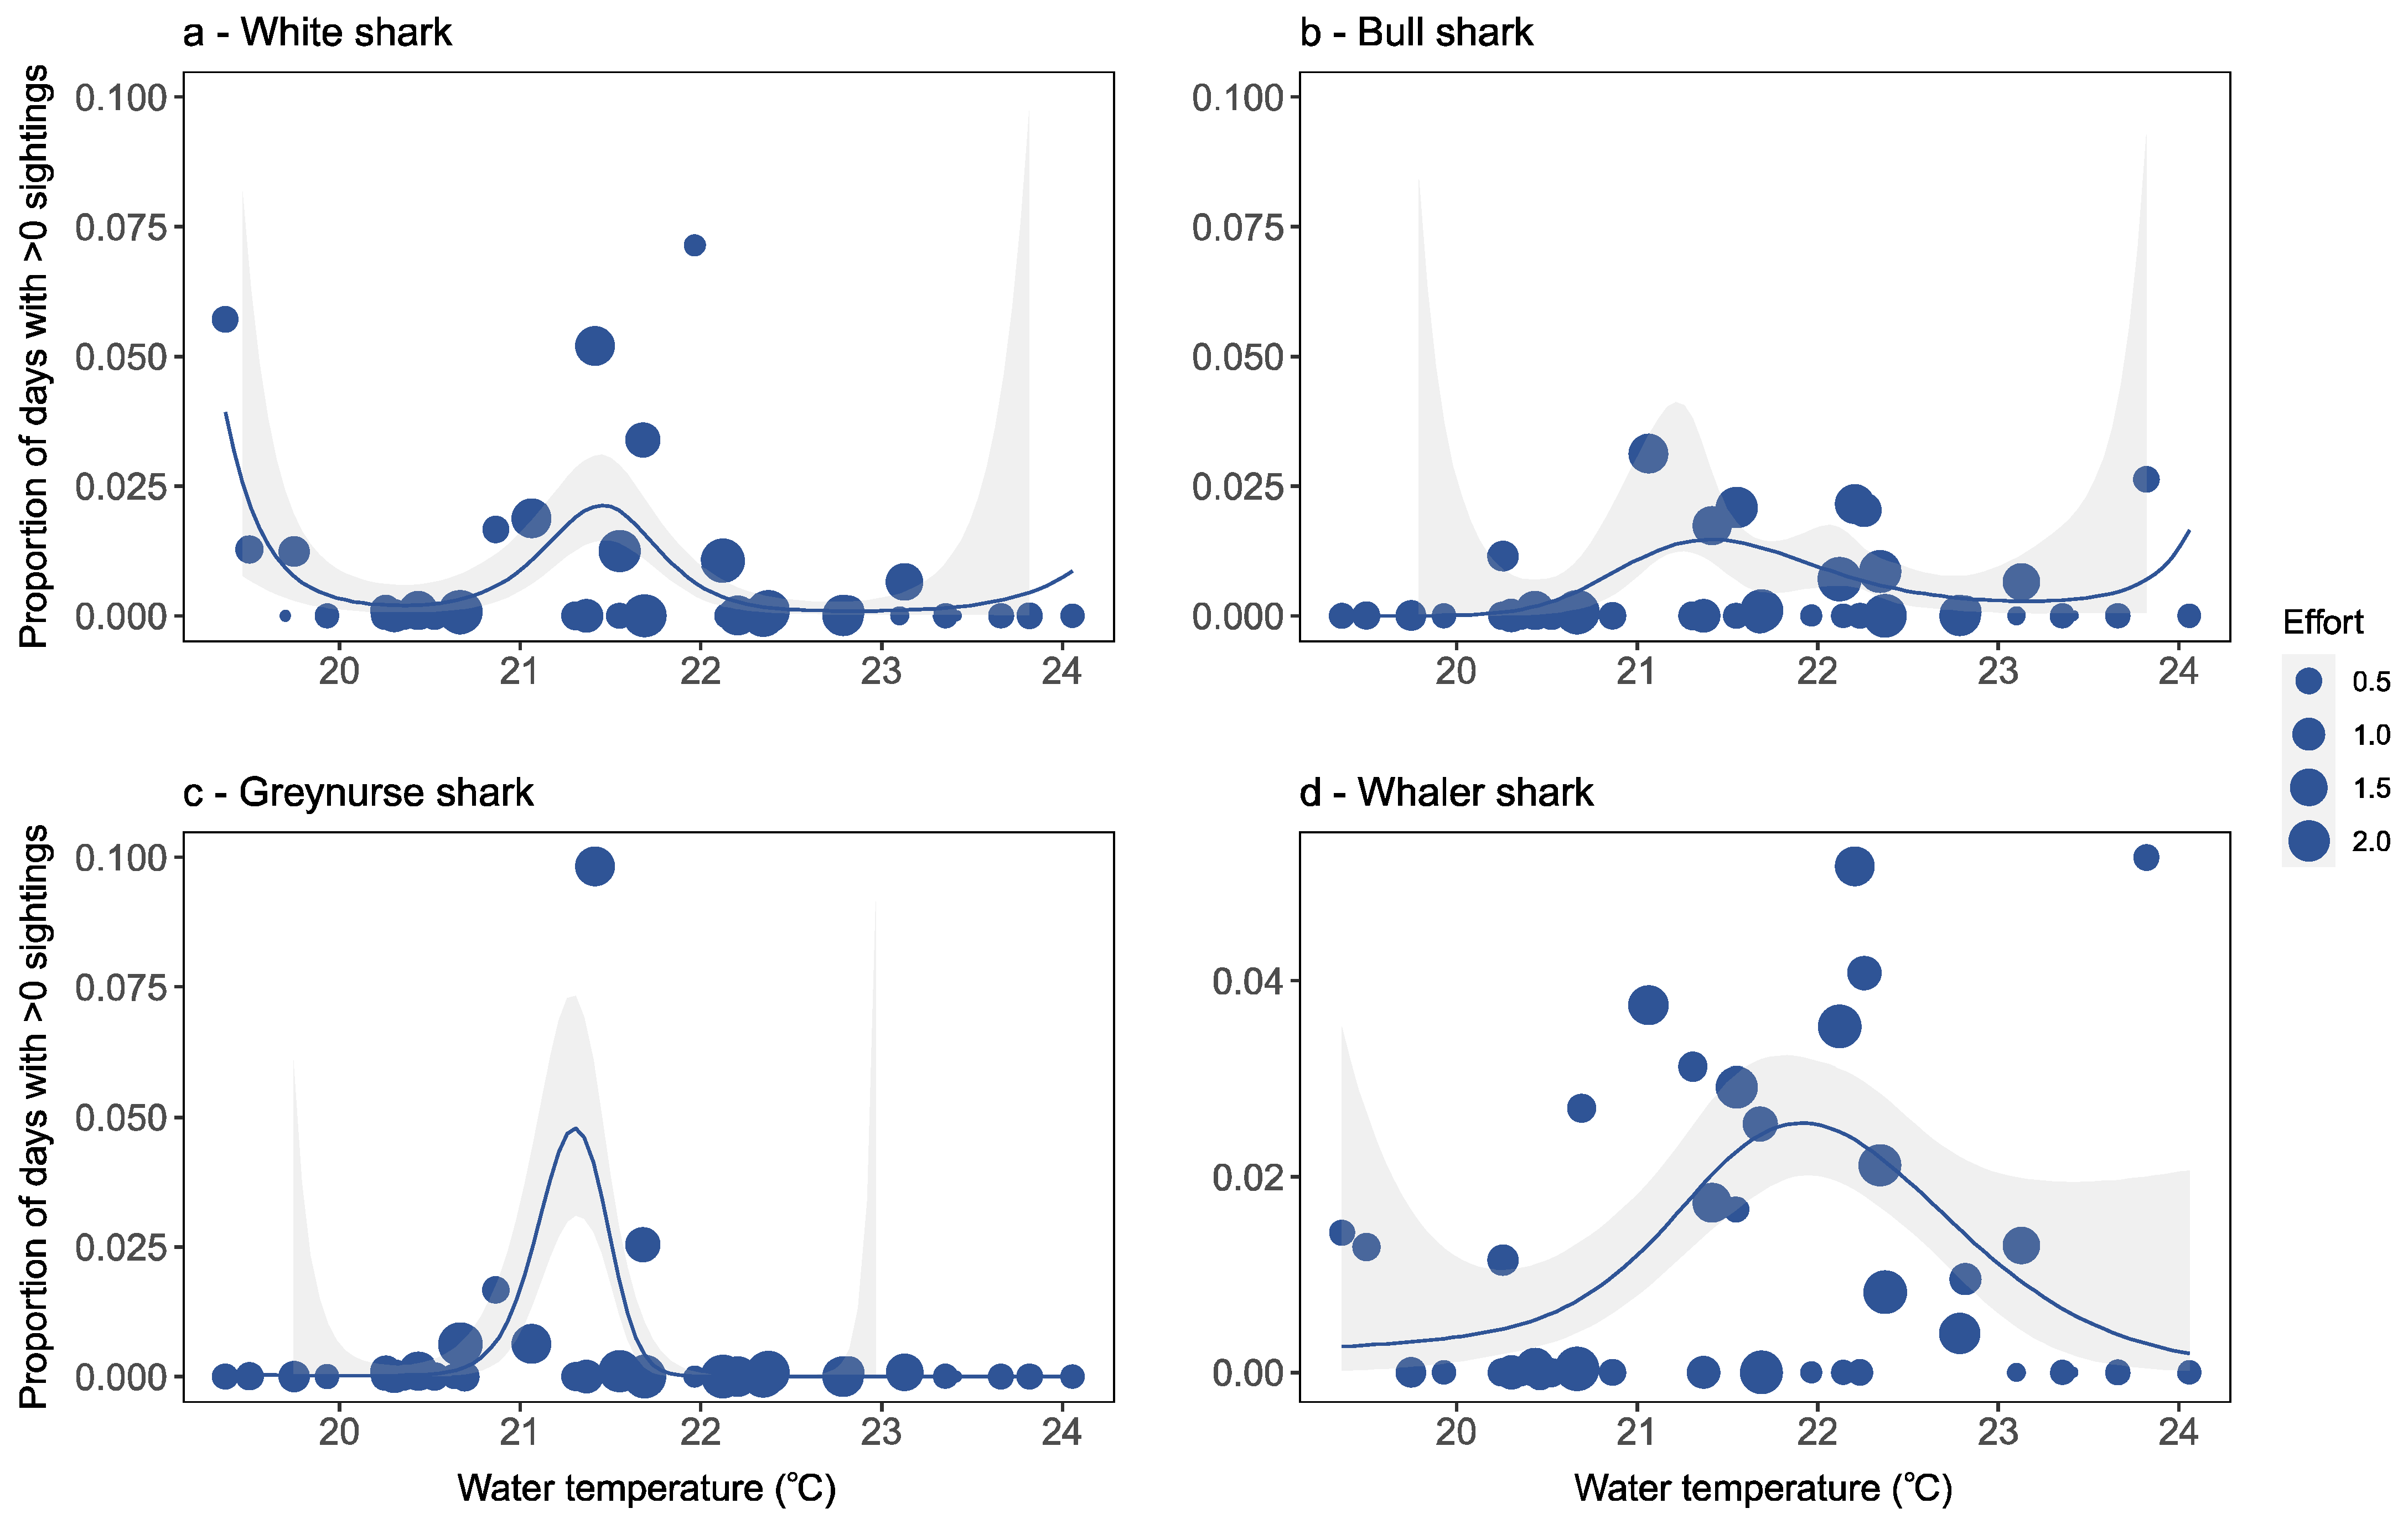
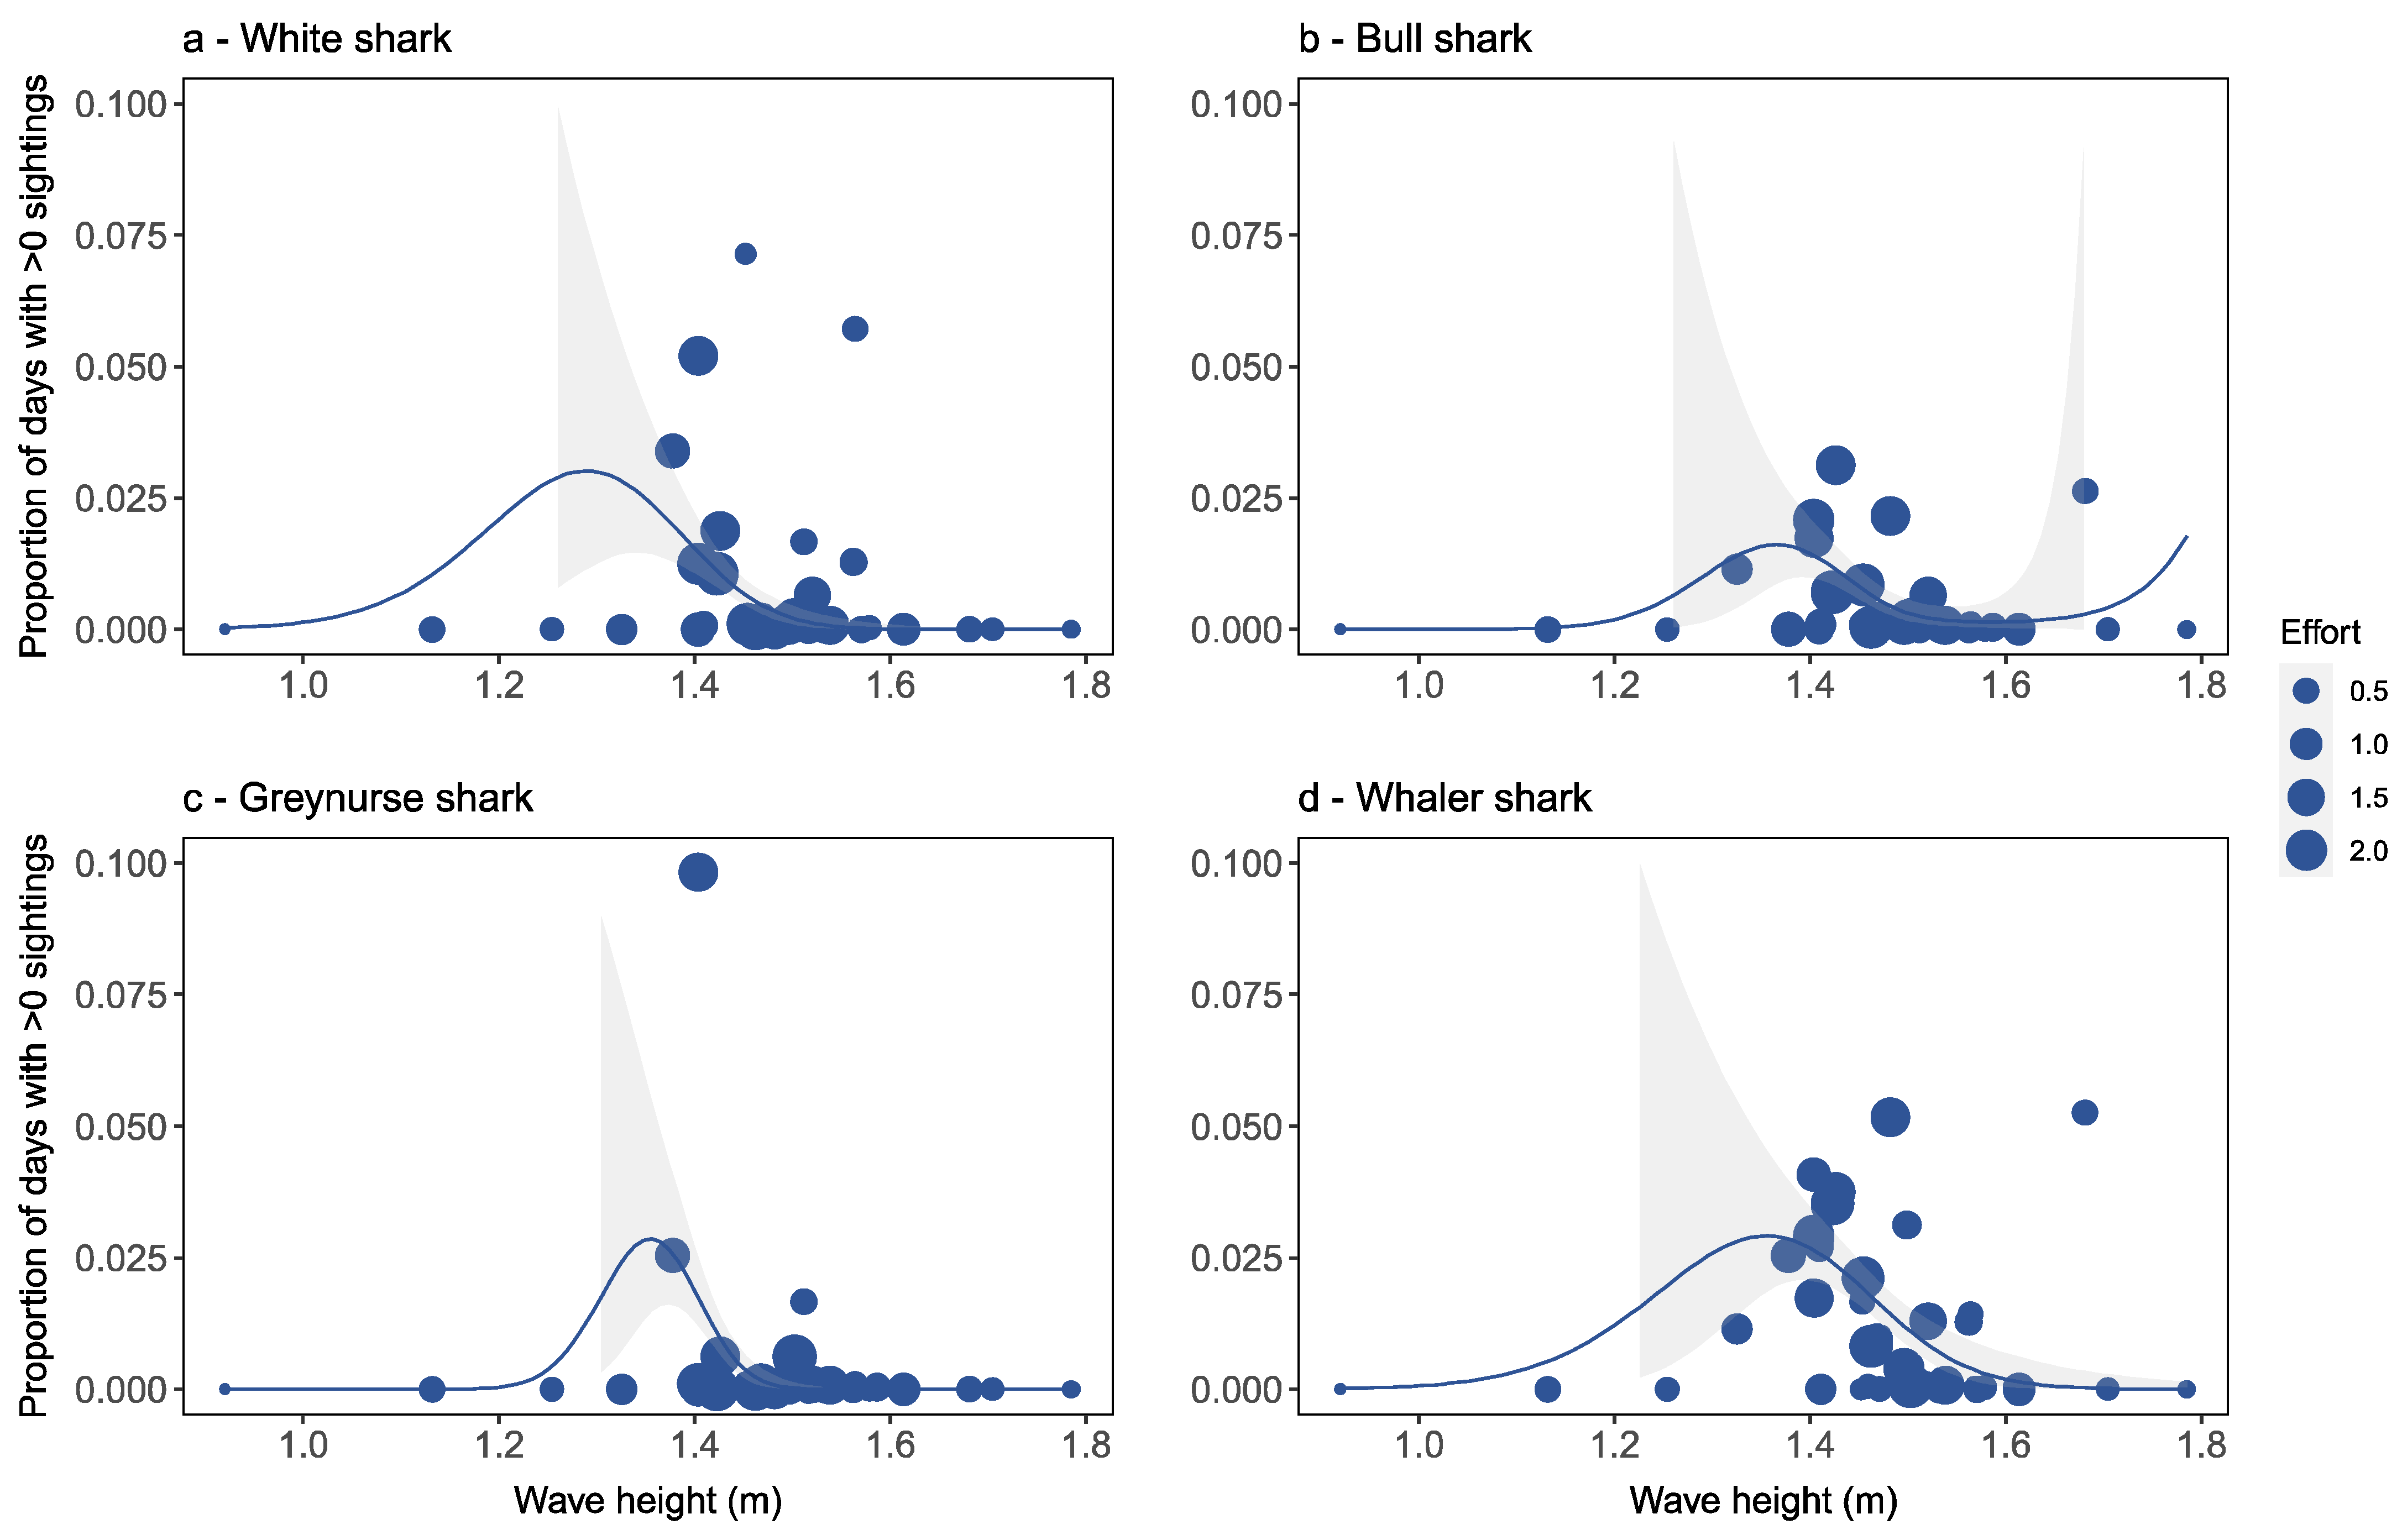
Factors Affecting Species-Specific Shark Distribution
4. Discussion
4.1. Shark Abundance and Occurrence
4.2. Factors Affecting Species-Specific Shark Distribution
4.3. Shark Detectability
5. Conclusions
Supplementary Materials
Author Contributions
Funding
Institutional Review Board Statement
Informed Consent Statement
Data Availability Statement
Acknowledgments
Conflicts of Interest
References
- Cortes, E. Standardized diet compositions and trophic levels of sharks. ICES J. Mar. Sci. 1999, 56, 707–717. [Google Scholar] [CrossRef]
- Heithaus, M.R.; Frid, A.; Wirsing, A.J.; Worm, B. Predicting ecological consequences of marine top predator declines. Trends Ecol. Evol. 2008, 23, 202–210. [Google Scholar] [CrossRef]
- Heupel, M.R.; Knip, D.M.; Simpfendorfer, C.A.; Dulvy, N.K. Sizing up the ecological role of sharks as predators. Mar. Ecol. Prog. Ser. 2014, 495, 291–298. [Google Scholar] [CrossRef] [Green Version]
- Myers, R.A.; Baum, J.K.; Shepherd, T.D.; Powers, S.P.; Peterson, C.H. Cascading effects of the loss of apex predatory sharks from a coastal ocean. Science 2007, 315, 1846–1850. [Google Scholar] [CrossRef] [PubMed]
- Baum, J.K.; Worm, B. Cascading top-down effects of changing oceanic predator abundances. J. Anim. Ecol. 2009, 78, 699–714. [Google Scholar] [CrossRef] [PubMed]
- Ripple, W.J.; Estes, J.A.; Schmitz, O.J.; Constant, V.; Kaylor, M.J.; Lenz, A.; Motley, J.L.; Self, K.E.; Taylor, D.S.; Wolf, C. What is a trophic cascade? Trends Ecol. Evol. 2016, 31, 842–849. [Google Scholar] [CrossRef]
- Reid, D.D.; Robbins, W.D.; Peddemors, V.M. Decadal trends in shark catches and effort from the New South Wales, Australia, Shark Meshing Program 1950–2010. Mar. Freshw. Res. 2011, 62, 676–693. [Google Scholar] [CrossRef]
- Dulvy, N.K.; Fowler, S.L.; Musick, J.A.; Cavanagh, R.D.; Kyne, P.M.; Harrison, L.R.; Carlson, J.K.; Davidson, L.N.K.; Fordham, S.V.; Francis, M.P.; et al. Extinction risk and conservation of the world’s sharks and rays. eLife 2014, 3, e00590. [Google Scholar] [CrossRef] [Green Version]
- Roff, G.; Brown, C.J.; Priest, M.A.; Mumby, P.J. Decline of coastal apex shark populations over the past half century. Commun. Biol. 2018, 1, 223. [Google Scholar] [CrossRef] [Green Version]
- Stevens, J.D.; Bonfil, R.; Dulvy, N.K.; Walker, P.A. The effects of fishing on sharks, rays, and chimaeras (chondrichthyans), and the implications for marine ecosystems. ICES J. Mar. Sci. 2000, 57, 476–494. [Google Scholar] [CrossRef]
- Ortega, L.A.; Heupel, M.R.; Beynen, P.V.; Motta, P.J. Movement patterns and water quality preferences of juvenile bull sharks (Carcharhinus leucas) in a Florida estuary. Environ. Biol. Fishes 2009, 84, 361–373. [Google Scholar] [CrossRef]
- Knip, D.M.; Heupel, M.R.; Simpfendorfer, C.A. Sharks in nearshore environments: Models, importance, and consequences. Mar. Ecol. Prog. Ser. 2010, 402, 1–11. [Google Scholar] [CrossRef]
- Haig, J.A.; Lambert, G.I.; Sumpton, W.D.; Mayer, D.G.; Werry, J.M. Habitat features influence catch rates of near-shore bull shark (Carcharhinus leucas) in the Queensland Shark Control Program, Australia 1996–2012. Estuar. Coast. Shelf Sci. 2018, 200, 289–300. [Google Scholar] [CrossRef]
- Heithaus, M.R.; Dill, L.M.; Marshall, G.J.; Buhleier, B. Habitat use and foraging behavior of tiger sharks (Galeocerdo cuvier) in a seagrass ecosystem. Mar. Biol. 2002, 140, 237–248. [Google Scholar] [CrossRef]
- Gutteridge, A.N.; Bennett, M.B.; Huveneers, C.; Tibbetts, I.R. Assessing the overlap between the diet of a coastal shark and the surrounding prey communities in a sub-tropical embayment. J. Fish Biol. 2011, 78, 1405–1422. [Google Scholar] [CrossRef]
- Heupel, M.R.; Munroe, S.E.M.; Lédée, E.J.I.; Chin, A.; Simpfendorfer, C.A. Interspecific interactions, movement patterns and habitat use in a diverse coastal shark assemblage. Mar. Biol. 2019, 166, 68. [Google Scholar] [CrossRef]
- Yates, P.M.; Heupel, M.R.; Tobin, A.J.; Simpfendorfer, C.A. Ecological drivers of shark distributions along a tropical coastline. PLoS ONE 2015, 10, e0121346. [Google Scholar] [CrossRef] [Green Version]
- Payne, N.L.; Meyer, C.G.; Smith, J.A.; Houghton, J.D.R.; Barnett, A.; Holmes, B.J.; Nakamura, I.; Papastamatiou, Y.P.; Royer, M.A.; Coffey, D.M.; et al. Combining abundance and performance data reveals how temperature regulates coastal occurrences and activity of a roaming apex predator. Glob. Change Biol. 2018, 24, 1884–1893. [Google Scholar] [CrossRef] [Green Version]
- Lynch, T.P.; Wilkinson, E.; Melling, L.; Hamilton, R.; Macready, A.; Feary, S. Conflict and impacts of divers and anglers in a marine park. Environ. Manag. 2004, 33, 196–211. [Google Scholar] [CrossRef]
- Roff, G.; Doropoulos, C.; Rogers, A.; Bozec, Y.M.; Krueck, N.C.; Aurellado, E.; Priest, M.; Birrell, C.; Mumby, P.J. Reassessing shark-driven trophic cascades on coral reefs: A reply to Ruppert et al. Trends Ecol. Evol. 2016, 31, 587–589. [Google Scholar] [CrossRef]
- Tickler, D.M.; Letessier, T.B.; Koldewey, H.J.; Meeuwig, J.J. Drivers of abundance and spatial distribution of reef-associated sharks in an isolated atoll reef system. PLoS ONE 2017, 12, e0177374. [Google Scholar] [CrossRef] [PubMed] [Green Version]
- Bass, N.C.; Day, J.; Guttridge, T.L.; Mourier, J.; Knott, N.A.; Vila Pouca, C.; Brown, C. Residency and movement patterns of adult Port Jackson sharks (Heterodontus portusjacksoni) at a breeding aggregation site. J. Fish Biol. 2021, 99, 1455–1466. [Google Scholar] [CrossRef] [PubMed]
- Werry, J.M.; Lee, S.Y.; Lemckert, C.J.; Otway, N.M. Natural or artificial? Habitat-use by the bull shark, Carcharhinus leucas. PLoS ONE 2012, 7, e49796. [Google Scholar] [CrossRef] [PubMed] [Green Version]
- Smoothey, A.F.; Lee, K.A.; Peddemors, V.M. Long-term patterns of abundance, residency and movements of bull sharks (Carcharhinus leucas) in Sydney Harbour, Australia. Sci. Rep. 2019, 9, 18864. [Google Scholar] [CrossRef] [Green Version]
- Heupel, M.R.; Simpfendorfer, C.A.; Espinoza, M.; Smoothey, A.F.; Tobin, A.; Peddemors, V. Conservation challenges of sharks with continental scale migrations. Front. Mar. Sci. 2015, 2, 12. [Google Scholar] [CrossRef]
- Dulvy, N.K.; Simpfendorfer, C.A.; Davidson, L.N.K.; Fordham, S.V.; Bräutigam, A.; Sant, G.; Welch, D.J. Challenges and priorities in shark and ray conservation. Curr. Biol. 2017, 27, R565–R572. [Google Scholar] [CrossRef] [Green Version]
- Froeschke, J.; Stunz, G.W.; Wildhaber, M.L. Environmental influences on the occurrence of coastal sharks in estuarine waters. Mar. Ecol. Prog. Ser. 2010, 407, 279–292. [Google Scholar] [CrossRef]
- West, J.G. Changing patterns of shark attacks in Australian waters. Mar. Freshw. Res. 2011, 62, 744–754. [Google Scholar] [CrossRef] [Green Version]
- Ryan, L.A.; Lynch, S.K.; Harcourt, R.; Slip, D.J.; Peddemors, V.; Everett, J.D.; Harrison, L.M.; Hart, N.S. Environmental predictive models for shark attacks in Australian waters. Mar. Ecol. Prog. Ser. 2019, 631, 165–179. [Google Scholar] [CrossRef]
- Colefax, A.P.; Butcher, P.A.; Pagendam, D.E.; Kelaher, B.P. Reliability of marine faunal detections in drone-based monitoring. Ocean Coast. Manag. 2019, 174, 108–115. [Google Scholar] [CrossRef]
- Kelaher, B.; Peddemors, V.; Hoade, B.; Colefax, A.; Butcher, P. Comparison of sampling precision for nearshore marine wildlife using unmanned and manned aerial surveys. J. Unmanned. Veh. Syst. 2019, 8, 30–43. [Google Scholar] [CrossRef]
- Butcher, P.A.; Piddocke, T.P.; Colefax, A.P.; Hoade, B.; Peddemors, V.M.; Borg, L.; Cullis, B.R. Beach safety: Can drones provide a platform for sighting sharks? Wildl. Res. 2019, 46, 701–712. [Google Scholar] [CrossRef] [Green Version]
- Colefax, A.P.; Kelaher, B.P.; Pagendam, D.E.; Butcher, P.A. Assessing white shark (Carcharodon carcharias) behavior along coastal beaches for conservation-focused shark mitigation. Front. Mar. Sci. 2020, 7, 268. [Google Scholar] [CrossRef]
- Kelaher, B.P.; Colefax, A.P.; Tagliafico, A.; Bishop, M.J.; Giles, A.; Butcher, P.A. Assessing variation in assemblages of large marine fauna off ocean beaches using drones. Mar. Freshw. Res. 2019, 71, 68–77. [Google Scholar] [CrossRef] [Green Version]
- Chapman, B.K.; McPhee, D. Global shark attack hotspots: Identifying underlying factors behind increased unprovoked shark bite incidence. Ocean Coast. Manage. 2016, 133, 72–84. [Google Scholar] [CrossRef]
- Colefax, A.P.; Butcher, P.A.; Kelaher, B.P. The potential for unmanned aerial vehicles (UAVs) to conduct marine fauna surveys in place of manned aircraft. ICES J. Mar. Sci. 2018, 75, 1–8. [Google Scholar] [CrossRef] [Green Version]
- Wood, S.N. Generalized Additive Models: An Introduction with R, 2nd ed.; Taylor & Francis Inc.: New York, NY, USA, 2017. [Google Scholar]
- R Core Team. R: A Language and Environment for Statistical Computing. R Foundation for Statistical Computing. 2022. Available online: https://www.r-project.org/ (accessed on 15 June 2022).
- Schlacher, T.A.; Connolly, R.M. Land–ocean coupling of carbon and nitrogen fluxes on sandy beaches. Ecosystems 2009, 12, 311–321. [Google Scholar] [CrossRef] [Green Version]
- Gillanders, B.M.; Elsdon, T.S.; Halliday, I.A.; Jenkins, G.P.; Robins, J.B.; Valesini, F.J. Potential effects of climate change on Australian estuaries and fish utilising estuaries: A review. Mar. Freshw. Res. 2011, 62, 1115–1131. [Google Scholar] [CrossRef] [Green Version]
- Tamburin, E.; Elorriaga-Verplancken, F.R.; Estupiñan-Montaño, C.; Madigan, D.J.; Sánchez-González, A.; Padilla, M.H.; Wcisel, M.; Galván-Magaña, F. New insights into the trophic ecology of young white sharks (Carcharodon carcharias) in waters off the Baja California Peninsula, Mexico. Mar. Biol. 2020, 167, 55. [Google Scholar] [CrossRef]
- Harasti, D.; Lee, K.A.; Laird, R.; Bradford, R.; Bruce, B. Use of stereo baited remote underwater video systems to estimate the presence and size of white sharks (Carcharodon carcharias). Mar. Freshw. Res. 2017, 68, 1391–1396. [Google Scholar] [CrossRef]
- Spaet, J.L.Y.; Patterson, T.A.; Bradford, R.W.; Butcher, P.A. Spatiotemporal distribution patterns of immature Australasian white sharks (Carcharodon carcharias). Sci. Rep. 2020, 10, 10169. [Google Scholar] [CrossRef] [PubMed]
- Tate, R.D.; Kelaher, B.P.; Brand, C.P.; Cullis, B.R.; Gallen, C.R.; Smith, S.D.A.; Butcher, P.A. The effectiveness of Shark-Management-Alert-in-Real-Time (SMART) drumlines as a tool for catching white sharks, Carcharodon carcharias, off coastal New South Wales, Australia. Fish. Manag. Ecol. 2021, 28, 496–506. [Google Scholar] [CrossRef]
- Espinoza, M.; Heupel, M.R.; Tobin, A.J.; Simpfendorfer, C.A. Evidence of partial migration in a large coastal predator: Opportunistic foraging and reproduction as key drivers? PLoS ONE 2016, 11, e0147608. [Google Scholar] [CrossRef] [PubMed]
- Niella, Y.; Smoothey, A.F.; Peddemors, V.; Harcourt, R. Predicting changes in distribution of a large coastal shark in the face of the strengthening East Australian Current. Mar. Ecol. Prog. Ser. 2020, 642, 163–177. [Google Scholar] [CrossRef]
- Niella, Y.; Smoothey, A.F.; Taylor, M.; Peddemors, V.; Harcourt, R. Environmental drivers of predator and prey fine-scale spatial dynamics in Sydney Harbour (Australia) and surrounding coastal waters. Estuaries Coasts 2021, 45, 1465–1479. [Google Scholar] [CrossRef]
- Carlson, J.K.; Ribera, M.M.; Conrath, C.L.; Heupel, M.R.; Burgess, G.H. Habitat use and movement patterns of bull sharks Carcharhinus leucas determined using pop-up satellite archival tags. J. Fish Biol. 2010, 77, 661–675. [Google Scholar] [CrossRef]
- Kyne, P.M.; Heupel, M.R.; White, W.T.; Simpfendorfer, C.A. The Action Plan for Australian Sharks and Rays 2021; National Environmental Science Program, Marine Biodiversity Hub: Hobart, TAS, Australia, 2021; Available online: https://www.nespmarine.edu.au/system/files/Shark_Action_Plan_FINAL_Sept7_2021_WEB_RGB.pdf (accessed on 24 January 2022).
- Kneebone, J.; Chisholm, J.; Skomal, G.B. Seasonal residency, habitat use, and site fidelity of juvenile sand tiger sharks Carcharias taurus in a Massachusetts estuary. Mar. Ecol. Prog. Ser. 2012, 471, 165–181. [Google Scholar] [CrossRef] [Green Version]
- Otway, N.M.; Storrie, M.T.; Louden, B.M.; Gilligan, J.J. Documentation of Depth-Related Migratory Movements, Localised Movements at Critical Habitat Sites and the Effects of Scuba Diving for the East Coast Grey Nurse Shark Population; Industry & Investment NSW: Port Stephens, NSW, Australia, 2009. Available online: https://www.dpi.nsw.gov.au/__data/assets/pdf_file/0016/306601/AE_2009_Output-1267_Otway-et-al_GNS-Final-Report-112_REPORT.pdf (accessed on 26 January 2022).
- Lynch, T.P.; Harcourt, R.; Edgar, G.; Barrett, N. Conservation of the critically endangered eastern Australian population of the grey nurse shark (Carcharias taurus) through cross-jurisdictional management of a network of marine-protected areas. Environ. Manag. 2013, 52, 1341–1354. [Google Scholar] [CrossRef]
- Department of Agriculture, Water, and the Environment. Recovery Plan for the Grey Nurse Shark (Carcharias taurus); Department of Agriculture, Water, and the Environment: Canberra, ACT, Australia, 2014. Available online: https://www.awe.gov.au/sites/default/files/documents/recovery-plan-grey-nurse-shark-carcharias-taurus.pdf (accessed on 28 January 2022).
- Barbier, E.B.; Hacker, S.D.; Kennedy, C.; Koch, E.W.; Stier, A.C.; Silliman, B.R. The value of estuarine and coastal ecosystem services. Ecol. Monogr. 2011, 81, 169–193. [Google Scholar] [CrossRef]
- Elliott, M.; Whitfield, A.K. Challenging paradigms in estuarine ecology and management. Estuar. Coast. Shelf Sci. 2011, 94, 306–314. [Google Scholar] [CrossRef]
- Smoothey, A.F.; Gray, C.A.; Kennelly, S.J.; Masens, O.J.; Peddemors, V.M.; Robinson, W.A. Patterns of occurrence of sharks in Sydney Harbour, a large urbanised estuary. PLoS ONE 2016, 11, e0146911. [Google Scholar] [CrossRef] [PubMed]
- Matich, P.; Plumlee, J.D.; Weideli, O.C.; Fisher, M. New insights into the trophic ecology of blacktip sharks (Carcharhinus limbatus) from a subtropical estuary in the western Gulf of Mexico. J. Fish Biol. 2021, 98, 470–484. [Google Scholar] [CrossRef] [PubMed]
- Harasti, D.; Lee, K.; Bruce, B.; Gallen, C.; Bradford, R. Juvenile white sharks Carcharodon carcharias use estuarine environments in south-eastern Australia. Mar. Biol. 2017, 164, 58. [Google Scholar] [CrossRef]
- Lea, J.S.E.; Humphries, N.E.; Clarke, C.R.; Sims, D.W. To Madagascar and back: Long-distance, return migration across open ocean by a pregnant female bull shark Carcharhinus leucas. J. Fish Biol. 2015, 87, 1313–1321. [Google Scholar] [CrossRef] [PubMed]
- Drew, M.; Rogers, P.; Lloyd, M.; Huveneers, C. Seasonal occurrence and site fidelity of juvenile bronze whalers (Carcharhinus brachyurus) in a temperate inverse estuary. Mar. Biol. 2019, 166, 56. [Google Scholar] [CrossRef]
- Russell, P.; Vennell, R. High-resolution observations of secondary circulation and tidally synchronized upwelling around a coastal headland. J. Geophys. Res. Oceans 2017, 122, 890–913. [Google Scholar] [CrossRef]
- Hall, A.E.; Kingsford, M.J. Habitat type and complexity drive fish assemblages in a tropical seascape. J. Fish Biol. 2021, 99, 1364–1379. [Google Scholar] [CrossRef]
- McIlvenny, J.; Williamson, B.J.; MacDowall, C.; Gleizon, P.; O’Hara Murray, R. Modelling hydrodynamics of fast tidal stream around a promontory headland. Estuar. Coast. Shelf Sci. 2021, 259, 107474. [Google Scholar] [CrossRef]
- Worm, B.; Lotze, H.K.; Myers, R.A. Predator diversity hotspots in the blue ocean. Proc. Natl. Acad. Sci. USA 2003, 100, 9884–9888. [Google Scholar] [CrossRef] [Green Version]
- Bruce, B.D.; Bradford, R.W. Habitat use and spatial dynamics of juvenile white sharks, Carcharodon carcharias, in eastern Australia. In Global Perspectives on the Biology and Life History of the White Shark; Domeier, M.L., Ed.; CRC Press: Boca Raton, FL, USA, 2012; pp. 301–318. [Google Scholar]
- Smale, M.J. Occurrence of Carcharias taurus in nursery areas of the Eastern and Western Cape, South Africa. Mar. Freshw. Res. 2002, 53, 551–556. [Google Scholar] [CrossRef]
- Heupel, M.R.; Carlson, J.K.; Simpfendorfer, C.A. Shark nursery areas: Concepts, definition, characterization and assumptions. Mar. Ecol. Prog. Ser. 2007, 337, 287–297. [Google Scholar] [CrossRef]
- Becerril-García, E.E.; Martínez-Rincón, R.O.; Galván-Magaña, F.; Santana-Morales, O.; Hoyos-Padilla, E.M. Statistical modelling reveals spatial, temporal, and environmental preferences for white sharks at an oceanic aggregation site. Mar. Ecol. Prog. Ser. 2020, 655, 171–183. [Google Scholar] [CrossRef]
- Werry, J.M.; Sumpton, W.; Otway, N.M.; Lee, S.Y.; Haig, J.A.; Mayer, D.G. Rainfall and sea surface temperature: Key drivers for occurrence of bull shark, Carcharhinus leucas, in beach areas. Glob. Ecol. Conserv. 2018, 15, e00430. [Google Scholar] [CrossRef]
- Kajiura, S.M.; Tellman, S.L. Quantification of massive seasonal aggregations of blacktip sharks (Carcharhinus limbatus) in southeast Florida. PLoS ONE 2016, 11, e0150911. [Google Scholar] [CrossRef] [PubMed] [Green Version]
- Duffy, C.A.J.; Francis, M.P.; Manning, M.J.; Bonfil, R. Regional population connectivity, oceanic habitat, and return migration revealed by satellite tagging of white sharks, Carcharodon carcharias, at New Zealand aggregation sites. In Global Perspectives on the Biology and Life History of the White Shark; Domeier, M.L., Ed.; CRC Press: Boca Raton, FL, USA, 2012; pp. 301–318. [Google Scholar]
- Spaet, J.L.Y.; Manica, A.; Brand, C.P.; Gallen, C.; Butcher, P.A. Environmental conditions are poor predictors of immature white shark Carcharodon carcharias occurrences on coastal beaches of eastern Australia. Mar. Ecol. Prog. Ser. 2020, 653, 167–179. [Google Scholar] [CrossRef]
- Butcher, P.A.; Colefax, A.P.; Gorkin, R.A.; Kajiura, S.M.; López, N.A.; Mourier, J.; Purcell, C.R.; Skomal, G.B.; Tucker, J.P.; Walsh, A.J.; et al. The drone revolution of shark science: A review. Drones 2021, 5, 8. [Google Scholar] [CrossRef]
- Gray, P.C.; Bierlich, K.C.; Mantell, S.A.; Friedlaender, A.S.; Goldbogen, J.A.; Johnston, D.W.; Ye, H. Drones and convolutional neural networks facilitate automated and accurate cetacean species identification and photogrammetry. Methods Ecol. Evol. 2019, 10, 1490–1500. [Google Scholar] [CrossRef]
- Gorkin, R.; Adams, K.; Berryman, M.J.; Aubin, S.; Li, W.; Davis, A.R.; Barthelemy, J. Sharkeye: Real-time autonomous personal shark alerting via aerial surveillance. Drones 2020, 4, 18. [Google Scholar] [CrossRef]
- Provost, E.J.; Coleman, M.A.; Butcher, P.A.; Colefax, A.; Schlacher, T.A.; Bishop, M.J.; Connolly, R.M.; Gilby, B.L.; Henderson, C.J.; Jones, A.; et al. Quantifying human use of sandy shores with aerial remote sensing technology: The sky is not the limit. Ocean Coast. Manage. 2021, 211, 105750. [Google Scholar] [CrossRef]


| Parameter | Null | Estuary | Headland | Island | Water Temperature | Wave Height |
|---|---|---|---|---|---|---|
| White sharks | 119.4 | 117.8 (*) | 119.3 (NS) | 117.9 (NS) | 86.5 (***) | 116.6 (*) |
| Bull sharks | 86.4 | 87.7 (NS) | 83.3 (NS) | 80.2 (*) | 82.3 (*) | 78.0 (*) |
| Greynurse sharks | 128.4 | 114.1 (**) | 70.7 (***) | 80.9 (**) | 68.9 (*) | 97.4 (***) |
| Whaler sharks | 138.9 | 140.9 (NS) | 138.8 (NS) | 119.8 (***) | 127.4 (**) | 134.1 (*) |
Publisher’s Note: MDPI stays neutral with regard to jurisdictional claims in published maps and institutional affiliations. |
© 2022 by the authors. Licensee MDPI, Basel, Switzerland. This article is an open access article distributed under the terms and conditions of the Creative Commons Attribution (CC BY) license (https://creativecommons.org/licenses/by/4.0/).
Share and Cite
Monteforte, K.I.P.; Butcher, P.A.; Morris, S.G.; Kelaher, B.P. The Relative Abundance and Occurrence of Sharks off Ocean Beaches of New South Wales, Australia. Biology 2022, 11, 1456. https://doi.org/10.3390/biology11101456
Monteforte KIP, Butcher PA, Morris SG, Kelaher BP. The Relative Abundance and Occurrence of Sharks off Ocean Beaches of New South Wales, Australia. Biology. 2022; 11(10):1456. https://doi.org/10.3390/biology11101456
Chicago/Turabian StyleMonteforte, Kim I. P., Paul A. Butcher, Stephen G. Morris, and Brendan P. Kelaher. 2022. "The Relative Abundance and Occurrence of Sharks off Ocean Beaches of New South Wales, Australia" Biology 11, no. 10: 1456. https://doi.org/10.3390/biology11101456