
The Effects of Cranial Orientation on Forensic Frontal Sinus Identification as Assessed by Outline Analyses


Abstract
:Simple Summary
Abstract
1. Introduction
2. Materials and Methods
2.1. Materials
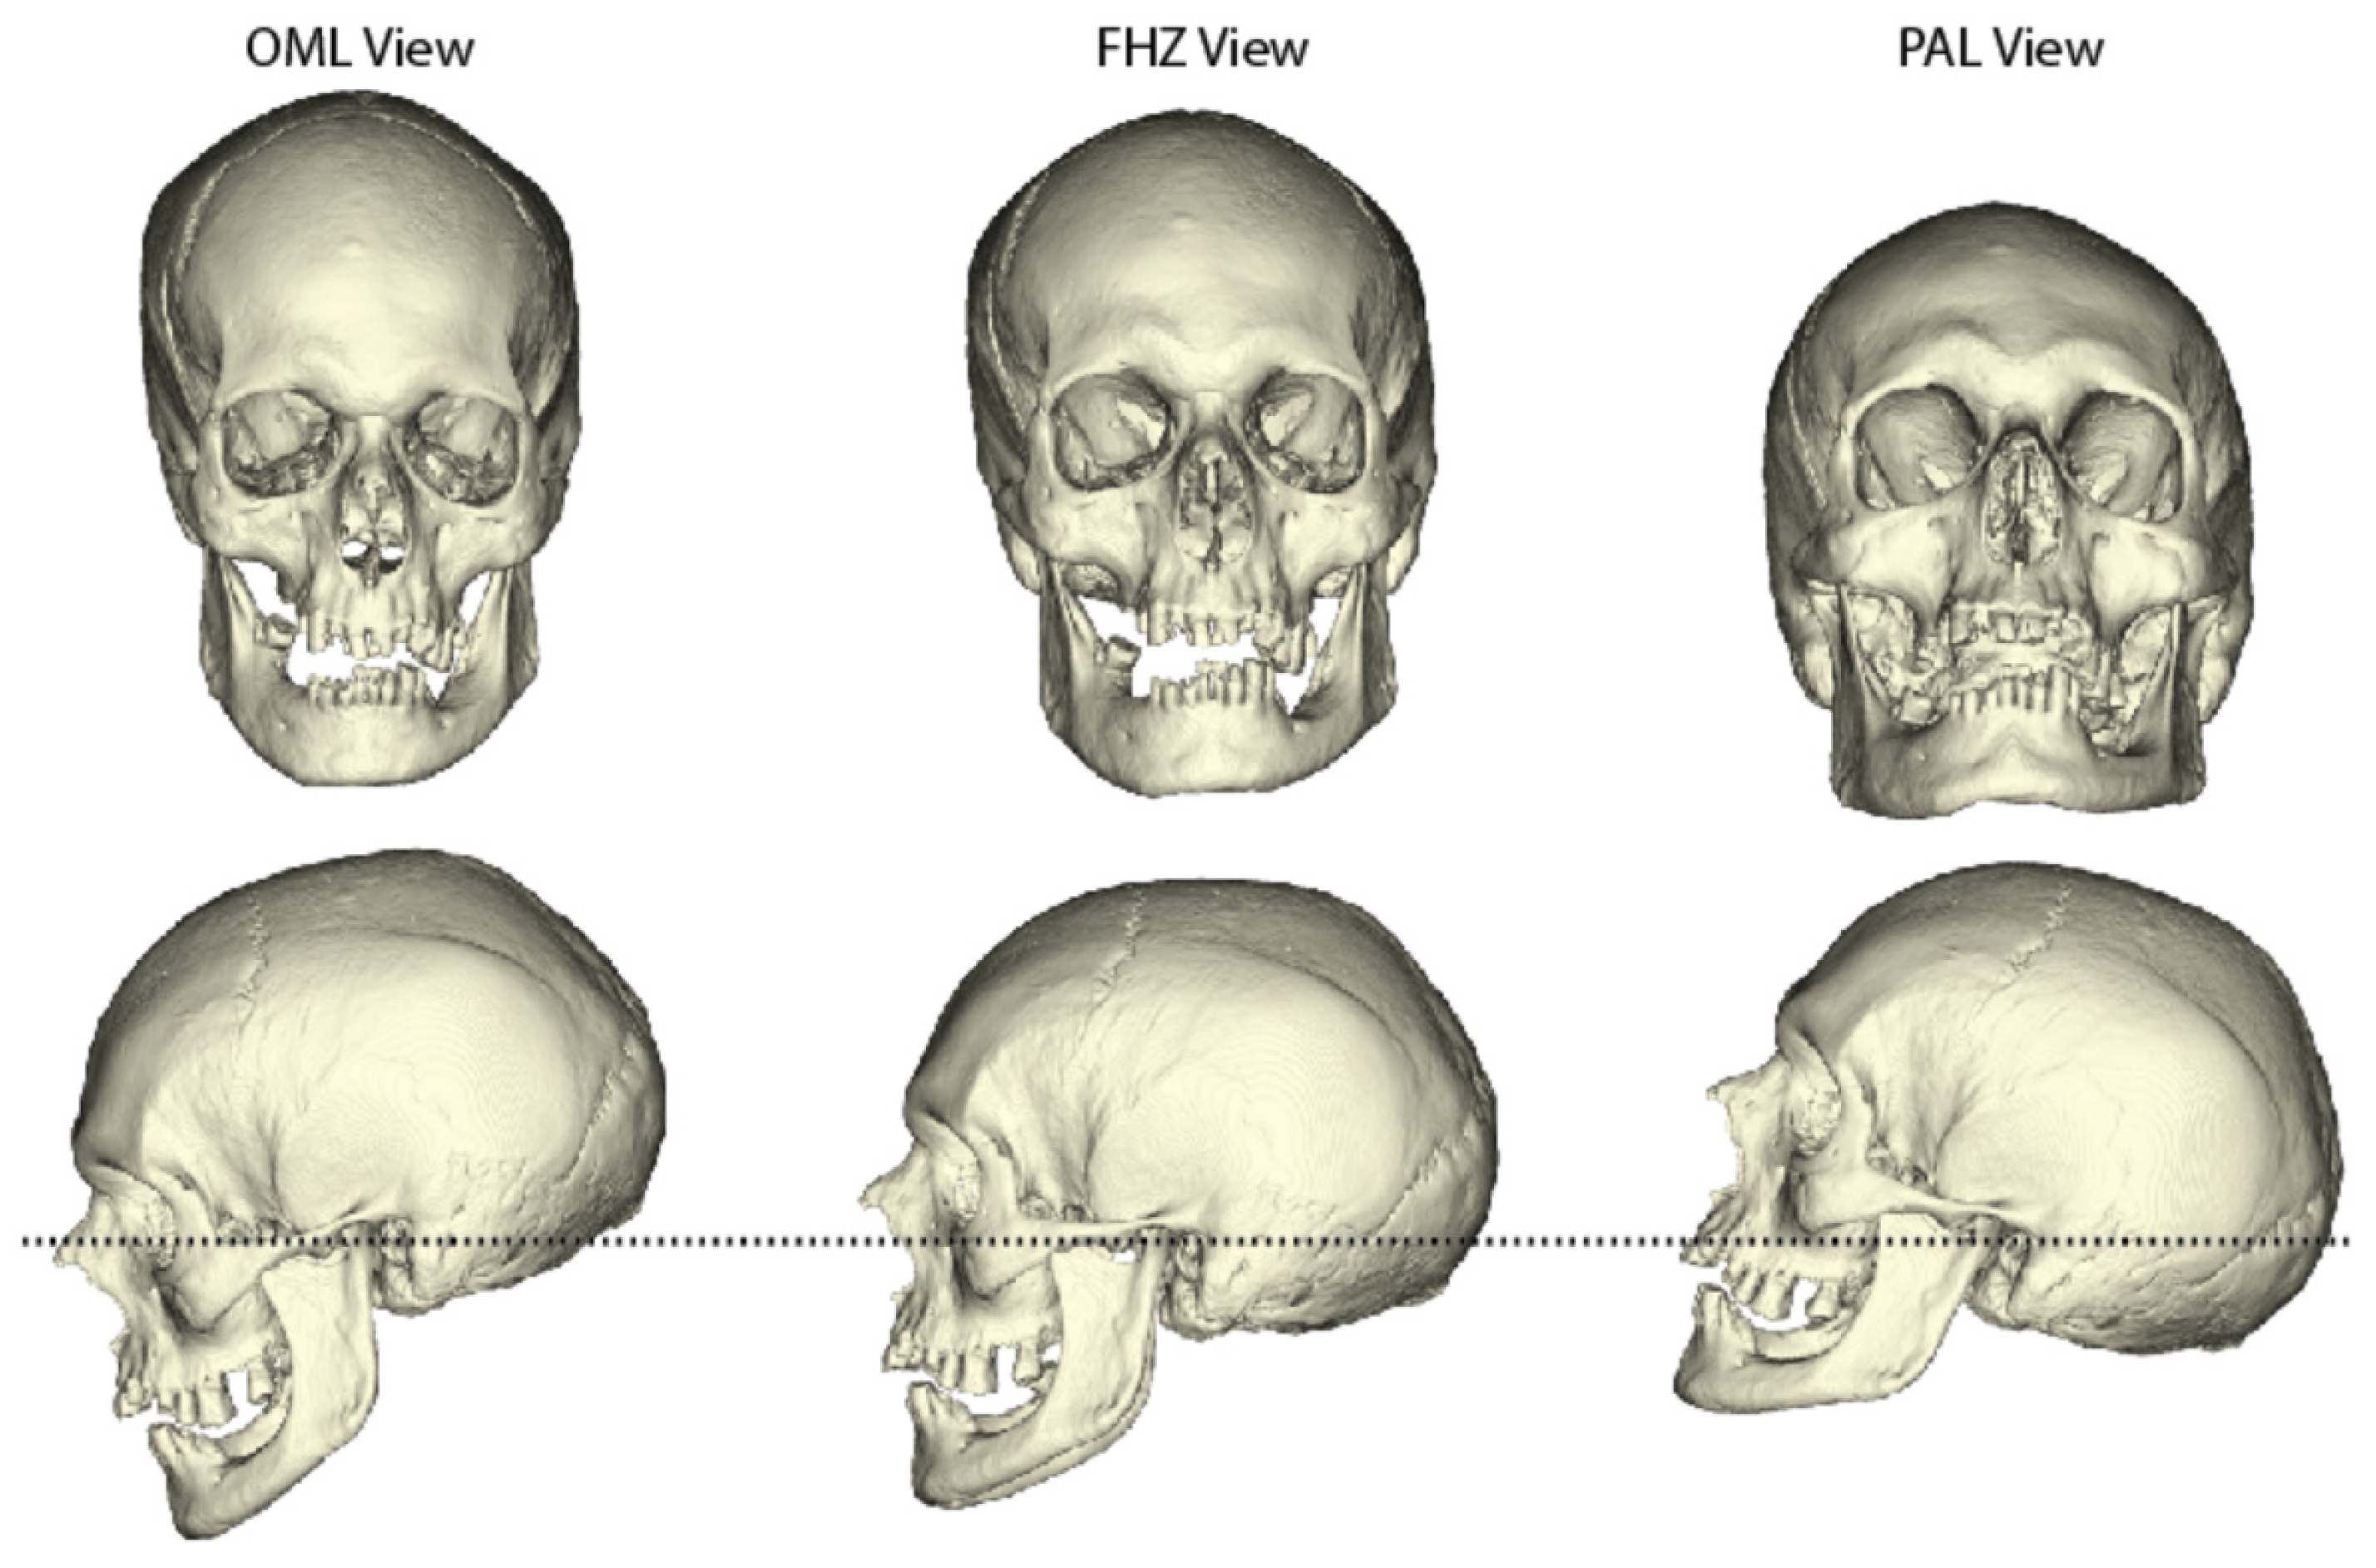
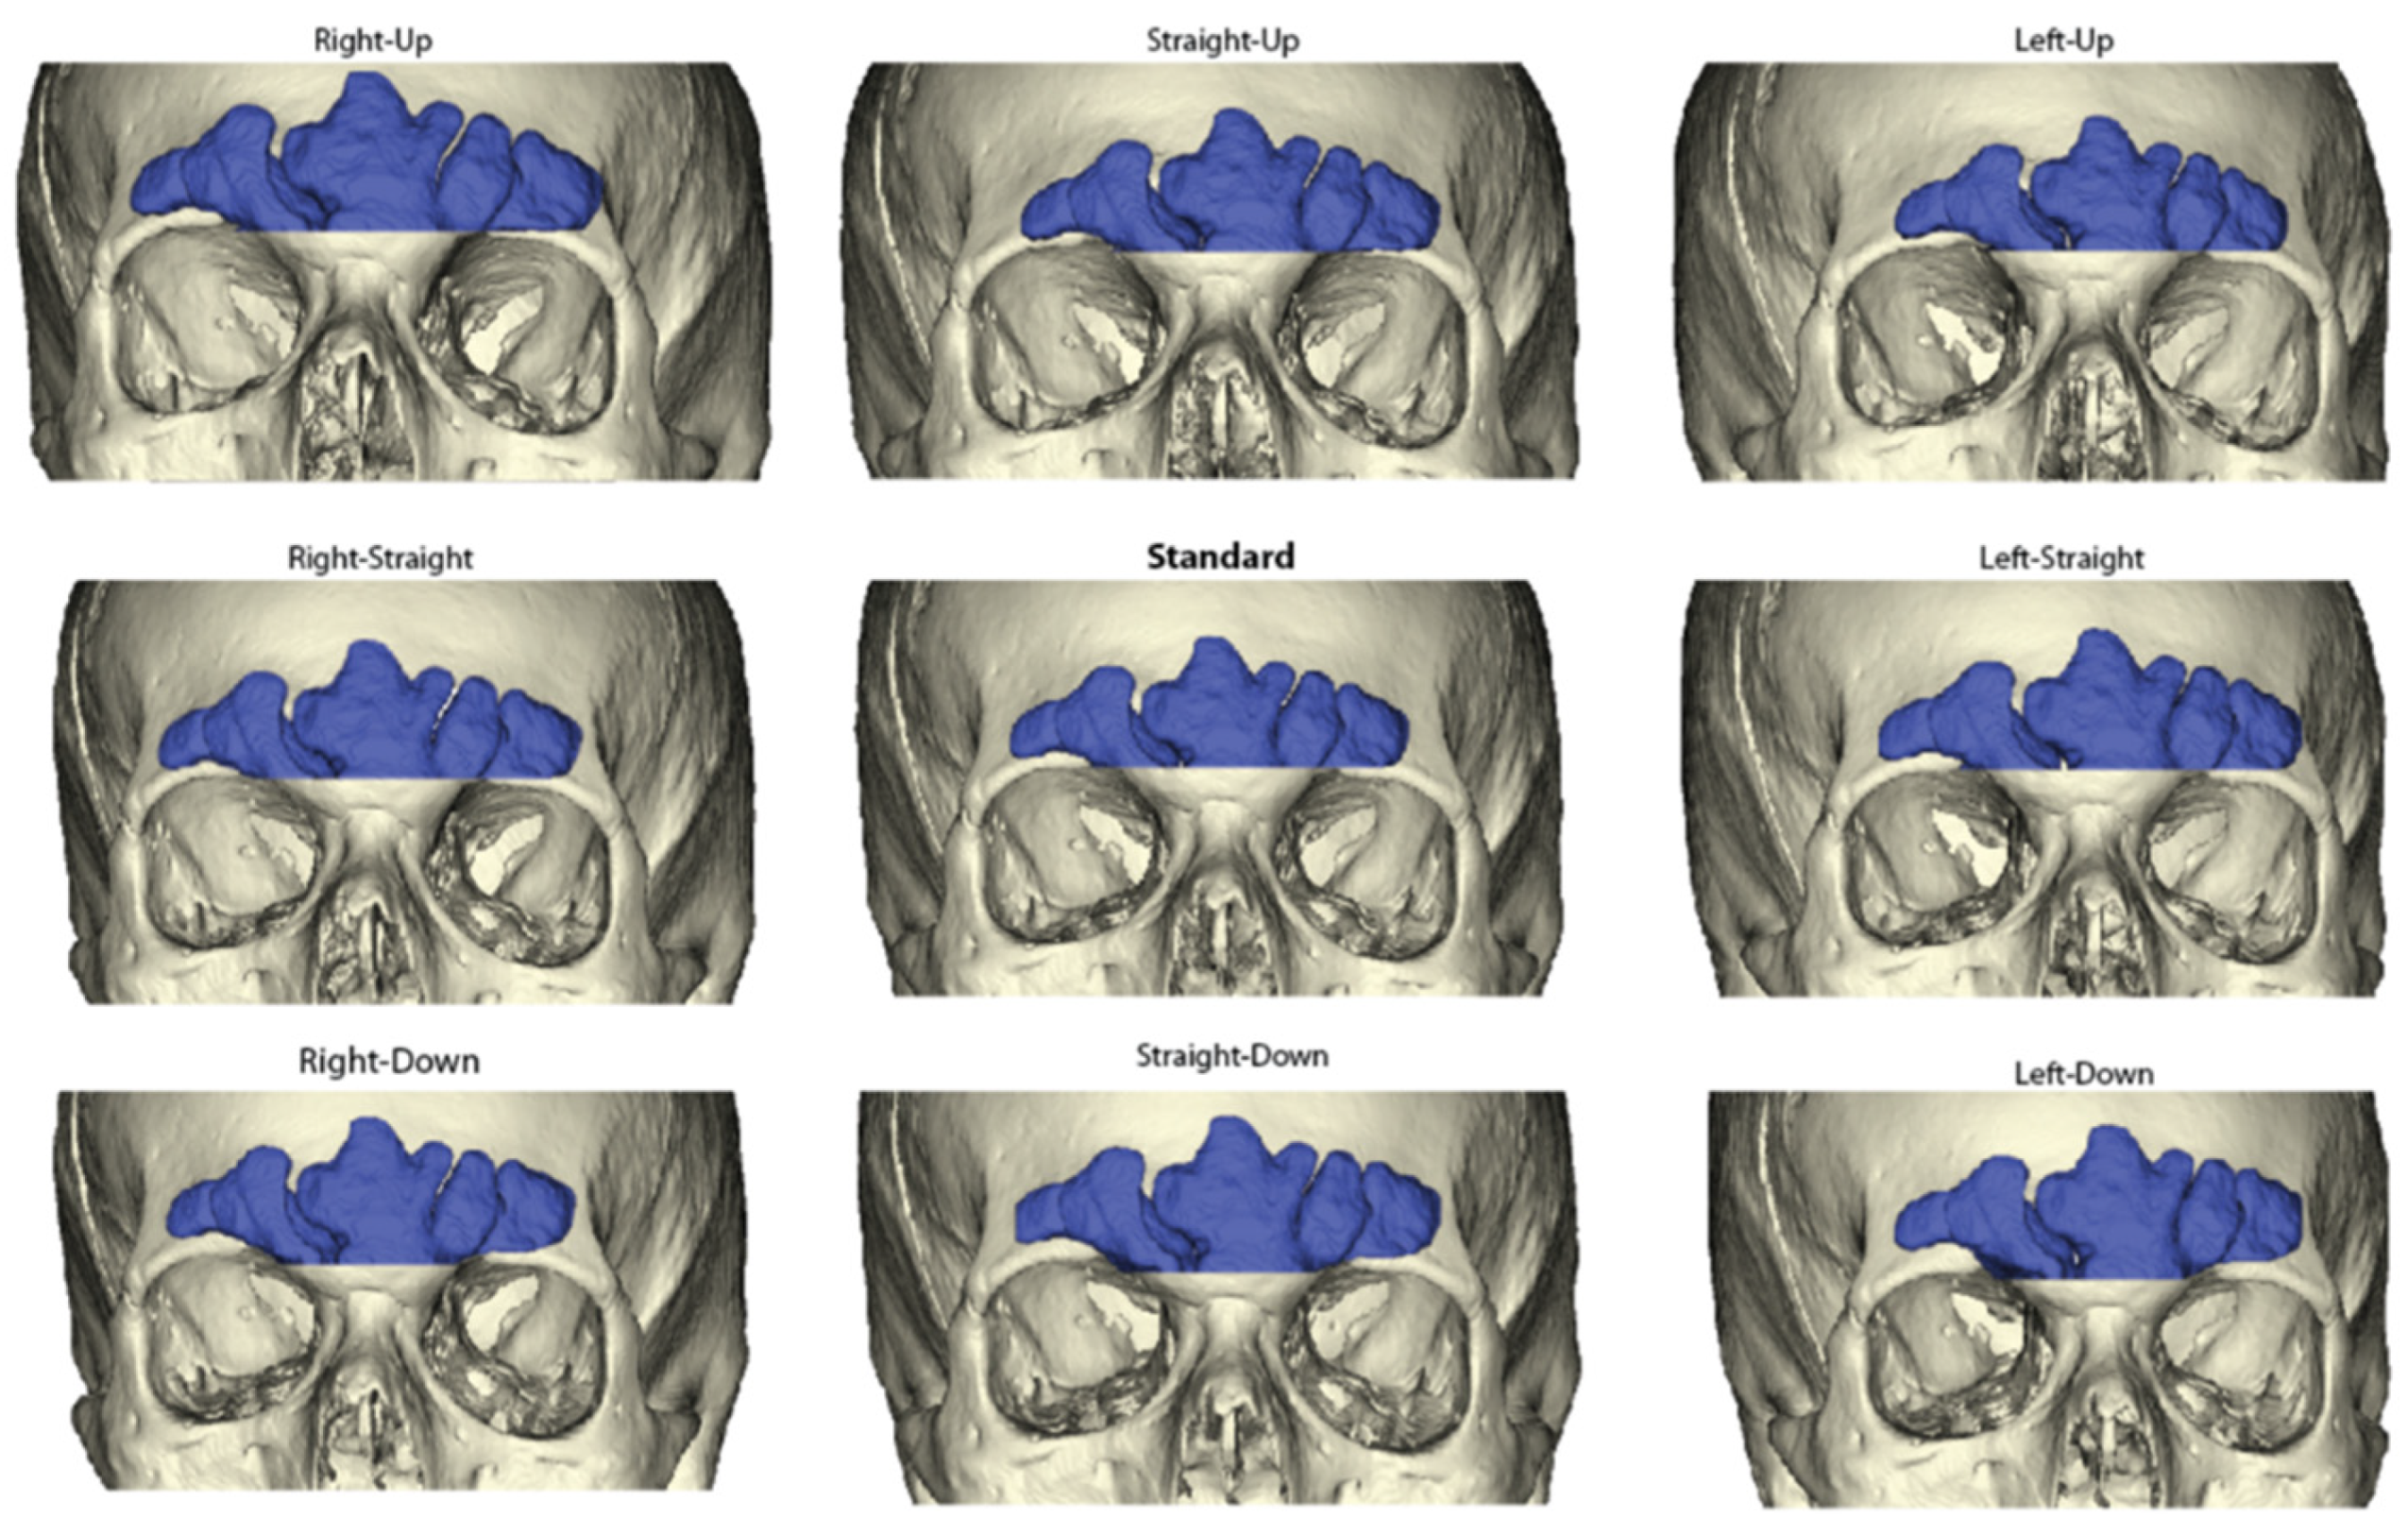
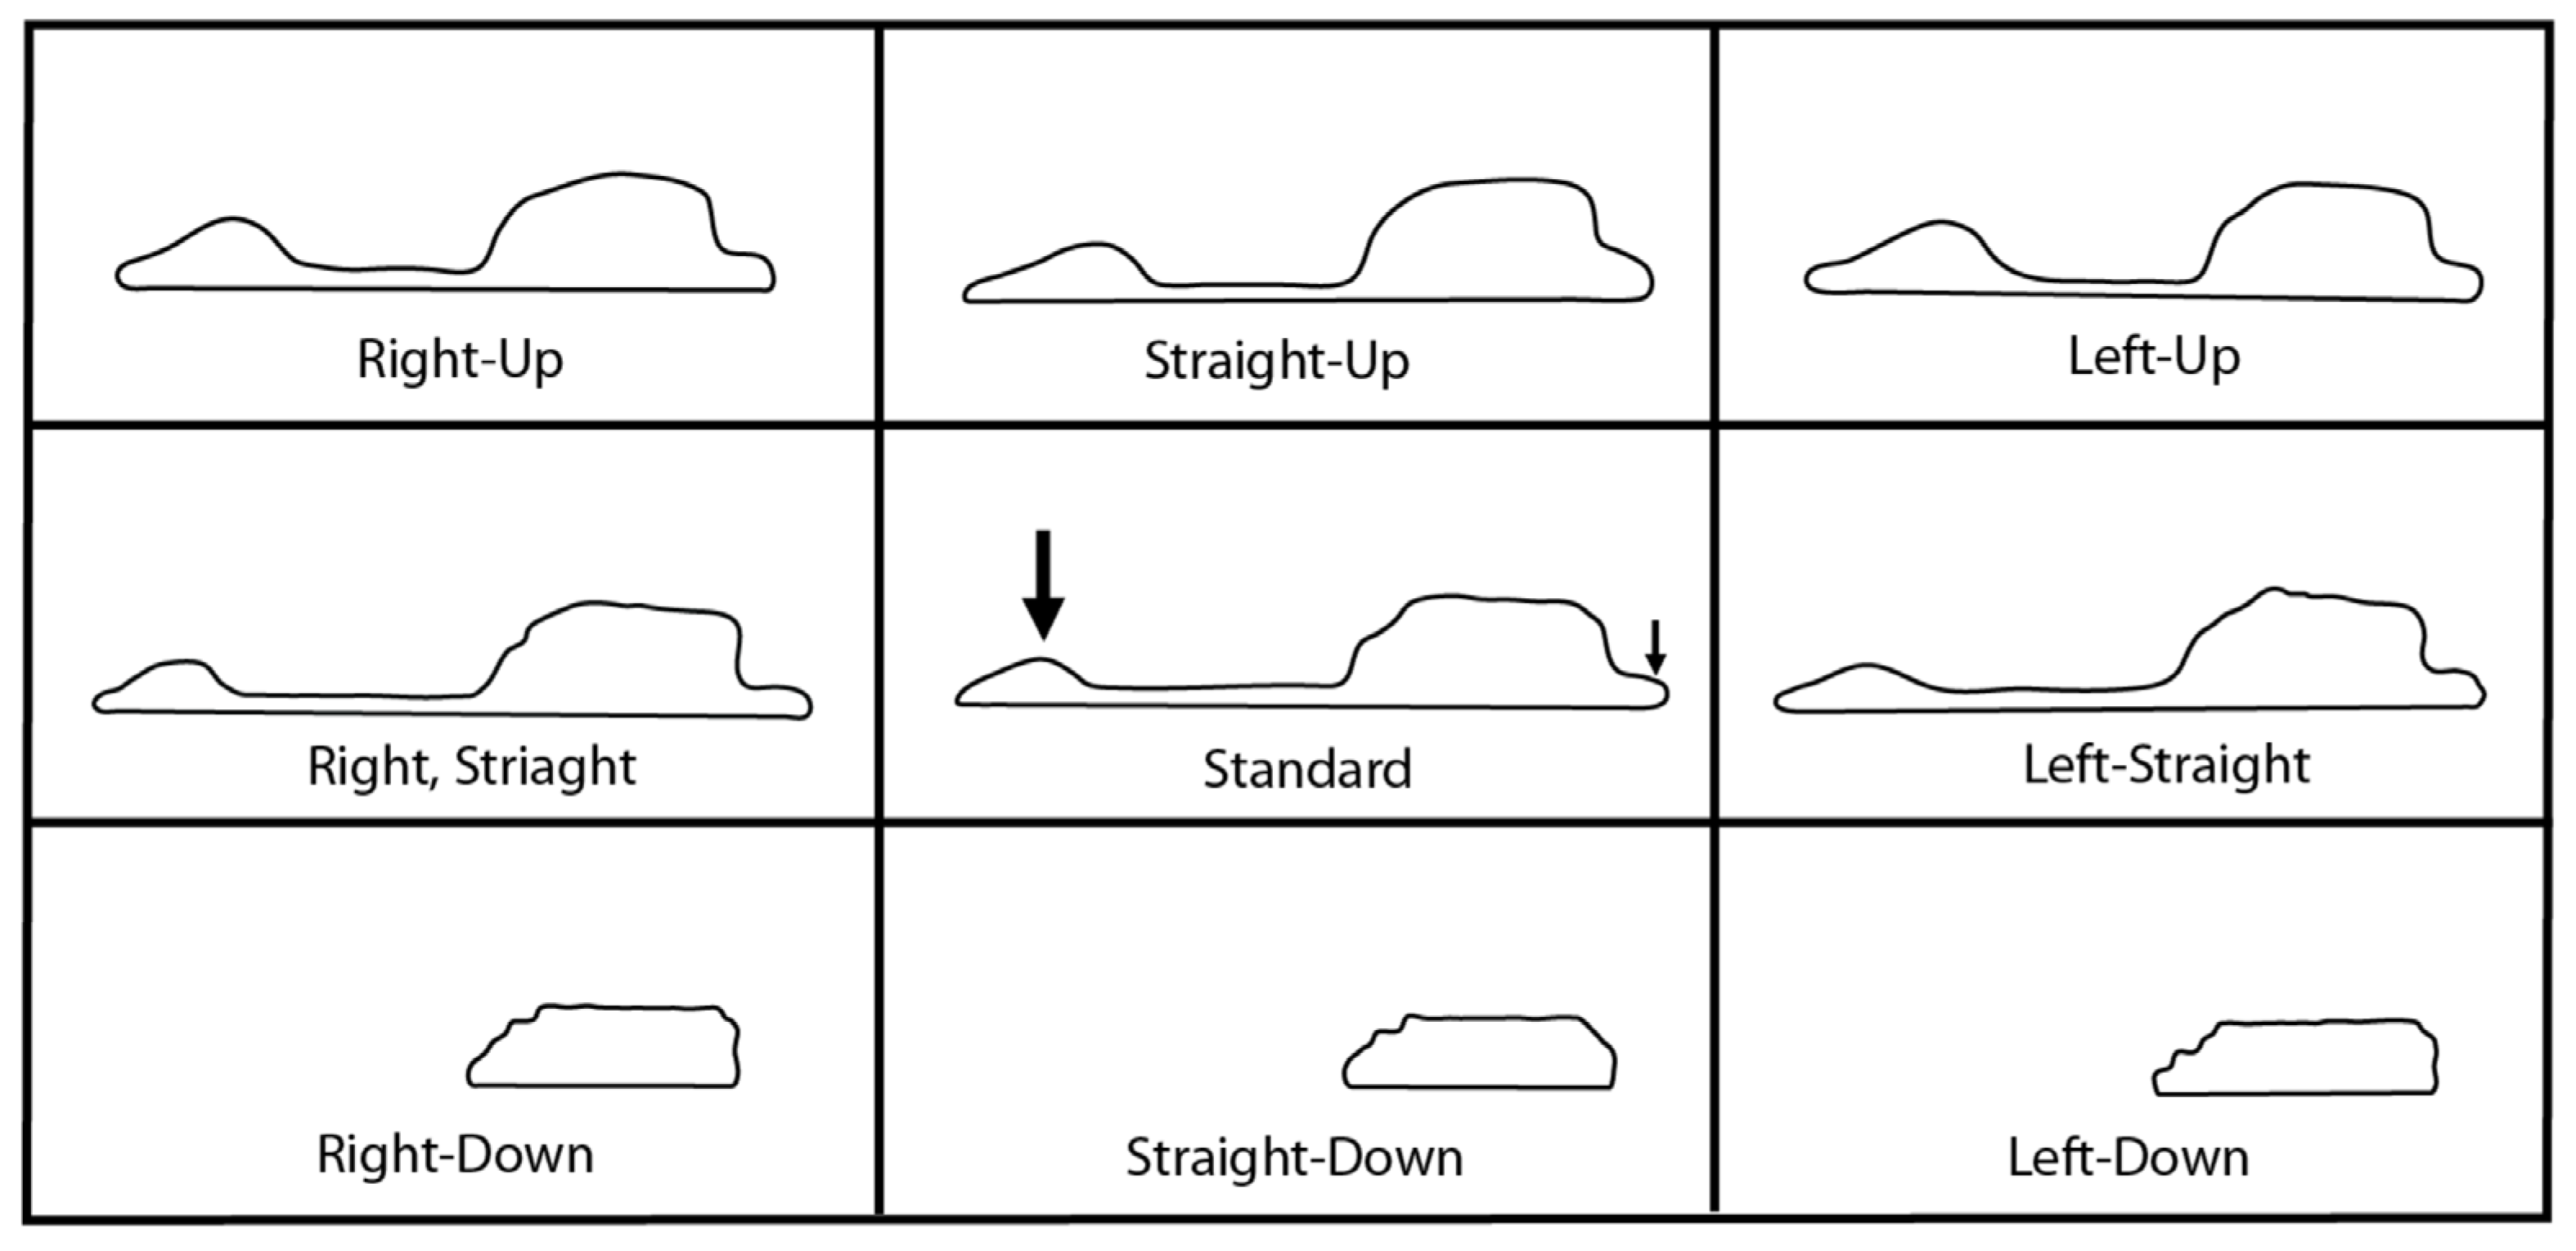
2.2. Sinus Orientations
2.3. Frontal Sinus Outlines
2.4. Statistical Analyses
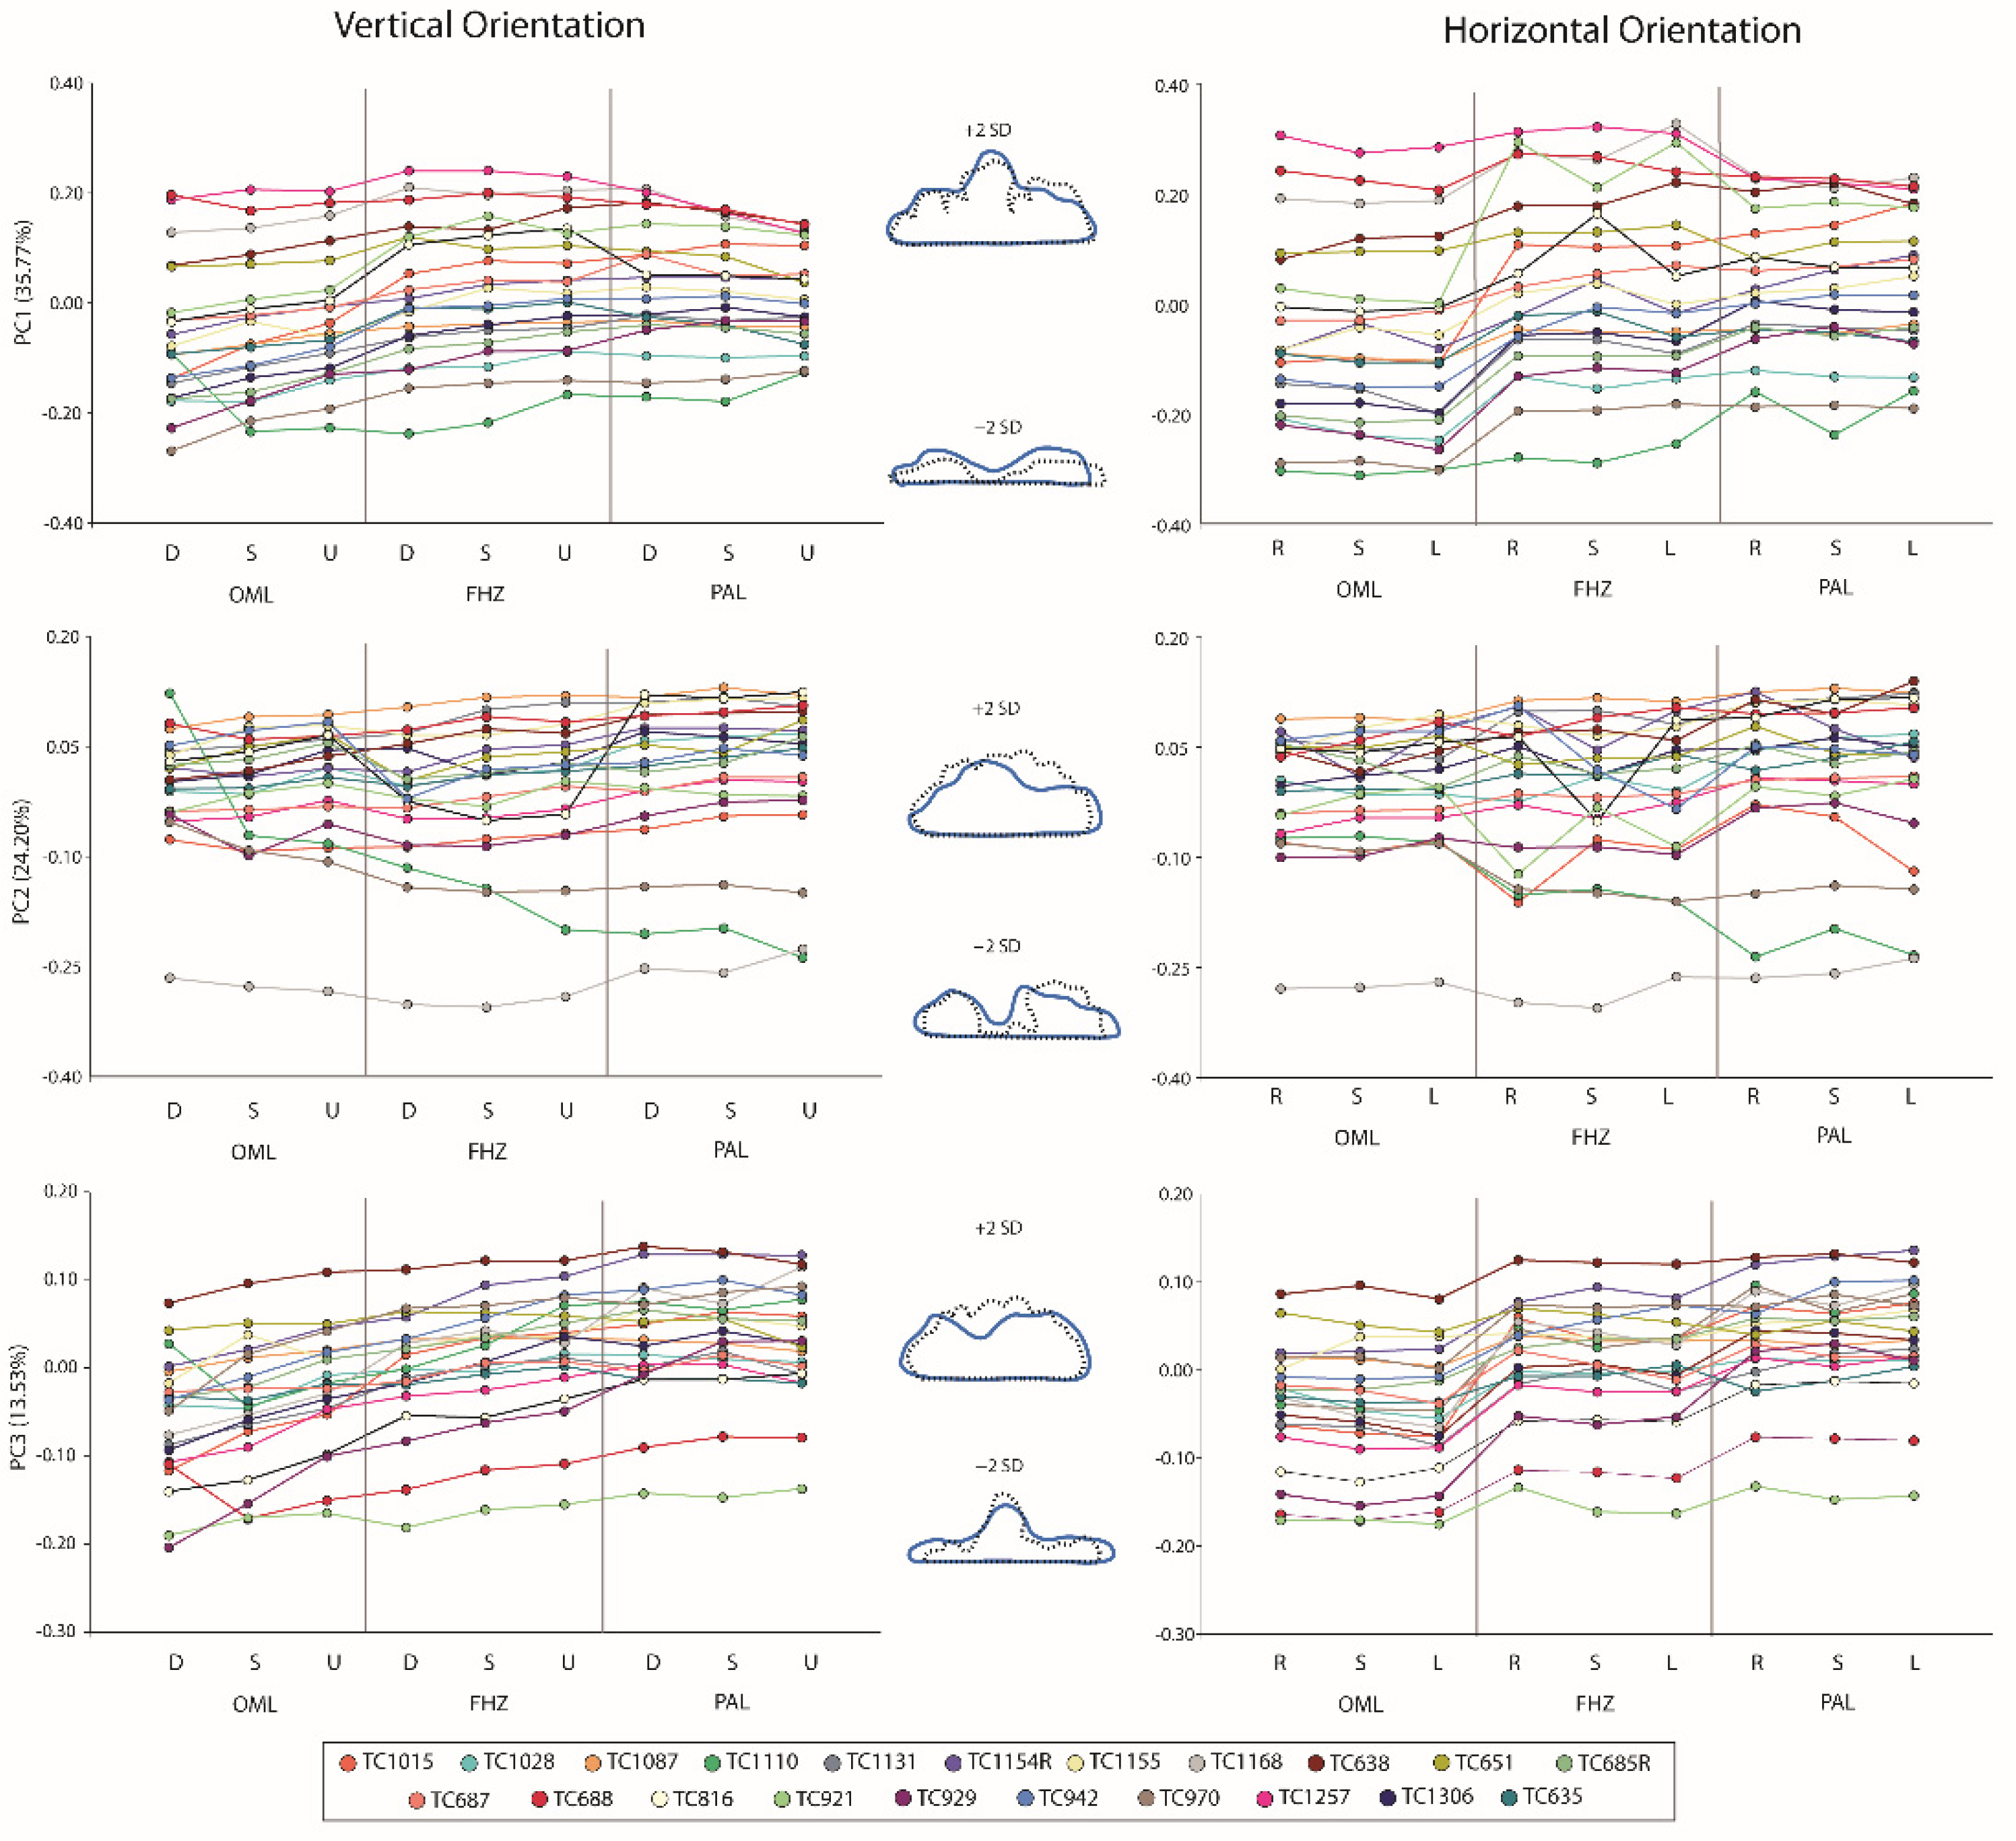
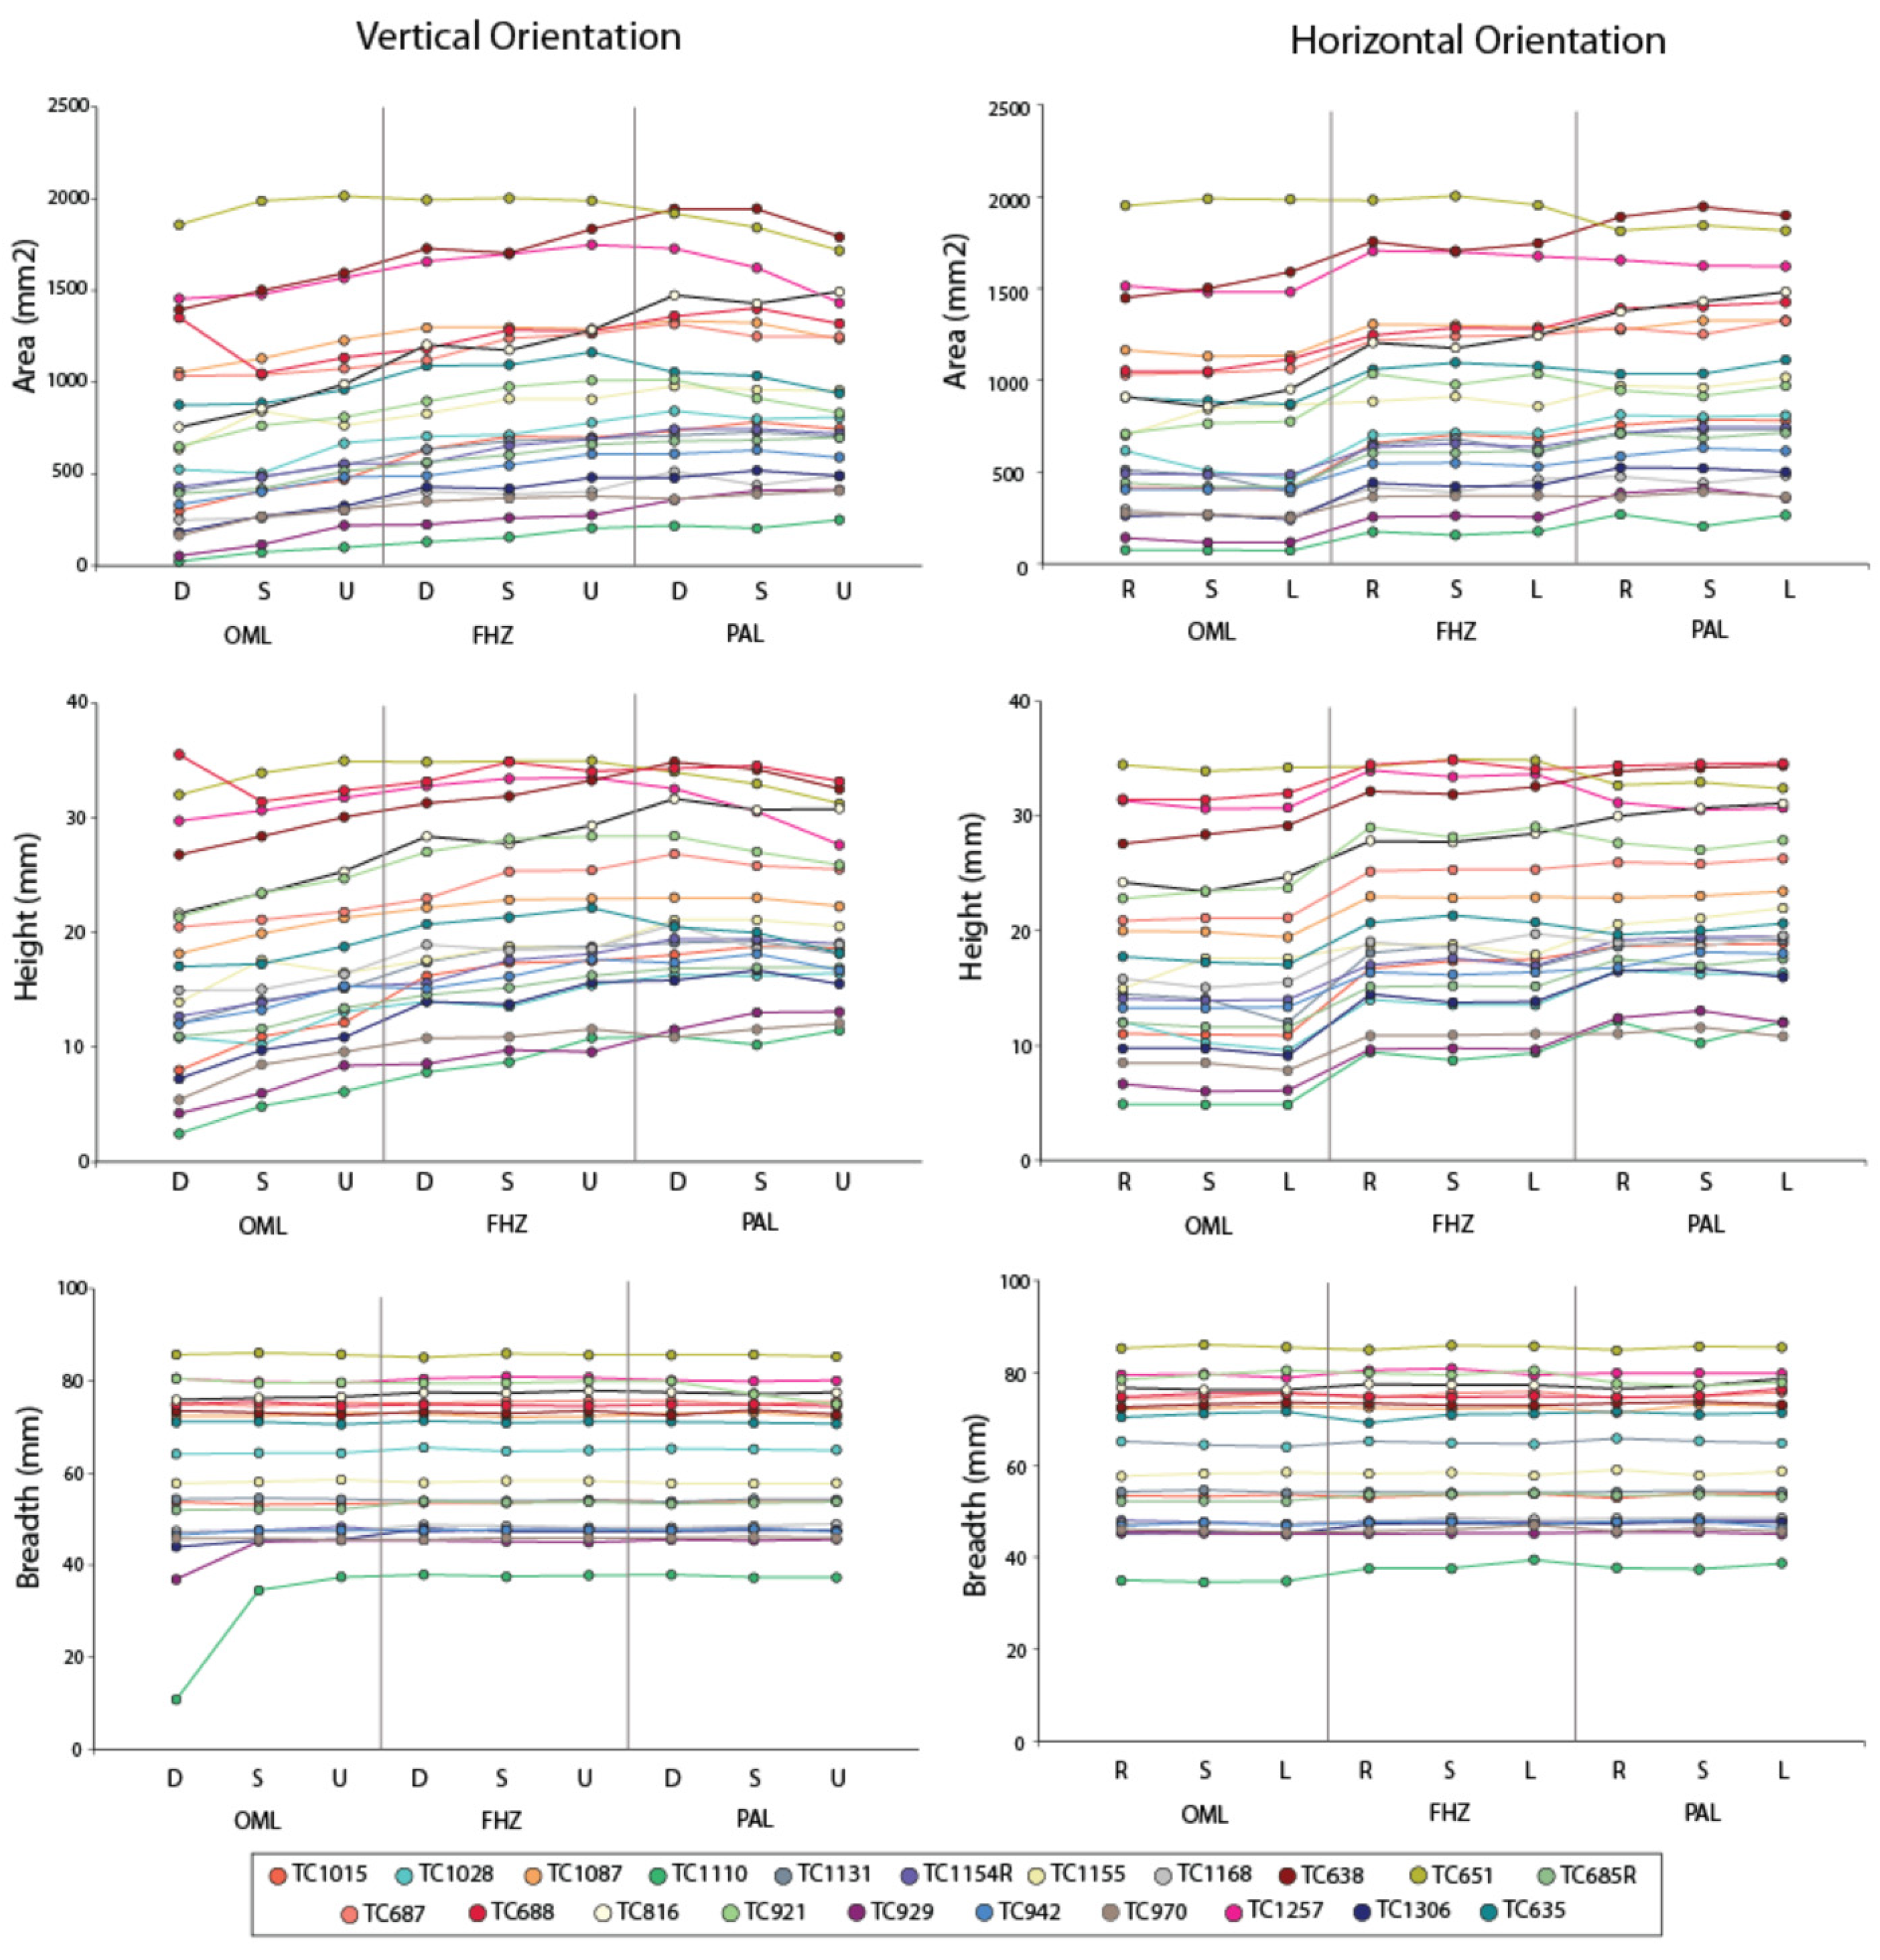
3. Results
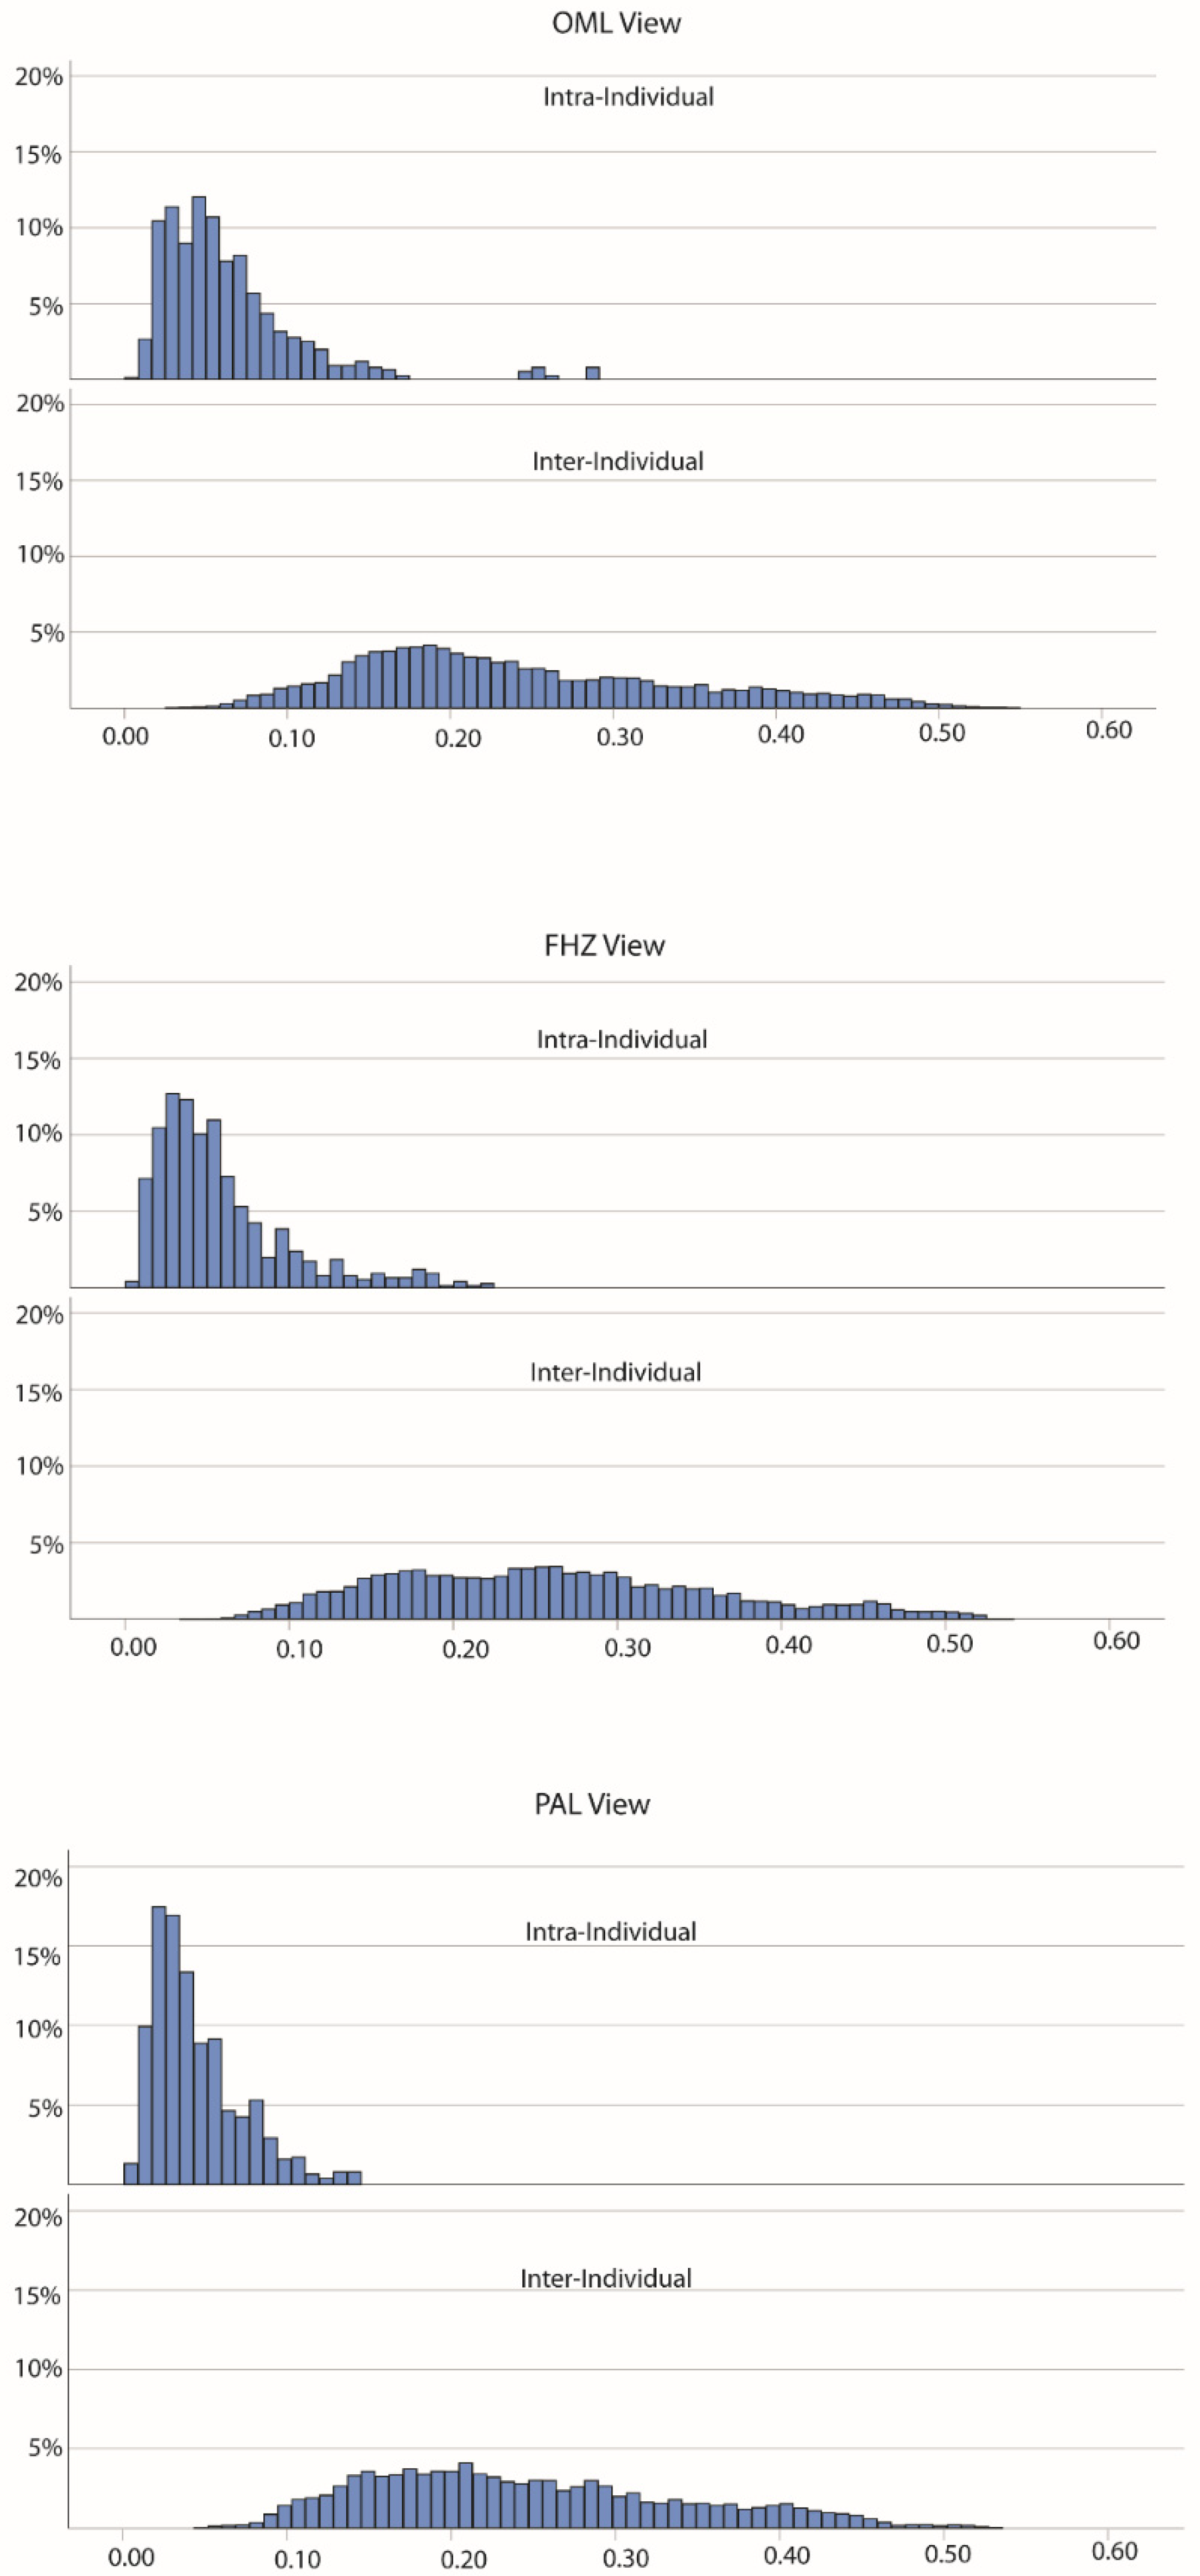
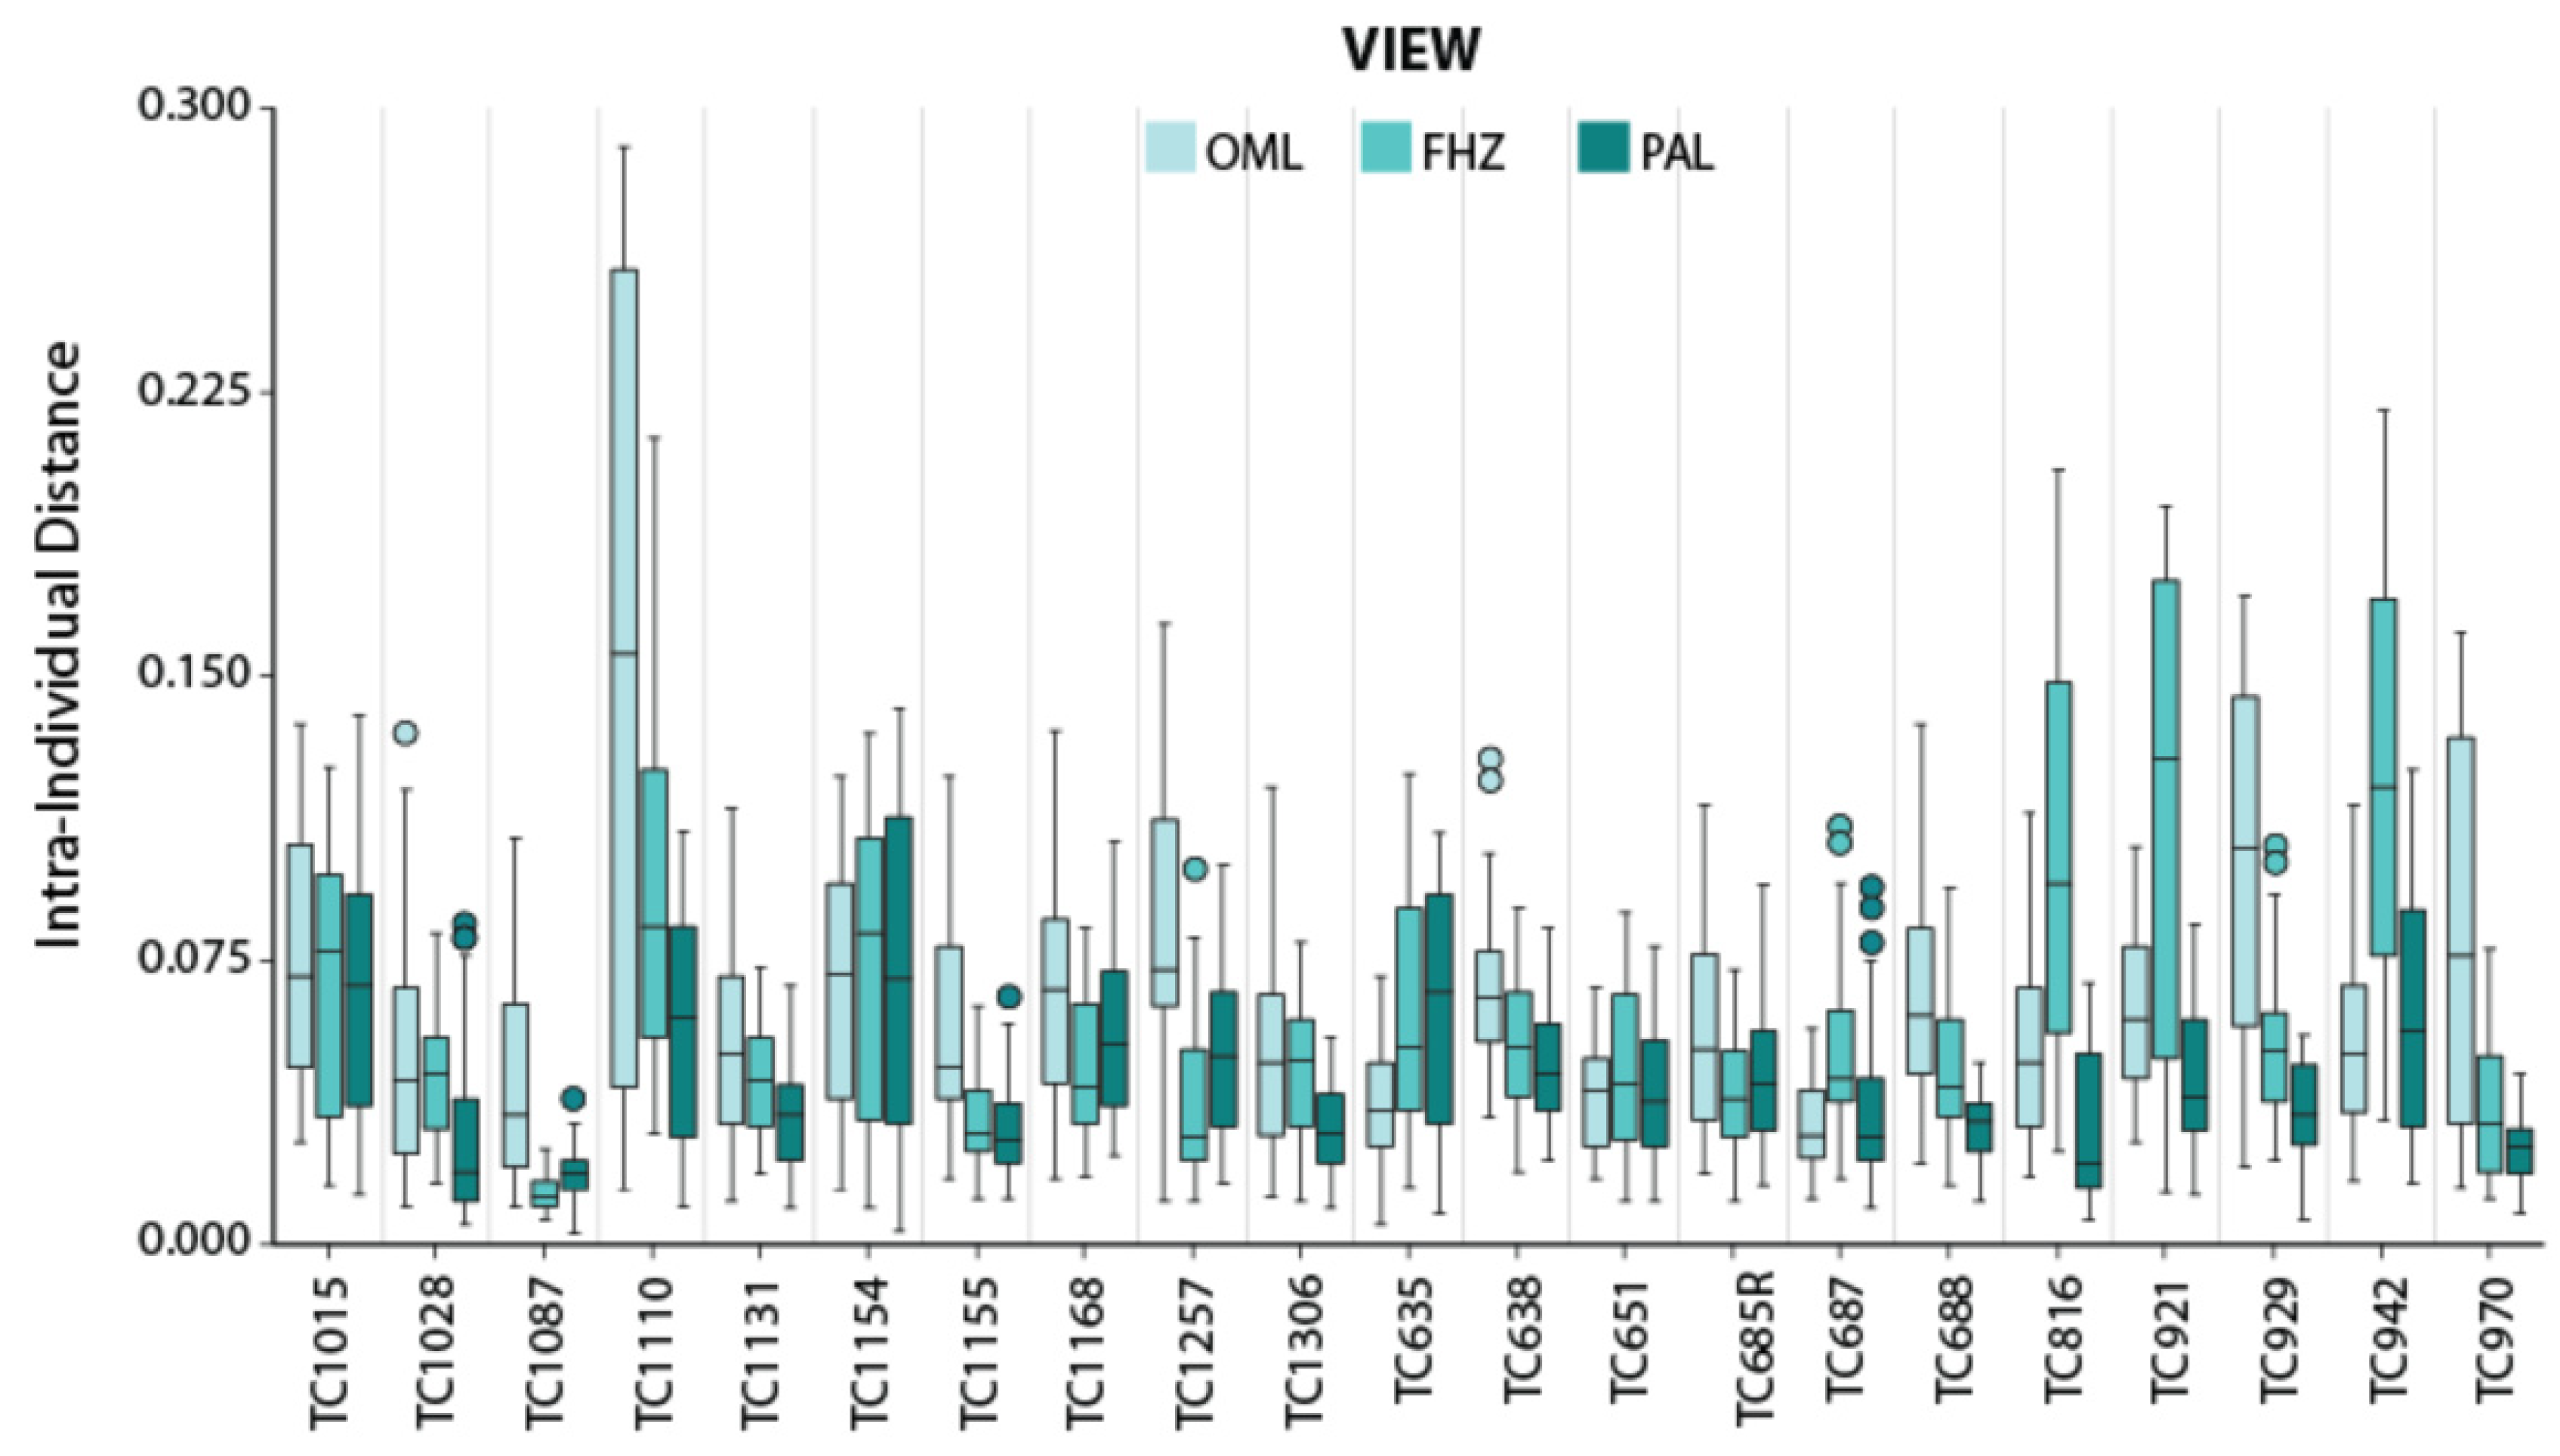
PC Distances
4. Discussion
4.1. Effect on Sinus Identification
4.2. Limitations and Future Directions
4.3. Recommendations on Sinus Identifications
5. Conclusions
Author Contributions
Funding
Institutional Review Board Statement
Informed Consent Statement
Data Availability Statement
Acknowledgments
Conflicts of Interest
Abbreviations
| CT | computed tomographic |
| EFA | elliptical Fourier analysis |
| FHZ | Frankfort Horizontal Plane |
| OML | Orbitomeatal Line |
| PA | posterior–anterior |
| PAL | Porion-Alveolar Line |
| PCA | principal components analysis |
| TC | Terry Collection |
References
- Culbert, W.L.; Law, F.L. Identification by comparison of roentgenograms of nasal accessory sinuses and mastoid processes. JAMA 1927, 88, 1634–1636. [Google Scholar] [CrossRef]
- Mayer, J. Identification by sinus prints. VA Med. Mon. 1935, 62, 517–519. [Google Scholar]
- Schuller, A. A note on the identification of skulls by X-ray pictures of the frontal sinuses. Med. J. Aust. 1943, 1, 554–556. [Google Scholar] [CrossRef]
- Murphy, W.A.; Spruill, F.G.; Gantner, G.E. Radiologic identification of unknown human remains. J. Forensic Sci. 1980, 25, 727–735. [Google Scholar] [CrossRef] [PubMed]
- Murphy, W.; Gantner, G. Radiologic examination of anatomic parts and skeletonized remains. J. Forensic Sci. 1982, 25, 727–735. [Google Scholar] [CrossRef]
- Ubelaker, D.H. Positive identification from radiographic comparison of frontal sinus patterns. In Human Identification—Case Studies in Forensic Anthropology; Rathbun, T.A., Buikstra, J.E., Eds.; CC Thomas: Springfield, IL, USA, 1984; pp. 399–411. [Google Scholar]
- Yoshino, M.; Miyasaka, S.; Sato, H.; Seta, S. Classification system of frontal sinus patterns by radiography. Its application to identification of unknown skeletal remains. Forensic Sci. Int. 1987, 34, 289–299. [Google Scholar] [CrossRef]
- Reichs, K.J.; Dorion, R.B.J. The use of computerized axial tomography scans in the comparison of frontal sinus configurations. Can. Soc. Forensic Sci. J. 1992, 25, 1–16. [Google Scholar] [CrossRef]
- Reichs, K.J. Quantified comparison of frontal sinus patterns by means of computed tomography. Forensic Sci. Int. 1993, 61, 141–168. [Google Scholar] [CrossRef]
- Haglund, W.; Fligner, C. Confirmation of human identification using computerized tomography (CT). J. Forensic Sci. 1993, 38, 708–712. [Google Scholar] [CrossRef] [PubMed]
- Owsley, D. Identification of the fragmentary, burned remains of two us journalists seven years after their disappearance in Guatemala. J. Forensic Sci. 1993, 38, 1372–1383. [Google Scholar] [CrossRef] [PubMed]
- Quatrehomme, G.; Fronty, P.; Sapanet, M.; Grevin, G.; Bailet, P.; Ollier, A. Identification by frontal sinus pattern in forensic anthropology. Forensic Sc.i Int. 1996, 83, 147–153. [Google Scholar] [CrossRef]
- Nambiar, P.; Naidu, M.D.; Subramaniam, K. Anatomical variability of the frontal sinuses and their application in forensic identification. Clin. Anat. 1999, 12, 16–19. [Google Scholar] [CrossRef]
- Smith, D.R.; Limbird, K.G.; Hoffman, J.M. Identification of human skeletal remains by comparison of bony details of the cranium using computerized tomographic (CT) scans. J. Forensic Sci. 2002, 47, 937–939. [Google Scholar] [CrossRef]
- Christensen, A.M. Assessing the variation in individual frontal sinus outlines. Am. J. Phys. Anthropol. 2004, 127, 291–295. [Google Scholar] [CrossRef] [PubMed]
- Christensen, A.M. Testing the reliability of frontal sinuses in positive identification. J. Forensic Sci. 2005, 50, JFS2004145-5. [Google Scholar] [CrossRef]
- Tatlisumak, E.; Ovali, G.Y.; Aslan, A.; Asirdizer, M.; Zeyfeoglu, Y.; Tarhan, S. Identification of unknown bodies by using CT images of frontal sinus. Forensic Sci. Int. 2007, 166, 42–48. [Google Scholar] [CrossRef] [PubMed]
- Campobasso, C.P.; Dell’Erba, A.S.; Belviso, M.; Di Vella, G. Craniofacial idendentification by comparison of antemortem and postmoretm radiographs: Two case reports dealing with burnt bodies. Am. J. Forensic Med. 2007, 28, 182–186. [Google Scholar] [CrossRef]
- Asherson, N. Identification by Frontal Sinus Prints; HK Lewis: London, UK, 1965. [Google Scholar]
- Cryer, M. Some variations in the frontal sinuses. JAMA 1907, 48, 284–289. [Google Scholar] [CrossRef] [Green Version]
- Ribeiro, F.A.Q. Standardized measurements of radiographic films of the frontal sinuses: An aid to identifying unknown persons. Ear Nose Throat J. 2000, 79, 26–33. [Google Scholar] [CrossRef]
- Cameriere, R.; Scendoni, R.; Lin, Z.; Milani, C.; Palacio, L.A.; Turiello, M.; Ferrante, L. Analysis of frontal sinuses for personal identificaiton in a Chinese sample using a new code number. J. Forensic Sci. 2020, 65, 46–51. [Google Scholar] [CrossRef] [PubMed] [Green Version]
- Cox, M.; Malcolm, M.; Fairgrieve, S.I. A new digital method for the objective comparison of frontal sinuses for identification. J. Forensic Sci. 2009, 54, 761–772. [Google Scholar] [CrossRef]
- Yanagisawa, E.; Smith, H.M. Radiographic anatomy of the paranasal sinuses iv. Caldwell view. Arch. Otolaryngol. 1968, 87, 109–120. [Google Scholar] [CrossRef]
- Silva, R.F.; Vaz, C.G.; Domiciano, M.L.; Franco, A.; Carla Ap, B.D.C.; do Prado, M.M. Radiographic alterations of the frontal sinus morphology according to variations of the vertical angle in posterior-anterior radiographs of the skull. Acta Sci. Health Sci. 2014, 36, 113–117. [Google Scholar] [CrossRef] [Green Version]
- Nikolova, S.; Toneva, D.; Georgiev, I.; Dandov, A.; Lazarov, N. Morphometric analysis of the frontal sinus: Application of industrial digital radiography and virtual endocast. J. Forensic Radiol. Imaging 2018, 12, 31–39. [Google Scholar] [CrossRef]
- Riepert, T.; Ulmcke, D.; Schweden, F.; Nafe, B. Identification of unknown dead bodies by x-ray image comparison of the skull using the X-ray simulation program FoXSIS. Forensic Sci. Int. 2001, 117, 89–98. [Google Scholar] [CrossRef]
- Christensen, A.M. An Empirical Examination of Frontal Sinus Outline Variability Using Elliptic Fourier Analysis: Implications for Identification, Standardization, and Legal Admissibility. Ph.D. Thesis, University of Tennessee, Knoxville, TN, USA, 2003. [Google Scholar]
- Hashim, N.; Hemalatha, N.; Thangaraj, K.; Kareem, A.; Ahmed, A.; Hassan, N.F.; Jayaprakash, P.T. Practical relevance of prescribing superimposition for determing a frontal sinus pattern match. Forensic Sci. Int. 2015, 253, 137.e1–137.e7. [Google Scholar] [CrossRef]
- Ubelaker, D.H.; Shamlou, A.; Kunkle, A. Contributions of forensic anthropology to positive scientific identification: A critical review. Forensic Sci. Res. 2018, 4, 45–50. [Google Scholar] [CrossRef]
- Hunt, D.R.; Albanese, J. History and demographic composition of the Robert J. Terry anatomical collection. Am. J. Phys. Anthropol. 2005, 127, 406–417. [Google Scholar] [CrossRef]
- Copes, L.E. Comparative and Experimental Investigations of Cranial Robusticity in Mid-Pleistocene Hominins. Ph.D. Thesis, Arizona State University, Tempe, AZ, USA, 2012. [Google Scholar]
- Copes, L.E. CT Scans of Modern Homo Sapiens. 2012. Available online: https://www.lynncopes.com/human-ct-scans.html (accessed on 1 December 2021).
- Buck, L.T.; Stringer, C.B.; MacLarnon, A.M.; Rae, T.C. Variation in paranasal pneumatisation between mid-Late Pleistocene hominins. Bull. Mémoires Société d’Anthropologie Paris 2019, 31, 14–33. [Google Scholar] [CrossRef]
- Sardi, M.L.; Joosten, G.G.; Pandiani, C.D.; Gould, M.M.; Anzelmo, M.; Ventrice, F. Frontal sinus ontogeny and covariation with bone structures in a modern human population. J. Morphol. 2018, 279, 871–882. [Google Scholar] [CrossRef] [PubMed]
- Butaric, L.N.; Buck, L.T.; Balzeau, A.; Grine, F.E. The paranasal sinuses of the Hofmeyr cranium. In Hofmeyr—A Late Pleistocene Human Skull from South Africa; Grine, F.E., Ed.; Springer: Dordrecht, the Netherlands, in press.
- Stalling, D.; Westerhoff, M.; Hege, H.-C. Amira: A highly interactive system for visual data analysis. In The Visualization Handbook; Hansen, C.D., Johnson, C.R., Eds.; Elsevier Butterworth–Heinemann: Burlington, MA, USA, 2005; pp. 749–767. [Google Scholar]
- Butaric, L.N.; Stansfield, E.; Vasilyev, A.Y.; Vasilyev, S. CT-based descriptions of the paranasal complex of Sungir-1, an Upper Paleolithic European. PaleoAnthorpology 2019, 2019, 389–399. [Google Scholar]
- Oh, S.; Ahn, J.; Nam, K.U.; Paeng, J.Y.; Hong, J. Frankfort horizontal plane is an appropriate three-dimensinal reference in the evaluation of clinical and skeletal cant. J. Korean Assoc. Oral Maxillofac. Surg. 2013, 39, 71–76. [Google Scholar] [CrossRef] [Green Version]
- Gulsen, A.; Sibar, S.; Ozmen, S. Orthognathic treatment of facial asymmetry due to temporomandibular joint ankylosis. Arch. Plast. Surg. 2018, 45, 74–79. [Google Scholar] [CrossRef] [Green Version]
- Chen, K.; Xiao, D.; Abotaleb, B.; Chen, H.; Li, Y.; Zhu, S. Accuracy of virtual surgical planning in treatment of temporomandibular joint ankylosis using distraction osteogenesis: Comparison of planned and actual results. J. Oral Maxillofac. Surg. 2018, 76, 2422.e1–2422.e20. [Google Scholar] [CrossRef]
- Zebeib, A.M.; Naini, F.B. Variability of the inclination of anatomic horizontal reference planes of the craniofacial complex in relation to the true horizontal line in orthognathic patients. Am. J. Orthod. Dentofac. Orthop. 2014, 146, 740–747. [Google Scholar] [CrossRef]
- Cameriere, R.; Ferrante, L.; Molleson, T.; Brown, B. Frontal sinus accuracy in identification as measured by false positives in kin groups. J. Forensic Sci. 2008, 53, 1280–1282. [Google Scholar] [CrossRef]
- Buyuk, S.K.; Karaman, A.; Yasa, Y. Association between frontal sinus morphology and craniofacial parameters: A forensic view. J. Forensic Leg. Med. 2017, 49, 20–23. [Google Scholar] [CrossRef] [PubMed]
- Zhao, H.; Li, Y.; Xue, H.; Deng, Z.H.; Liang, W.B.; Zhang, L. Morphological analysis of three-dimensionally reconstructed frontal sinuses from chinese han population using computed tomography. Int. J. Leg. Med. 2021, 135, 1015–1023. [Google Scholar] [CrossRef] [PubMed]
- Gasperini, G.; Cruz, R.L.; de Sá, R.T.; Cardoso, L.L.; de Cavalho, I.B. Assessment of the relationship of the Frankfort horizontal plane and the orbitomeatal line with attainment of the natural head position. J. Diag. Treat. Oral Maxillofac. Pathol. 2017, 1, 156–163. [Google Scholar] [CrossRef]
- Merrell, R.A.; Yanagisawa, E. Radiographic anatomy of the paranasal sinuses: I. Water’s view. Arch. Otolaryngol. 1968, 87, 88–99. [Google Scholar] [CrossRef] [PubMed]
- Fedorov, A.; Beichel, R.; Kalpathy-Cramer, J.; Finet, J.; Fillion-Robin, J.C.; Pujol, S.; Bauer, C.; Jennings, D.; Fennessy, F.; Sonka, M.; et al. 3D Slicer as an image computing platform for the quantitative imaging network. Magn. Reson. Imaging 2012, 30, 1323–1341. [Google Scholar] [CrossRef] [Green Version]
- Schneider, C.A.; Rasband, W.S.; Eliceiri, K.W. NIH Image to Imagej: 25 years of image analysis. Nat. Methods 2012, 9, 671–675. [Google Scholar] [CrossRef]
- Caple, J.; Byrd, J.; Stephan, C.N. Elliptical Fourier analysis: Fundamentals, applications, and value for forensic anthropology. Int. J. Leg. Med. 2017, 131, 1675–1690. [Google Scholar] [CrossRef] [PubMed]
- Iwata, H.; Ukai, Y. SHAPE: A computer program package for quantitative evaluation of biological shapes based on elliptic fourier descriptors. J. Hered. 2002, 93, 384–385. [Google Scholar] [CrossRef] [PubMed] [Green Version]
- IBM Corporation. IBM SPSS Statistics for Windows, Version 28.0.; IBM Corp.: Armonk, NY, USA, 2021. [Google Scholar]
- Rosenberg, M.S. Passage: Pattern analysis, Spatial Statistics, and Geographic Exegesis, Version 2. 2008. Available online: www.passagesoftware.net (accessed on 31 December 2021).
- Christensen, A.M.; Hatch, G.M. Advances in the use of frontal sinuses for human identification. In New Perspectives in Forensic Human Skeletal Identification; Latham, K., Bartelink, E., Finnegan, M., Eds.; Academic Press: London, UK, 2018; pp. 227–240. [Google Scholar]
- Kirk, J.N.; Wood, R.E.; Goldstein, M. Skeletal identification using the frontal sinus region: A retrospective study of 39 cases. J. Forensic Sci. 2002, 47, 318–323. [Google Scholar] [CrossRef]
- Silva, R.F.; Rodrigues, L.G.; Manica, S.; Franco, R.P.A.V.; Franco, A. Human identification established by the analysis of frontal sinus seen in anteroposterior skull radiographs using the mento-naso technique. RBOL—Rev. Bras. Odontol. Leg. 2019, 6, 62–66. [Google Scholar] [CrossRef]
- Major, P.W.; Johnson, D.E.; Hesse, K.L.; Glover, K.E. Effect of head orientation on posterior anterior cephalometric landmark identification. Angle Orthod. 1996, 66, 51–60. [Google Scholar]
- Malkoc, S.; Sari, Z.; Usumez, S.; Koyuturk, A.E. The effect of head rotation on cephalometric radiographs. Eur. J. Orthodont. 2005, 27, 315–321. [Google Scholar] [CrossRef] [Green Version]
- Christensen, A.M. The impact of daubert: Implications for testimony and research in forensic anthropology (and the use of frontal sinuses in personal identification). J. Forensic Sci. 2004, 49, PAPER ID JFS2003185. [Google Scholar] [CrossRef]
- Daubert v. Merrell Dow Pharmaceuticals, Inc. 1993. Available online: https://embryo.asu.edu/pages/daubert-v-merrell-dow-pharmaceuticals-inc-1993 (accessed on 21 November 2021).
- President’s Committee of Advisors on Science and Technology. Report to the President on Forensic Science in Criminal Courts: Ensuring Scientific Validity of Feature-Comparison Methods; Executive Office of the President: Washington, DC, USA, 2016. [Google Scholar]
- Smith, V.A.; Christensen, A.M.; Myers, S.W. The reliability of visually comparing small frontal sinuses. J. Forensic Sci. 2010, 55, 1413–1415. [Google Scholar] [CrossRef]
- Butaric, L.N.; Jones, G.C.; Garvin, H.M. Revisiting global patterns of frontal sinus aplasia utilizing computed tomography. Forensic Sci. Int. 2020, 315, 110458. [Google Scholar] [CrossRef]
- Viner, M. Overview of advances in forensic radiological methods of human identification. In New Perspectives in Forensic Human Skeletal Identification; Latham, K.B., Finnegan, M., Eds.; Academic Press: London, UK, 2018; pp. 217–226. [Google Scholar]
- Choi, I.G.G.; Duailibi-Neto, E.F.; Beaini, T.L.; da Silva, R.L.B.; Chilvarguer, I. The frontal sinus cavity exhibits sexual dimorphism in 3d cone-beam ct images and can be used for sex determination. J. Forensic Sci. 2018, 63, 692–698. [Google Scholar] [CrossRef] [PubMed]
- Uthman, A.T.; Al-Rawi, N.H.; Al-Naaimi, A.S.; Tawfeeq, A.S.; Suhail, E.H. Evaluation of frontal sinus and skull measurements using spiral ct scanning: An aid in unknown person identification. Forensic Sci. Int. 2010, 197, 124.e1–124.e7. [Google Scholar] [CrossRef]
- Zhang, H.X.; Yang, C.B.; Guo, L.; Deng, Z.H. Forensic identification by coding of frontal sinus characteristics of CT. Fa Yi Xue Za Zhi 2011, 27, 13–16. [Google Scholar]
- Gach, P.; Tuchtan-Torrents, L.; Delteil, C.; Adalian, P.; Piercecchi, M.D.; Ebert, L.C.; Gorincour, G. Virtual reconstruction of paranasal sinuses from ct data: A feasibility study for forensic application. Diagn. Interv. Imaging 2019, 100, 163–168. [Google Scholar] [CrossRef]
- Brun, C.N.; Christensen, A.M.; Kravarski, M.; Gorincour, G.; Schweitzer, W.; Thali, M.J.; Gascho, D.; Hatch, G.M.; Ruder, T.D. Comparative radiologic identification with standardized single CT images of the paranasal sinuses— evaluation of inter-rater reliability. Forensic Sci. Int. 2017, 280, 81–86. [Google Scholar] [CrossRef]
- De Souza, L.A., Jr.; Marana, A.N.; Weber, S.A.T. Automatic frontal sinus recognition in computed tomography images for person identification. Forensic Sci. Int. 2018, 286, 252–264. [Google Scholar] [CrossRef] [Green Version]
- Kim, D.; Lee, U.; Park, S.; Kwak, D.; Han, S. Identification using frontal sinus by three-dimensional reconstruction from computed tomography. J. Forensic Sci. 2013, 58, 5–12. [Google Scholar] [CrossRef] [PubMed]
- Li, Y.; Xu, C.; Yu, D.; Xiong, T.; Zhao, H.; Xue, H.; Liang, W.B.; Deng, Z.H.; Zhang, L. Computer-aided superimposition of the frontal sinus via 3D reconstruction for comparative forensic identification. Int. J. Leg. Med. 2021, 135, 1993–2001. [Google Scholar] [CrossRef]
- Grabherr, S.; Baumann, P.; Minoiu, C.; Fahrni, S.; Mangin, P. Post-mortem imaging in forensic investigations: Current utility, limitations, and ongoing developments. Res. Rep. Forensic Med. Sci. 2016, 6, 25–37. [Google Scholar] [CrossRef]
- Weiss, D.; McLedo-Henning, D.; Waltke, H. Using advanced imaging technologies to enhance autopsy practices. NIJ J. 2018, 279, 27–33. [Google Scholar]
- Van Vlijmen, O.J.; Maal, T.J.; Bergé, S.J.; Bronkhorst, E.M.; Katsaros, C.; Kuijpers-Jagtman, A.M. A comparison between two-dimensional and three-dimensional cephalometry on frontal radiographs and on cone beam computed tomography scans of human skulls. Eur. J. Oral Sci. 2009, 117, 300–305. [Google Scholar] [CrossRef] [PubMed]


| Area | Breadth | Height | PC1 | PC2 | PC3 | |
|---|---|---|---|---|---|---|
| Area | - | 0.900 | 0.921 | 0.666 | 0.465 | 0.067 |
| p-value | - | <0.001 * | <0.001 * | <0.001 * | <0.001 * | 0.111 |
| Breadth | 0.900 | - | 0.873 | 0.615 | 0.295 | −0.249 |
| p-value | <0.001 * | - | <0.001 * | <0.001 * | <0.001 * | <0.001 * |
| Height | 0.931 | 0.873 | - | 0.840 | 0.380 | 0.019 |
| p-value | <0.001 * | <0.001 * | - | <0.001* | <0.001 * | 0.658 |
| PC1 | 0.666 | 0.615 | 0.840 | - | 0.092 | 0.068 |
| p-value | <0.001 * | <0.001 * | <0.001 * | - | 0.029 * | 0.104 |
| PC2 | 0.465 | 0.295 | 0.380 | 0.092 | - | 0.109 |
| p-value | <0.001 * | <0.001 * | <0.001 * | 0.029 * | - | 0.009 * |
| PC3 | 0.067 | −0.249 | 0.019 | 0.0368 | 0.109 | - |
| p-value | 0.111 | <0.001 * | 0.658 | 0.104 | 0.009 * | - |
| Orientation | PC1 | PC2 | PC3 | |||
|---|---|---|---|---|---|---|
| Median (IQR) | Z | Median (IQR) | Z | Median (IQR) | Z | |
| OML Standard | −0.075 (0.187) | − | 0.009 (0.109) | − | −0.044 (0.094) | − |
| Straight Down | −0.090 (0.184) | −2.798 * | 0.005 (0.082) | −0.261 | −0.042 (0.097) | −2.450 |
| Straight Up | −0.055 (0.174) | −3.424 * | 0.022 (0.109) | −3.076 * | −0.018 (0.069) | −3.389 * |
| Right Straight | −0.079 (0.191) | −1.477 | −0.004 (0.128) | −2.138 | −0.046 (0.090) | −1.373 |
| Right Down | −0.058 (0.171) | −2.798 * | 0.040 (0.144) | −1.651 | −0.015 (0.065) | −2.768 * |
| Right Up | −0.065 (0.177) | −3.076 * | 0.004 (0.071) | −0.052 | −0.052 (0.076) | −2.763 * |
| Left Straight | −0.068 (0.185) | −1.408 | 0.005 (0.123) | −0.226 | −0.030 (0.077) | −2.450 |
| Left Down | −0.065 (0.187) | −2.555 | 0.017 (0.133) | −1.651 | −0.009 (0.061) | −3.250 * |
| Left Up | −0.099 (0.163) | −3.111 * | 0.008 (0.095) | −0.087 | −0.047 (0.072) | −1.929 |
| FHZ Standard | 0.027 (0.188) | − | 0.012 (0.119) | − | 0.025 (0.066) | − |
| Straight Down | −0.009 (0.193) | −2.798 * | −0.005 (0.118) | −1.547 | −0.001 (0.058) | −3.667 * |
| Straight Up | 0.018 (0.180) | −1.964 | 0.019 (0.115) | −2.868 * | 0.034 (0.070) | −3.215 * |
| Right Straight | −0.013 (0.206) | −0.226 | 0.021 (0.167) | −0.365 | 0.028 (0.069) | −0.921 |
| Right Down | −0.031 (0.204) | −2.728 * | −0.011 (0.152) | −0.261 | −0.004 (0.075) | −3.806 * |
| Right Up | 0.004 (0.179) | −0.904 | 0.027 (0.127) | −2.763 * | 0.027 (0.066) | −2.589 |
| Left Straight | −0.016 (0.175) | −0.956 | 0.026 (0.179) | −0.608 | 0.025 (0.073) | −1.477 |
| Left Down | −0.009 (0.188) | −3.041 * | 0.013 (0.171) | −0.504 | 0.018 (0.070) | −2.311 |
| Left Up | 0.007 (0.195) | −0.991 | 0.028 (0.173) | −1.130 | 0.033 (0.075) | −3.945* |
| PAL Standard | 0.021 (0.163) | − | 0.042 (0.118) | − | 0.042 (0.062) | − |
| Straight Down | 0.029 (0.155) | −1.894 | 0.028 (0.120) | −2.346 | 0.032 (0.079) | −1.130 |
| Straight Up | 0.006 (0.163) | −2.207 | 0.054 (0.121) | −0.365 | 0.027 (0.087) | −1.790 |
| Right Straight | 0.037 (0.177) | −0.365 | 0.040 (0.132) | −0.365 | 0.034 (0.071) | −1.095 |
| Right Down | 0.030 (0.164) | −2.103 | 0.030 (0.108) | −2.103 | 0.034 (0.077) | −0.295 |
| Right Up | 0.007 (0.165) | −1.721 | 0.042 (0.116) | −0.400 | 0.026 (0.089) | −0.504 |
| Left Straight | 0.014 (0.147) | −0.156 | 0.048 (0.119) | −0.261 | 0.040 (0.066) | −0.261 |
| Left Down | 0.023 (0.162) | −1.581 | 0.045 (0.133) | −0.956 | 0.041 (0.079) | −0.017 |
| Left Up | −0.004 (0.162) | −2.207 | 0.055 (0.126) | −1.130 | 0.026 (0.087) | −0.747 |
| Orientation | Area (cm2) | Height (cm) | Breadth (cm) | |||
|---|---|---|---|---|---|---|
| Median (IQR) | Z | Median (IQR) | Z | Median (IQR) | Z | |
| OML Standard | 5.037 (7.077) | − | 1.505 (1.287) | − | 5.815 (2.769) | − |
| Straight Down | 5.251 (7.719) | −3.146 * | 1.394 (1.209) | −3.181 * | 5.783 (2.823) | −1.303 |
| Straight Up | 6.681 (7.064) | −3.597 * | 1.638 (1.239) | −3.806 * | 5.862 (2.753) | −0.800 |
| Right Straight | 4.867 (7.640) | −0.382 | 1.553 (1.399) | −0.226 | 5.846 (2.866) | −0.678 |
| Right Down | 5.458 (6.929) | −2.728 * | 1.567 (1.316) | −3.163 * | 5.780 (2.785) | −0.608 |
| Right Up | 5.222 (6.370) | −3.563 * | 1.385 (1.247) | −3.667 * | 5.859 (2.864) | −0.417 |
| Left Straight | 6.160 (6.903) | −0.896 | 1.496 (1.204) | −1.717 | 5.757 (2.754) | −1.304 |
| Left Down | 6.332 (7.014) | −3.041 * | 1.678 (1.356) | −3.250 * | 5.763 (2.698) | −1.512 |
| Left Up | 5.450 (6.715) | −3.563 * | 1.451 (1.235) | −3.389 * | 5.801 (2.757) | −1.981 |
| FHZ Standard | 7.129 (7.775) | − | 1.875 (1.347) | − | 5.838 (2.742) | − |
| Straight Down | 7.063 (7.337) | −3.007 * | 1.762 (1.342) | −3.233 * | 5.793 (2.731) | −0.463 |
| Straight Up | 7.806 (7.385) | −3.493 * | 1.866 (1.292) | −3.007 * | 5.836 (2.734) | −1.565 |
| Right Straight | 7.118 (7.689) | −0.504 | 1.793 (1.428) | −0.574 | 5.770 (2.807) | −0.205 |
| Right Down | 6.956 (7.918) | −3.389 * | 1.739 (1.386) | −4.015 * | 5.788 (2.779) | −0.017 |
| Right Up | 7.367 (7.826) | −3.424 * | 2.019 (1.262) | −2.798 * | 5.836 (2.859) | −1.026 |
| Left Straight | 7.015 (7.363) | −0.678 | 1.879 (1.366) | −0.330 | 5.814 (2.709) | −1.321 |
| Left Down | 6.534 (7.482) | −3.736 * | 1.738 (1.391) | −3.910 * | 5.788 (2.743) | −2.312 |
| Left Up | 7.525 (7.555) | −2.485 | 1.965 (1.298) | −3.245 * | 2.709 (2.753) | −1.651 |
| PAL Standard | 8.002 (7.883) | − | 1.945 (1.196) | − | 5.775 (2.708) | − |
| Straight Down | 8.446 (7.853) | −1.095 | 2.050 (1.348) | −3.233 * | 5.780 (2.753) | −0.417 |
| Straight Up | 8.084 (7.420) | −2.033 | 1.897 (2.169) | −3.007 * | 5.790 (2.729) | −1.363 |
| Right Straight | 8.081 (8.182) | −1.303 | 1.958 (1.237) | −0.574 | 5.869 (2.840) | −0.037 |
| Right Down | 7.999 (7.664) | −0.226 | 2.041 (1.249) | −4.015 * | 5.854 (2.765) | −0.672 |
| Right Up | 7.948 (7.542) | −1.721 | 1.932 (1.093) | −2.798 * | 5.812 (2.799) | −0.485 |
| Left Straight | 8.119 (7.747) | −0.817 | 1.920 (1.214) | −0.330 | 5.897 (2.710) | −1.547 |
| Left Down | 7.730 (16.219) | −0.261 | 2.028 (1.303) | −3.910 * | 5.875 (2.730) | −1.095 |
| Left Up | 7.741 (7.408) | −2.172 | 1.930 (1.140) | −3.245 * | 5.770 (2.657) | −0.672 |
| View | Intra-Distances | Inter-Distances | Z |
|---|---|---|---|
| Median (IQR) | Median (IQR) | ||
| OML | 0.053 (0.045) | 0.222 (0.144) | −43.681 * |
| FHZ | 0.048 (0.043) | 0.253 (0.145) | −44.868 * |
| PAL | 0.035 (0.033) | 0.225 (0.136) | −46.183 * |
Publisher’s Note: MDPI stays neutral with regard to jurisdictional claims in published maps and institutional affiliations. |
© 2022 by the authors. Licensee MDPI, Basel, Switzerland. This article is an open access article distributed under the terms and conditions of the Creative Commons Attribution (CC BY) license (https://creativecommons.org/licenses/by/4.0/).
Share and Cite
Butaric, L.N.; Richman, A.; Garvin, H.M. The Effects of Cranial Orientation on Forensic Frontal Sinus Identification as Assessed by Outline Analyses. Biology 2022, 11, 62. https://doi.org/10.3390/biology11010062
Butaric LN, Richman A, Garvin HM. The Effects of Cranial Orientation on Forensic Frontal Sinus Identification as Assessed by Outline Analyses. Biology. 2022; 11(1):62. https://doi.org/10.3390/biology11010062
Chicago/Turabian StyleButaric, Lauren N., Allison Richman, and Heather M. Garvin. 2022. "The Effects of Cranial Orientation on Forensic Frontal Sinus Identification as Assessed by Outline Analyses" Biology 11, no. 1: 62. https://doi.org/10.3390/biology11010062