Article

Repetitive Sequence Distribution on Saguinus, Leontocebus and Leontopithecus Tamarins (Platyrrhine, Primates) by Mapping Telomeric (TTAGGG) Motifs and rDNA Loci

1
Department of “Scienze e Tecnologie Biologiche, Chimiche e Farmaceutiche (STEBICEF)”, University of Palermo, 90100 Palermo, Italy
2
Institute of Molecular and Cellular Biology, SB RAS, 630090 Novosibirsk, Russia
3
Department of Ecology, Faculty of Science, Charles University, 12844 Prague, Czech Republic
*
Author to whom correspondence should be addressed.
Biology 2021, 10(9), 844; https://doi.org/10.3390/biology10090844
Submission received: 1 July 2021 / Revised: 23 August 2021 / Accepted: 26 August 2021 / Published: 30 August 2021
(This article belongs to the Special Issue Genome Plasticity in Disease, Evolution and Adaptation)

Abstract

:

Simple Summary

Telomeric and rDNA sequence distribution on tamarins (New world monkeys, Primates) was analysed through molecular cytogenetics by fluorescence in situ hybridization. The mapping of Telomeric and rDNA probes on chromosomes was performed in order to clarify their localization and role in genome evolution. We found rDNA loci on the same homologs 19–22 on the analysed species with a different position in one of them named Leontopithecus rosalia, presumably as result of inversions. Other rDNA signals could be present on chromosome 16 and 17. On the last species, we found the classic telomeric sequence with exceptions while on the other species analysed, we found very amplified telomeric signals at the edge of chromosomes and some centromeric signals as exceptions, especially on chromosome pairs 16 and 17 as result of inversions of telomeric sequences or the presence of new acquired rDNA loci above them. The results obtained enable us to underline that the different chromosomal morphology between the species analysed could be due to inversions which dislocate the rDNA loci, the presence of new rDNA loci or the amplification of telomeric sequences. A comparative perspective with other data results obtained could be useful in order to better understand genome evolution.

Abstract

Tamarins are a distinct group of small sized New World monkeys with complex phylogenetic relationships and poorly studied cytogenetic traits. In this study, we applied molecular cytogenetic analyses by fluorescence in situ hybridization with probes specific for telomeric sequences and ribosomal DNA loci after DAPI/CMA3 staining on metaphases from five tamarin species, namely Leontocebus fuscicollis, Leontopithecus rosalia, Saguinus geoffroyi, Saguinus mystax and Saguinus oedipus, with the aim to investigate the distribution of repetitive sequences and their possible role in genome evolution. Our analyses revealed that all five examined species show similar karyotypes, 2n = 46, which differ mainly in the morphology of chromosome pairs 16–17 and 19–22, due to the diverse distribution of rDNA loci, the amplification of telomeric-like sequences, the presence of heterochromatic blocks and/or putative chromosomal rearrangements, such as inversions. The differences in cytogenetic traits between species of tamarins are discussed in a comparative phylogenetic framework, and in addition to data from previous studies, we underline synapomorphies and apomorphisms that appeared during the diversification of this group of New World monkeys.

1. Introduction

Among New World monkeys, the subfamily Callitrichinae (Cebidae; Platyrrhini) represents one of the richest groups in terms of species and phenotypic variation. It consists of 48 currently recognised species [1] assigned to three tamarin genera (Saguinus, Leontocebus and Leontopithecus) and four marmoset genera (Callithrix, Cebuella, Callimico and Mico). The classification and phylogenetic position of marmosets and tamarins have been quite extensively debated. The position of the genera Leontopithecus and Saguinus (tamarins) was controversial, with either Saguinus or Leontopithecus considered as basal [2]; the most recent phylogenetic arrangements assign the genus Saguinus as the most basal lineage, followed by Leontopithecus, Callimico, Callithrix, Mico and Cebuella in agreement with the phyletic dwarfism hypothesis. This hypothesis proposes an evolutionary trend from large size ancestral forms to the smallest platyrrhine derived forms [3,4,5]. Despite the complexity of tamarin and marmoset phylogeny, classic cytogenetic investigations presented a stable scenario. The species of the genus Saguinus have rather similar G-banded karyotypes with differences in heterochromatin distribution, as revealed by a C-banding comparison. Indeed, many species of the genera Saguinus, Leontopithecus and Leontocebus fuscicollis share the same diploid number 2n = 46 but differ mainly by the C-banding pattern [6,7,8,9,10,11,12]; for example, Saguinus midas and Leontopithecus rosalia have similar chromosome morphologies, but they differ through a paracentric inversion and four pericentric inversions, as well as through the distribution and quantity of heterochromatin [11,12].
Comparative chromosomal painting between representative species of Saguinus and Leontopithecus did not reveal interchromosomal rearrangements [13,14,15], but intrachromosomal rearrangements have been hypothesised through cross-species comparison of conventional G-banding [11,12] and mapping of BACs (Bacterial Artificial Chromosomes) by FISH [16,17]. A large portion of the genome in Primates consists of repetitive DNA sequences, including tandem and dispersed satellite repeats [18]. The study of these repetitive elements offers interesting insights into karyotype evolution [18,19,20,21,22], especially for the distribution of ribosomal DNA (rDNA) loci and telomeric (TTAGGG)n sequences. These elements have been successfully used as markers for comparative cytogenetic and phylogenetic studies [19,20,23,24,25,26].
The 45S rDNA regions, also known as the Nucleolus Organizer Regions (NORs), comprising the 5.8S, 18S and 28S ribosomal subunits, can be identified either by silver staining or, more accurately, by rDNA-FISH, which permits researchers to identify both active and inactive NORs. The NORs have been identified in many primates and the analysis of their topology, and can be informative for the karyotype evolution and the phylogenetic relations between species [20,22]. The variation in number and topology of rDNA loci has been shown at the inter- and also at the intra-species level, most commonly explained as a consequence of chromosomal rearrangements, transposition events or ectopic recombination through association of rDNA loci with other chromosomal segments occurred during meiotic division [22,27,28]. The topology of rDNA loci has been identified in a few species of the genus Saguinus by classical and molecular methods [7,11,12,21,29], in Leontopithecus rosalia through silver staining [11] and in Leontopithecus chrysomelas by rDNA-FISH [14].
Telomeric (TTAGGG)n sequences in long tandem arrays characterise the terminal regions of chromosomes in the vast majority of animal taxa [30]. Nevertheless, these sequences have also been found at centromeric, pericentromeric and/or intermediate positions between the centromere and telomeres [19,23,31]. When localised outside the terminal positions of the chromosomes, these sequences are referred as Interstitial Telomeric Sequences (ITSs) or Interstitial Telomeric Repeats (ITRs). ITSs have been often related to chromosomal rearrangements such as fusion, fission and inversion, and to mechanisms of genome reorganisation, such as double DNA strand break repair [23]. Furthermore, ITSs are often correlated with heterochromatinisation, especially at centromeric positions (het-ITSs) [19,20]. Among tamarins, the distribution of telomeric (TTAGGG) sequences has been studied in Saguinus oedipus [19], S. midas and S. bicolor [29].
The aim of the present study is to expand our knowledge on the characterisation of the genome of tamarins by applying both classical and molecular cytogenetic approaches to closely related species, namely Leontocebus fuscicollis, Leontopithecus rosalia, Saguinus geoffroyi, S. mystax and S. oedipus, and to explore the distribution of heterochromatin and repetitive sequences in their karyotypes and their possible role as cytogenetic markers that are useful in evolutionary and phylogenetic comparisons.

2. Materials and Methods

2.1. Sampling Material

Following standard protocol [32], metaphase chromosome spreads were obtained from primary fibroblast cell cultures of Leontocebus fuscicollis, Leontopithecus rosalia, Saguinus geoffroyi, S. mystax and S. oedipus (Table 1).

2.2. Karyotype Analysis

The species were karyotyped by 4′,6-diamidino-2-phenylindole (DAPI) inverted banding: after DAPI staining of metaphases chromosomes, pictures were analysed through the software Adobe Photoshop to get the inverted DAPI staining. The karyotypes matched published Giemsa Banding data for S. geoffroyi [7], S. oedipus [7,13], S. mystax, Leontocebus fuscicollis [9,11,12] and Leontopithecus rosalia [12,13]. Chromosomes were classified according to the nomenclature proposed by Levan et al. [33]. The pattern of heterochromatin distribution was analysed with CG-specific chromomycin A3 (CMA3) and AT-specific DAPI sequential staining with the aim to respectively detect GC/AT rich regions following the protocol presented in Lemskaya et al. [34] and Scardino et al. [26].

2.3. Fluorescence In Situ Hybridisation (FISH) and C-Banding

The distribution of the telomeric motifs was analysed by FISH with the PNA oligonucleotide probe (Panagene Cambridge Research Biochemical) FITC labelled. Hybridisation was performed following the protocols purchased by Panagene, adjusting stringency conditions [19]. We performed our FISH experiment both at high and low stringency in order to better detect both terminal and interstitial signals [19]. High stringency detection was performed with high temperatures at 70 °C and a low saline concentrate buffer, while low stringency was performed at lower temperatures at 37 °C and with a high saline buffer concentration.
The probe for the rDNA sequence was prepared from a plasmid (pDmr.a 51#1) with a 11.5-kb insert encoding the 18S and 28S ribosomal units of Drosophila melanogaster (Meigen, 1830) (Endow 1982), and it was subsequently labelled with biotin-dUTP using a Nick Translation Kit (Abbott). In situ hybridisation of the probe with the chromosomal spreads was performed overnight according to a standard protocol and the probe signal was enhanced and detected using an avidin-FITC/biotinylated anti-avidin system (Vector Laboratories) at lower stringency according to previously described protocols [21,35]; in particular, the hybridisation mix consisted of 2.5 ng/μL of probe, 50% formamide, 10% dextran sulphate and 2xSSC, with an incubation time of 18 h at 37 °C.
C-banding was completed with denaturation and formamide sequentially after FISH experiments according to the protocol of Fernandez et al. [36] and using CMA3 and DAPI staining counterstain.

2.4. Microscopic Analysis and Imaging Processing

The metaphases were analysed under a Zeiss Axio2 epifluorescence microscope and captured using a coupled Zeiss digital camera. At least 10 metaphase spreads were analysed from each sample.

3. Results

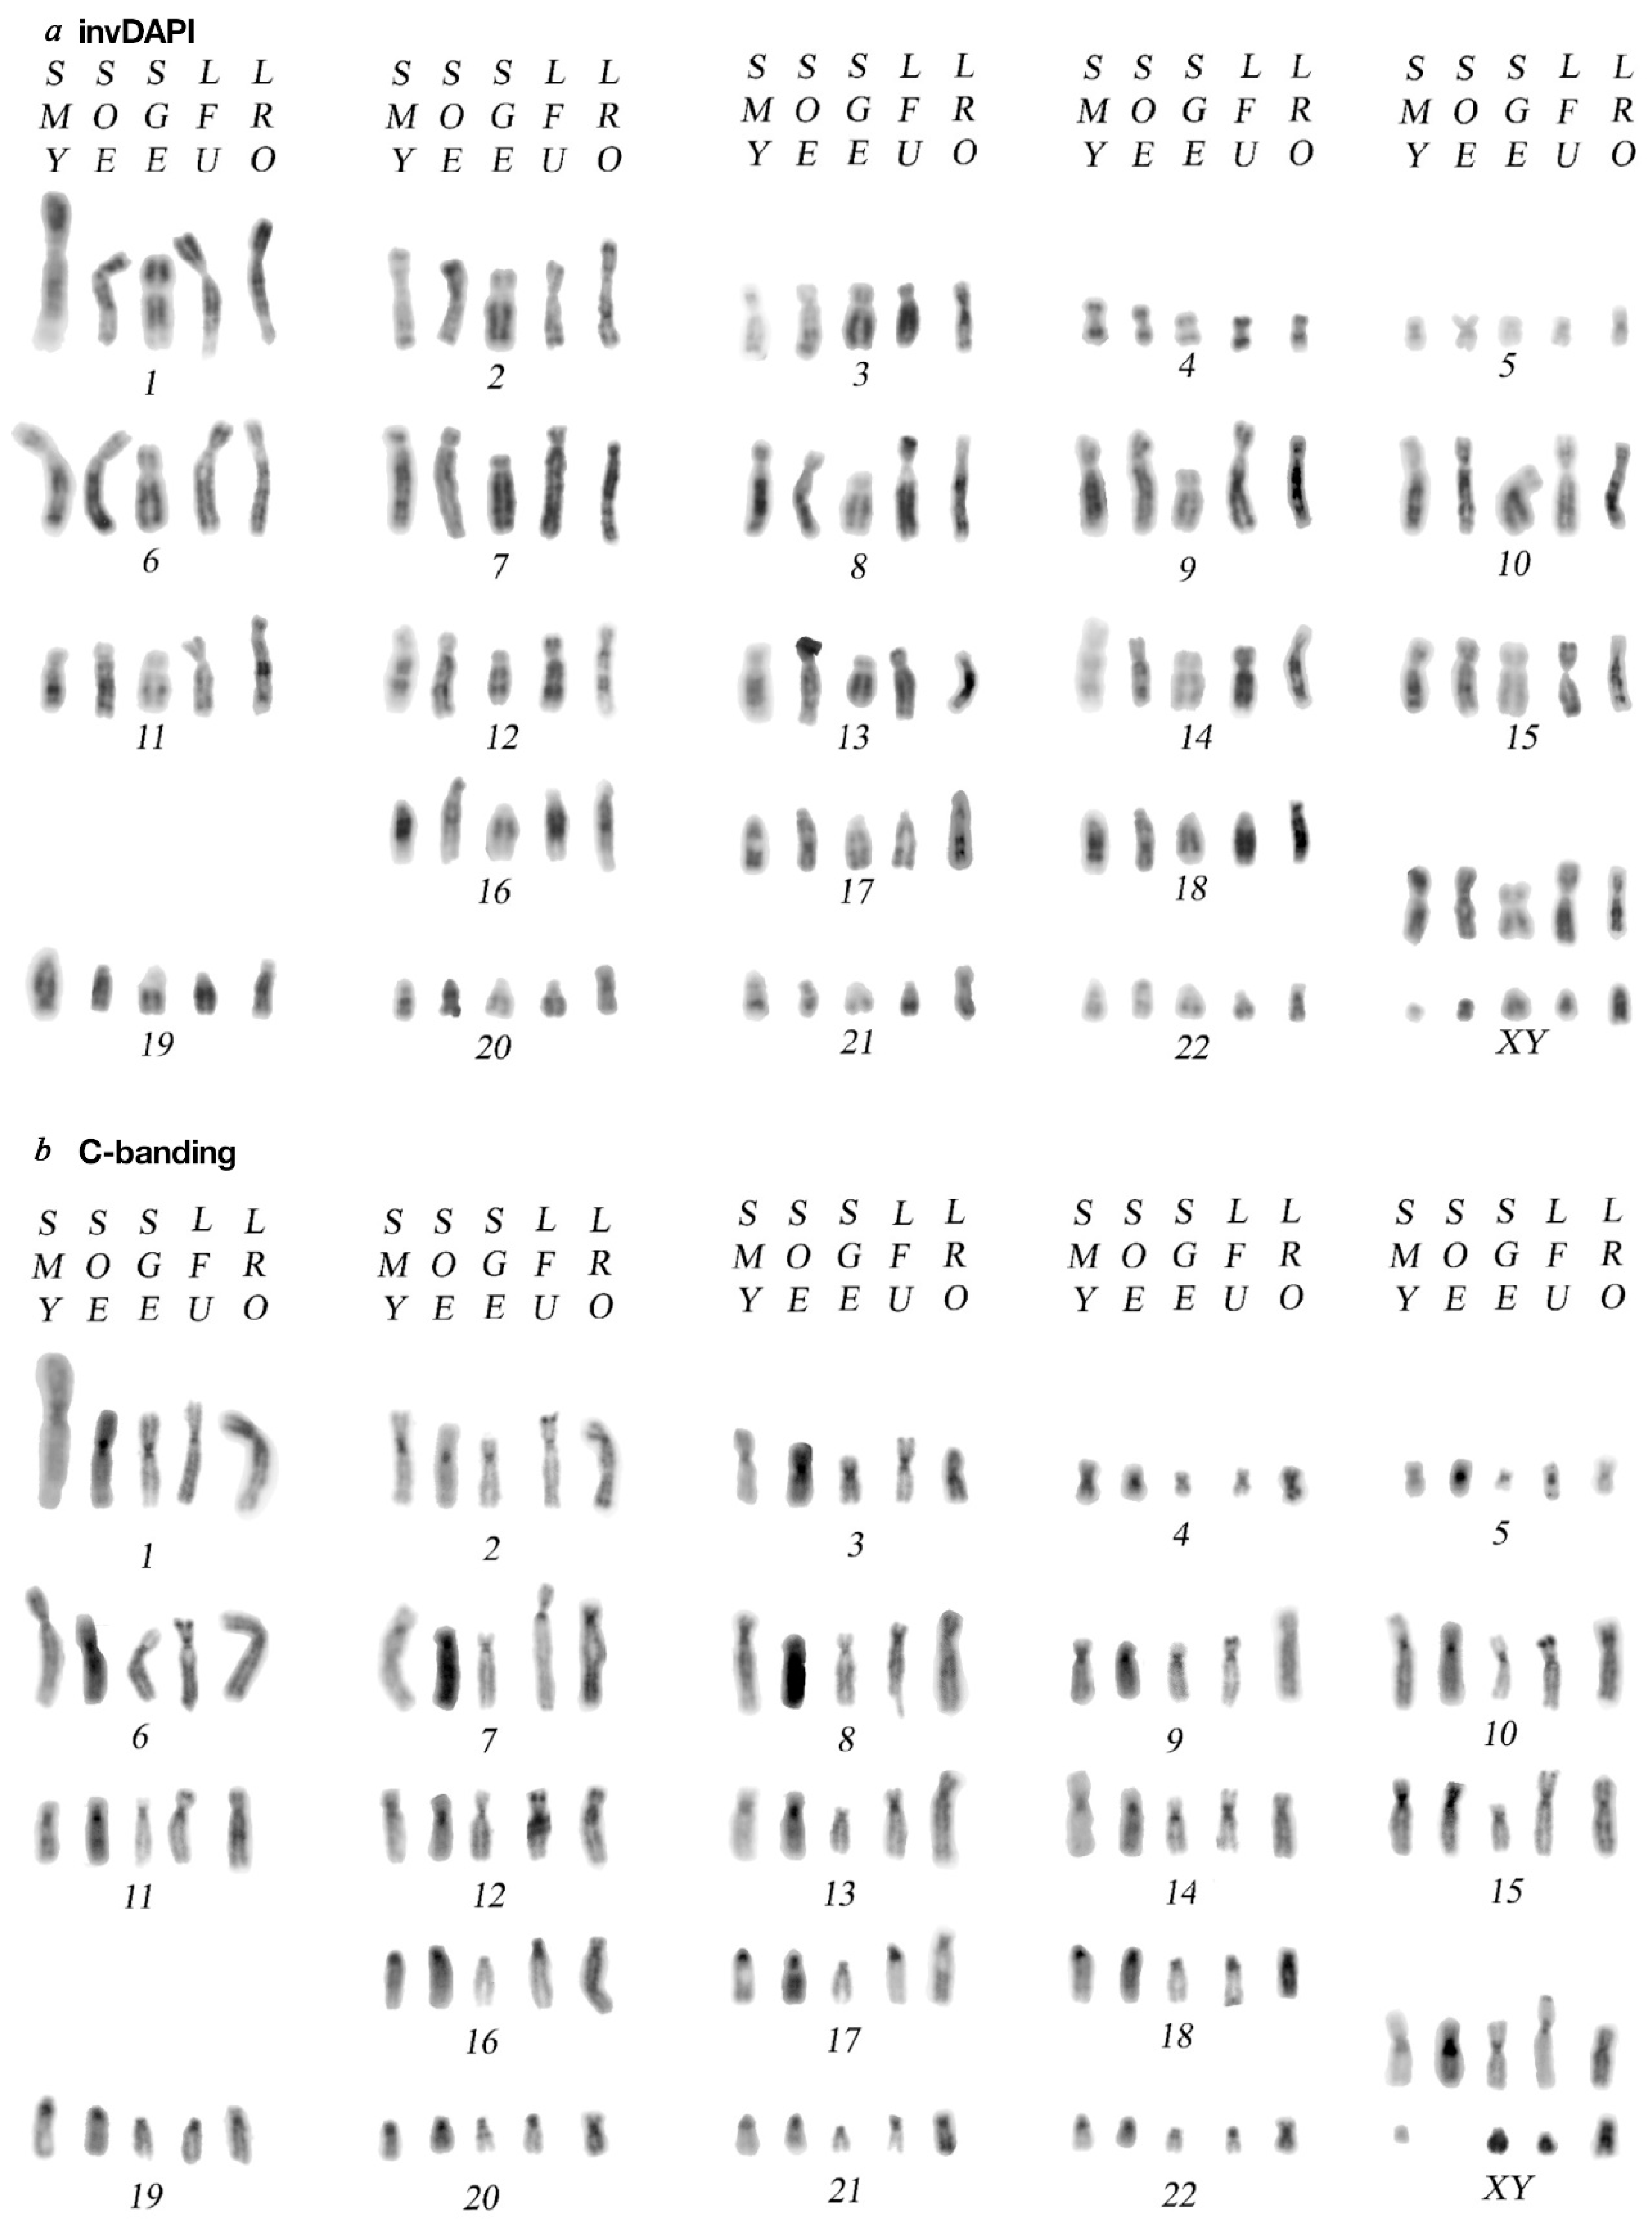
3.1. Karyotype Analysis

All analysed species shared the same diploid chromosome number: 2n = 46 (see Figure 1, Figure 2 and Figure 3, Figures S1–S5). In all individuals, the karyotype consisted of two metacentric pairs (4–5), 13 pairs of submetacentric chromosomes (1–3 and 6–15) and one pair of acrocentric chromosomes (18) (Figure 1a). Polymorphism between species was detected for the pairs 16–17, which are either acrocentric or subtelocentric, and for the subtelocentric pairs 19–22, which present differences in the length of the p arm, which is small in Saguinus and slightly bigger in Leontocebus fuscicollis and Leontopithecus rosalia (Figure 1a). The X chromosome has a similar size in all species. The Y chromosome is very acrocentric in Leontopithecus rosalia, S. geoffroyi, and S. mystax, while it is metacentric/submetacentric in Leontocebus fuscicollis and Saguinus oedipus (Figure 1a).

3.2. C-Banding and CMA3 Staining

C-banding data (Figure 1b) obtained in the present work agrees with literature [9,11]. In the species of the genus Saguinus, heterochromatin is mainly restricted to centromeric position in both biarmed and acrocentric chromosomes. Apart from centromeric signals, additional and peculiar C-positive bands were found on all chromosomes, especially at the distal p arms of submetacentric autosomes 2, 3, 6 and 8–15 in Leontocebus fuscicollis and Leontopithecus rosalia. Furthermore, on subtelocentric pairs 16–22 of Leontocebus fuscicollis, we could note a small p arm enriched in heterochromatin, while the homolog chromosomes in Leontopithecus rosalia showed additional accumulation of C-positive bands at the distal part of the p arms. CMA3 strongly stained regions rich in CG at centromeres where DAPI did not stain and it was useful to identify chromosomal regions enriched with repetitive elements (Figures S2–S4).

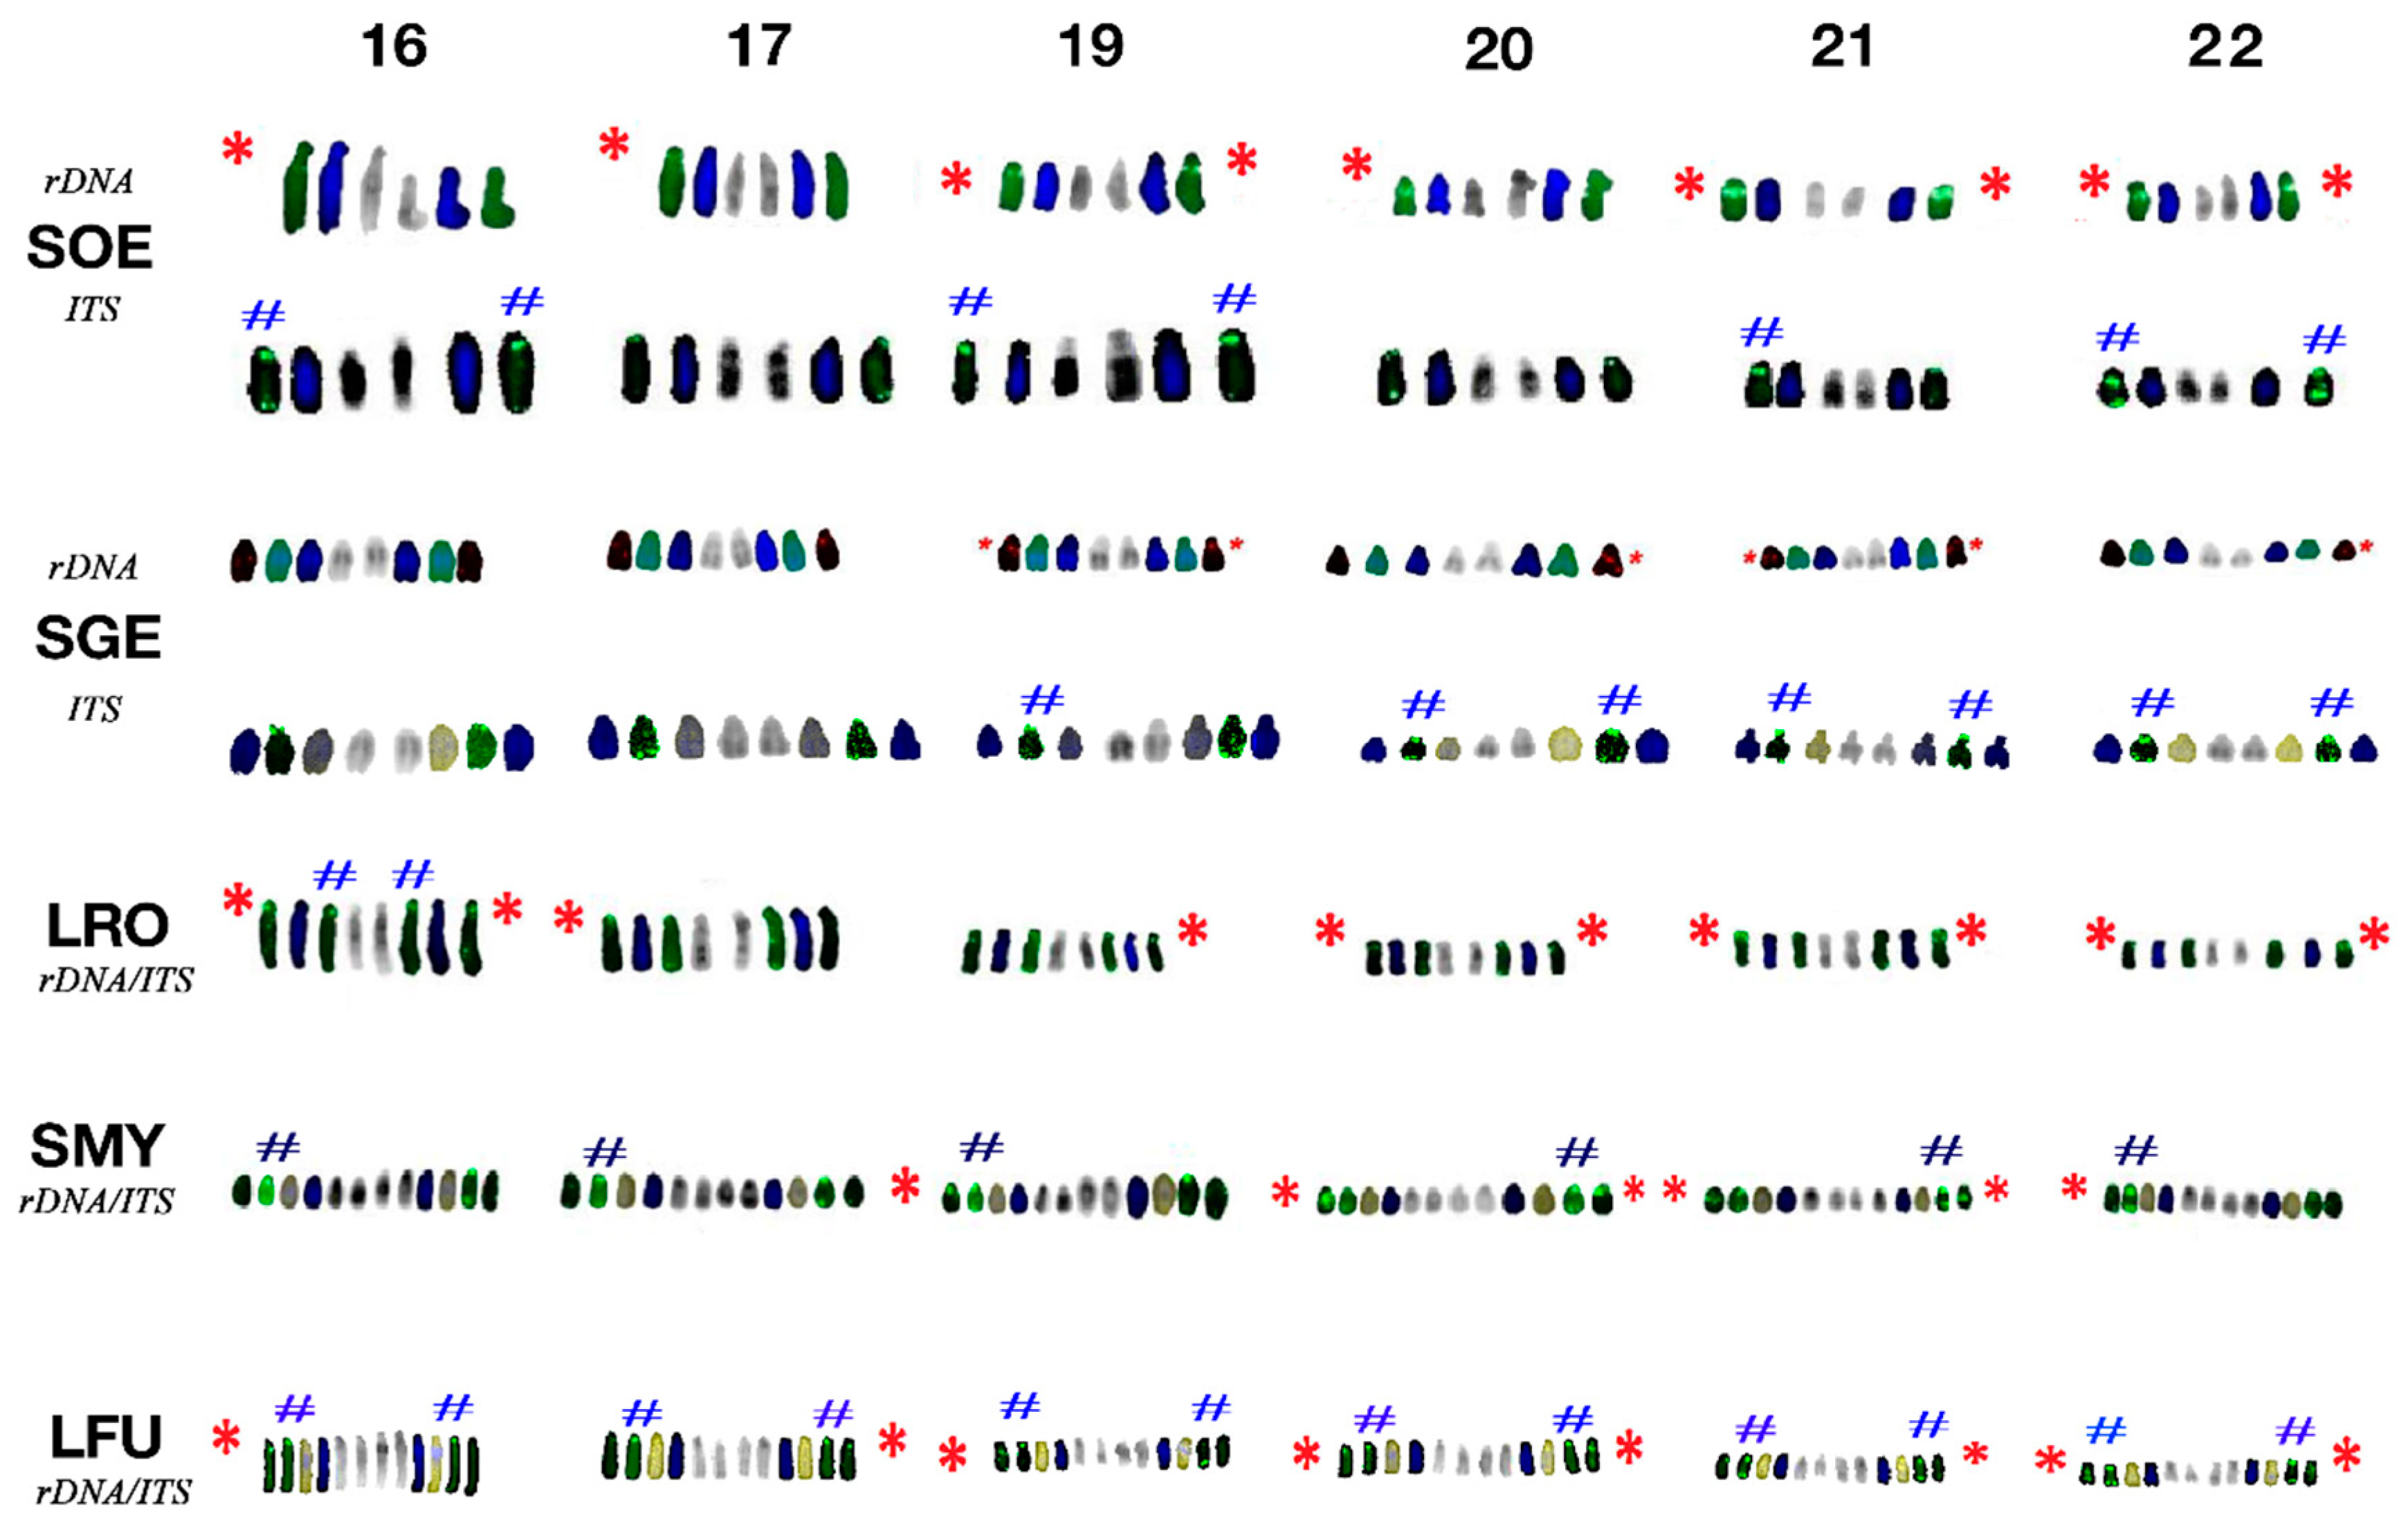
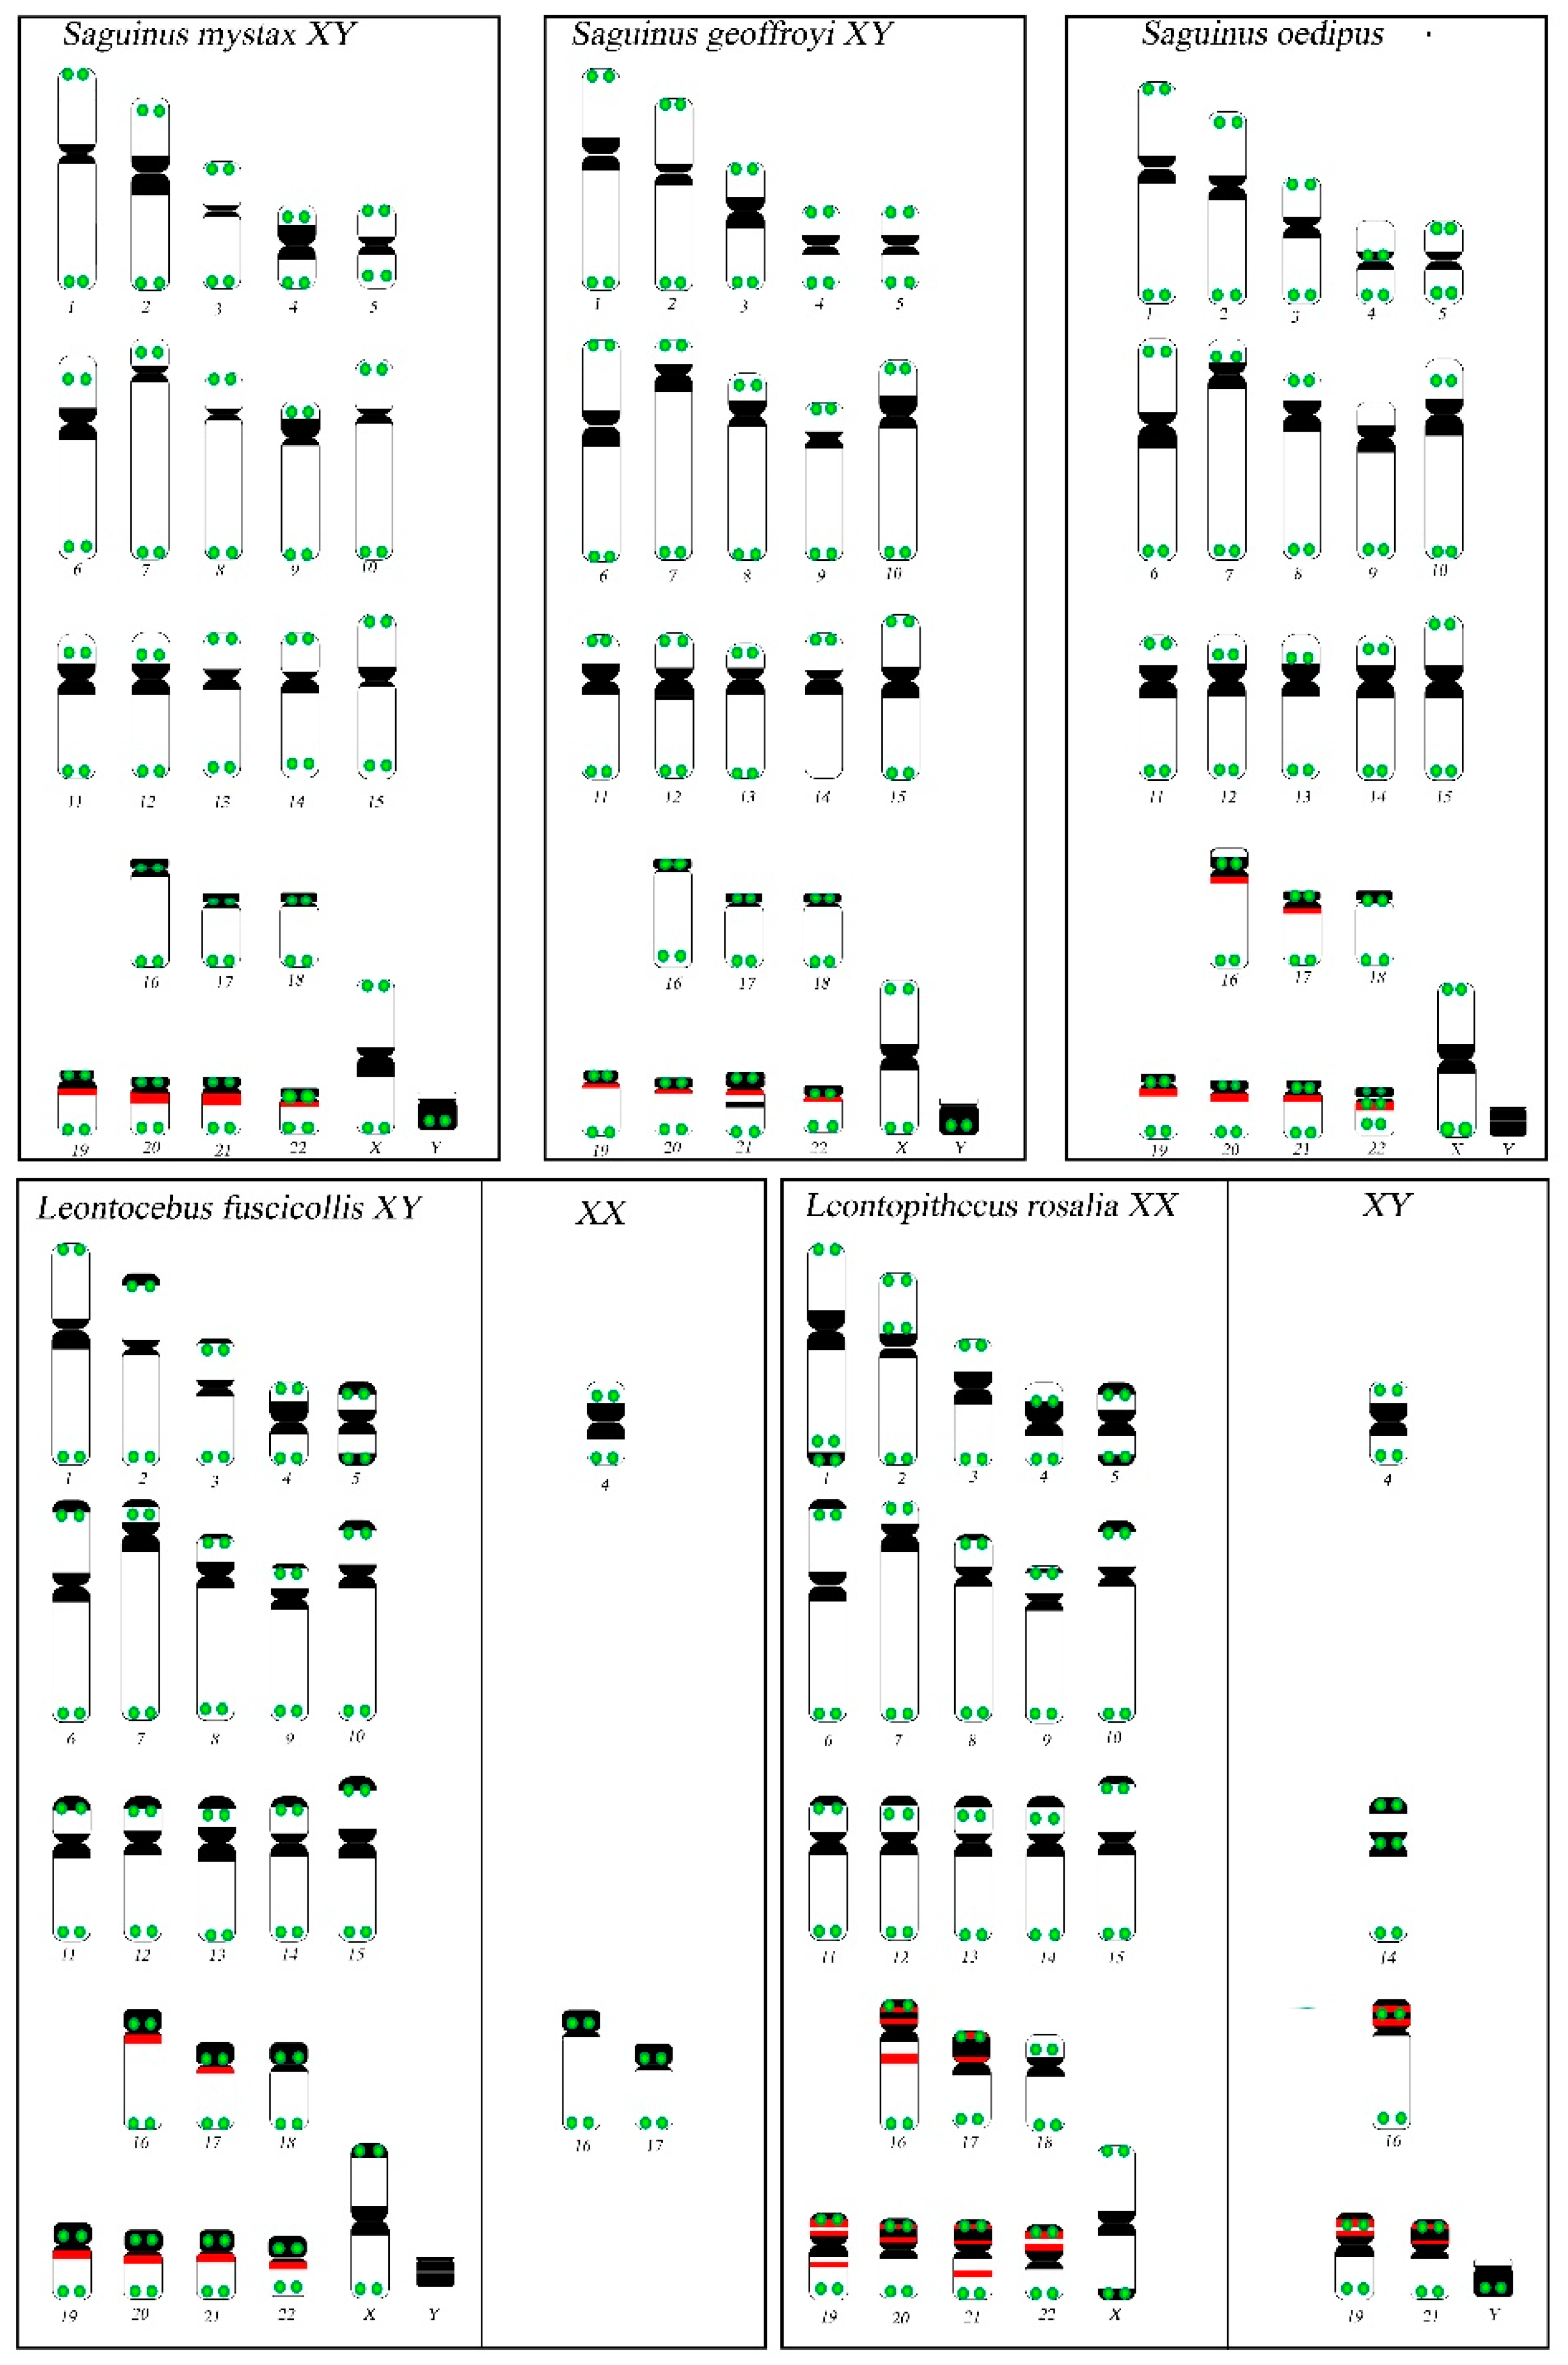
3.3. Fluorescence In Situ Hybridisation with an rDNA Probe

In the species of the genus Saguinus, rDNA loci were detected on the q arms of subtelocentric chromosomes 19–22 and additional rDNA loci were localised in chromosomes 16 and 17 (Figure 2, Figures S1–S5). The rDNA loci were detected on the subtelocentric chromosomes 19–22 on the q arm in Leontocebus fuscicollis and on the p arm in Leontopithecus rosalia, although with stronger accumulation in the latter (Figures S2–S4). Also, Leontocebus fuscicollis (male) and Leontopithecus rosalia showed additional rDNA signals on the subtelocentric chromosomes pairs 16 and 17 close to the centromere position. These signals however are not always present in all metaphases, presumably because of the low copy number of rDNA loci close to the limit of the detection threshold of the FISH method (Figures S4 and S5).

3.4. Fluorescence In Situ Hybridisation with (TTAGGG)n Probe

Telomeric motifs were detected at the ends of all chromosomes in all examined specimens. In the species of the genus Saguinus and in Leontocebus fuscicollis, peculiar and bright signals were detected on chromosomes 19–22, presumably as result of amplification process (Figure 2, Figures S1–S4). Furthermore, ITSs were at the centromeres of the subtelocentric chromosomes 16 and 17 in both male and female of Leontocebus fuscicollis and in Saguinus oedipus and on chromosomes 14 and 16 of the male Leontopithecus rosalia. In Leontopithecus rosalia, telomeric probe localisation differed between male and female individuals: indeed, in females, ITS was found on chromosomes 1, 2 and 4. Other peculiar signals were found on chromosome 6 p arm in Saguinus mystax and on chromosome 22 in Saguinus oedipus and in heterozygosis (Figure 1 and Figure S2).
All the results are reported in a schematic representation (Figure 3).

4. Discussion

4.1. Karyotypic Variability in 2n = 46 Tamarins

This study allowed us to explore the heterochromatin and repetitive sequence localisation in the genera Leontocebus, Leontopithecus and Saguinus in order to expand our understanding of chromosome evolution of these closely related New World primates. We analysed the localisation of telomeric sequences among tamarin species from the genus Saguinus, and also in the phylogenetically related Leontocebus fuscicollis and Leontopithecus rosalia. The inverted DAPI-banded karyotypes showed that all examined 2n = 46 species have similar karyotypes. A cross-species comparison of inverted DAPI-banded karyotypes is shown in Figure 1.
Our comparative analysis of inverted DAPI-banding reveals that the karyotypes of the genera Saguinus and Leontocebus mainly differ from Leontopithecus in the morphology of autosomal pairs 16, 17 and 19–22 (Figure 2). For example, chromosome pairs 16–17 are either acrocentric, as in S. mystax in agreement with the previous reconstructions in S. midas and S. bicolor where the homologs are identified as pairs 20–22 [11,13,29], or are subtelocentric, as in Leontopithecus rosalia (current study) and in Leontopithecus chrysomelas [14].

4.2. C-Banding Pattern Variation on Smaller Autosomes

Apart from classic bands at the centromeric position in all chromosomes, C-banding showed a slightly different pattern on pairs 16, 17 and 19-22 (Figure 1b). Indeed, on these chromosomes in the Saguinus species, we identified a positive C-band just below the centromere on the q arm; on the same homologs 16, 17 and 19–22 in Leontocebus fuscicollis, we found an enrichment of heterochromatin at the p arm and in Leontopithecus we found heterochromatin enrichment at the centromere and at the distal part of the p arms (Figure 1b and Figure 3). These results are in agreement with the previous comparison of the C-banding pattern performed on Leontopithecus rosalia and Saguinus midas, which showed differences in the variation, quantity and distribution of the non-centromeric constitutive heterochromatin [11,29]. Such a variable pattern of heterochromatin distribution often occurs among phylogenetically close species, even in other groups of mammals [22].

4.3. Topology of rDNA Loci

rDNA loci were mapped for the first time by FISH in Leontocebus fuscicollis, Leontopithecus rosalia and S. mystax in the current study. In contrast to a previous study, where classic silver stain permitted the detection of active NORs [11,29], we found both active and inactive rDNA loci in the species of the genus Saguinus. In particular, we detected rDNA probe signals on the p-arm of chromosome pairs 16 and 17 in Leontopithecus rosalia in agreement with a previous molecular evidence on Leontopithecus chrysomelas [14]. The rDNA signals on the q arm of pairs 16 and 17 have also been shown here for the first time in Saguinus oedipus and on respective homologs in the male Leontocebus fuscicollis, while previous analysis did not detect rDNA signals in Saguinus oedipus [11,22]. The different morphology of chromosome pairs 19–22 is also due to the fact that rDNA loci are found on the q arm in the genera Leontocebus and Saguinus and on the p arm in Leontopithecus rosalia, where we also show an extensive hybridisation signal (Figure 2 and Figure 3). This different location of rDNA signals could be explained by pericentric inversion dislocating the rDNA loci in the opposite arms from q arms in the former species to the p arms in Leontopithecus (Figure 3), in agreement with previous classic silver staining and molecular cytogenetic analysis applied respectively in several species of the genus Saguinus [7,11] and in Leontopithecus chrysomelas [14]. The extensive hybridisation signal on the p arm position in Leontopithecus rosalia also indicates that a paracentric inversion could have dislocated the rDNA loci. This evidence could be supported by the signal observed in Leontopithecus chrysomelas [14], where even if not underlined in that manuscript, the rDNA hybridisation pattern on 16, 17 and 19–22 pairs shows bright and amplified signals covering the whole p arm, presumably because of the extensive enrichment of rDNA loci. Moreover, we underline that the double rDNA pattern we show on chromosome pairs 19–22 in Leontopithecus rosalia overlaps with a strong C-positive block, which is especially evident when comparing the rDNA pattern with the previous C-banded karyotype [11]. Previous classic cytogenetic analyses led to the conclusion that the species Leontopithecus rosalia and Saguinus midas differ by at least four pericentric inversions [11], and our data analysis confirmed these intrachromosomal rearrangements at the molecular level in the species analysed in the present work.

4.4. Telomere Distribution

Apart from classic telomeric signals at the ends of chromosomes (Figure 3), we detected ITSs at the centromeres of the subtelocentric chromosomes 16 and 17 in both male and female Leontocebus fuscicollis, on chromosomes 16 of the male Leontopithecus rosalia and in Saguinus oedipus. The formation of ITSs could be explained due to either a very small pericentric inversion or an amplification of telomeric sequences and heterochromatin above the centromere (Figure 2 and Figure 3).
Moreover, bright telomeric signals were detected at centromeres on subtelocentric chromosomes pairs 19–22 in the genera Saguinus and Leontocebus (Figure 2 and Figure 3). Those signals are not present at the centromeres on the bigger subtelocentric homologs in the genus Leontopithecus, where only classic telomeric end signals were detected (Figure 2 and Figure 3). This different distribution might be the result of amplification of the terminal telomeric sequences in Saguinus oedipus, S. mistax and S geoffroyi, as well as of the split and loss of the signal intensity in Leontopithecus rosalia, presumably due to the inversions.
Additional ITS signals were found in some autosomes in the different species such as for example on and 22 in S. oedipus; however, these variable forms could be polymorphisms in tamarins worthy of further investigation.

5. Conclusions

Despite the fact that the analysed species have the same diploid number and conservative karyotype morphology, differences were detected among chromosomal pairs 16, 17 and 19–22 due to variations in the accumulation of heterochromatin, rDNA loci and telomeric sequences and due to intrachromosomal rearrangements. The comparison of telomeric sequence signals and rDNA loci distribution between the genera Saguinus, Leontocebus and Leontopithecus allowed us to verify and confirm at the molecular level four pericentric inversions responsible for the differences between Saguinus and Leontopithecus on chromosome pairs 19–22, which were previously proposed by classic cytogenetic methods, and that the comparative painting approach could not detect [35]. Moreover, mapping of rDNA loci revealed extensive enrichment on p arms of chromosomes pairs 19–22 in Leontopithecus as a result of paracentric inversions, presumably following the pericentric inversion, which are apomorphisms in relation to other tamarins. Furthermore, on pairs 16 and 17 in Leontocebus fuscicollis Saguinus oedipus and 16 in Leontopithecus rosalia, we also showed ITSs that could be due to an inversion and/or an amplification of heterochromatin above them and/or the accumulation of rDNA loci. Indeed, on those homologs in the other analysed species, the presence of these rDNA loci was also shown and are presumably present as polymorphisms.
In general, our cytogenetic comparative analysis reveals differences in the karyotypes, especially between the genera Saguinus/Leontocebus and genus Leontopithecus; furthermore, the genera Leontopithecus and Leontocebus show a few apomorphic patterns, such as peculiar C-banding patterns. Considering that the small-bodied tamarins’ radiation has been understudied so far and that several species are endangered, we assumed that their cytogenetic features have been underestimated and additional species and populations should be studied in order to better understand their genome evolution and to clarify the role of repetitive sequences in the evolution and adaptive radiation of these derived platyrrhini species.

Supplementary Materials

The following are available online at https://www.mdpi.com/article/10.3390/biology10090844/s1, Figure S1. Reconstructed karyotype of Saguinus oedipus after sequential DAPI, DAPI inverted and FISH mapping (a), metaphases in DAPI inverted (b), metaphases in DAPI (c), rDNA probe mapping (d), telomeric probe mapping (e), a reconstructed karyotype of S. oedipus after sequential DAPI, DAPI inverted, FISH with telomeric probe (f).The red stars label NOR-bearing chromosomes, the hash sign marks chromosomes with telomeric signal amplification. Figure S2. Reconstructed karyotype of Saguinus geoffroyi after sequential DAPI, DAPI inverted, CMA3 staining and FISH mapping (a), metaphases in DAPI inverted (b), metaphases in DAPI (c), rDNA probe mapping (d), telomeric probe mapping (e), a reconstructed karyotype of S. geoffroyi after sequential DAPI, DAPI inverted, CMA3 staining and FISH with telomeric probe (f). The red stars label NOR-bearing chromosomes, the hash sign marks chromosomes with telomeric signal amplification. Figure S3. Leontopithecus rosalia metaphases in DAPI inverted (a), in DAPI (b), rDNA probe mapping (c), telomeric probe mapping (d); the reconstructed karyotype of L. rosalia after sequential CMA3/ DAPI, DAPI inverted, FISH with Telomeric and rDNA probes. The red stars label NOR-bearing chromosomes, the hash sign marks chromosomes with telomeric signal amplification. Figure S4. Saguinus mystax metaphases in DAPI inverted (a), in DAPI (b), rDNA probe mapping (c), telomeric probe mapping (d); the reconstructed karyotype of S. mystax after sequential CMA3/DAPI, DAPI inverted, FISH with telomeric and rDNA probes, and C banding obtained after chromosome denaturation in formamide (f). The red stars label NOR-bearing chromosomes, the hash sign marks chromosomes with telomeric signal amplification. Figure S5. Leontocebus fuscicollis metaphases in DAPI inverted (a), DAPI (b), rDNA probe mapping (c), telomeric probe mapping (d). The karyotype of L. fuscicollis after sequential CMA3/DAPI staining, FISH with telomeric and rDNA probes, and C banding obtained after chromosome denaturation in formamide. The red stars label NOR-bearing chromosomes, the hash sign marks chromosomes with telomeric signal amplication.

Author Contributions

Conceptualization, F.D.; methodology, S.C.; software, C.S.; validation, F.D. and S.C.; formal analysis, F.D. investigation, C.S.; resources, F.D., P.L.P. and M.R. data curation, F.D.; writing—original draft preparation, F.D.; writing—review and editing, P.L.P., R.M and S.M.; supervision, F.D.; project administration, F.D.; funding acquisition, F.D., M.R. and P.L.P. All authors have read and agreed to the published version of the manuscript.

Funding

The study was supported by the FFR (Fondo di Finanziamento alla Ricerca) 2020 grant of FD, from University of Palermo. The primate cell line work of PP was supported also by RSF grant 19-14-00034.

Informed Consent Statement

Not applicable.

Data Availability Statement

All data are provided in the current manuscript.

Acknowledgments

Special thanks to Melody Roelke (Frederick National Laboratory of Cancer Research, Leidos Biomedical Research, Frederick, MD, USA), June Bellizzi and Director Richard Hahn (Catoctin Wildlife Park and Zoo, Thurmont, MD, USA), Stephen J. O’Brien, Mary Tompson (Laboratory of Genomic Diversity, National Cancer Institute, Frederick, MD, USA) and Mitchell Bush; National Zoological Park, Washington, DC who provided samples or cell lines used in this study.

Conflicts of Interest

The authors declare no conflict of interest. The funders had no role in the design of the study, the collection, analyses, or interpretation of the data, the writing of the manuscript, or the decision to publish the results.

Statement of Ethics

All experiments were performed in accordance with relevant ethical guidelines. All cell lines were obtained from Polina L. Perelman.

References

  1. Garbino, G.S.; Martins-Junior, A.M. Phenotypic evolution in marmoset and tamarin monkeys (Cebidae, Callitrichinae) and a revised genus-level classification. Mol. Phylogenet. Evol. 2018, 118, 156–171. [Google Scholar] [CrossRef]
  2. Cortés-Ortiz, L. Molecular phylogenetics of the Callitrichidae with an emphasis on the marmosets and Callimico. In The Smallest Anthropoids; Ford, S.M., Porter, L.M., Davis, L.C., Eds.; Springer: Boston, MA, USA, 2009; pp. 3–24. [Google Scholar]
  3. Matauschek, C.; Roos, C.; Heymann, E.W. Mitochondrial phylogeny of tamarins (Saguinus Hoffmannsegg, 1807) with taxonomic and biogeographic implications for the S. nigricollis species group. Am. J. Phys. Anthropol. 2011, 144, 564–574. [Google Scholar] [CrossRef] [PubMed]
  4. Perelman, P.; Johnson, W.E.; Roos, C.; Seuanez, H.N.; Horvath, J.E.; Moreira, M.A.M.; Kessing, B.; Pontius, J.; Roelke, M.; Rumpler, Y.; et al. A molecular phylogeny of living primates. PLoS Genet. 2011, 7, e1001342. [Google Scholar] [CrossRef] [PubMed] [Green Version]
  5. Buckner, J.C.; Lynch Alfaro, J.W.; Rylands, A.B.; Alfaro, M.E. Biogeography of the marmosets and tamarins (Callitrichidae). Mol. Phylogenet. Evol. 2015, 82, 413–425. [Google Scholar] [CrossRef]
  6. Benirschke, K.; Brownhill, L.E. Further observations on marrow chimerism in marmosets. Cytogenetics 1962, 1, 245–257. [Google Scholar] [CrossRef] [PubMed]
  7. Bedard, M.T.; Ma, N.S.F.; Jones, T.C. Chromosome banding patterns and nucleolar organizing regions in three species of Callitrichidae (Saguinus oedipus, Saguinus fuscicollis and Callithrix jacchus). J. Med. Primatol. 1978, 7, 82–97. [Google Scholar] [CrossRef] [PubMed]
  8. Dutrillaux, B.; Couturier, J.; Viegas-Pequignot, E. Evolution chromosomique des platyrrhiniens. Mammalia 1986, 50, 57–81. [Google Scholar]
  9. Dantas, S.M.M.d.M.; de Souza Barros, R.M. Cytogenetic study of the genus Saguinus (Callithrichidae, Primates). Braz. J. Genet. 1997, 20, 649. [Google Scholar] [CrossRef]
  10. Nagamachi, C.Y.; Pieczarka, J.C. Chromosome studies of Saguinus midas niger (Callitrichidae, Primates) from Tucurui, Para, Brazil: Comparison with the karyotype of Callithrix jacchus. Am. J. Primatol. 1988, 14, 277–284. [Google Scholar] [CrossRef] [PubMed]
  11. Nagamachi, C.; Pieczarka, J.; Schwarz, M.; Barros, R.; Mattevi, M. Chromosomal similarities and differences between tamarins, Leontopithecus and Saguinus (Platyrrhini, Primates). Am. J. Primatol. 1997, 43, 265–276. [Google Scholar] [CrossRef]
  12. Nagamachi, C.Y.; Pieczarka, J.C.; Muniz, J.A.; Barros, R.M.; Mattevi, M.S. Proposed chromosomal phylogeny for the South American primates of the Callitrichidae family (Platyrrhini). Am. J. Primatol. 1999, 49, 133–152. [Google Scholar] [CrossRef]
  13. Neusser, M.; Stanyon, R.; Bigoni, F.; Wienberg, J.; Muller, S. Molecular cytotaxonomy of New World monkeys (Platyrrhini)—Comparative analysis of five species by multi-color chromosome painting gives evidence for a classification of Callimico goeldii within the family of Callitrichidae. Cytogenet. Cell Genet. 2001, 94, 206–215. [Google Scholar] [CrossRef]
  14. Gerbault-Serreau, M.; Bonnet-Garnier, A.; Richard, F.; Dutrillaux, B. Chromosome painting comparison of Leontopithecus chrysomelas (Callitrichine, Platyrrhini) with man and its phylogenetic position. Chromosome Res. 2004, 12, 691–701. [Google Scholar] [CrossRef]
  15. Stanyon, R.; Giusti, D.; Araújo, N.P.; Bigoni, F.; Svartman, M. Chromosome painting of the red-handed tamarin (Saguinus midas) compared to other Callitrichinae monkeys. Genome 2018, 61, 771–776. [Google Scholar] [CrossRef] [PubMed] [Green Version]
  16. Dumas, F.; Sineo, L.; Ishida, T. Taxonomic identification of Aotus (Platyrrhinae) through cytogenetics. Identificazione tassonomica di Aotus (Platyrrhinae) mediante la citogenetica. J. Biol. Res. 2015, 88, 65–66. [Google Scholar]
  17. Scardino, R.; Milioto, V.; Proskuryakova, A.A.; Serdyukova, N.A.; Perelman, P.L.; Dumas, F. Evolution of the human chromosome 13 synteny: Evolutionary rearrangements, plasticity, human disease genes and cancer breakpoints. Genes 2020, 11, 383. [Google Scholar] [CrossRef] [Green Version]
  18. Ahmad, S.F.; Singchat, W.; Jehangir, M.; Suntronpong, A.; Panthum, T.; Malaivijitnond, S.; Srikulnath, K. Dark matter of primate genomes: Satellite DNA repeats and their evolutionary dynamics. Cells 2020, 9, 2714. [Google Scholar] [CrossRef]
  19. Dumas, F.; Cuttaia, H.; Sineo, L. Chromosomal distribution of interstitial telomeric sequences in nine neotropical primates (Platyrrhini): Possible implications in evolution and phylogeny. J. Zool. Syst. Evol. Res. 2016, 54, 226–236. [Google Scholar] [CrossRef] [Green Version]
  20. Mazzoleni, S.; Schillaci, O.; Sineo, L.; Dumas, F. Distribution of interstitial telomeric sequences in primates and the pygmy tree shrew (Scandentia). Cytogenet. Genome Res. 2017, 151, 141–150. [Google Scholar] [CrossRef] [PubMed]
  21. Mazzoleni, S.; Rovatsos, M.; Schillaci, O.; Dumas, F. Evolutionary insight on localization of 18S, 28S rDNA genes on homologous chromosomes in Primates genomes. Comp. Cytogenet. 2018, 12, 27–40. [Google Scholar] [CrossRef] [Green Version]
  22. Milioto, V.; Vlah, S.; Mazzoleni, S.; Rovatsos, M.; Dumas, F. Chromosomal localization of 18S–28S rDNA and (TTAGGG)n sequences in two south african dormice of the genus Graphiurus (Rodentia: Gliridae). Cytogenet. Genome Res. 2019, 158, 145–151. [Google Scholar] [CrossRef] [PubMed]
  23. Ruiz-Herrera, A.; Nergadze, S.G.; Santagostino, M.; Giulotto, E. Telomeric repeats far from the ends: Mechanisms of origin and role in evolution. Cytogenet. Genome Res. 2008, 122, 219–228. [Google Scholar] [CrossRef]
  24. Swier, V.J.; Anwarali Khan, F.A.; Baker, R.J. Do time, heterochromatin, NORs, or chromosomal rearrangements correlate with distribution of interstitial telomeric repeats in Sigmodon (cotton rats)? J. Hered. 2012, 103, 493–502. [Google Scholar] [CrossRef] [PubMed] [Green Version]
  25. Dumas, F.; Mazzoleni, S. Neotropical primate evolution and phylogenetic reconstruction using chromosomal data. Eur. Zool. J. 2017, 84, 1–18. [Google Scholar] [CrossRef] [Green Version]
  26. Scardino, R.; Mazzoleni, S.; Rovatsos, M.; Vecchioni, L.; Dumas, F. Molecular cytogenetic characterization of the Sicilian endemic pond turtle Emys trinacris and the yellow-bellied slider Trachemys scripta scripta (Testudines, Emydidae). Genes 2020, 11, 702. [Google Scholar] [CrossRef]
  27. Baicharoen, S.; Hirai, Y.; Srikulnath, K.; Kongprom, U.; Hirai, H. Hypervariability of nucleolus organizer regions in Bengal slow lorises, Nycticebus bengalensis (Primates, Lorisidae). Cytogenet. Genome Res. 2016, 149, 267–273. [Google Scholar] [CrossRef]
  28. Hirai, H. Chromosome dynamics regulating genomic dispersion and alteration of Nucleolus Organizer Regions (NORs). Cells 2020, 9, 971. [Google Scholar] [CrossRef] [Green Version]
  29. Serfaty, D.M.B.; Carvalho, N.D.M.; Gross, M.C.; Gordo, M.; Schneider, C.H. Differential chromosomal organization between Saguinus midas and Saguinus bicolor with accumulation of differences in the repetitive sequence DNA. Genetica 2017, 145, 359–369. [Google Scholar] [CrossRef] [PubMed]
  30. Meyne, J.; Baker, R.J.; Hobart, H.H.; Hsu, T.C.; Ryder, O.A.; Ward, O.G.; Moyzis, R.K. Distribution of non-telomeric sites of the (TTAGGG)n telomeric sequence in vertebrate chromosomes. Chromosoma 1990, 99, 3–10. [Google Scholar] [CrossRef]
  31. Rovatsos, M.; Kratochvíl, L.; Altmanová, M.; Johnson Pokorná, M. Interstitial telomeric motifs in squamate reptiles: When the exceptions outnumber the rule. PLoS ONE 2015, 10, e0134985. [Google Scholar] [CrossRef] [PubMed] [Green Version]
  32. Small, M.F.; Stanyon, R.; Smith, D.G.; Sineo, L. High-resolution chromosomes of rhesus macaques (Macaca mulatta). Am. J. Primatol. 1985, 9, 63–67. [Google Scholar] [CrossRef] [PubMed]
  33. Levan, A.; Fredga, K.; Sandberg, A.A. Nomenclature for centromeric position on chromosomes. Hereditas 1964, 52, 201–220. [Google Scholar] [CrossRef]
  34. Lemskaya, N.A.; Kulemzina, A.I.; Beklemisheva, V.R.; Biltueva, L.S.; Proskuryakova, A.A.; Hallenbeck, J.M.; Perelman, P.L.; Graphodatsky, A.S. A combined banding method that allows the reliable identification of chromosomes as well as differentiation of AT-and GC-rich heterochromatin. Chromosome Res. 2018, 26, 307–315. [Google Scholar] [CrossRef] [PubMed]
  35. Dumas, F.; Sineo, L. The evolution of human synteny 4 by mapping sub-chromosomal specific probes in Primates. Caryologia 2014, 67, 281–291. [Google Scholar] [CrossRef] [Green Version]
  36. Fernàndez, R.; Barragàn, M.; Bullejos, M.; Marchal, J.; Diaz de la Guardia, R.; Sanchez, A. New C-band protocol by heat denaturation in the presence of formamide. Hereditas 2002, 137, 145–148. [Google Scholar] [CrossRef] [Green Version]
Figure 1. Comparative series of inverted DAPI banded (a) and C-banded chromosomes (b) of the analysed species: Leontocebus fuscicollis, Leontopithecus rosalia, Saguinus geoffroyi, S. mystax and S. oedipus.
Biology 10 00844 g001
Figure 2. Chromosomes 16–17, 19–22 with rDNA and telomere loci mapping distribution for each species: Saguinus oedipus, Saguinus geoffroy, Leontopithecus rosalia, Saguinus mystax, Leontocebus fuscicollis. Each pair is reported covering the time when chromosomes were available after sequential DAPI, DAPI inverted, CMA3 staining and FISH mapping signals. Telomeric signals are in green, rDNA probes signals are in red except in SOE. The red stars label chromosomes with rDNA loci, the hash sign marks chromosomes with telomere probe amplification.
Biology 10 00844 g002
Figure 3. Patterns of the distribution of telomeric repeats, rDNA and heterocromatin in five tamarin species. Dark regions correspond to constitutive heterochromatin blocks. A schematic representation of chromosomes and bands was compiled from this study and others [9,11,29]. Telomeric signals are in green, rDNA probes signals are in red; chromosome variants are reported in the boxes on the right.
Biology 10 00844 g003
Table 1. Information for all specimens analysed in the current study. ♂ male, ♀ famale.
FamilyLatin NameSex ♂/♀Cell TypeAcknowledgements
CebidaeSaguinus Oedipus SOEfibroblast cell lineMelody Roelke (Frederick National Laboratory of Cancer Research, Leidos Biomedical Research, Frederick, MD, USA), June Bellizzi and Director Richard Hann (Catoctin Wildlife Park and Zoo, Thumont, MD, USA)
S. geoffroyi SGE
S. mystax SMY♂/♀
Leontocebus fuscicollis LFU♂/♀
Leontopithecus rosalia LRO♂/♀Dr. Stephen O’Brien, Mary Tompson (Laboratory of Genomic Diversity, National Cancer Institute, Frederick MD, USA), Dr. Mitchell Bush; National Zoological Park, Washington, DC
Publisher’s Note: MDPI stays neutral with regard to jurisdictional claims in published maps and institutional affiliations.

