
Biological Knowledge of Thornback Ray (Raja clavata) from the Azores: Improving Scientific Information for the Effectiveness of Species-Specific Management Measures

 , ,
, ,
Abstract
:Simple Summary
Abstract
1. Introduction
2. Material and Methods
2.1. Data Collection
2.1.1. Scientific Surveys
2.1.2. Commercial Catches
2.1.3. Official Commercial Landings
2.2. Data Analyses
2.2.1. Distribution
2.2.2. Movement Patterns
2.2.3. Size Structure
2.2.4. Growth Parameters
2.2.5. Sex Ratio
2.2.6. Reproduction
2.2.7. Mortality, Exploitation Rate, and Size at Capture
2.2.8. Catch Rates and Landings
3. Results
3.1. Distribution
3.2. Movement Patterns
3.3. Size Structure
3.4. Growth Parameters
3.5. Sex Ratio
3.6. Reproduction
3.7. Mortality, Exploitation Rate, and Size at Capture
3.8. Catch Rates and Landings
4. Discussion
5. Conclusions
Supplementary Materials
Author Contributions
Funding
Institutional Review Board Statement
Informed Consent Statement
Data Availability Statement
Acknowledgments
Conflicts of Interest
References
- Bonfil, R. Overview of World Elasmobranch Fisheries; Food and Agriculture Organization of the United Nations: Rome, Italy, 1994; Volume 341, pp. 1–119. [Google Scholar]
- Dulvy, N.K.; Fowler, S.L.; Musick, J.A.; Cavanagh, R.D.; Kyne, P.M.; Harrison, L.R.; Carlson, J.K.; Davidson, L.N.K.; Fordham, S.V.; Francis, M.P.; et al. Extinction risk and conservation of the world’s sharks and rays. Elife 2014, 3, e00590. [Google Scholar] [CrossRef] [Green Version]
- Fowler, S.L.; Reed, T.M.; Dipper, F. Elasmobranch Biodiversity, Conservation and Management: Proceedings of the International Seminar and Workshop, Sabah, Malaysia, July 1997; IUCN: Gland, Switzerland, 2002. [Google Scholar]
- Clarke, S.C. Global estimates of shark catches using trade records from commercial markets. Ecol. Lett. 2006, 9, 1115–1126. [Google Scholar] [CrossRef]
- Bornatowski, H.; Braga, R.R.; Vitule, J.R.S. Shark mislabeling threatens biodiversity. Science 2013, 340, 923. [Google Scholar] [CrossRef] [PubMed]
- Pacoureau, N.; Rigby, C.L.; Kyne, P.M.; Sherley, R.B.; Winker, H.; Carlson, J.K.; Fordham, S.V.; Barreto, R.; Fernando, D.; Francis, M.P.; et al. Half a century of global decline in oceanic sharks and rays. Nature 2021, 589, 567–571. [Google Scholar] [CrossRef] [PubMed]
- Chevolot, M.; Ellis, J.R.; Hoarau, G.; Rijnsdorp, A.D.; Stam, W.T.; Olsen, J.L. Population structure of the thornback ray (Raja clavata L.) in British waters. J. Sea Res. 2006, 56, 305–316. [Google Scholar] [CrossRef]
- Machado, P.B.; Gordo, L.S.; Figueiredo, I. Skate and ray species composition in mainland Portugal from the commercial landings. Aquat. Living Resour. 2004, 17, 231–234. [Google Scholar] [CrossRef]
- Santos, R.; Novoa-Pabon, A.; Silva, H.; Pinho, M. Elasmobranch species richness, fisheries, abundance and size composition in the Azores archipelago (NE Atlantic). Mar. Biol. Res. 2020, 16. [Google Scholar] [CrossRef]
- FAO Fishery and Aquaculture Statistics. Global Capture Production 1950–2019 (FishstatJ); FAO: Quebec City, QC, Canada, 2021. [Google Scholar]
- Froese, R.; Pauly, D. FishBase. Available online: www.fishbase.org (accessed on 9 March 2021).
- Last, P.; Naylor, G.; Séret, B.; White, W.; de Carvalho, M.; Stehmann, M. Rays of the World; CSIRO Publishing: Clayton, Australia, 2016. [Google Scholar]
- Serra-Pereira, B.; Figueiredo, I.; Gordo, L.S. Maturation, fecundity, and spawning strategy of the thornback ray, Raja clavata: Do reproductive characteristics vary regionally? Mar. Biol. 2011, 158, 2187–2197. [Google Scholar] [CrossRef]
- Marandel, F.; Lorance, P.; Andrello, M.; Charrier, G.; Le Cam, S.; Lehuta, S.; Trenkel, V.M. Insights from genetic and demographic connectivity for the management of rays and skates. Can. J. Fish. Aquat. Sci. 2017, 75, 1291–1302. [Google Scholar] [CrossRef] [Green Version]
- Chevolot, M.; Hoarau, G.; Rijnsdorp, A.D.; Stam, W.T.; Olsen, J.L. Phylogeography and population structure of thornback rays (Raja clavata L., Rajidae). Mol. Ecol. 2006, 15, 3693–3705. [Google Scholar] [CrossRef]
- ICES Working Group on Elasmobranch Fishes (WGEF). ICES Sci. Rep. 2020, 2, 789. [CrossRef]
- Santos, R.; Medeiros-Leal, W.; Pinho, M. Stock assessment prioritization in the Azores: Procedures, current challenges and recommendations. Arquipelago. Life Mar. Sci. 2020, 20–45. [Google Scholar]
- Santos, R.; Medeiros-Leal, W.; Pinho, M. Synopsis of biological, ecological and fisheries-related information on priority marine species in the Azores region. Arquipelago. Life Mar. Sci. 2020, 1 (Suppl. 12), 1–138. [Google Scholar]
- Endicott, M.; Agnew, D.J. The survivorship of rays discarded from the South Georgia longline fishery. CCAMLR Sci. 2004, 11, 155–164. [Google Scholar]
- Enever, R.; Catchpole, T.L.; Ellis, J.R.; Grant, A. The survival of skates (Rajidae) caught by demersal trawlers fishing in UK waters. Fish. Res. 2009, 97, 72–76. [Google Scholar] [CrossRef]
- Enever, R.; Revill, A.S.; Caslake, R.; Grant, A. Discard mitigation increases skate survival in the Bristol Channel. Fish. Res. 2010, 102, 9–15. [Google Scholar] [CrossRef]
- Knotek, R.J.; Rudders, D.B.; Mandelman, J.W.; Benoit, H.P.; Sulikowski, J.A. The survival of rajids discarded in the New England scallop dredge fisheries. Fish. Res. 2018, 198, 50–62. [Google Scholar] [CrossRef]
- Ellis, J.R.; Burt, G.J.; Grilli, G.; McCully Phillips, S.R.; Catchpole, T.L.; Maxwell, D.L. At-vessel mortality of skates (Rajidae) taken in coastal fisheries and evidence of longer-term survival. J. Fish. Biol. 2018, 92, 1702–1719. [Google Scholar] [CrossRef]
- Pinho, M.; Medeiros-Leal, W.; Sigler, M.; Santos, R.; Novoa-Pabon, A.; Menezes, G.; Silva, H. Azorean demersal longline survey abundance estimates: Procedures and variability. Reg. Stud. Mar. Sci. 2020, 39, 101443. [Google Scholar] [CrossRef]
- ICES. Rays and skates (Rajidae), mainly thornback ray (Raja clavata) in subareas 10 and 12 (Azores grounds and north of Azores). Rep. ICES Advis. Comm. 2019, 2019, 1–5. [Google Scholar] [CrossRef]
- EU Council Regulation (EC) No 199/2008 of 25 February 2008 concerning the establishment of a Community framework for the collection, management and use of data in the fisheries sector and support for scientific advice regarding the Common Fisheries Policy. Off. J. Eur. Union L 2008, 60, 1–12.
- DGRM. Work Plan for Data Collection in the Fisheries and Aquaculture Sectors; DGRM: Lisbon, Portugal, 2016; pp. 1–43.
- Hastie, T.J.; Tibshirani, R.J. Generalized Additive Models; CRC Press: Boca Raton, FL, USA, 1990; Volume 43. [Google Scholar]
- Guisan, A.; Edwards, T.C.; Hastie, T. Generalized linear and generalized additive models in studies of species distributions: Setting the scene. Ecol. Modell. 2002, 157, 89–100. [Google Scholar] [CrossRef] [Green Version]
- Wood, S.N. Fast stable restricted maximum likelihood and marginal likelihood estimation of semiparametric generalized linear models. J. R. Stat. Soc. 2011, 73, 3–36. [Google Scholar] [CrossRef] [Green Version]
- Wood, S.N.; Pya, N.; Safken, B. Smoothing parameter and model selection for general smooth models (with discussion). J. Am. Stat. Assoc. 2016, 111, 1548–1575. [Google Scholar] [CrossRef]
- Wood, S.N. Stable and efficient multiple smoothing parameter estimation for generalized additive models. J. Am. Stat. Assoc. 2004, 99, 673–686. [Google Scholar] [CrossRef] [Green Version]
- Wood, S.N. Generalized Additive Models: An Introduction with R, 2nd ed.; Chapman and Hall/CRC: Boca Raton, FL, USA, 2017. [Google Scholar]
- Wood, S.N. Thin-plate regression splines. J. R. Stat. Soc. 2003, 65, 95–114. [Google Scholar] [CrossRef]
- R Core Team. R: A Language and Environment for Statistical Computing; R Core Team: Vienne, Australia, 2020. [Google Scholar]
- Lo, N.C.; Jacobson, L.D.; Squire, J.L. Indices of Relative Abundance from Fish Spotter Data based on Delta-Lognornial Models. Can. J. Fish. Aquat. Sci. 1992, 49, 2515–2526. [Google Scholar] [CrossRef]
- Stefánsson, G. Analysis of groundfish survey abundance data: Combining the GLM and delta approaches. ICES J. Mar. Sci. 1996, 53, 577–588. [Google Scholar] [CrossRef]
- Barry, S.C.; Welsh, A.H. Generalized additive modelling and zero inflated count data. Ecol. Modell. 2002, 157, 179–188. [Google Scholar] [CrossRef]
- Dormann, C.F.; McPherson, J.M.; Araújo, M.B.; Bivand, R.; Bolliger, J.; Carl, G.; Davies, R.G.; Hirzel, A.; Jetz, W.; Daniel Kissling, W.; et al. Methods to account for spatial autocorrelation in the analysis of species distributional data: A review. Ecography 2007, 30, 609–628. [Google Scholar] [CrossRef] [Green Version]
- Muška, M.; Tušer, M.; Frouzová, J.; Mrkvička, T.; Ricard, D.; Seďa, J.; Morelli, F.; Kubečka, J. Real-time distribution of pelagic fish: Combining hydroacoustics, GIS and spatial modelling at a fine spatial scale. Sci. Rep. 2018, 8, 5381. [Google Scholar] [CrossRef] [PubMed]
- Hinch, S.G.; Somers, K.M.; Coliins, N.C. Spatial Autocorrelation and Assessment of Habitat–Abundance Relationships in Littoral Zone Fish. Can. J. Fish. Aquat. Sci. 1994, 51, 701–712. [Google Scholar] [CrossRef]
- Dag, O.; Dolgun, A.; Konar, N.M. Onewaytests: An R Package for One-Way Tests in Independent Groups Designs. R J. 2018, 10, 175–199. [Google Scholar] [CrossRef] [Green Version]
- von Bertalanffy, L. A quantitative theory of organic growth (inquires on growth laws. II). Hum. Biol. 1938, 10, 181–213. [Google Scholar]
- Schwamborn, R.; Mildenberger, T.K.; Taylor, M.H. Assessing sources of uncertainty in length-based estimates of body growth in populations of fishes and macroinvertebrates with bootstrapped ELEFAN. Ecol. Modell. 2019, 393, 37–51. [Google Scholar] [CrossRef] [Green Version]
- Mildenberger, T.K.; Taylor, M.H.; Wolff, M. TropFishR: An R package for fisheries analysis with length-frequency data. Methods Ecol. Evol. 2017, 8, 1520–1527. [Google Scholar] [CrossRef] [Green Version]
- Taylor, M.H.; Mildenberger, T.K. Extending electronic length frequency analysis in R. Fish. Manag. Ecol. 2017, 24, 230–238. [Google Scholar] [CrossRef]
- Schwamborn, R.; Mildenberger, T.K.; Taylor, M.H. Fishboot: Bootstrap-Based Methods for the Study of Fish Stocks and Aquatic Populations; R Foundation for Statistical Computing: Vienna, Austria, 2018. [Google Scholar]
- Gulland, J.A.; Holt, S.J. Estimation of Growth Parameters for Data at Unequal Time Intervals. ICES J. Mar. Sci. 1959, 25, 47–49. [Google Scholar] [CrossRef]
- Torrejon-Magallanes, J. sizeMat: Estimate Size at Sexual Maturity; R Foundation for Statistical Computing: Vienna, Austria, 2020. [Google Scholar]
- Stehmann, M.F.W. Proposal of a maturity stages scale for oviparous and viviparous cartilaginous fishes (Pisces, Chondrichthyes). Arch. Fish. Mar. Res. 2002, 50, 23–48. [Google Scholar]
- Gedamke, T.; Hoenig, J.M. Estimating Mortality from Mean Length Data in Nonequilibrium Situations, with Application to the Assessment of Goosefish. Trans. Am. Fish. Soc. 2006, 135, 476–487. [Google Scholar] [CrossRef]
- Ricker, W.E. Computation and interpretation of biological statistics of fish populations. Bull. Fish. Res. Bd. Can. 1975, 191, 1–382. [Google Scholar]
- Gunderson, D.R.; Dygert, P.H. Reproductive effort as a predictor of natural mortality rate. ICES J. Mar. Sci. 1988, 44, 200–209. [Google Scholar] [CrossRef]
- Beverton, R.J.H.; Holt, S.J. A review of the lifespans and mortality rates of fish in nature, and their relation to growth and other physiological characteristics. In CIBA Foundation Colloquia on Ageing; John Wiley & Sons, Ltd.: Chichester, UK, 1959; Volume 5, pp. 142–180. [Google Scholar]
- Cubillos, L.A.; Alarcón, R.; Brante, A. Empirical estimates of natural mortality for the Chilean hake (Merluccius gayi): Evaluation of precision. Fish. Res. 1999, 42, 147–153. [Google Scholar] [CrossRef]
- Frisk, M.G.; Miller, T.J.; Fogarty, M.J. Estimation and analysis of biological parameters in elasmobranch fishes: A comparative life history study. Can. J. Fish. Aquat. Sci. 2001, 58, 969–981. [Google Scholar] [CrossRef]
- Hewitt, D.A.; Hoenig, J.M. Comparison of two approaches for estimating natural mortality based on longevity. Fish. Bull. 2005, 103, 433. [Google Scholar]
- Pauly, D.; Binohlan, C. FishBase and AUXIM as Tools for Comparing Life-history Patterns, Growth and Natural Mortality of fish: Applications to Snappers and Groupers a International Center for Living Aquatic Resources Management International Center for Living Aquatic Resources. Iclarm 1996, 48, 218–243. [Google Scholar]
- Taylor, C.C. Temperature, growth, and mortality—The pacific cockle. ICES J. Mar. Sci. 1960, 26, 117–124. [Google Scholar] [CrossRef]
- Tanaka, S. Studies on the dynamics and the management of fish populations. Bull. Tokai Fish. Res. Lab. 1960, 28, 1–200. [Google Scholar]
- Alverson, D.L.; Carney, M.J. A graphic review of the growth and decay of population cohorts. ICES J. Mar. Sci. 1975, 36, 133–143. [Google Scholar] [CrossRef]
- Pauly, D. On the interrelationships between natural mortality, growth parameters, and mean environmental temperature in 175 fish stocks. ICES J. Mar. Sci. 1980, 39, 175–192. [Google Scholar] [CrossRef]
- Hoenig, J.M. Empirical use of longevity data to estimate mortality rates. Fish. Bull. 1983, 82, 898–903. [Google Scholar]
- Alagaraja, K. Simple methods for estimation of parameters for assessing exploited fish stocks. Indian J. Fish. 1984, 31, 177–208. [Google Scholar]
- Djabali, F.; Mehailia, A.; Koudil, M.; Brahmi, B. Empirical equations for the estimation of natural mortality in Mediterranean teleosts. NAGA, ICLARM Q. 1993, 16, 35–37. [Google Scholar]
- Jensen, A.L. Beverton and Holt life history invariants result from optimal trade-off of reproduction and survival. Can. J. Fish. Aquat. Sci. 1996, 53, 820–822. [Google Scholar] [CrossRef]
- Gulland, J.A. The Fish Resources of the Ocean; Fishing News (Books) Ltd.: West Byfleet, UK, 1971. [Google Scholar]
- Ortiz, M.; Arocha, F. Alternative error distribution models for standardization of catch rates of non-target species from a pelagic longline fishery: Billfish species in the Venezuelan tuna longline fishery. Fish. Res. 2004, 70, 275–297. [Google Scholar] [CrossRef]
- Zuur, A.F.; Ieno, E.N. Beginner’s Guide to Zero-Inflated Models with R; Highland Statistics Ltd.: Newburgh, UK, 2016; ISBN 978-0-9571741-8-4. [Google Scholar]
- Lenth, R. V Least-Squares Means: The {R} Package {lsmeans}. J. Stat. Softw. 2016, 69, 1–33. [Google Scholar] [CrossRef] [Green Version]
- Jardas, I. A contribution to our knowledge of the biology and ecology of thornback ray (Raja clavata L.) and brown ray (Raja miraletus L.) in the Adriatic. Acta Adriat. 1973, 15, 1–42. [Google Scholar]
- Stehmann, M.; Bürkel, D.L. Rajidae. In Fishes of the North-Eastern Atlantic and the Mediterranean; Whitehead, P., Bauchot, M., Hureau, J., Nielsen, J., Tortonese, E., Eds.; UNESCO: Paris, France, 1984; pp. 163–196. [Google Scholar]
- Punzón, A.; López-López, L.; González-Irusta, J.M.; Preciado, I.; Hidalgo, M.; Serrano, A.; Tel, E.; Somavilla, R.; Polo, J.; Blanco, M.; et al. Tracking the effect of temperature in marine demersal fish communities. Ecol. Indic. 2021, 121, 107142. [Google Scholar] [CrossRef]
- Santos, R.V.S.; Silva, W.M.M.L.; Novoa-Pabon, A.M.; Silva, H.M.; Pinho, M.R. Long-term changes in the diversity, abundance and size composition of deep sea demersal teleosts from the Azores assessed through surveys and commercial landings. Aquat. Living Resour. 2019, 32, 25. [Google Scholar] [CrossRef] [Green Version]
- Magnuson, J.J.; Crowder, L.B.; Medvick, P.A. Temperature as an ecological resource. Am. Zool. 1979, 19, 331–343. [Google Scholar] [CrossRef] [Green Version]
- Parra, H.E.; Pham, C.K.; Menezes, G.M.; Rosa, A.; Tempera, F.; Morato, T. Predictive modeling of deep-sea fish distribution in the Azores. Deep. Res. Part. II Top. Stud. Oceanogr. 2017, 145, 49–60. [Google Scholar] [CrossRef]
- Damalas, D.; Katsanevakis, S.; Maravelias, C.D.; Karageorgis, A.P.; Anagnostou, C.; Tsitsika, E.; Papaconstantinou, C. Habitat preferences and spatiotemporal distribution of four benthic skates in the eastern Mediterranean Sea. In Proceedings of the 9th Symposium on Oceanography & Fisheries, Patras, Greece, 13–16 January 2009; Volume II, pp. 771–776. [Google Scholar]
- Moore, C.; Drazen, J.C.; Radford, B.T.; Kelley, C.; Newman, S.J. Improving essential fish habitat designation to support sustainable ecosystem-based fisheries management. Mar. Policy 2016, 69, 32–41. [Google Scholar] [CrossRef]
- Swain, D.P.; Benoît, H.P. Change in habitat associations and geographic distribution of thorny skate (Amblyraja radiata) in the southern Gulf of St Lawrence: Density-dependent habitat selection or response to environmental change? Fish. Oceanogr. 2006, 15, 166–182. [Google Scholar] [CrossRef]
- Skjæraasen, J.E.; Bergstad, O.A. Distribution and feeding ecology of Raja radiata in the northeastern North Sea and Skagerrak (Norwegian Deep). ICES J. Mar. Sci. 2000, 57, 1249–1260. [Google Scholar] [CrossRef]
- Greenway, E.; Jones, K.S.; Cooke, G.M. Environmental enrichment in captive juvenile thornback rays, Raja clavata (Linnaeus 1758). Appl. Anim. Behav. Sci. 2016, 182, 86–93. [Google Scholar] [CrossRef]
- Yeldan, H.; Avsar, D. Sediment structure and occurrence of skates and rays inhabiting in Babadillimani bight located in northeastern Mediterranean. In Proceedings of the the International Workshop on Mediterranean Cartilaginous Fish with Emphasis on Southern and Eastern Mediterranean, Istanbul, Turkey, 14–16 November 2006; pp. 14–16. [Google Scholar]
- KrstulovićŠifner, S.; Vrgoč, N.; Dadić, V.; Isajlović, I.; Peharda, M.; Piccinetti, C. Long-term changes in distribution and demographic composition of thornback ray, Raja clavata, in the northern and central Adriatic Sea. J. Appl. Ichthyol. 2009, 25, 40–46. [Google Scholar] [CrossRef]
- Farias, I.; Figueiredo, I.; Moura, T.; Serrano Gordo, L.; Neves, A.; Serra-Pereira, B. Diet comparison of four ray species (Raja clavata, Raja brachyura, Raja montagui and Leucoraja naevus) caught along the Portuguese continental shelf. Aquat. Living Resour. 2006, 19, 105–114. [Google Scholar] [CrossRef]
- Holden, M.J.; Tucker, R.N. The food of Raja clavata Linnaeus 1758, Raja montagui Fowler 1910, Raja naevus Müller and Henle 1841 and Raja brachyura Lafont 1873 in British waters. ICES J. Mar. Sci. 1974, 35, 189–193. [Google Scholar] [CrossRef]
- Johnson, A.F.; Valls, M.; Moranta, J.; Jenkins, S.R.; Hiddink, J.G.; Hinz, H. Effect of prey abundance and size on the distribution of demersal fishes. Can. J. Fish. Aquat. Sci. 2012, 69, 191–200. [Google Scholar] [CrossRef] [Green Version]
- Hunter, E.; Buckley, A.A.; Stewart, C.; Metcalfe, J.D. Migratory behaviour of the thornback ray, Raja clavata, in the southern North Sea. Mar. Biol. Assoc. UK J. Mar. Biol. Assoc. UK 2005, 85, 1095. [Google Scholar] [CrossRef]
- Walker, P.; Howlett, G.; Millner, R. Distribution, movement and stock structure of three ray species in the North Sea and eastern English Channel. ICES J. Mar. Sci. 1997, 54, 797–808. [Google Scholar] [CrossRef]
- Frisk, M.G.; Shipley, O.N.; Martinez, C.M.; McKown, K.A.; Zacharias, J.P.; Dunton, K.J. First Observations of Long-Distance Migration in a Large Skate Species, the Winter Skate: Implications for Population Connectivity, Ecosystem Dynamics, and Management. Mar. Coast. Fish. 2019, 11, 202–212. [Google Scholar] [CrossRef] [Green Version]
- Hilborn, R. Determination of fish movement patterns from tag recoveries using maximum likelihood estimators. Can. J. Fish. Aquat. Sci. 1990, 47, 635–643. [Google Scholar] [CrossRef]
- Bolle, L.J.; Hunter, E.; Rijnsdorp, A.D.; Pastoors, M.A.; Metcalfe, J.D.; Reynolds, J.D. Do tagging experiments tell the truth? Using electronic tags to evaluate conventional tagging data. ICES J. Mar. Sci. 2005, 62, 236–246. [Google Scholar] [CrossRef] [Green Version]
- Santos, R.; Pabon, A.; Silva, W.; Silva, H.; Pinho, M. Population structure and movement patterns of blackbelly rosefish in the NE Atlantic Ocean (Azores archipelago). Fish. Oceanogr. 2020, 29. [Google Scholar] [CrossRef]
- Latour, R.J. Tagging methods and associated data analysis. In Management Techniques for Elasmobranch Fisheries; Musick, J.A., Bonfil, R., Eds.; FAO: Rome, Italy, 2005; pp. 45–61. ISBN 92-5-105403-7. [Google Scholar]
- Ellis, J.R.; Cruz-Martínez, A.; Rackham, B.D.; Rogers, S.I. The Distribution of Chondrichthyan Fishes Around the British Isles and Implications for Conservation. J. Northwest. Atl. Fish. Sci. 2004, 35, 195–213. [Google Scholar] [CrossRef]
- Santos, R.; Medeiros-Leal, W.; Crespo, O.; Novoa-Pabon, A.; Pinho, M. Contributions to Management Strategies in the NE Atlantic Regarding the Life History and Population Structure of a Key Deep-Sea Fish (Mora moro). Biology 2021, 10, 522. [Google Scholar] [CrossRef]
- Ryland, J.S.; Ajayi, T.O. Growth and population dynamics of three Raja species (Batoidei) in Carmarthen Bay, British Isles. ICES J. Mar. Sci. 1984, 41, 111–120. [Google Scholar] [CrossRef]
- Relini, G.; Ferrara, G.; Massaro, E. Sintesi Delle Conoscenze Sulle Risorse da Pesca dei Fondi del Meditarraneo Centrale (Italia e Corsica): Synthesis of the Knowledge on Bottom Fishery Resources in Central Mediterranean (Italy and Corsica); Società Italiana di Biologia Marina: Genova, Italy, 1999. [Google Scholar]
- Rousset, J. Population structure of thornback rays Raja clavata and their movements in the Bay of Douarnenez. J. Mar. Biol. Assoc. UK 1990, 70, 261–268. [Google Scholar] [CrossRef]
- Whittamore, J.M.; McCarthy, I.D. The population biology of the thornback ray, Raja clavata in Caernarfon Bay, north Wales. Mar. Biol. Assoc. United Kingdom. J. Mar. Biol. Assoc. UK 2005, 85, 1089. [Google Scholar] [CrossRef]
- Nottage, A.S.; Perkins, E.J. Growth and maturation of roker Raja clavata L. in the Solway Firth. J. Fish. Biol. 1983, 23, 43–48. [Google Scholar] [CrossRef]
- Fitzmaurice, P. Size Distribution and Food of Thornback Rays (Raja clavata L) Caught on Rod and Line on the Mayo Coast; Department of Agriculture and Fisheries (Fisheries Division): Wilayah Persekutuan, Malaysia, 1974. [Google Scholar]
- Wheeler, A.; Stebbing, P. Key to the Fishes of Northern Europe: A Guide to the Identification of More Than 350 Species; F. Waree Pub: London, UK, 1978. [Google Scholar]
- Saglam, H.; Ak, O. Reproductive biology of Raja clavata (Elasmobranchii: Rajidae) from Southern Black Sea coast around Turkey. Helgol. Mar. Res. 2012, 66, 117–126. [Google Scholar] [CrossRef] [Green Version]
- Walmsley-Hart, S.A.; Sauer, W.H.H.; Buxton, C.D. The biology of the skates Raja wallacei and R. pullopunctata (Batoidea: Rajidae) on the Agulhas Bank, South Africa. S. Afr. J. Mar. Sci. 1999, 21, 165–179. [Google Scholar] [CrossRef] [Green Version]
- McCully, S.R.; Scott, F.; Ellis, J.R. Lengths at maturity and conversion factors for skates (Rajidae) around the British Isles, with an analysis of data in the literature. ICES J. Mar. Sci. 2012, 69, 1812–1822. [Google Scholar] [CrossRef] [Green Version]
- Walker, P.A. Fleeting Images: Dynamics of North Sea Ray Populations; Universiteit van Amsterdam: Amsterdam, The Netherlands, 1999. [Google Scholar]
- Holden, M.J.; Rout, D.W.; Humphreys, C.N. The Rate of Egg Laying by Three Species of Ray. ICES J. Mar. Sci. 1971, 33, 335–339. [Google Scholar] [CrossRef]
- Holden, M.J. The fecundity of Raja clavata in British waters. ICES J. Mar. Sci. 1975, 36, 110–118. [Google Scholar] [CrossRef]
- Brander, K.; Palmer, D. Growth rate of Raia clavata in the Northeast Irish Sea. ICES J. Mar. Sci. 1985, 42, 125–128. [Google Scholar] [CrossRef]
- Demirhan, S.A.; Engin, S.; Seyhan, K.; Akamca, E. Some biological aspects of thornback ray (Raja clavata L., 1758) in the southeastern Black Sea. Turkish J. Fish. Aquat. Sci. 2005, 5, 75–83. [Google Scholar]
- Kadri, H.; Marouani, S.; Saïdi, B.; Bradai, M.N.; Bouaïn, A.; Morize, E. Age, growth, sexual maturity and reproduction of the thornback ray, Raja clavata (L.), of the Gulf of Gabès (south-central Mediterranean Sea). Mar. Biol. Res. 2014, 10, 416–425. [Google Scholar] [CrossRef]
- Follesa, M.C.; Carbonara, P. Atlas of the maturity stages of Mediterranean fishery resources. Gen. Fish. Comm. Mediterr. Stud. Rev. 2019, 99, I-259. [Google Scholar]
- ICES. Report of the Workshop for Maturity Staging Chairs (WKMATCH); ICES: Copenhagen, Denmark, 2014; pp. 1–57. [Google Scholar]
- Walker, P.A.; Heessen, H.J.L. Long-term changes in ray populations in the North Sea. ICES J. Mar. Sci. 1996, 53, 1085–1093. [Google Scholar] [CrossRef]
- Walker, P.A.; Hislop, J.R.G. Sensitive skates or resilient rays? Spatial and temporal shifts in ray species composition in the central and north-western North Sea between 1930 and the present day. ICES J. Mar. Sci. 1998, 55, 392–402. [Google Scholar] [CrossRef]
- Aldebert, Y. Demersal resources of the Gulf of Lions (NW Mediterranean). Impact of exploitation on fish diversity. Vie Milieu/Life Environ. 1997, 47, 275–284. [Google Scholar]
- Hilborn, R.; Walters, C.J. Quantitative Fisheries Stock Assessment: Choice, Dynamics and Uncertainty; Springer Science & Business Media: Berlin, Germany, 2013; ISBN 9781461535980. [Google Scholar]
- Froese, R.; Binohlan, C. Empirical relationships to estimate asymptotic length, length at first maturity and length at maximum yield per recruit in fishes, with a simple method to evaluate length frequency data. J. Fish. Biol. 2000, 56, 758–773. [Google Scholar] [CrossRef]
- Pauly, D. Theory and Management of Tropical Multi-Species Stocks: A Review, with Emphasis on the Southeast. Asian Demersal Fisheries; International Center for Living Aquatic Resources Management: Manila, Philippines, 1979; Volume 1. [Google Scholar]
- Santos, R.V.S.; Novoa-Pabon, A.M.; Silva, H.M.; Pinho, M.R. Can we consider the stocks of alfonsinos Beryx splendens and Beryx decadactylus from the Azores a discrete fishery management unit? J. Fish. Biol. 2019, 94. [Google Scholar] [CrossRef] [Green Version]
- Medeiros-Leal, W.; Santos, R.; Novoa-Pabon, A.; Silva, H.; Pinho, M. Population structure of the European conger Conger conger from the mid-North Atlantic Ocean inferred from bathymetric distribution, length composition and movement patterns analyses. Fish. Manag. Ecol. 2021. [Google Scholar] [CrossRef]
- Santos, R.; Pinho, M.; Melo, O.; Gonçalves, J.; Leocádio, A.; Aranha, A.; Menezes, G.; Isidro, E. Biological and ecological aspects of the deep-water red crab populations inhabiting isolated seamounts to the west of the Azores (Mid-Atlantic Ridge). Fish. Oceanogr. 2019, 28. [Google Scholar] [CrossRef]
- Santos, R.; Medeiros-Leal, W.; Novoa-Pabon, A.; Pinho, M.; Isidro, E.; Melo, O.; Santos, R.; Medeiros-Leal, W.; Novoa-Pabon, A.; Pinho, M.; et al. Unraveling distributional patterns and life-history traits of a deep-water shrimp Plesionika edwardsii (Decapoda, Pandalidae) under unexploited virgin conditions: A benchmark for fisheries management. Nauplius 2021, 29. [Google Scholar] [CrossRef]
- Thorson, J.T.; Munch, S.B.; Cope, J.M.; Gao, J. Predicting life history parameters for all fishes worldwide. Ecol. Appl. 2017, 27, 2262–2276. [Google Scholar] [CrossRef]
- Then, A.Y.; Hoenig, J.M.; Hall, N.G.; Hewitt, D.A. Evaluating the predictive performance of empirical estimators of natural mortality rate using information on over 200 fish species. ICES J. Mar. Sci. 2014, 72, 82–92. [Google Scholar] [CrossRef]


| Family | Link Function | Formula | Adjusted R2 | Deviance Explained | |||||
|---|---|---|---|---|---|---|---|---|---|
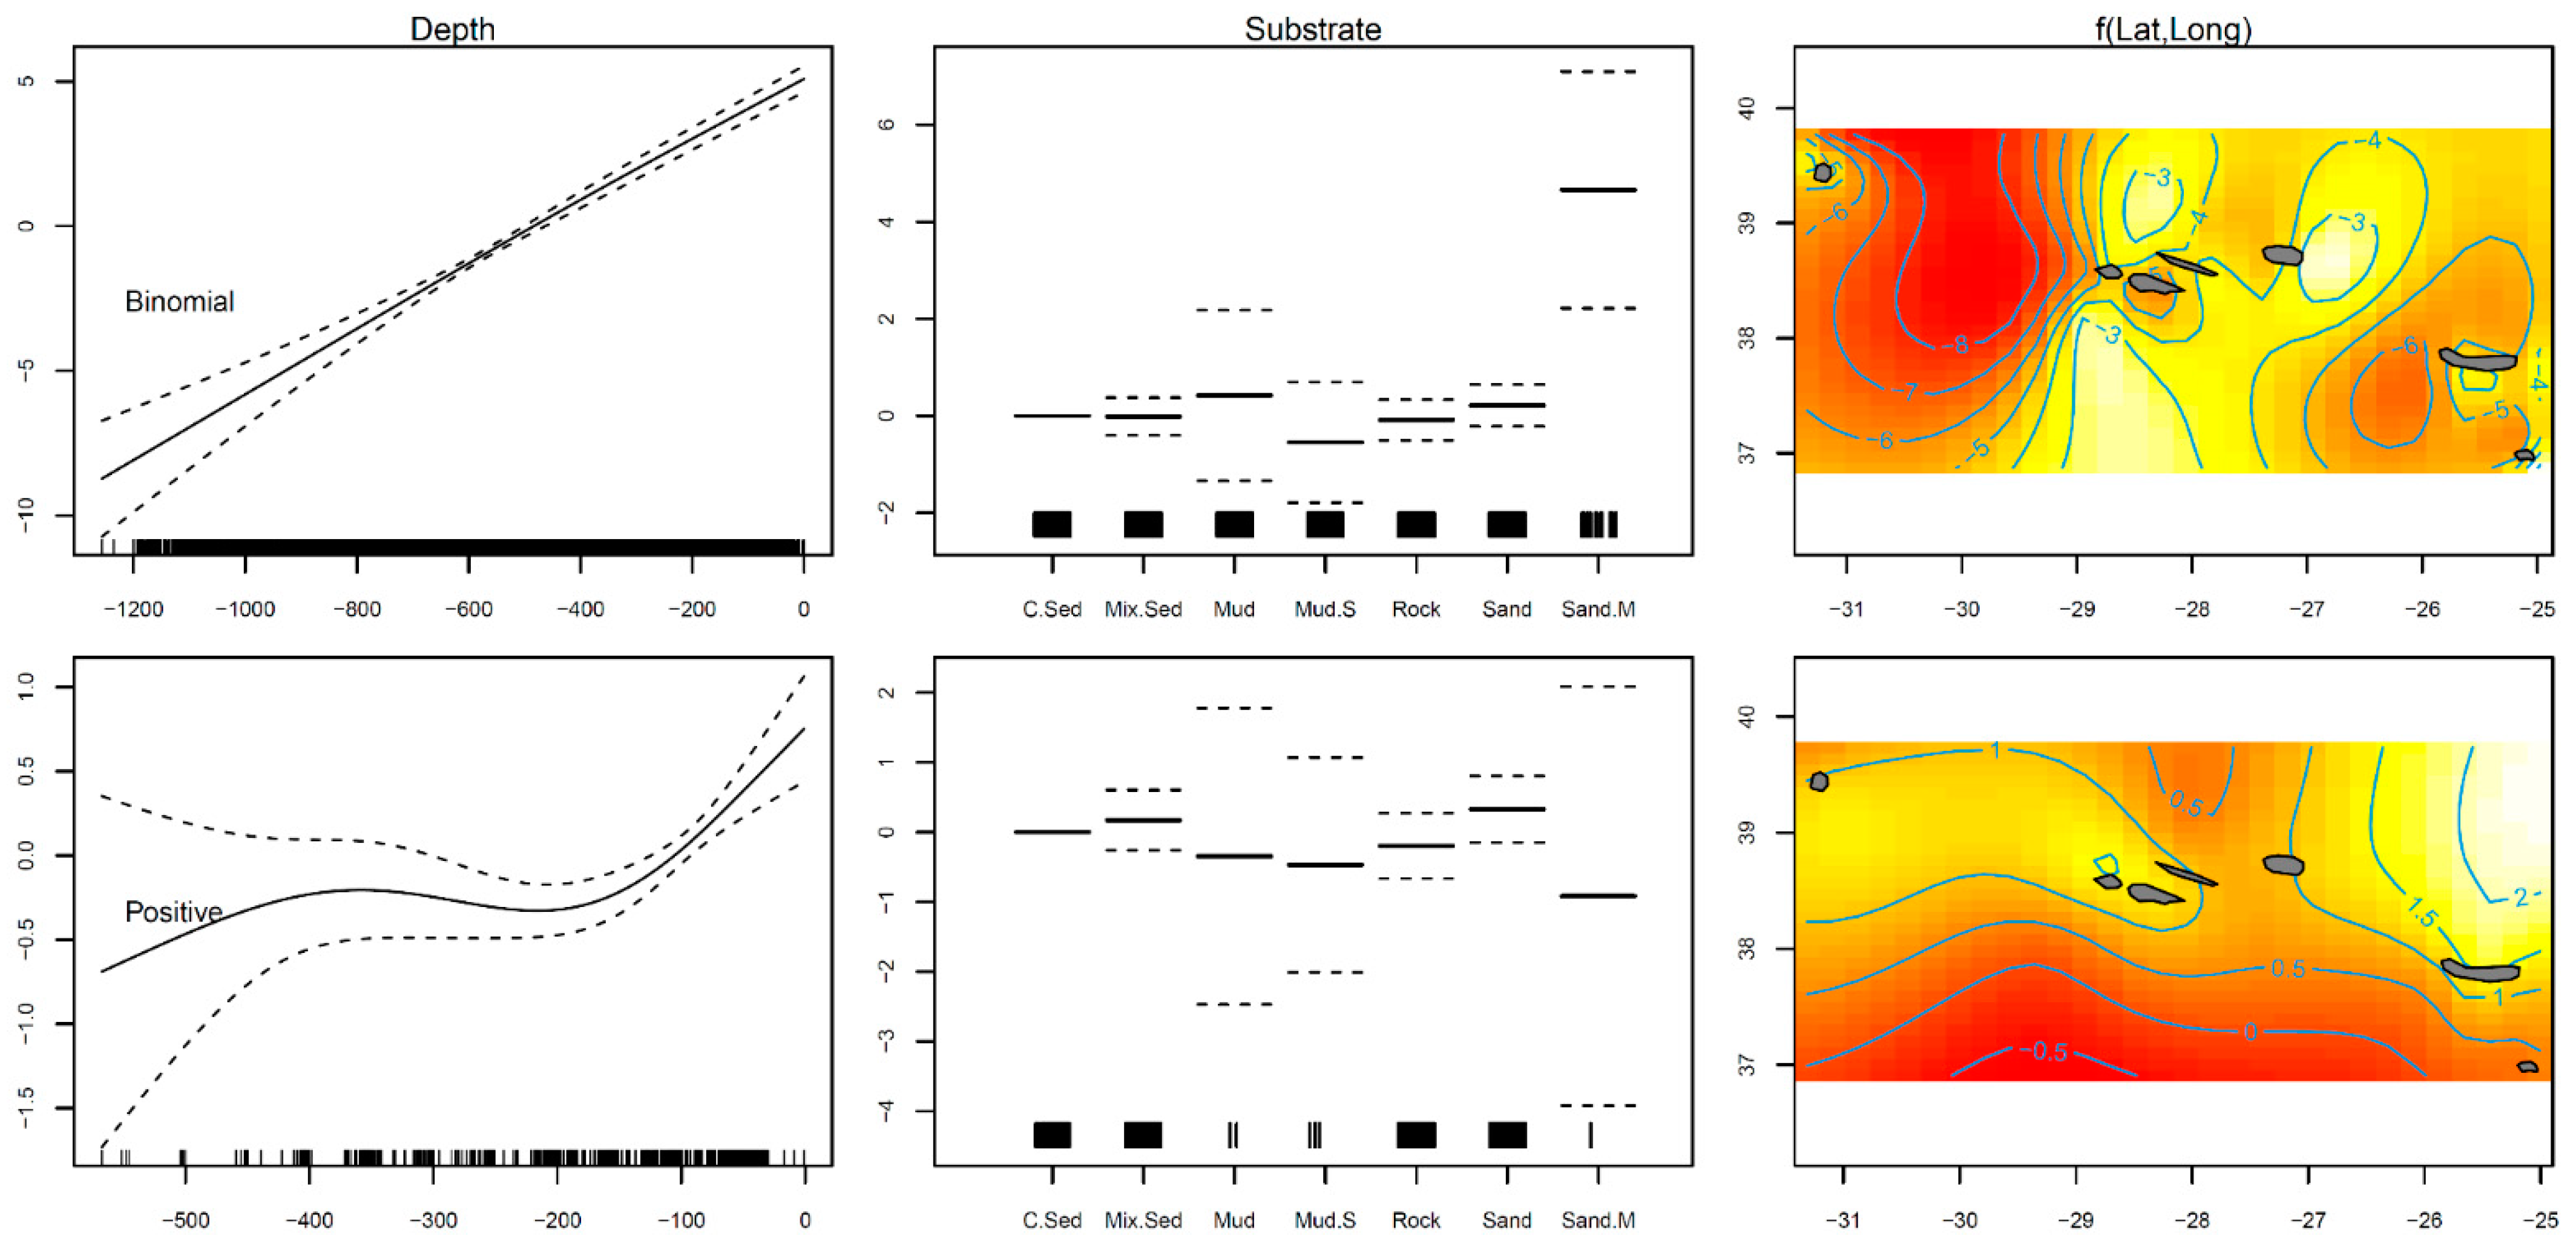
| Binomial | logit | RPN.Bi ~ s(Longitude, Latitude) + s(Depth, k = 4) + Substrate | 0.283 | 37.86% | |||||
| Gaussian | identity | RPN ~ s(Longitude, Latitude) + s(Depth, k = 4) + Substrate | 0.137 | 16.30% | |||||
| Binomial | Gaussian | ||||||||
| Parametric coefficients | |||||||||
| Estimate | Std. Error | z value | Pr(>|z|) | Estimate | Std. Error | z value | Pr(>|z|) | ||
| (Intercept) | −5.086 | 0.264 | −19.233 | <0.001 | (Intercept) | 0.721 | 0.198 | 3.648 | <0.001 |
| SubstrateMix.Sed | −0.014 | 0.194 | −0.071 | 0.944 | SubstrateMix.Sed | 0.173 | 0.216 | 0.798 | 0.425 |
| SubstrateMud | 0.423 | 0.879 | 0.481 | 0.631 | SubstrateMud | −0.346 | 1.063 | −0.325 | 0.745 |
| SubstrateMud.S | −0.546 | 0.621 | −0.879 | 0.380 | SubstrateMud.S | −0.468 | 0.769 | −0.609 | 0.543 |
| SubstrateRock | −0.087 | 0.209 | −0.415 | 0.678 | SubstrateRock | −0.196 | 0.235 | −0.834 | 0.405 |
| SubstrateSand | 0.214 | 0.215 | 0.999 | 0.318 | SubstrateSand | 0.330 | 0.238 | 1.386 | 0.166 |
| SubstrateSand.M | 4.657 | 1.220 | 3.817 | <0.001 | SubstrateSand.M | −0.917 | 1.502 | −0.611 | 0.542 |
| Binomial | Gaussian | ||||||||
| Approximate significance of smooth terms | |||||||||
| edf | Ref. df | Chi. sq | p-value | edf | Ref. df | Chi. sq | p-value | ||
| s (longitude, latitude) | 27.712 | 28.830 | 340.200 | <0.001 | s (Longitude, Latitude) | 14.490 | 18.563 | 3.104 | <0.001 |
| S (depth) | 1.344 | 1.580 | 278.200 | <0.001 | s (Depth) | 2.670 | 2.917 | 8.677 | <0.001 |
| Parameters | Input Data | Method | Sex | Estimates | Lower | Upper |
|---|---|---|---|---|---|---|
| Asymptotic length (L∞; cm LT) | DCF | ELEFAN_GA_Boot [44] | F + M | 92.16 | 90.22 a | 94.76 a |
| Tag–recapture | [48] | F + M | 125.21 | – | – | |
| Tag–recapture | [48] | F | 133.83 | – | – | |
| Tag–recapture | [48] | M | 21.76 | – | – | |
| Growth coefficient (k; year−1) | DCF | ELEFAN_GA_Boot [44] | F + M | 0.104 | 0.099 a | 0.128 a |
| Tag–recapture | [48] | F + M | 0.08 | −0.05 a | 0.21 a | |
| Tag–recapture | [48] | F | 0.06 | −0.11 a | 0.24 a | |
| Tag–recapture | [48] | M | −0.15 | −3.13 a | 2.83 a | |
| Growth performance index (Φ) | DCF | ELEFAN_GA_Boot [44] | F + M | 2.97 | 2.92 a | 3.04 a |
| Natural mortality (M; year−1) | – | [53] | F + M | 0.18 | – | – |
| – | [54] | F + M | 0.17 | – | – | |
| – | [59] | F + M | 0.10 | – | – | |
| – | [60] | F + M | 0.10 | – | – | |
| – | [61] | F + M | 0.26 | – | – | |
| – | [62] | F + M | 0.24 | – | – | |
| – | [63] | F + M | 0.10 | – | – | |
| – | [64] | F + M | 0.15 | – | – | |
| – | [65] | F + M | 0.20 | – | – | |
| – | [58] | F + M | 0.15 | – | – | |
| – | [66] | F + M | 0.17 | – | – | |
| – | [66] | F + M | 0.16 | – | – | |
| – | [55] | F + M | 0.15 | – | – | |
| – | [56] | F + M | 0.14 | – | – | |
| – | [57] | F + M | 0.14 | – | – | |
| – | Average M value | F + M | 0.16 | 0.11 b | 0.21 b | |
| Total mortality (Z; year−1) | DCF | [51] | F + M | 0.30 | 0.29 c | 0.31 c |
| DCF | [52] | F + M | 0.30 | 0.27 a | 0.32 a | |
| Fishing mortality (F; year−1) | – | F = Z − M | F + M | 0.14 | – | – |
| Exploitation rate (E) | – | [67] | F + M | 0.47 | – | – |
| Length of full selectivity (Lc; cm LT) | DCF | [51] | F + M | 67.0 | – | – |
Publisher’s Note: MDPI stays neutral with regard to jurisdictional claims in published maps and institutional affiliations. |
© 2021 by the authors. Licensee MDPI, Basel, Switzerland. This article is an open access article distributed under the terms and conditions of the Creative Commons Attribution (CC BY) license (https://creativecommons.org/licenses/by/4.0/).
Share and Cite
Santos, R.; Medeiros-Leal, W.; Novoa-Pabon, A.; Crespo, O.; Pinho, M. Biological Knowledge of Thornback Ray (Raja clavata) from the Azores: Improving Scientific Information for the Effectiveness of Species-Specific Management Measures. Biology 2021, 10, 676. https://doi.org/10.3390/biology10070676
Santos R, Medeiros-Leal W, Novoa-Pabon A, Crespo O, Pinho M. Biological Knowledge of Thornback Ray (Raja clavata) from the Azores: Improving Scientific Information for the Effectiveness of Species-Specific Management Measures. Biology. 2021; 10(7):676. https://doi.org/10.3390/biology10070676
Chicago/Turabian StyleSantos, Régis, Wendell Medeiros-Leal, Ana Novoa-Pabon, Osman Crespo, and Mário Pinho. 2021. "Biological Knowledge of Thornback Ray (Raja clavata) from the Azores: Improving Scientific Information for the Effectiveness of Species-Specific Management Measures" Biology 10, no. 7: 676. https://doi.org/10.3390/biology10070676