Article

Influence of Varying Dietary ω6 to ω3 Fatty Acid Ratios on the Hepatic Transcriptome, and Association with Phenotypic Traits (Growth, Somatic Indices, and Tissue Lipid Composition), in Atlantic Salmon (Salmo salar)

1
Department of Ocean Sciences, Memorial University of Newfoundland, St. John’s, NL A1C 5S7, Canada
2
Cargill Animal Nutrition, 10383 165th Avenue NW, Elk River, MN 55330, USA
*
Authors to whom correspondence should be addressed.
Biology 2021, 10(7), 578; https://doi.org/10.3390/biology10070578
Submission received: 20 April 2021 / Revised: 18 June 2021 / Accepted: 21 June 2021 / Published: 24 June 2021
(This article belongs to the Special Issue Transcriptome and Genome Analyses Applied to Aquaculture Research)

Abstract

:

Simple Summary

Plant oils are routinely used in fish feeds as a fish oil replacement. However, these terrestrial alternatives typically contain high levels of ω6 fatty acids (FA) and, thus, high ω6 to ω3 (ω6:ω3) FA ratios, which influence farmed fish and their consumers. The ω6:ω3 ratio is known to affect many biological processes (e.g., inflammation, FA metabolism) and human diseases; however, its impacts on fish physiology and the underlying molecular mechanisms are less well understood. In this study, we used 44 K microarrays to examine which genes and molecular pathways are altered by variation in dietary ω6:ω3 in Atlantic salmon. Our microarray study showed that several genes related to immune response, lipid metabolism, cell proliferation, and translation were differentially expressed between the two extreme ω6:ω3 dietary treatments. We also revealed that the PPARα activation-related transcript helz2 is a potential novel molecular biomarker of tissue variation in ω6:ω3. Further, correlation analyses illustrated the relationships between liver transcript expression and tissue (liver, muscle) lipid composition, and other phenotypic traits in salmon fed low levels of fish oil. This nutrigenomic study enhanced the current understanding of Atlantic salmon gene expression response to varying dietary ω6:ω3.

Abstract

The importance of dietary omega-6 to omega-3 (ω6:ω3) fatty acid (FA) ratios for human health has been extensively examined. However, its impact on fish physiology, and the underlying molecular mechanisms, are less well understood. This study investigated the influence of plant-based diets (12-week exposure) with varying ω6:ω3 (0.4–2.7) on the hepatic transcriptome of Atlantic salmon. Using 44 K microarray analysis, genes involved in immune and inflammatory response (lect2a, itgb5, helz2a, p43), lipid metabolism (helz2a), cell proliferation (htra1b), control of muscle and neuronal development (mef2d) and translation (eif2a, eif4b1, p43) were identified; these were differentially expressed between the two extreme ω6:ω3 dietary treatments (high ω6 vs. high ω3) at week 12. Eight out of 10 microarray-identified transcripts showed an agreement in the direction of expression fold-change between the microarray and qPCR studies. The PPARα activation-related transcript helz2a was confirmed by qPCR to be down-regulated by high ω6 diet compared with high ω3 diet. The transcript expression of two helz2 paralogues was positively correlated with ω3, and negatively with ω6 FA in both liver and muscle, thus indicating their potential as biomarkers of tissue ω6:ω3 variation. Mef2d expression in liver was suppressed in the high ω6 compared to the balanced diet (ω6:ω3 of 2.7 and 0.9, respectively) fed fish, and showed negative correlations with ω6:ω3 in both tissues. The hepatic expression of two lect2 paralogues was negatively correlated with viscerosomatic index, while htra1b correlated negatively with salmon weight gain and condition factor. Finally, p43 and eif2a were positively correlated with liver Σω3, while these transcripts and eif4b2 showed negative correlations with 18:2ω6 in the liver. This suggested that some aspects of protein synthesis were influenced by dietary ω6:ω3. In summary, this nutrigenomic study identified hepatic transcripts responsive to dietary variation in ω6:ω3, and relationships of transcript expression with tissue (liver, muscle) lipid composition and other phenotypic traits.

1. Introduction

Plant-based oils are commonly used in aquafeeds to replace fish oil (FO), due to decreasing global availability, rising market price, and concerns regarding the ecological sustainability of the finite fishery resources upon which FO production depends [1,2]. Indeed, plant oils (PO) were shown to be more economical and environmentally sustainable [3], and their inclusion as alternatives to FO in many experimental diets did not affect the growth and survival of farmed Atlantic salmon (Salmo salar) [4,5,6]. However, terrestrial oils are devoid of long-chain polyunsaturated fatty acids (LC-PUFA), such as eicosapentaenoic acid (EPA, 20:5ω3), docosahexaenoic acid (DHA, 22:6ω3), and arachidonic acid (ARA, 20:4ω6), which are abundant in FO. These LC-PUFA have important functions in vertebrate health, reproduction, neural development, and growth, among other biological processes [5,7]. This has resulted in decreased fillet EPA and DHA levels in farmed fish that were fed with PO as a partial or full replacement for FO, compromising their nutritional quality for human consumers [8,9,10]. Further, previous studies reported impacts on fish health and physiology with the dietary replacement of FO by PO (e.g., liver steatosis, altered complement pathway and phagocytic activity, and modulated expression of genes involved in immune response) [11,12,13,14,15]. Another concern is that most terrestrial oils used in aquafeeds, and the farmed seafood consuming them, may not provide adequate ratios of ω6 to ω3 (ω6:ω3) fatty acids (FA) due to high ω6 FA content [10,16,17,18]. Previous human nutrition studies reported that high dietary ω6:ω3 promotes the pathogenesis of many diseases, including cardiovascular, inflammatory, autoimmune, and cognitive diseases, as well as obesity and cancer [19,20,21,22]. An optimal ratio of ω6:ω3 is important for maintaining the homeostasis of many biological processes such as cell apoptosis, inflammation, fatty acid and cholesterol metabolism, and others [23,24,25]. However, the underlying molecular mechanisms are still poorly understood in fish, and it is not known which genes are involved in variation in dietary and tissue ω6:ω3 in salmon fed high levels of terrestrial-based oils.
A feeding trial was performed to examine the impact of five plant-based diets with varying ω6:ω3 on salmon growth, tissue (i.e., muscle, liver) lipid composition, liver LC-PUFA synthesis, and transcript expression (targeted qPCR) of lipid metabolism and eicosanoid synthesis-related genes [26]. The objective of our current study was to utilize a 44 K salmonid oligonucleotide microarray [27,28,29] for the examination of the impact of the two extreme ω6:ω3 diets (i.e., high ω6 and high ω3) on the hepatic transcriptome at week 12. We hypothesized that salmon fed the two diets with the most extreme lipid compositions (i.e., High ω3 and High ω6) would show the most extensive transcriptomic differences. The current study used the same fish as in Katan et al. [26]. The aim was to identify novel biomarker genes and molecular pathways that are altered by variation in ω6:ω3. To aid in the elucidation of the relationships between liver transcripts and phenotypic traits (i.e., growth parameters, somatic indices, tissue FA and lipid class composition), correlation analyses were also performed.

2. Materials and Methods

2.1. Fish and Experimental Diets

Five experimental diets with varying ratios of ω6:ω3 were formulated and manufactured by Cargill Innovation Center (Dirdal, Norway). The diets had ω6:ω3 of 1:3 (high ω3), 1:2 (medium ω3), 1:1 (balanced), 2:1 (medium ω6) and 3:1 (high ω6). Dietary formulations and their lipid composition were published previously [26]. However, as they pertain to the current study, the formulation and lipid profiles of the relevant diets (i.e., high ω3, balanced, and high ω6) are also included as supplementary material herein (Tables S1 and S2). All diets contained the same sources and equal levels of marine and plant proteins, but had different mixes of plant-based oils (i.e., linseed (flax), soy, and palm). All diets were formulated to be isonitrogenous and isoenergetic (Table S1), and to meet the nutritional requirements of salmonids [30].
Atlantic salmon pre-smolts were transported from Northern Harvest Sea Farms (Stephenville, NL, Canada) in October 2015, and held in the Dr. Joe Brown Aquatic Research Building (Ocean Sciences Centre, Memorial University of Newfoundland, St. John’s, NL, Canada) in 3800-L tanks. After their arrival, fish were graded in order to select the most uniform population, and this was followed by PIT (Passive Integrated Transponder; Easy AV, Avid Identification Systems, Norco, CA, USA)-tagging for individual identification. Then, post-smolts (203 ± 24 g mean initial weight ± SE) were randomly distributed into twenty 620-L tanks (40 fish tank−1), and subjected to a 2.5-week acclimation period. After the completion of the acclimation period, fish were switched from the commercial diet (Nutra Transfer NP, 3 mm, Skretting Canada, St. Andrews, NB, Canada), and fed with the experimental diets (4 tanks diet−1) for 12 weeks. The photoperiod was maintained at 24 h light. Fish were fed overnight using automatic feeders, and apparent feed intake was recorded throughout the trial. Mortalities were also recorded during the trial. For additional details regarding the rearing conditions and recordings, refer to Katan et al. [26].

2.2. Sample Collection

Growth performance parameters (e.g., fork-length, weight, organ indices) were measured at the beginning and the end of the 12-week feeding trial [26]. At the end of the trial, salmon were starved for 24 h, and then 5 fish per tank were euthanized with an overdose of MS-222 (400 mg L−1; Syndel Laboratories, Vancouver, BC, Canada) and dissected for tissue collection. For gene expression analyses, liver samples (50–100 mg) were collected in 1.5 mL nuclease-free tubes, flash-frozen in liquid nitrogen, and stored at −80 °C until RNA extractions were performed. Liver and muscle samples, for lipid analyses, were collected, processed, and stored as described in Katan et al. [26]. Only liver samples from fish that showed weight gains within one standard deviation below and above the mean value of each tank were utilized for this study, in order to reduce biological variability in the gene expression data among fish. Tank means rather than dietary treatment means, were chosen for sample selection, so that variability between tanks could be included in the statistical analysis.

2.3. RNA Extraction, DNase Treatment, Column Purification and cDNA Synthesis

The TissueLyser Ⅱ system (at 25 Hz for 2.5 min) with 5 mm stainless steel beads, QIAGEN, Mississauga, ON, Canada) was used to homogenize liver samples in TRIzol reagent (Invitrogen, Carlsbad, CA, USA). Samples were subjected to RNA extraction according to manufacturer’s instructions. Due to low 260/230 ratios (i.e., 1.0–1.6) following TRIzol extraction, all RNA samples were then re-extracted (phenol-chloroform) and precipitated following standard methods [31]. This was followed by DNaseI treatment and column purification using RNase-free DNase Set and RNeasy Mini Kit (QIAGEN). All procedures were conducted according to manufacturer instructions, and as described in Xue et al. [29]. RNA integrity was verified by 1% agarose gel electrophoresis, and RNA purity and quantity were assessed by NanoDrop UV spectrophotometry (NanoDrop, Thermo Scientific, Mississauga, ON, Canada). DNased and column-purified RNA samples had A260/280 and A260/230 ratios of 1.8–2.2. All cDNAs were synthesized by reverse transcription of 1 μg of DNaseI-treated, column-purified total RNA from each sample, with 1 µL of random primers (250 ng; Invitrogen), 1 µL of dNTPs (0.5 mM final concentration; Invitrogen), 4 µL of 5× first-strand buffer (1× final concentration; Invitrogen), 2 µL of DTT (10 mM final concentration; Invitrogen) and 1 µL of Moloney murine leukemia virus (M-MLV) reverse transcriptase (RT) (200 U; Invitrogen) at 37 °C for 50 min, following the manufacturer’s instructions, and as described in Xue et al. [29]. The total reaction volume was 20 μL. Finally, all cDNAs were diluted 40× with nuclease-free water (Invitrogen) prior to the qPCR.

2.4. Microarray Hybridization and Data Acquisition

Eight fish (2 from each of the 4 dietary tanks) from each of the 2 extreme ω6:ω3 treatments (high ω6 or high ω3) were used in the microarray analysis (i.e., 16 fish total), using a common reference design. Four array slides were used in the current study, and each array contained 2 fish per treatment, which were randomly selected. The common reference was made by an equal quantity of each DNase I-treated, column-purified total RNA liver sample. The microarray experiment was performed as described in Xue et al. [29]. Briefly, anti-sense amplified RNA (aRNA) was in vitro transcribed from 1 μg of each column-purified RNA or reference pooled RNA using Ambion’s Amino Allyl MessageAmp II aRNA Amplification kit (Life Technologies, Burlington, ON, Canada), following the manufacturer’s instructions. The quantity and quality of aRNA were assessed using NanoDrop spectrophotometry and 1% agarose gel electrophoresis, respectively. Then, 20 μg of each aRNA were precipitated overnight, following standard molecular biology procedures, and re-suspended in coupling buffer. Each individual aRNA sample was labeled with Cy5 (i.e., experimental samples), whereas the reference pool was labeled with Cy3 (i.e., common reference) fluor (GE HealthCare, Mississauga, ON, Canada), following the manufacturer’s instructions. The “microarray” function of the NanoDrop spectrophotometer was used to measure the labeling efficiency of the aRNA. The labeled aRNA (825 ng) from each experimental sample (i.e., Cy5) was mixed with an equal quantity of labeled aRNA from the common reference (i.e., Cy3), for each array, and the resulting pool was fragmented, following the manufacturer’s instructions (Agilent, Mississauga, ON, Canada). Each pool was co-hybridized to a consortium for Genomic Research on All Salmonids Project (cGRASP)-designed 4 × 44 K salmonid oligonucleotide microarray (GEO accession # GPL11299) [27] (Agilent). Finally, the arrays were hybridized at 65 °C for 17 h with rotation (10 rpm), using an Agilent hybridization oven. The microarray slides were washed immediately after hybridization as per the manufacturer’s instructions.
Each microarray slide was scanned at 5 μm resolution with 90% laser power using a ScanArray Gx Plus scanner and ScanExpress v4.0 software (Perkin Elmer, Waltham, MA, USA), and the Cy3 and Cy5 channel photomultiplier tube (PMT) settings were adjusted to balance the fluorescence signal between channels. The resulting raw data were saved as TIFF images, and the signal intensity data were extracted using Imagene 9.0 (BioDiscovery, El Segundo, CA, USA). Removal of low-quality or flagged spots on the microarray, as well as log2-transformation and Loess-normalization of the data, were performed using R and the Bioconductor package mArray [32]. Features absent in more than 25% (i.e., 4 out of 16 arrays) of the arrays were omitted, and the missing values were imputed using the EM_array method and the LSimpute package [33,34]. The final dataset used for statistical analyses consisted of 10,264 probes for all arrays (GEO accession number: GSE139418; https://www.ncbi.nlm.nih.gov/geo/query/acc.cgi?acc=GSE139418.

2.5. Microarray Data Analysis

The Significance Analysis of Microarrays (SAM) algorithm [35] was performed to identify genes that were significantly differentially expressed between the two extreme ω6:ω3 treatments. A false discovery rate (FDR) threshold of 10% was used with the Bioconductor package siggenes [36] in R. For the identification of additional transcripts that were differentially expressed between the two dietary treatments, the Rank Products (RP) method was also used, as this method is less sensitive to high biological variability [37,38]. The latter analysis was performed at a percentage of false-positives (PFP) threshold of 10%, using the Bioconductor package RankProd [39]. Due to high background signal in the first slide (i.e., slide # 11,502), no genes were initially identified as significantly differentially expressed; therefore, this slide was removed from the analyses. In order to maximize our capacity to identify differentially expressed genes, gene lists were obtained with 2 and 3 of the remaining slides (consisting of 4 and 6 fish per treatment, respectively). Each slide is composed of 4 arrays, i.e., 4 biological replicates analyzed per slide.
The resulting gene lists were annotated using the contiguous sequences (contigs) that were used for the design of the 60 mer oligonucleotide probes of the array [27]. Annotations were performed manually with a BLASTx alignment against the NCBI non-redundant (nr) amino acid database using an E-value threshold of 10−5. The best BLASTx hits corresponding to putative Homo sapiens orthologues were used to obtain gene ontology (GO) terms manually from the UniProt Knowledgebase (http://www.uniprot.org/, accessed on 4 November 2020).

2.6. qPCR Study and Data Analysis

Transcript expression levels of 10 genes of interest (GOI) (Table 1), identified as differentially expressed in the microarray analyses, were assayed by qPCR. In addition to the high ω6 and high ω3 treatments, the qPCR analysis also included liver samples from fish fed the balanced diet. In addition to the microarray-identified GOI, BLASTn searches using publicly available Atlantic salmon cDNA sequences (i.e., in NCBI’s non-redundant nucleotide (nt) and expressed sequence tags (EST) databases) were used to identify paralogues for each GOI, as described in Caballero-Solares et al. [40].
Paralogue-specific primers were used for eif4b, htra1, lect2 and helz2 (Table S3 and Figures S1–S4). The sequences of the primer pairs used in qPCR, GenBank accession number of sequences used for primer design, and other details are presented in Table 1. Notably, primers for the transcript lhpl4 (GenBank accession number NM_001146670) failed quality testing, and thus, this transcript was not included in the qPCR study. In addition, the 60 mer microarray probe for mtco1 (C188R069) is affiliated with a rainbow trout sequence, and had relatively low identity (i.e., <85%) with available Salmo salar sequences (using NCBI’s EST and nt databases) and, therefore, was excluded from the qPCR study. The program Primer 3 (http://frodo.wi.mit.edu, accessed on 19 October 2019) was used for primer design. Each primer pair was quality-tested, including standard curve and dissociation curve to ensure that a single product was amplified with no primer dimers [32,41]. Primer pairs were quality-tested using the 7500 Fast Real Time PCR system (Applied Biosystems/Life Technologies, Foster City, CA, USA). The amplification efficiency [42] of each primer pair was determined using a 5-point 1:3 dilution series starting with cDNA representing 10 ng of input total RNA. Two pools were generated (i.e., high ω3 pool and high ω6 pool), with each pool consisting of 8 fish (and each fish contributing an equal quantity to the pool). The reported primer pair amplification efficiencies are an average of the two pools, except if one pool showed poor efficiency or spacing (i.e., p43, eif2a, htra1a, helz2a and helz2b, where one pool was used due to low expression levels). A 5-point 1:2 dilution series was used for the primers mtco2 and helz2b as these transcripts had lower expression levels (fluorescence threshold cycle (CT) values of ~30 and 31, respectively). Furthermore, amplicons were checked by 1.5% agarose gel electrophoresis and compared with the 1 kb plus DNA Ladder (Invitrogen) to ensure that the correct size fragment was amplified.
To select the most suitable normalizer genes, six candidate normalizers were tested based on our previous qPCR studies (rpl32, actb, eef1α-1, eef1α-2, abcf2, pabpc1) [15,29], and salmon literature on reference genes (actb, eef1α-1, eef1α-2) [43]. Their qPCR primers were quality-tested as described above. Then, their CT values were measured using cDNA (corresponding to 5 ng of input total RNA) of 6 randomly selected fish per treatment (18 total). The geNorm algorithm [44] was used to analyze their expression stability. Rpl32 and eef1α-2 were shown to be the most stable (i.e., geNorm M-values of 0.30 and 0.25, respectively) among the 6 candidate reference genes and, therefore, were selected as normalizers.
All PCR amplifications were performed in a total reaction volume of 13 μL and consisted of 4 μL of cDNA (5 ng input total RNA), 50 nM each of forward and reverse primer and 1× Power SYBR Green PCR Master Mix (Applied Biosystems), and nuclease-free water (Invitrogen). The qPCR reactions, including no-template controls, were performed in technical triplicates using the ViiA 7 Real-Time PCR System (384-well format) (Applied Biosystems, Foster City, CA, USA) and the Power SYBR Green I dye chemistry. The Real-Time analysis program consisted of 1 cycle of 50 °C for 2 min, 1 cycle of 95 °C for 10 min, followed by 40 cycles (of 95 °C for 15 s and 60 °C for 1 min), with the fluorescence signal data collection after each 60 °C step. When a CT value within a triplicate was greater than 0.5 cycles from the other two values, it was considered to be an outlier, discarded and the average CT of the remaining two values was calculated. The relative quantity (RQ) of each transcript was calculated using ViiA 7 Software v1.2 (Applied Biosystems) for Comparative CT (ΔΔCT) analysis [45], with primer amplification efficiencies incorporated (Table 1). The expression levels of each GOI were normalized to both normalizer genes, and the sample with the lowest normalized expression was used as the calibrator sample (i.e., RQ = 1.0) for each GOI, as in [46]. Transcript expression data are presented as RQ values (mean ± SE) relative to the calibrator.

2.7. Statistical Analyses

2.7.1. qPCR Data

A general linear model with tank nested in diet, followed by a Tukey pairwise comparison (p < 0.05), was used to identify significant differences among dietary treatments at week 12. In cases where significant tank effect was observed (p < 0.05), a one-way ANOVA followed by a Tukey pairwise comparison post-hoc test was performed (Minitab 17 Statistical Software, State College, PA, USA). The RQ data are presented as mean ± SE. Each dietary treatment group was tested for outliers using Grubb’s test (p < 0.05). In total, 9 RQ values were identified as statistical outliers in the entire dataset (i.e., out of 322 values), and excluded from the study. Each GOI had a minimum of 6 samples per dietary treatment, while most GOI had a sample size of 7–8 per dietary treatment. The qPCR fold-changes were calculated by dividing the mean RQ value of the high ω6 fish by that of the high ω3 fish. Finally, residuals were tested to verify normality, independence, and homogeneity of variance. Normality was examined using the Anderson–Darling test. If the test failed (p < 0.05), a one-way ANOVA on ranks was performed, which was followed by the Kruskal–Wallis test (SigmaPlot, Systat Software, Inc., Version 13, San Jose, CA, USA). In all cases, differences were considered statistically significant when p < 0.05.

2.7.2. Correlation Analyses of qPCR and Lipid Composition Data

Tissue lipid composition (muscle and liver) and growth performance of salmon fed varying ω6:ω3 diets were previously published by Katan et al. [26]. Pearson correlation analyses were performed in the current study to identify the relationships between hepatic transcript expression (i.e., qPCR data), tissue composition (i.e., % FA and lipid classes), and growth parameters (i.e., weight gain (WG), condition factor (CF)), using individual fish. All GOI in the qPCR study were used in the correlation analysis in order to identify differences between the liver and muscle tissue. Only ω3 and ω6 FA that accounted for >0.5% of the total FA in the tissue (average of each treatment) were included in the analyses. Furthermore, hierarchical clustering was used to group transcripts and lipid composition (using group average in PRIMER (Version 6.1.15, Ivybridge, UK)). IBM SPSS Statistics was used for the correlation analyses.

3. Results

3.1. Liver Microarray Analysis

RP analysis detected nine differentially expressed features (PFP < 10%; Table 2). Eight of these features (i.e., lhpl4, htra1b, mtco2, lect2a, rpl18, helz2a, itgb5, and mtco1) were identified analyzing data from two slides (slides # 11,504–11,505; comprising four fish per treatment), and one (i.e., mef2d) was identified analyzing data from three slides (slides # 11,503–11,505; comprising six fish per treatment). Two features (i.e., lhpl4 and htra1b) showed higher expression in the high ω6 fish (4.78- and 3.57-fold change, respectively), while the other seven RP-identified features (i.e., mtco2, lect2a, rpl18, mef2d, helz2a, itgb5, and mtco1) showed down-regulation in the high ω6 fish (fold-change ranged from −3.27 to −7.11).
SAM analysis identified p43, eif2a, eif4b1, and itgb5 as differentially expressed genes (FDR < 10%) between the high ω6 and high ω3 fed salmon, using three slides (slides # 11,503–11,505) (Table 2). These genes were down-regulated in the high ω6 compared with the high ω3 fed fish (fold-change values ranged from −2.79 to −5.12). One feature (itgb5) was represented in both SAM and RP analysis, and was down-regulated in the high ω6 compared to the high ω3 fed fish, in both analyses (−5.12 and −5.25- fold-change, respectively).
Putative identities were determined for the 12 microarray-identified features, and functional annotations (i.e., GO terms) were collected for them (Table 2). The microarray-identified gene lhpl4 (4.78-fold up-regulated) is involved in the nervous system, with GO annotations “regulation of inhibitory synapse assembly” and “GABA receptor binding”. The feature htra1b (3.57-fold up-regulated) was classified as a gene involved in cell proliferation and showed the functional annotations “positive regulation of epithelial cell proliferation”, “proteolysis” and “extracellular space” (Table 2). Several informative microarray features represented genes involved in translation, such as p43, eif2a, eif4b1, and rpl18 (−2.79 to −4.37-fold down-regulated), with the associated GO terms “tRNA binding”, “aminoacyl-tRNA synthetase multienzyme complex”, “translational initiation”, “ribosome assembly”, and “structural constituent of ribosome”. Furthermore, the GO terms “defense response to virus”, “inflammatory response” and “response to wounding” were also identified with p43. The features mtco2 and mtco1 (−3.27- and −7.11-fold down-regulated, respectively) were classified as mitochondrion respiratory chain components, and showed the GO terms “electron transport chain”, “oxidation-reduction process” and “cytochrome-c oxidase activity”. Other microarray-identified features corresponded to immune- and inflammation-related genes such as lect2a (with the GO terms “chemotaxis” and “metal ion binding”) and itgb5 (“antigen processing and presentation” and “phagocytic vesicle”), and showed down-regulation in the high ω6 fed fish (−3.48 to −5.25-fold-change, respectively). The gene mef2d (−4.54-fold down-regulated) is involved in muscle cell proliferation, and in neuronal cell differentiation and survival, with the associated GO terms “muscle organ development”, “skeletal muscle cell differentiation” “nervous system development”, “apoptotic process” and “DNA-binding transcription factor activity” (Table 2). Further, the microarray-identified feature itgb5 was associated with the GO term “muscle contraction”. Finally, the gene helz2a (−4.71-fold down-regulated) was classified as a gene involved in lipid metabolism regulation by peroxisome proliferator-activated receptor alpha (PPARα), and showed the functional annotations “regulation of lipid metabolic process”, “nuclear receptor transcription activity”, “ATP binding”, “metal ion binding”, “hydrolase activity” and “ribonuclease activity”.

3.2. qPCR Study

Ten microarray-identified genes were used in the qPCR study. All genes, with the exception of mtco2 and rpl18, showed an agreement in the direction of expression fold-change (i.e., up- or down-regulation) between the microarray and qPCR studies (Table 3). The microarray-identified helz2a showed significantly lower transcript expression in the high ω6 compared to the high ω3 fed fish (−1.49-fold; p = 0.04). The paralogue helz2b showed significantly lower expression in both the high ω6 and balanced groups compared to the high ω3 fed fish (−1.61-fold; p = 0.002). The transcript mef2d showed significantly lower expression in the high ω6 compared to the balanced fed fish (−1.27-fold; p = 0.03), and a lower expression trend in the high ω6 compared to the high ω3 fish (−1.22-fold; p = 0.06). Both paralogues of htra1 were numerically higher (although not statistically significant) in the high ω6 compared to the balanced and high ω3 fish (1.34–1.57-fold and 3.75–2.09-fold; p = 0.25 and 0.07, respectively) (Table 3).

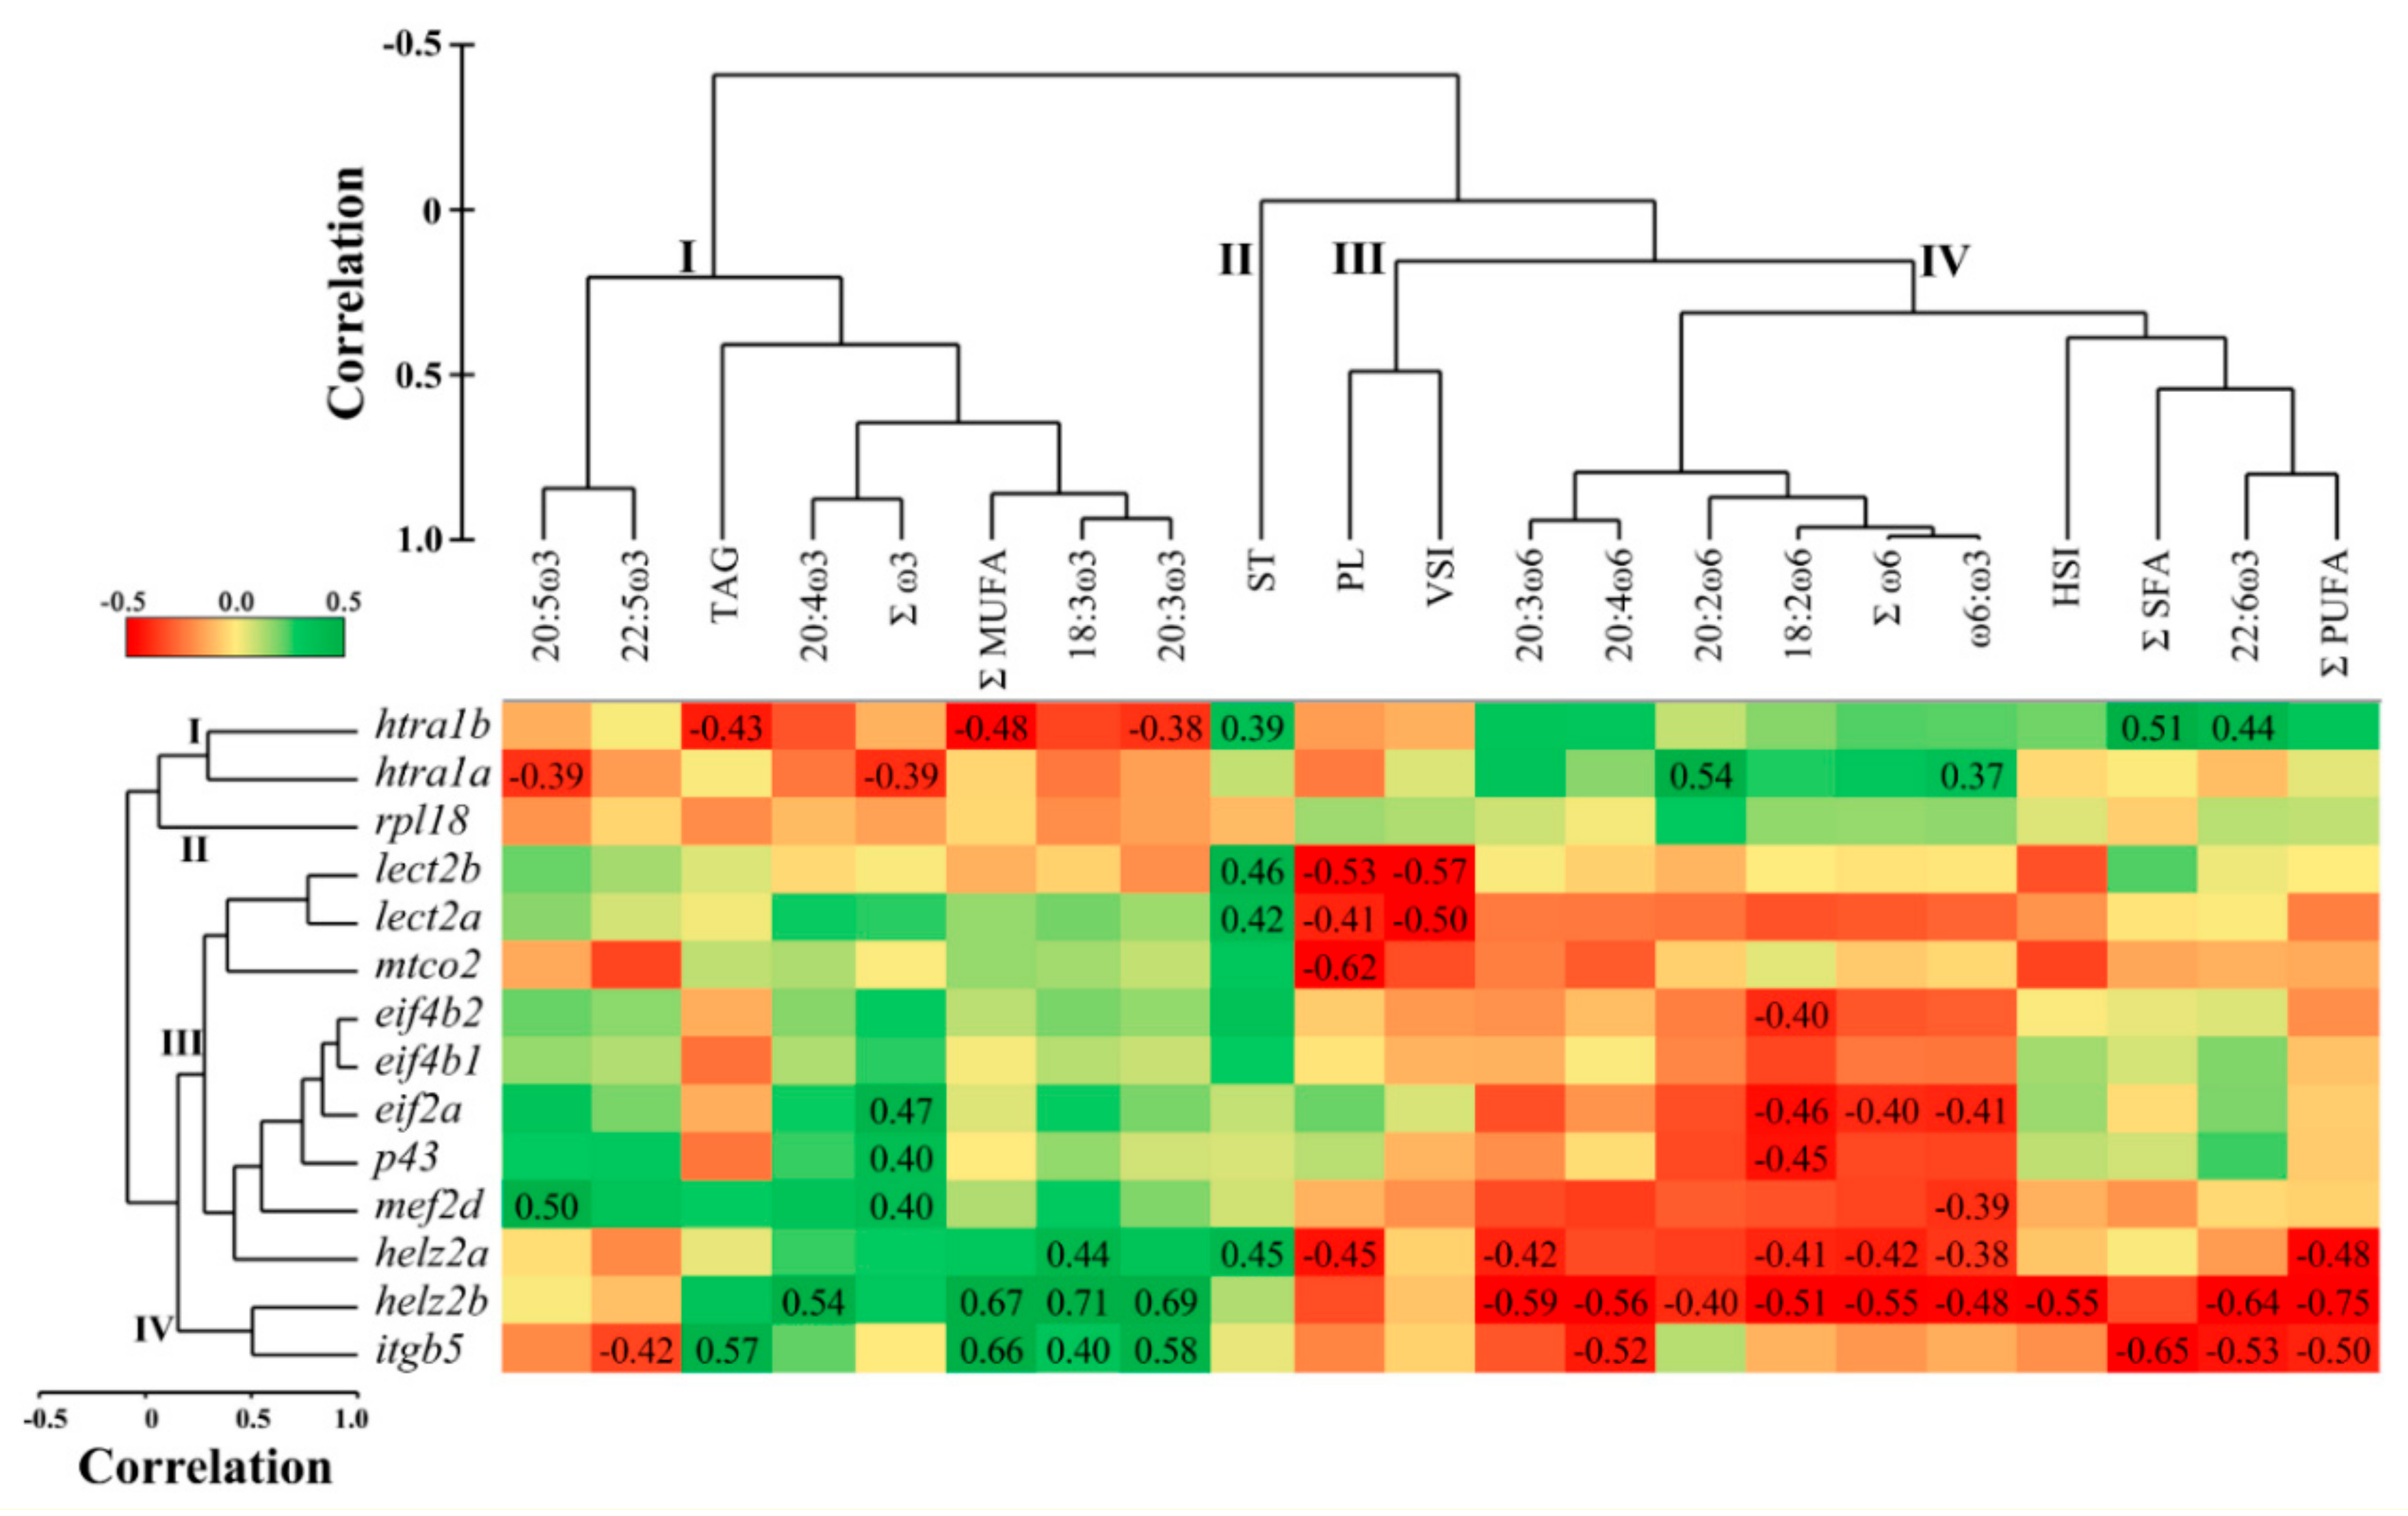
3.3. Correlations between Hepatic qPCR Transcript Expression and Liver Lipid Composition

Hierarchical clustering of the qPCR transcripts showed four separate clusters (Figure 1 and Figure 2). The first cluster consisted of both paralogues of htra1. The second cluster comprised rpl18 only. The third cluster included some of the immune- and inflammation-related transcripts such as lect2, p43, and helz2a, as well as mef2d, eif2a, eif4b, and mtco2. The transcripts helz2b and itgb5 composed the fourth cluster.
Cluster analysis of liver lipid composition and somatic indices showed four clusters (Figure 1). Cluster one consisted of the ω3 FA: 18:3ω3, 20:3ω3, 20:4ω3, 20:5ω3, 22:5ω3, as well as the sums of ω3 (Σω3) and monounsaturated FA (ΣMUFA), and the lipid class triacylglycerols (TAG). The lipid class sterols (ST) represented cluster two, while total phospholipids (PL) segregated with viscerosomatic index (VSI) in cluster three. Cluster four consisted of the ω6 FA: 18:2ω6, 20:2ω6, 20:3ω6, 20:4ω6, Σω6, and the ratio ω6:ω3; in addition, 22:6ω3, the sums of PUFA (ΣPUFA) and saturated fatty acids (ΣSFA), and the hepatosomatic index (HSI) were associated with this cluster.
The hepatic transcript expression of htra1b was negatively correlated with TAG, ΣMUFA, and 20:3ω3, and positively with ST, ΣSFA, and 22:6ω3 (p = 0.009–0.043; Figure 1). Htra1a showed negative correlations with 20:5ω3 and Σω3, and positive with 20:2ω6, and ω6:ω3 (p = 0.006–0.047). Both paralogues of lect2 were correlated negatively with PL and VSI, and positively with ST (p = 0.004–0.032). Transcript expression of mtco2 was negatively correlated with PL (p = 0.001), while that of eif4b2 was negatively correlated with 18:2ω6 (p = 0.036; Figure 1). Both eif2a and p43 transcript expression correlated negatively with 18:2ω6 (p = 0.019 and 0.021, respectively) and positively with Σω3, whereas eif2a alone correlated negatively with Σω6 and ω6:ω3 (p = 0.037 and 0.033, respectively). Mef2d was correlated negatively with ω6:ω3 and positively with 20:5ω3 (p = 0.042, and 0.011, respectively), while the three transcripts eif2a, p43, and mef2d showed positive correlations with Σω3 (p = 0.016–0.037). Furthermore, both paralogues of helz2 correlated negatively with ω6 PUFA (i.e., 18:2ω6, 20:3ω6, Σω6), ω6:ω3, and ΣPUFA, and positively with 18:3ω3 (p = 0.0001–0.047). However, helz2b had negative correlations with additional ω6 (i.e., 20:2ω6, 20:4ω6; p = 0.038 and 0.004, respectively), and positive correlations with ω3 PUFA (i.e., 20:3ω3, 20:4ω3; p = 0.0001 and 0.005, respectively). In addition, helz2b correlated negatively with 22:6ω3 and HSI, and positively with ΣMUFA (p = 0.0001–0.005). In contrast, helz2a correlated negatively with PL, and positively with ST (p = 0.021). Finally, itgb5 had negative correlations with 22:5ω3, 20:4ω6, ΣSFA, 22:6ω3, and ΣPUFA, and positive correlations with TAG, ΣMUFA, 18:3ω3, and 20:3ω3 (p =0.001–0.034; Figure 1).

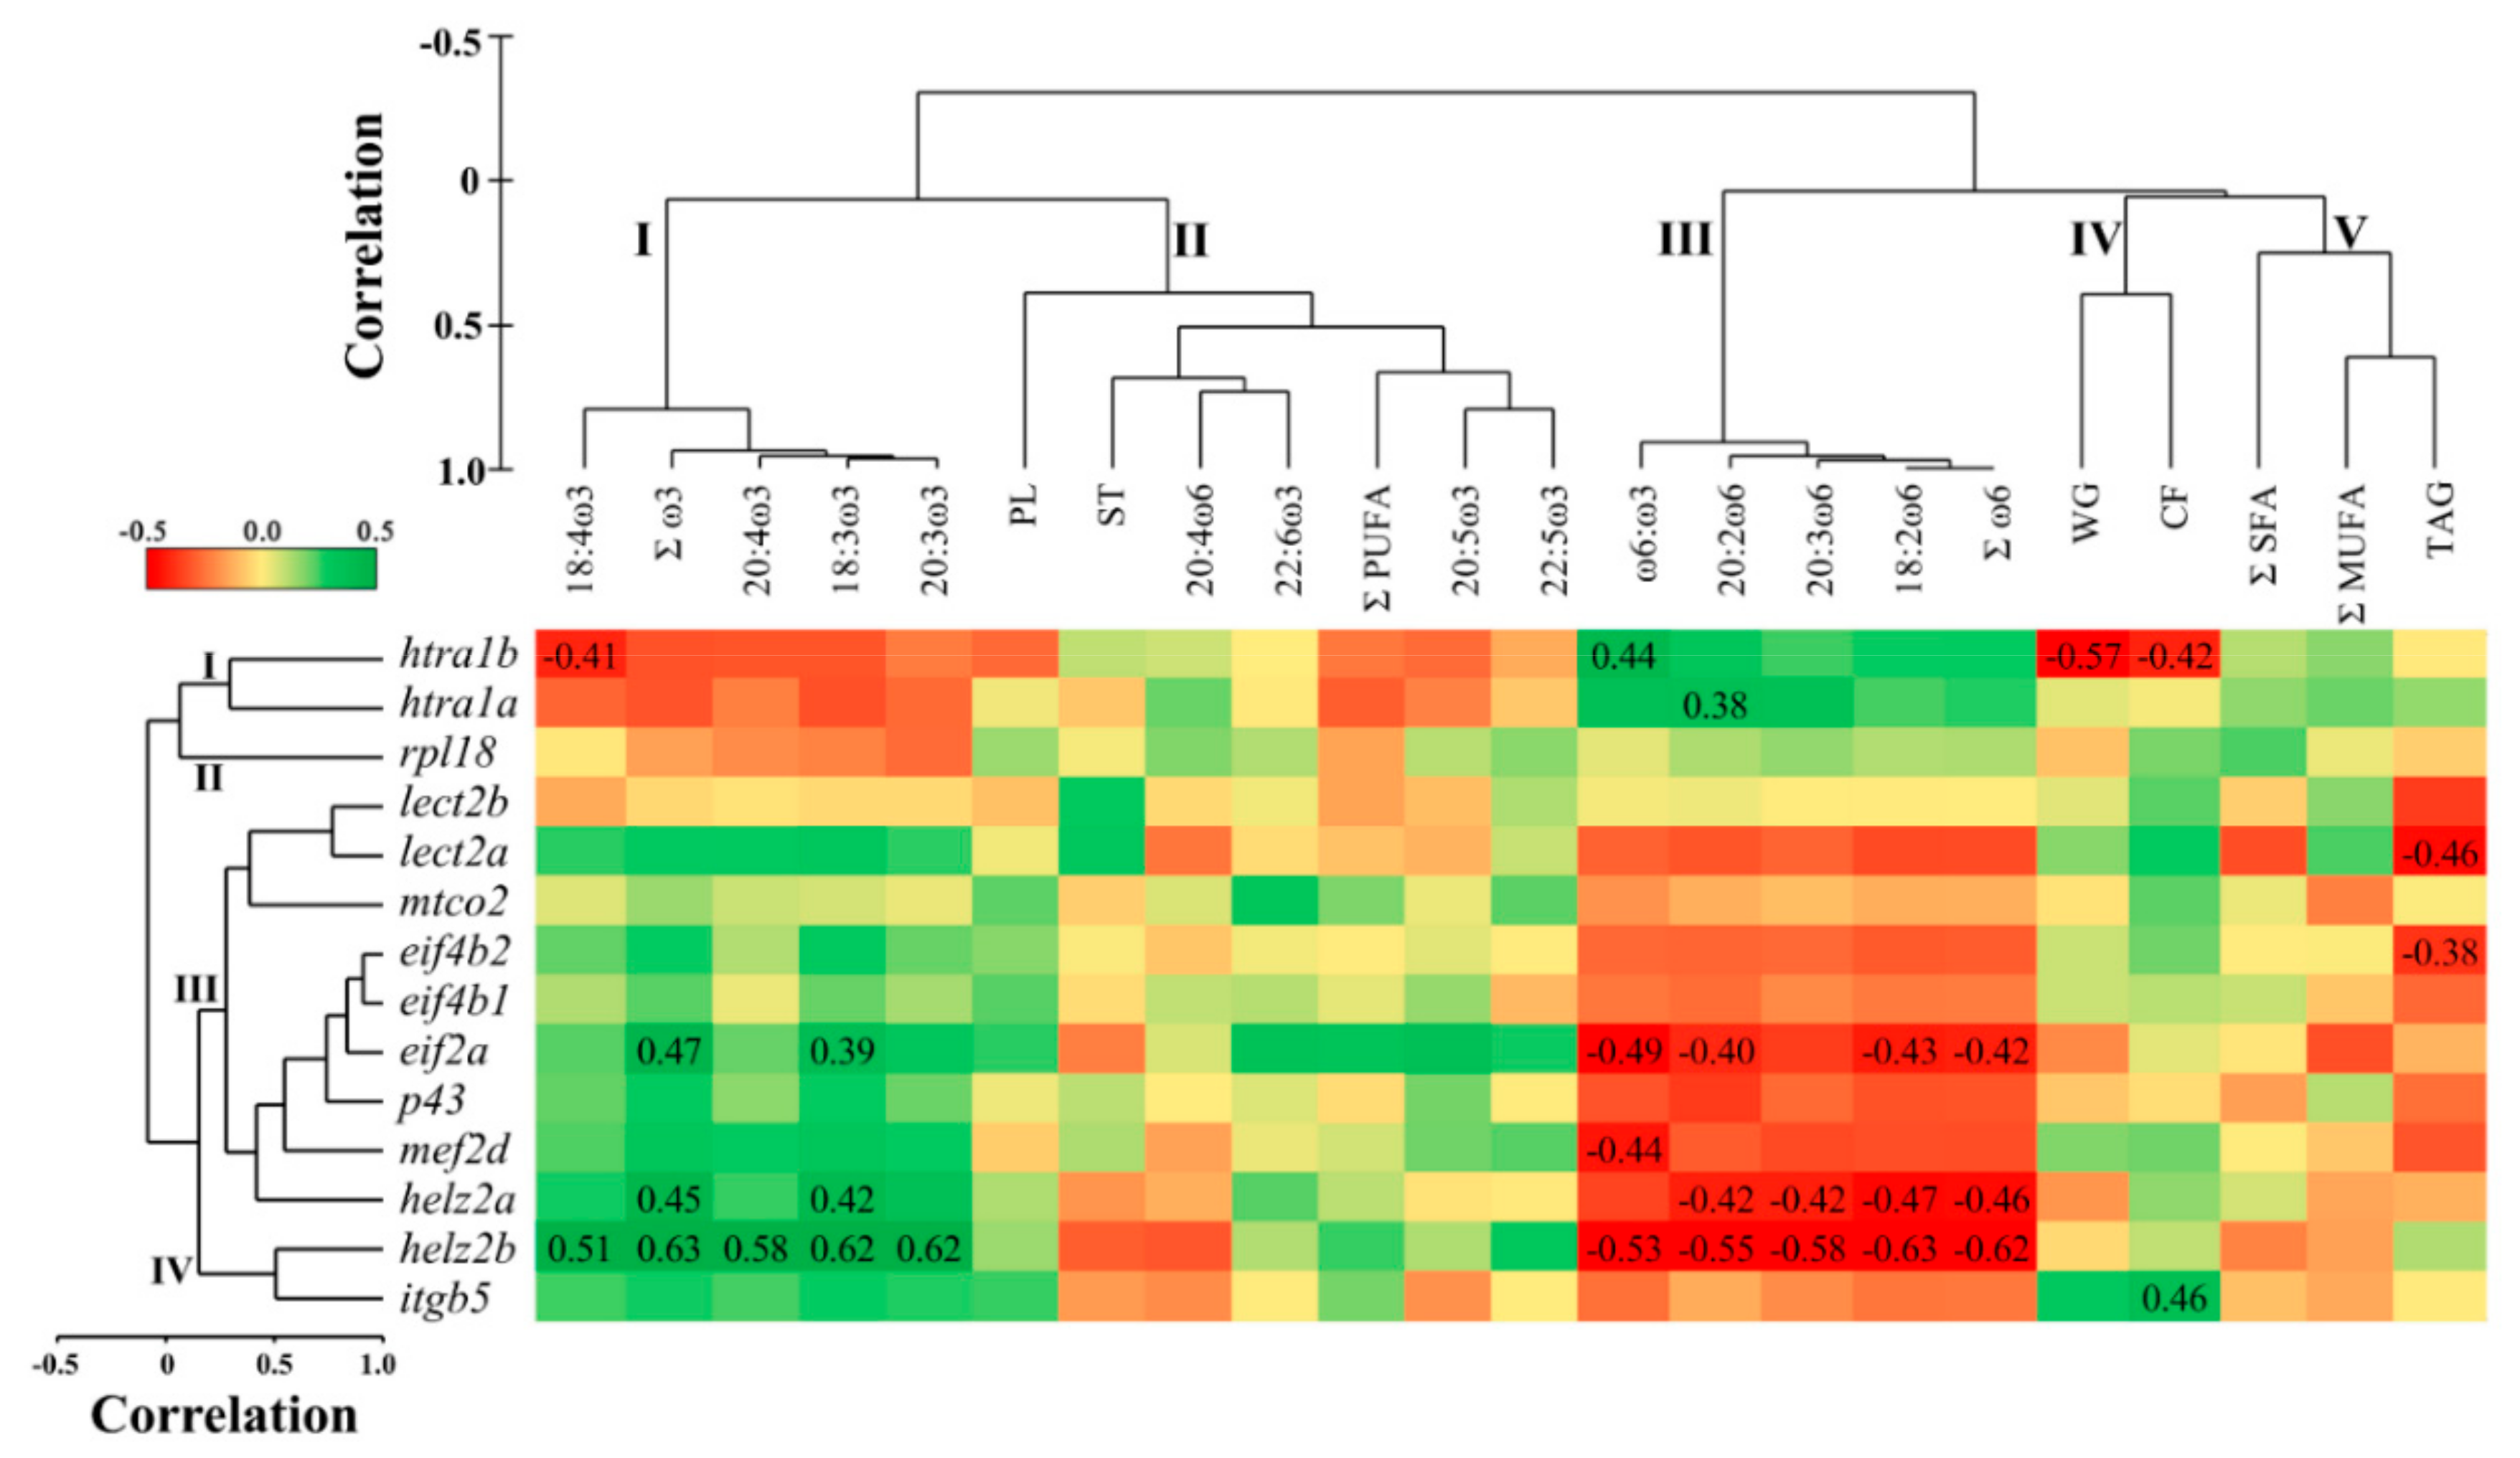
3.4. Correlations between Hepatic qPCR Transcript Expression and Muscle Lipid Composition

Muscle tissue lipid composition and growth showed five separate clusters (Figure 2). Cluster one consisted of the ω3 FA: 18:3ω3, 18:4ω3, 20:3ω3, 20:4ω3, and Σω3. Cluster two included ΣPUFA, and the LC-PUFA: 20:5ω3, 22:5ω3. 22:6ω3, and 20:4ω6. Furthermore, the lipid classes ST and PL were grouped in cluster two. Cluster three grouped the ω6 FA: 18:2ω6, 20:2ω6, 20:3ω6, as well as Σω6 and the ratio ω6:ω3. Cluster four showed the growth parameters (i.e., WT and CF), while cluster five grouped TAG, ΣSFA and ΣMUFA.
The hepatic transcript expression of htra1b was correlated negatively with muscle 18:4ω3 and growth parameters WG and CF, and positively with ω6:ω3 (p = 0.004–0.037), while that of htra1a showed positive correlation with 20:2ω6 (p = 0.049; Figure 2). The transcript expression of lect2a and eif4b2 was negatively correlated with TAG (p = 0.021 and 0.049, respectively). Eif2a was correlated negatively with muscle ω6 FA (i.e., 18:2ω6, 20:2ω6, Σω6) and ω6:ω3, and positively with ω3 FA (18:3ω3 and Σω3) (p = 0.014–0.045; Figure 2). Mef2d was negatively correlated with ω6:ω3 (p = 0.026). Further, both paralogues of helz2 were negatively correlated with ω6 FA (18:2ω6, 20:2ω6, 20:3ω6, Σω6), and positively correlated with ω3 (i.e., 18:3ω3 and Σω3) (p = 0.001–0.032). Helz2b alone correlated negatively with ω6:ω3, and positively with 18:4ω3, 20:3ω3, and 20:4ω3 (p = 0.002–0.01). Finally, itgb5 showed a positive correlation with CF (p = 0.024).

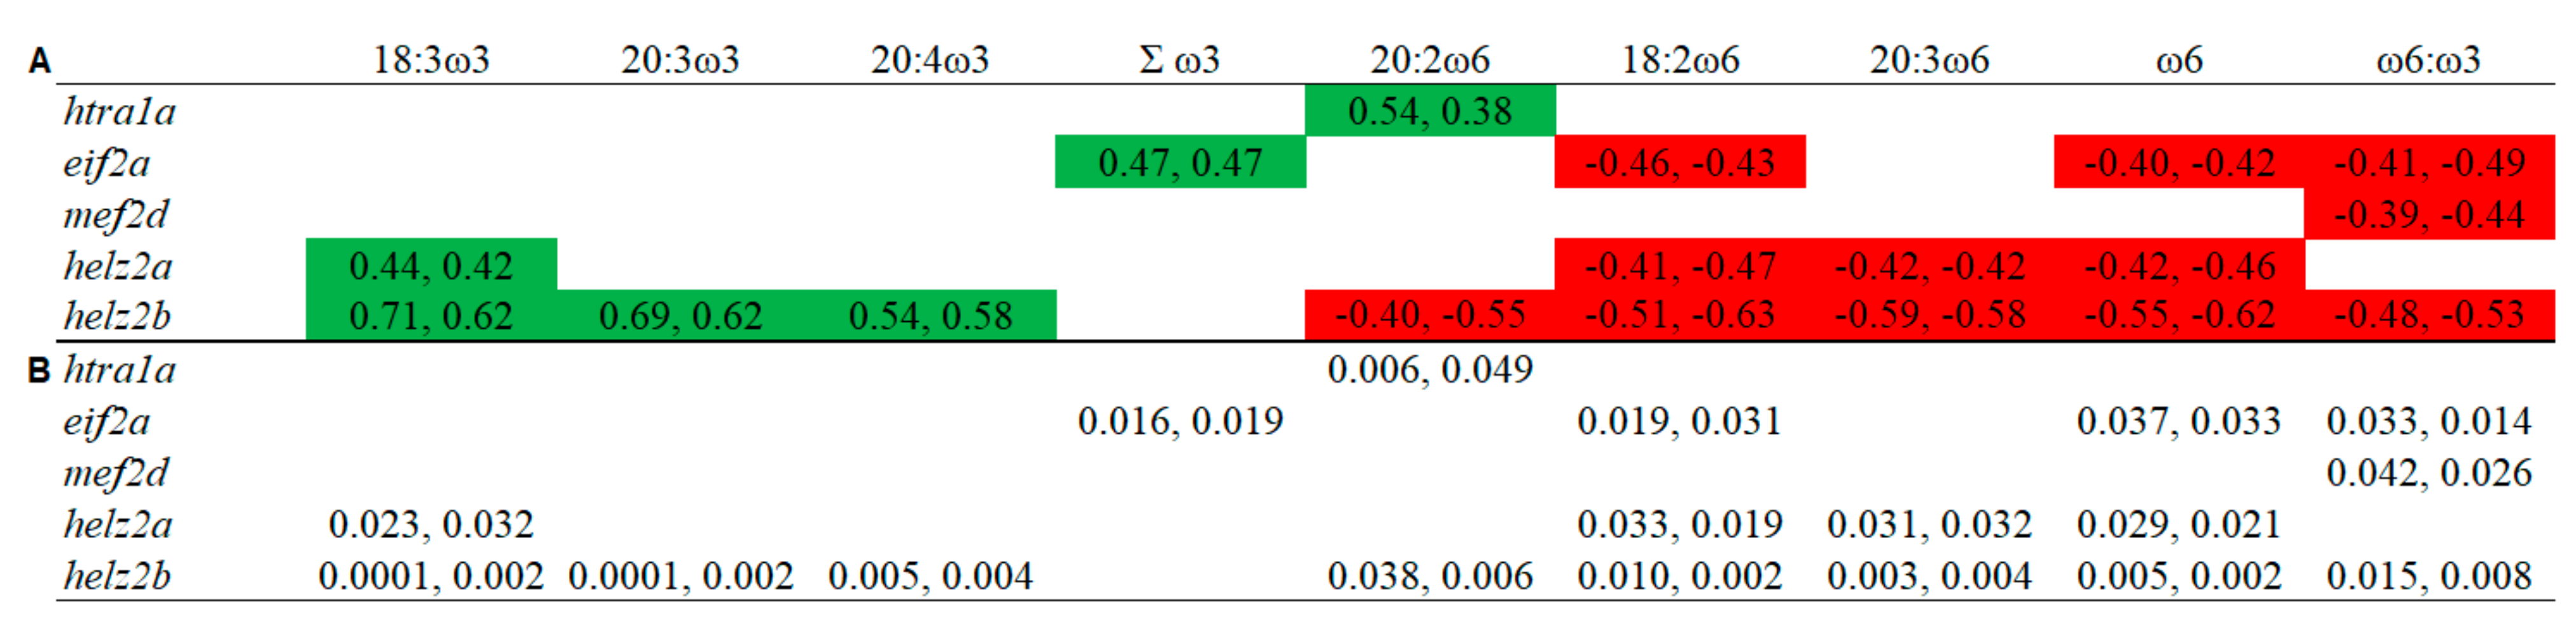
3.5. Overlapping Lipid–Gene Correlations between the Liver and Muscle Analyses

Some significant correlations showed an overlap between the liver and muscle analyses (Figure 3). The hepatic transcript expression of htra1a was correlated positively with 20:2ω6 in both tissues. The expression of eif2a was correlated positively with Σω3, and negatively with 18:2ω6, Σω6 and ω6:ω3, while that of mef2d showed negative correlations with ω6:ω3 in both liver and muscle. The transcript expression of helz2a was correlated positively with 18:3ω3, and negatively with 18:2ω6, 20:3ω6 and Σω6, while that of helz2b correlated positively with 18:3ω3, 20:3ω3 and 20:4ω3, and negatively with 18:2ω6, 20:2ω6, 20:3ω6, Σω6 and ω6:ω3 (Figure 3). The hepatic transcript expression of most genes (all except helz2b with 20:4ω3) showed stronger positive correlations with liver compared to muscle FA. However, negative correlations were mostly (all except eif2a with 18:2ω6, and both helz2 paralogues with 20:3ω6) more significant with muscle compared with the liver FA (Figure 3).

4. Discussion

The microarray study indicated that dietary variation in ω6:ω3 resulted only in small changes in the liver transcriptome of salmon fed plant-based diets. This can partly be explained by the fact that growth performance and somatic indices were not significantly affected by diet [26]. It was previously shown that different replacements of FO with camelina oil had no impact on Atlantic cod (Gadus morhua) growth, and resulted in only one microarray-identified gene that showed a significant difference in spleen basal expression between treatments [47]. Furthermore, our results are in line with previous microarray studies, which demonstrated that dietary replacement of fish meal (FM) and FO with terrestrial ingredients resulted in subtle gene expression changes in Atlantic salmon distal intestine [48], head kidney [49], and liver [50]. However, Atlantic salmon fed soy and linseed oils showed large alterations in hepatic gene expression compared to those fed FO [51]. Differences in the numbers of responsive transcripts between Leaver et al. [51] and the current study could be related to dietary lipid sources and studied time points.
Several transcripts that play important roles in immune and inflammatory response (lect2a, itgb5, helz2a, p43), lipid metabolism (helz2a), cell proliferation (htra1b), muscle and neuronal cell development (mef2d), and translation (eif2a, eif4b1, p43) were identified by our microarray study as diet-responsive. All transcripts, with the exception of mtco2 and rpl18, showed an agreement in the direction of expression fold-change between the microarray and the qPCR analyses (Table 3). The 60mer microarray probe representing the transcript mtco2, which was designed using a rainbow trout cDNA sequence, showed only 87% similarity (see Materials and Methods) with the Salmo salar cDNA sequence that was used in the qPCR study (and other S. salar sequences in NCBI databases). This fact, as well as other limitations (e.g., mRNA regions targeted by the qPCR primers and microarray probe may not be the same; possibility of contig misassembly) could have contributed to the disagreement between microarray and qPCR results [32].
Hepatic helz2a showed a significant differential expression between the high ω6 and high ω3 fed fish in the microarray experiment, and both paralogues of this transcript (i.e., helz2a and helz2b) were significantly down-regulated in the high ω6 compared to the high ω3 fed fish in the qPCR analysis. Interestingly, the transcript expression of helz2b was positively correlated with ω3 (i.e., 18:3ω3, 20:3ω3, 20:4ω3), and negatively with ω6 PUFA (i.e., 18:2ω6, 20:2ω6, 20:3ω6, 20:4ω6), Σω6 and ω6:ω3, in the liver tissue (Figure 1). In the muscle tissue, these PUFA (with the exception of 20:4ω6) were also correlated with hepatic helz2b expression (Figure 2). These data suggest that helz2 is a potential novel molecular biomarker of tissue variation in ω6:ω3. The protein encoded by this gene is a nuclear transcriptional co-activator for PPARα [52,53,54], which is a master regulator of numerous genes involved in lipid metabolism processes (e.g., FA oxidation, and metabolism of bile acids, triacylglycerols, and retinoids) [55]. Additionally, HELZ2 was shown to have an antiviral function in mammals [56,57], and its gene was identified as an ancestral (between mammals and fish) interferon stimulated gene (ISG) with conserved components of antiviral immunity [58]. Helz2 transcripts (referred to as VHSV-induced protein (vig1)) showed up-regulation in the head kidney of Atlantic salmon exposed to the viral mimic polyriboinosinic polyribocytidylic acid (pIC) [15]. The negative correlation between liver helz2b and HSI is not surprising, given the involvement of PPARα in hepatic FA β-oxidation, and in liver steatosis [59,60]. In addition, the observed positive correlations with ω3 PUFA are in line with the anti-inflammatory properties of PPARα [60]. In our previous study [26], it was observed that the fatty acid binding protein-encoding transcript fabp10 showed an upregulation trend (p = 0.06) in the high ω3 compared to the balanced and high ω6 fed fish. Thus, this suggests that the high ω3 diet may have influenced the transport of ω3 FA in liver cells, and played a role in the activation of PPARα. The interaction between liver fatty acid transport and PPARα activation has been shown in previous mammalian studies [61,62]. Another potential mechanism that could explain the positive correlation between helz2b expression with ω3 PUFA, is that ω3 PUFA bind to PPARα with higher affinity than ω6 PUFA [63]. However, there is still a lack of knowledge about the interaction between dietary ω3 and ω6 PUFA, and the mechanisms by which they regulate PPARα activators [64].
Mef2d was identified in the microarray as down-regulated by the high ω6 diet, with qPCR showing significantly lower expression in the high ω6 compared to the balanced diet fed fish. Furthermore, hepatic mef2d expression was correlated positively with liver 20:5ω3 and Σω3, and negatively with the ratio of ω6:ω3 in both liver and muscle tissues. The gene mef2, characterized in zebrafish (Danio rerio) [65] and common carp (Cyprinus carpio) [66], is involved in skeletal and cardiac muscle development and differentiation, as well as in neuronal cell development [67,68,69,70]. Wei et al. [71] reported a significant increase in skeletal muscle mef2c transcript expression in pigs fed with linseed-enriched (10%) as compared with a control diet (0%). Additionally, a study with Atlantic salmon revealed that feeding with a synthetic FA (i.e., tetradecylthioacetic acid (0.25%) compared to a control diet (0%) increased the cardiosomatic index, and the cardiac expression of mef2c [72]. In relation to the liver, previous studies showed that members of the MEF2 family regulate the activation of hepatic stellate cells –a type of cell involved in liver fibrosis– in mice [73] and rats [74], and ω3 PUFA inhibited the proliferation and activation of these cells in mouse liver [75]. Further, Wang et al. [74] reported that mef2d was induced during hepatic stellate cells activation.These data may support the idea that the transcript mef2 is responding to dietary FA (particularly ω3 PUFA) in vertebrates. However, as most studies examined the role of mef2 expression in skeletal [71,76] and cardiac [72,77] muscle development, the interactions between mef2d and liver physiology are less understood in fish. Future studies should investigate the influence of dietary ω6:ω3 on liver mef2d expression, and their interaction with hepatic stellate cells in fish.
Serine protease HTRA1-encoding transcript (htra1b) was up-regulated in the high ω6 compared to the high ω3 fed fish, in the microarray study. Htra1b showed a similar trend of higher expression in the high ω6 fed fish (p = 0.07) in the qPCR analysis, and a similar fold-change (i.e., high ω6/high ω3) in the microarray and qPCR studies (Table 3). Further, hepatic htra1b was positively correlated with ΣSFA, 22:6ω3 and ST, and negatively with ΣMUFA, 20:3ω3 and TAG in the liver, while, in the muscle, it showed positive and negative correlations with ω6:ω3 and 18:4ω3, respectively. The transcript htra1a was positively correlated with 20:2ω6 and ω6:ω3, and negatively with ω3 PUFA (i.e., 20:5ω3 and Σω3) in the liver, and showed positive correlation with 20:2ω6 in the muscle. Serine protease HTRA1 function was linked to cell growth and apoptosis, as well as immune and inflammatory responses (by inhibiting the TGF-beta pathway) in mammalian tissues (e.g., eye, bone and liver) [78,79,80,81]. It was previously shown that dietary FM replacement with terrestrial plant alternatives induced higher hepatic htra1 transcript expression in Atlantic salmon [82]. Conversely, replacing both dietary FM and FO by terrestrial plant alternatives down-regulated the transcription of htra1a and htra1b in Atlantic salmon liver [40]. Discrepancies between Caballero-Solares et al. [40] and the present study extend to the FA–transcript correlation analyses; while, in the present study, the transcript expression of htra1 paralogues correlated positively and negatively with tissue ω6 and ω3 FA levels, respectively, the opposite tendency was observed in Caballero-Solares et al. [40]. However, unlike the previous studies [40,82], our study tested different mixes of vegetable oils while keeping FM/FO inclusion levels equal across diets. Therefore, although the studies cannot be directly compared, such discrepancies suggest that the regulation of HTRA1-mediated processes in the liver of Atlantic salmon depends on the combination of protein and lipid sources included in the diet. Finally the negative correlation observed between htra1b and growth parameters (i.e., WG and CF) in the current study (Figure 2) is interesting, as mammalian HTRA1 was negatively linked to skeletal muscle development and bone formation [80,83,84].
The immune related microarray features lect2a and itgb5 were down-regulated in the high ω6 compared to the high ω3 fed fish, and an agreement was observed in the direction of expression fold-change between the microarray and qPCR studies. LECT2 is a multifunctional protein that plays a role in cell growth, neutrophil chemotactic activity, and innate immune response against pathogens in fish [85,86,87,88]. LECT2 also functions as a hepatokine that modulates the inflammatory response in mammals [89,90]. Earlier microarray studies reported down-regulation of hepatic lect2 in Atlantic salmon fed terrestrial as compared with marine diets [29,40]. This may indicate that pro-inflammatory plant-based diets suppress the constitutive transcript expression of hepatic lect2. The observed negative correlation between both paralogues of lect2 and VSI suggests that lect2 suppression is related to higher lipid deposition. However, the interaction between fat deposition and immune response is very complex, and requires further investigation in fish [90,91]. Additionally, we showed a positive correlation between the transcript expression of both paralogues of lect2 and liver sterol content. Interestingly, a previous study reported down-regulation of hepatic lect2 in Atlantic salmon fed a cholesterol-supplemented diet as compared with a non-supplemented plant-based diet, and this coincided with reduced plasma phytosterols (i.e., sitosterol and campesterol) [92]. Although dietary sterol levels were not significantly different in our study, liver sterol concentration did vary among treatments [26]. Clearly, more studies are required in order to elucidate the impact of dietary and tissue cholesterol and phytosterols on the constitutive transcript expression of lect2 in fish. Finally, the correlations observed in our study between itgb5 and liver FA are in line with the notion that FA can regulate the mRNA and protein levels of integrins and other adhesion proteins in leukocytes and endothelial cells [93,94]. Interestingly, European seabass (Dicentrarchus labrax) fed a plant-based diet showed a down-regulation in hepatic Integrin beta-2 compared to those fed a marine diet [95], while a reduction in the ω6:ω3 ratio of human lung cancer cells resulted in a delayed adhesion, and down-regulation of integrin-α2 [96]. Taken together, these data suggest that the transcript expression of integrins may be impacted by dietary or tissue ω6:ω3.
Similar to lect2a and itgb5, the transcripts p43, eif2a, and eif4b1 were down-regulated in the high ω6 fed fish in the microarray experiment, and they showed an agreement in the direction of dietary modulation with the qPCR study. The transcript expression of p43, eif2a, and eif4b2 was negatively correlated with 18:2ω6, and both p43 and eif2a were positively correlated with liver Σω3. Further, eif2a expression was positively correlated with 18:3ω3 and Σω3, and negatively correlated with 18:2ω6, 20:2ω6, Σω6 and ω6:ω3 in the muscle. The protein p43 is associated with a multi-tRNA synthetase complex, and regulates tRNA channeling in mammals [97]. In addition, p43 also encodes an apoptosis-induced cytokine, which regulates inflammation, wound healing, and angiogenesis [98,99,100]. Phosphorylation of the protein eIF4B was shown to stimulate translation in zebrafish [101,102] and yeast [103]. However, phosphorylation of eIF2A repressed translation in response to accumulation of misfolded proteins in the ER of several fish species [104,105,106]. Thus, changes in the expression patterns of p43, eif2a and eif4b, and the correlations observed with tissue lipid composition, suggest that some aspects of protein synthesis were influenced by dietary and tissue ω6:ω3. Previous mammalian studies demonstrated that translation is inhibited in apoptotic cells, and this was correlated with enhanced cleavage of the eukaryotic translation initiation factors eIF4B, eIF2, and others [107,108]. Thus, the fact that the high ω6 fed fish showed up-regulation of htra1b (Table 2) may suggest that apoptosis was associated with the observed modulation of translation-related transcripts (Table 2), and their correlations with tissue FA (Figure 1 and Figure 2). However, as our microarray study did not identify other well-known apoptosis biomarkers (e.g., genes encoding caspases and Bcl-2 family members), this can only be postulated. Further, the stimulatory effects of ω3 PUFA on protein synthesis [109] could be another potential mechanism explaining the positive correlations observed between p43, eif2a, and liver ω3 FA. Research examining the impact of replacing FO/FM with plant-based diets on protein synthesis in salmonids has been contradictory. Some authors showed an induction [82], while others showed a suppression [110] of these and other translation-related transcripts. Indeed, protein synthesis regulation in fish is a dynamic process, and is influenced by dietary formulations, genetic [50] and abiotic factors, protein requirement, growth, and the tissues examined [111,112].

5. Conclusions

Our 44 K microarray study demonstrated that high ω6 and high ω3 plant-based diets with varying ratios of ω6:ω3 (i.e., 2.7 and 0.4, respectively) resulted in a relatively low number of differentially expressed transcripts in salmon liver. However, the identified transcripts and/or their functional annotations suggested important roles in lipid metabolism (helz2a), cell proliferation (htra1b), immune and inflammatory response (lect2a, itgb5, helz2a, p43), control of muscle and neuronal cell development (mef2d), and translation (eif2a, eif4b1, p43). Two paralogues of helz2 were down-regulated in the high ω6 compared to the high ω3 fed fish in the qPCR study. Significant positive correlations were observed between the hepatic transcript expression of helz2b and ω3 PUFA, while negative correlations were identified with ω6 PUFA and ω6:ω3, in both the liver and muscle tissues. This indicated that the PPARα activation-related transcript helz2 is a potential novel molecular biomarker of tissue variation in ω6:ω3. Given these data and the importance of helz2 as an ancestral vertebrate interferon stimulated gene, future studies should investigate the dietary ω6:ω3 impact on Atlantic salmon anti-viral response. The transcript mef2d was suppressed in the high ω6 compared to the balanced fed fish, and was negatively correlated with ω6:ω3 in both tissues. Our microarray study revealed that the upregulation of hepatic htra1b concurred with the suppression of immune- and inflammatory-related transcripts (i.e., lect2a, p43, helz2a, helz2b, and itgb5). This supported the idea proposed by other researchers [40,82] of a link between the dietary modulation of htra1 and that of immune-related transcripts. Finally, the transcripts p43, eif2a, and eif4b1 were significantly down-regulated in the high ω6 compared to the high ω3 fed fish in the microarray, and showed an agreement in the direction of expression fold-change between the microarray and qPCR studies. These data, along with the significant correlations observed between p43, eif2a and eif4b2 expression and tissue PUFA, suggested that the molecular regulation of protein synthesis in the liver may have been impacted by dietary ω6:ω3.

Supplementary Materials

The following are available online at https://www.mdpi.com/article/10.3390/biology10070578/s1, Table S1: Formulation and nutrient composition (%) of experimental diets fed to Atlantic salmon. This diet information was published in Katan et al. [26]. However, it is included here as this information is pertinent to the current study as well, Table S2: Lipid and FA composition (%) of experimental diets fed to Atlantic salmon. This diet information was published in Katan et al. [26]. However, it is included here as this information is pertinent to the current study as well, Table S3: Paralogues of genes involved in the qPCR, and their identity (%) over the aligned nucleotide regions, Figure S1: Alignment of the nucleotide sequences of htra1a (GenBank accession number NM_001141717) and htra1b (GenBank accession number EG831192). Conserved regions are highlighted in yellow. Alignments were performed using AlignX (Vector NTI Advance 11). Forward primers are bolded and underlined, whereas reverse primers are bolded without an underline, Figure S2: Alignment of the nucleotide sequences of eif4b1 (GenBank accession number BT072661) and eif4b2 (accession number DY739566). Conserved regions are highlighted in yellow. Alignments were performed using AlignX (Vector NTI Advance 11). Forward primers are bolded and underlined, whereas reverse primers are bolded without an underline, Figure S3: Alignment of the nucleotide sequences of lect2a (GenBank accession number BT059281) and lect2b (GenBank accession number DV106130). Conserved regions are highlighted in yellow. Alignments were performed using AlignX (Vector NTI Advance 11). Forward primers are bolded and underlined, whereas reverse primers are bolded without an underline, Figure S4: Alignment of the nucleotide sequences of helz2a (GenBank accession number BT072427) and helz2b (GenBank accession number EG928625). Conserved regions are highlighted in yellow. Alignments were performed using AlignX (Vector NTI Advance 11). Forward primers are bolded and underlined, whereas reverse primers are bolded without an underline.

Author Contributions

Conceptualization, M.L.R., C.C.P. and R.G.T.; Methodology, T.K., X.X. and A.C.-S.; Software, T.K., X.X. and A.C.-S.; Validation, T.K., X.X., A.C.-S., R.G.T., C.C.P. and M.L.R.; Formal Analysis, T.K., X.X. and A.C.-S.; Investigation, T.K. and X.X.; Resources, R.G.T., C.C.P. and M.L.R.; Data Curation, T.K. and X.X.; Writing—Original Draft Preparation, T.K.; Writing—Review and Editing, T.K., X.X., A.C.-S., R.G.T., C.C.P. and M.L.R.; Visualization, T.K., X.X. and A.C.-S.; Supervision, M.L.R. and C.C.P.; Project Administration, T.K., X.X., C.C.P. and M.L.R.; Funding Acquisition, M.L.R., C.C.P. and R.G.T. All authors have read and agreed to the published version of the manuscript.

Funding

This study was conducted within the Biomarker Platform for Commercial Aquaculture Feed Development project. This research was funded by the Government of Canada through Genome Canada and Genome Atlantic (Genomic Applications Partnership Program, GAPP), grant number: 6604. This project was also funded by Innovate NL (Government of Newfoundland and Labrador Department of Tourism, Culture, Industry and Innovation), award number: 211219, as well as Atlantic Canada Opportunities Agency (ACOA), grant number: 206200, to M.L.R. and C.C.P. M.L.R. was also supported by Natural Sciences and Engineering Research Council of Canada (NSERC) Discovery Grants, grant numbers: 341304-2012 and 2020-04519. T.K. was supported by a Postgraduate Scholarship-Doctoral (PGS D) from NSERC, Ocean Industries Student Research Award (OISRA) from Innovate NL, and a SGS fellowship from Memorial University Newfoundland.

Institutional Review Board Statement

Ethical treatment of fish in this experiment was carried out in accordance with the guidelines of the Canadian Council on Animal Care, and approved by the Institutional Animal Care Committee of Memorial University of Newfoundland (protocol # 16-74-MR; date of approval: 5 April 2016).

Informed Consent Statement

Not applicable.

Data Availability Statement

The data presented in this study are available within the article. The microarray data were submitted to NCBI’s Gene Expression Omnibus (GEO) repository (GSE139418, https://www.ncbi.nlm.nih.gov/geo/query/acc.cgi?acc=GSE139418. If required, any additional data are available on request from the authors.

Acknowledgments

The authors would like to acknowledge Cara Kirkpatrick for managing the project, Dominic Nanton for feed formulations, Umasuthan Navaneethaiyer for assistance with microarray analysis, and Jeanette Wells for her help with the analytical work. We would also like to thank the sampling teams in the Matthew L. Rise and Christopher C. Parrish laboratories. Finally, we would like to thank Danny Boyce, and the Dr. Joe Brown Aquatic Research Building (JBARB) staff, for their assistance with fish husbandry and sampling.

Conflicts of Interest

The authors declare no conflict of interest. R.G.T. was employed by Cargill Innovation at the time this research was conducted. R.G.T., in the representation of Cargill Innovation, participated in the formulation of the experimental diets, the design of the trial, and reviewed the manuscript. However, he had no role in the design of the gene expression experiments and correlation analyses, in the collection, analyses, or interpretation of data; in the writing of the manuscript, or in the decision to publish the results.

References

  1. Wilberg, M.J.; Miller, T.J. Comment on “Impacts of biodiversity loss on ocean ecosystem services”. Science 2007, 316, 787–790. [Google Scholar] [CrossRef] [PubMed] [Green Version]
  2. Naylor, R.L.; Hardy, R.W.; Bureau, D.P.; Chiu, A.; Elliott, M.; Farrell, A.P.; Forster, I.; Gatlin, D.M.; Goldburg, R.J.; Hua, K.; et al. Feeding aquaculture in an era of finite resources. Proc. Natl. Acad. Sci. USA 2009, 106, 15103–15110. [Google Scholar] [CrossRef] [PubMed] [Green Version]
  3. Turchini, G.M.; Francis, D.S. Fatty acid metabolism (desaturation, elongation and β-oxidation) in rainbow trout fed fish oil- or linseed oil-based diets. Br. J. Nutr. 2009, 102, 69–81. [Google Scholar] [CrossRef] [PubMed] [Green Version]
  4. Bransden, M.P.; Carter, C.G.; Nichols, P.D. Replacement of fish oil with sunflower oil in feeds for Atlantic salmon (Salmo salar L.): Effect on growth performance, tissue fatty acid composition and disease resistance. Comp. Biochem. Physiol. B Biochem. Mol. Biol. 2003, 135, 611–625. [Google Scholar] [CrossRef]
  5. Tocher, D.R. Fatty acid requirements in ontogeny of marine and freshwater fish. Aquac. Res. 2010, 41, 717–732. [Google Scholar] [CrossRef]
  6. Liland, N.S.; Rosenlund, G.; Berntssen, M.H.G.; Brattelid, T.; Madsen, L.; Torstensen, B.E. Net production of Atlantic salmon (FIFO, Fish in Fish out <1) with dietary plant proteins and vegetable oils. Aquac. Nutr. 2013, 19, 289–300. [Google Scholar] [CrossRef] [Green Version]
  7. Tocher, D.R. Omega-3 long-chain polyunsaturated fatty acids and aquaculture in perspective. Aquaculture 2015, 449, 94–107. [Google Scholar] [CrossRef]
  8. Alhazzaa, R.; Bridle, A.R.; Nichols, P.D.; Carter, C.G. Replacing dietary fish oil with Echium oil enriched barramundi with C18 PUFA rather than long-chain PUFA. Aquaculture 2011, 312, 162–171. [Google Scholar] [CrossRef]
  9. Calder, P.C. Functional roles of fatty acids and their effects on human health. J. Parenter. Enter. Nutr. 2015, 39, 18S–32S. [Google Scholar] [CrossRef]
  10. Sprague, M.; Dick, J.R.; Tocher, D.R. Impact of sustainable feeds on omega-3 long-chain fatty acid levels in farmed Atlantic salmon, 2006–2015. Sci. Rep. 2016, 6, 21892. [Google Scholar] [CrossRef] [Green Version]
  11. Montero, D.; Kalinowski, T.; Obach, A.; Robaina, L.; Tort, L.; Caballero, M.J.; Izquierdo, M.S. Vegetable lipid sources for gilthead seabream (Sparus aurata): Effects on fish health. Aquaculture 2003, 225, 353–370. [Google Scholar] [CrossRef]
  12. Ruyter, B.; Moya-Falcón, C.; Rosenlund, G.; Vegusdal, A. Fat content and morphology of liver and intestine of Atlantic salmon (Salmo salar): Effects of temperature and dietary soybean oil. Aquaculture 2006, 252, 441–452. [Google Scholar] [CrossRef]
  13. Jordal, A.E.O.; Lie, Ø.; Torstensen, B.E. Complete replacement of dietary fish oil with a vegetable oil blend affect liver lipid and plasma lipoprotein levels in Atlantic salmon (Salmo salar L.). Aquac. Nutr. 2007, 13, 114–130. [Google Scholar] [CrossRef]
  14. Liland, N.S. Atlantic Salmon (Salmo salar L.) Sterol Metabolism and Metabolic Health Impact of Dietary Lipids. Ph.D. Thesis, Department of Biology, University of Bergen, National Institute of Nutrition and Seafood Research, Bergen, Norway, December 2014. [Google Scholar]
  15. Caballero-Solares, A.; Hall, J.R.; Xue, X.; Eslamloo, K.; Taylor, R.G.; Parrish, C.C.; Rise, M.L. The dietary replacement of marine ingredients by terrestrial animal and plant alternatives modulates the antiviral immune response of Atlantic salmon (Salmo salar). Fish Shellfish Immunol. 2017, 64, 24–38. [Google Scholar] [CrossRef]
  16. Pickova, J.; Mørkøre, T. Alternate oils in fish feeds. Eur. J. Lipid Sci. Technol. 2007, 109, 256–263. [Google Scholar] [CrossRef]
  17. Weaver, K.L.; Ivester, P.; Chilton, J.A.; Wilson, M.D.; Pandey, P.; Chilton, F.H. The content of favorable and unfavorable polyunsaturated fatty acids found in commonly eaten fish. J. Am. Diet. Assoc. 2008, 108, 1178–1185. [Google Scholar] [CrossRef]
  18. Young, K. Omega-6 (n-6) and omega-3 (n-3) fatty acids in tilapia and human health: A review. Int. J. Food Sci. Nutr. 2009, 60 (Suppl. 5), 203–211. [Google Scholar] [CrossRef]
  19. Simopoulos, A.P. Importance of the ratio of omega-6/omega-3 essential fatty acids: Evolutionary aspects. World Rev. Nutr. Diet. 2003, 92, 1–22. [Google Scholar] [CrossRef]
  20. Wijendran, V.; Hayes, K.C. Dietary n-6 and n-3 fatty acid balance and cardiovascular health. Annu. Rev. Nutr. 2004, 24, 597–615. [Google Scholar] [CrossRef]
  21. Simopoulos, A.P. The importance of the omega-6/omega-3 fatty acid ratio in cardiovascular disease and other chronic diseases. Exp. Biol. Med. 2008, 233, 674–688. [Google Scholar] [CrossRef]
  22. Gómez Candela, C.; Bermejo López, L.M.; Loria Kohen, V. Importance of a balanced omega 6/omega 3 ratio for the maintenance of health: Nutritional recommendations. Nutr. Hosp. 2011, 26, 323–329. [Google Scholar] [CrossRef]
  23. De Pablo Martinez, M.A.; Álvarez De Cienfuegos, G. Modulatory effects of dietary lipids on immune system functions. Immunol. Cell Biol. 2000, 78, 31–39. [Google Scholar] [CrossRef]
  24. Wymann, M.P.; Schneiter, R. Lipid signalling in disease. Nat. Rev. Mol. Cell Biol. 2008, 9, 162–176. [Google Scholar] [CrossRef]
  25. Duan, Y.; Li, F.; Li, L.; Fan, J.; Sun, X.; Yin, Y. n-6:n-3 PUFA ratio is involved in regulating lipid metabolism and inflammation in pigs. Br. J. Nutr. 2014, 111, 445–451. [Google Scholar] [CrossRef] [Green Version]
  26. Katan, T.; Caballero-Solares, A.; Taylor, R.G.; Rise, M.L.; Parrish, C.C. Effect of plant-based diets with varying ratios of ω6 to ω3 fatty acids on growth performance, tissue composition, fatty acid biosynthesis and lipid-related gene expression in Atlantic salmon (Salmo salar). Comp. Biochem. Physiol. Part D Genom. Proteom. 2019, 30, 290–304. [Google Scholar] [CrossRef]
  27. Jantzen, S.G.; Sanderson, D.S.; Von Schalburg, K.R.; Yasuike, M.; Marass, F.; Koop, B.F. A 44K microarray dataset of the changing transcriptome in developing Atlantic salmon (Salmo salar L.). BMC Res. Notes 2011, 4, 88. [Google Scholar] [CrossRef] [Green Version]
  28. Sahlmann, C.; Sutherland, B.J.G.; Kortner, T.M.; Koop, B.F.; Krogdahl, Å.; Bakke, A.M. Early response of gene expression in the distal intestine of Atlantic salmon (Salmo salar L.) during the development of soybean meal induced enteritis. Fish Shellfish Immunol. 2013, 34, 599–609. [Google Scholar] [CrossRef]
  29. Xue, X.; Hixson, S.M.; Hori, T.S.; Booman, M.; Parrish, C.C.; Anderson, D.M.; Rise, M.L. Atlantic salmon (Salmo salar) liver transcriptome response to diets containing Camelina sativa products. Comp. Biochem. Physiol. Part D Genom. Proteom. 2015, 14, 1–15. [Google Scholar] [CrossRef]
  30. National Research Council. Nutrient Requirements of Fish and Shrimp; National Academies Press: Washington, DC, USA, 2011. [Google Scholar] [CrossRef]
  31. Xu, Q.; Feng, C.Y.; Hori, T.S.; Plouffe, D.A.; Buchanan, J.T.; Rise, M.L. Family-specific differences in growth rate and hepatic gene expression in juvenile triploid growth hormone (GH) transgenic Atlantic salmon (Salmo salar). Comp. Biochem. Physiol. Part D Genom. Proteom. 2013, 8, 317–333. [Google Scholar] [CrossRef]
  32. Booman, M.; Borza, T.; Feng, C.Y.; Hori, T.S.; Higgins, B.; Culf, A.; Léger, D.; Chute, I.C.; Belkaid, A.; Rise, M.L.; et al. Development and experimental validation of a 20K Atlantic cod (Gadus morhua) oligonucleotide microarray based on a collection of over 150,000 ESTs. Mar. Biotechnol. 2011, 13, 733–750. [Google Scholar] [CrossRef] [Green Version]
  33. Celton, M.; Malpertuy, A.; Lelandais, G.; de Brevern, A.G. Comparative analysis of missing value imputation methods to improve clustering and interpretation of microarray experiments. BMC Genom. 2010, 11, 15. [Google Scholar] [CrossRef] [PubMed] [Green Version]
  34. Bø, T.H.; Dysvik, B.; Jonassen, I. LSimpute: Accurate estimation of missing values in microarray data with least squares methods. Nucleic Acids Res. 2004, 32, e34. [Google Scholar] [CrossRef] [PubMed] [Green Version]
  35. Tusher, V.G.; Tibshirani, R.; Chu, G. Significance analysis of microarrays applied to the ionizing radiation response. Proc. Natl. Acad. Sci. USA 2001, 98, 5116–5121. [Google Scholar] [CrossRef] [PubMed] [Green Version]
  36. Schwender, H.; Krause, A.; Ickstadt, K. Identifying interesting genes with siggenes. RNews 2006, 6, 45–50. [Google Scholar]
  37. Breitling, R.; Armengaud, P.; Amtmann, A.; Herzyk, P. Rank products: A simple, yet powerful, new method to detect differentially regulated genes in replicated microarray experiments. FEBS Lett. 2004, 573, 83–92. [Google Scholar] [CrossRef]
  38. Jeffery, I.B.; Higgins, D.G.; Culhane, A.C. Comparison and evaluation of methods for generating differentially expressed gene lists from microarray data. BMC Bioinform. 2006, 7, 359. [Google Scholar] [CrossRef]
  39. Hong, F.; Breitling, R.; McEntee, C.W.; Wittner, B.S.; Nemhauser, J.L.; Chory, J. RankProd: A bioconductor package for detecting differentially expressed genes in meta-analysis. Bioinformatics 2006, 22, 2825–2827. [Google Scholar] [CrossRef] [Green Version]
  40. Caballero-Solares, A.; Xue, X.; Parrish, C.C.; Foroutani, M.B.; Taylor, R.G.; Rise, M.L. Changes in the liver transcriptome of farmed Atlantic salmon (Salmo salar) fed experimental diets based on terrestrial alternatives to fish meal and fish oil. BMC Genom. 2018, 19, 796. [Google Scholar] [CrossRef] [Green Version]
  41. Rise, M.L.; Hall, J.R.; Rise, M.; Hori, T.S.; Browne, M.J.; Gamperl, A.K.; Hubert, S.; Kimball, J.; Bowman, S.; Johnson, S.C. Impact of asymptomatic nodavirus carrier state and intraperitoneal viral mimic injection on brain transcript expression in Atlantic cod (Gadus morhua). Physiol. Genom. 2010, 42, 266–280. [Google Scholar] [CrossRef]
  42. Pfaffl, M.W. A new mathematical model for relative quantification in real-time RT-PCR. Nucleic Acids Res. 2001, 29, e45. [Google Scholar] [CrossRef]
  43. Olsvik, P.A.; Lie, K.K.; Jordal, A.E.O.; Nilsen, T.O.; Hordvik, I. Evaluation of potential reference genes in real-time RT-PCR studies of Atlantic salmon. BMC Mol. Biol. 2005, 6, 21. [Google Scholar] [CrossRef] [Green Version]
  44. Vandesompele, J.; De Preter, K.; Pattyn, F.; Poppe, B.; Van Roy, N.; De Paepe, A.; Speleman, F. Accurate normalization of real-time quantitative RT-PCR data by geometric averaging of multiple internal control genes. Genome Biol. 2002, 3, 34. [Google Scholar] [CrossRef] [Green Version]
  45. Livak, K.J.; Schmittgen, T.D. Analysis of relative gene expression data using real-time quantitative PCR and the 2-ΔΔCT method. Methods 2001, 25, 402–408. [Google Scholar] [CrossRef]
  46. Rise, M.L.; Hall, J.R.; Nash, G.W.; Xue, X.; Booman, M.; Katan, T.; Gamperl, A.K. Transcriptome profiling reveals that feeding wild zooplankton to larval Atlantic cod (Gadus morhua) influences suites of genes involved in oxidation-reduction, mitosis, and selenium homeostasis. BMC Genom. 2015, 16, 1016. [Google Scholar] [CrossRef] [Green Version]
  47. Booman, M.; Xu, Q.; Rise, M.L. Evaluation of the impact of camelina oil-containing diets on the expression of genes involved in the innate anti-viral immune response in Atlantic cod (Gadus morhua). Fish Shellfish Immunol. 2014, 41, 52–63. [Google Scholar] [CrossRef]
  48. Brown, T.D.; Hori, T.S.; Xue, X.; Ye, C.L.; Anderson, D.M.; Rise, M.L. Functional genomic analysis of the impact of Camelina (Camelina sativa) meal on Atlantic salmon (Salmo salar) distal intestine gene expression and physiology. Mar. Biotechnol. 2016, 18, 418–435. [Google Scholar] [CrossRef] [Green Version]
  49. Eslamloo, K.; Xue, X.; Hall, J.R.; Smith, N.C.; Caballero-Solares, A.; Parrish, C.C.; Taylor, R.G.; Rise, M.L. Transcriptome profiling of antiviral immune and dietary fatty acid dependent responses of Atlantic salmon macrophage-like cells. BMC Genom. 2017, 18, 706. [Google Scholar] [CrossRef]
  50. Morais, S.; Pratoomyot, J.; Taggart, J.B.; Bron, J.E.; Guy, D.R.; Bell, J.G.; Tocher, D.R. Genotype-specific responses in Atlantic salmon (Salmo salar) subject to dietary fish oil replacement by vegetable oil: A liver transcriptomic analysis. BMC Genom. 2011, 12, 255. [Google Scholar] [CrossRef] [Green Version]
  51. Leaver, M.J.; Villeneuve, L.A.N.; Obach, A.; Jensen, L.; Bron, J.E.; Tocher, D.R.; Taggart, J.B. Functional genomics reveals increases in cholesterol biosynthetic genes and highly unsaturated fatty acid biosynthesis after dietary substitution of fish oil with vegetable oils in Atlantic salmon (Salmo salar). BMC Genom. 2008, 9, 1–15. [Google Scholar] [CrossRef] [Green Version]
  52. Surapureddi, S.; Yu, S.; Bu, H.; Hashimoto, T.; Yeldandi, A.V.; Kashireddy, P.; Cherkaoui-Malki, M.; Qi, C.; Zhu, Y.J.; Rao, M.S.; et al. Identification of a transcriptionally active peroxisome proliferator-activated receptor α-interacting cofactor complex in rat liver and characterization of PRIC285 as a coactivator. Proc. Natl. Acad. Sci. USA 2002, 99, 11836–11841. [Google Scholar] [CrossRef] [Green Version]
  53. Katano-Toki, A.; Satoh, T.; Tomaru, T.; Yoshino, S.; Ishizuka, T.; Ishii, S.; Ozawa, A.; Shibusawa, N.; Tsuchiya, T.; Saito, T.; et al. THRAP3 interacts with HELZ2 and plays a novel role in adipocyte differentiation. Mol. Endocrinol. 2013, 27, 769–780. [Google Scholar] [CrossRef] [Green Version]
  54. Yoshino, S.; Satoh, T.; Yamada, M.; Hashimoto, K.; Tomaru, T.; Katano-Toki, A.; Kakizaki, S.; Okada, S.; Shimizu, H.; Ozawa, A.; et al. Protection against high-fat diet-induced obesity in Helz2-deficient male mice due to enhanced expression of hepatic leptin receptor. Endocrinology 2014, 155, 3459–3472. [Google Scholar] [CrossRef] [Green Version]
  55. Kersten, S. Integrated physiology and systems biology of PPARα. Mol. Metab. 2014, 3, 354–371. [Google Scholar] [CrossRef]
  56. Fusco, D.N.; Pratt, H.; Kandilas, S.; Cheon, S.S.Y.; Lin, W.; Cronkite, D.A.; Basavappa, M.; Jeffrey, K.L.; Anselmo, A.; Sadreyev, R.; et al. HELZ2 is an IFN effector mediating suppression of dengue virus. Front. Microbiol. 2017, 8, 240. [Google Scholar] [CrossRef]
  57. Fu, M.; Blackshear, P.J. RNA-binding proteins in immune regulation: A focus on CCCH zinc finger proteins. Nat. Rev. Immunol. 2017, 17, 130–143. [Google Scholar] [CrossRef] [Green Version]
  58. Levraud, J.; Jouneau, L.; Briolat, V.; Laghi, V.; Boudinot, P. IFN-stimulated genes in zebrafish and humans define an ancient arsenal of antiviral immunity. J. Immunol. 2019, 203, 3361–3373. [Google Scholar] [CrossRef]
  59. Kersten, S.; Desvergne, B.; Wahli, W. Roles of PPARS in health and disease. Nature 2000, 405, 421–424. [Google Scholar] [CrossRef]
  60. Van Raalte, D.H.; Li, M.; Pritchard, P.H.; Wasan, K.M. Peroxisome proliferator-activated receptor (PPAR)-α: A pharmacological target with a promising future. Pharm. Res. 2004, 21, 1531–1538. [Google Scholar] [CrossRef]
  61. Huang, H.; Starodub, O.; McIntosh, A.; Kier, A.B.; Schroeder, F. Liver fatty acid-binding protein targets fatty acids to the nucleus. Real time confocal and multiphoton fluorescence imaging in living cells. J. Biol. Chem. 2002, 277, 29139–29151. [Google Scholar] [CrossRef] [Green Version]
  62. Hostetler, H.A.; McIntosh, A.L.; Atshaves, B.P.; Storey, S.M.; Payne, H.R.; Kier, A.B.; Schroeder, F. L-FABP directly interacts with PPARα in cultured primary hepatocytes. J. Lipid Res. 2009, 50, 1663–1675. [Google Scholar] [CrossRef] [Green Version]
  63. Desvergne, B.; Wahli, W. Peroxisome proliferator-activated receptors: Nuclear control of metabolism. Endocr. Rev. 1999, 20, 649–688. [Google Scholar] [CrossRef] [PubMed]
  64. Schroeder, F.; Petrescu, A.D.; Huang, H.; Atshaves, B.P.; McIntosh, A.L.; Martin, G.G.; Hostetler, H.A.; Vespa, A.; Landrock, D.; Landrock, K.K.; et al. Role of fatty acid binding proteins and long chain fatty acids in modulating nuclear receptors and gene transcription. Lipids 2008, 43, 1–17. [Google Scholar] [CrossRef] [PubMed]
  65. Ticho, B.S.; Stainier, D.Y.R.; Fishman, M.C.; Breitbart, R.E. Three zebrafish MEF2 genes delineate somitic and cardiac muscle development in wild-type and mutant embryos. Mech. Dev. 1996, 59, 205–218. [Google Scholar] [CrossRef]
  66. He, M.; Zhou, D.; Ding, N.Z.; Teng, C.B.; Yan, X.C.; Liang, Y. Common carp MEF2 genes: Evolution and expression. Genes 2019, 10, 588. [Google Scholar] [CrossRef] [Green Version]
  67. Black, B.L.; Olson, E.N. Transcriptional control of muscle development by myocyte enhancer factor-2 (MEF2) proteins. Annu. Rev. Cell Dev. Biol. 1998, 14, 167–196. [Google Scholar] [CrossRef]
  68. Flavell, S.W.; Cowan, C.W.; Kim, T.K.; Greer, P.L.; Lin, Y.; Paradis, S.; Griffith, E.C.; Hu, L.S.; Chen, C.; Greenberg, M.E. Activity-dependent regulation of MEF2 transcription factors suppresses excitatory synapse number. Science 2006, 311, 1008–1012. [Google Scholar] [CrossRef] [Green Version]
  69. Haberland, M.; Arnold, M.A.; McAnally, J.; Phan, D.; Kim, Y.; Olson, E.N. Regulation of HDAC9 gene expression by MEF2 establishes a negative-feedback loop in the transcriptional circuitry of muscle differentiation. Mol. Cell. Biol. 2007, 27, 518–525. [Google Scholar] [CrossRef] [Green Version]
  70. Flavell, S.W.; Kim, T.K.; Gray, J.M.; Harmin, D.A.; Hemberg, M.; Hong, E.J.; Markenscoff-Papadimitriou, E.; Bear, D.M.; Greenberg, M.E. Genome-wide analysis of MEF2 transcriptional program reveals synaptic target genes and neuronal activity-dependent polyadenylation site selection. Neuron 2008, 60, 1022–1038. [Google Scholar] [CrossRef] [Green Version]
  71. Wei, H.; Zhou, Y.; Jiang, S.; Huang, F.; Peng, J.; Jiang, S. Transcriptional response of porcine skeletal muscle to feeding a linseed-enriched diet to growing pigs. J. Anim. Sci. Biotechnol. 2016, 7, 6. [Google Scholar] [CrossRef] [Green Version]
  72. Grammes, F.; Rørvik, K.A.; Takle, H. Tetradecylthioacetic acid modulates cardiac transcription in Atlantic salmon, Salmo salar L., suffering heart and skeletal muscle inflammation. J. Fish Dis. 2012, 35, 109–117. [Google Scholar] [CrossRef]
  73. Xiaomeng, M.; Zhang, L.; Lixin, D. Research progress on MEF2B gene in human and animals. Agric. Sci. Technol. 2016, 17, 2477–2482. [Google Scholar]
  74. Wang, X.; Tang, X.; Gong, X.; Albanis, E.; Friedman, S.L.; Mao, Z. Regulation of hepatic stellate cell activation and growth by transcription factor myocyte enhancer factor 2. Gastroenterology 2004, 127, 1174–1188. [Google Scholar] [CrossRef]
  75. Zhang, K.; Chang, Y.; Shi, Z.; Han, X.; Han, Y.; Yao, Q. ω-3 PUFAs ameliorate liver fibrosis and inhibit hepatic stellate cells proliferation and activation by promoting YAP/TAZ degradation. Sci. Rep. 2016, 6, 1–14. [Google Scholar] [CrossRef] [Green Version]
  76. Fuentes, E.N.; Valdés, J.A.; Molina, A.; Björnsson, B.T. Regulation of skeletal muscle growth in fish by the growth hormone—Insulin-like growth factor system. Gen. Comp. Endocrinol. 2013, 192, 136–148. [Google Scholar] [CrossRef]
  77. Lien, C.L.; Schebesta, M.; Makino, S.; Weber, G.J.; Keating, M.T. Gene expression analysis of zebrafish heart regeneration. PLoS Biol. 2006, 4, 1386–1396. [Google Scholar] [CrossRef]
  78. Clausen, T.; Southan, C.; Ehrmann, M. The HtrA family of proteases: Implications for protein composition and cell fate. Mol. Cell 2002, 10, 443–455. [Google Scholar] [CrossRef]
  79. Oka, C.; Tsujimoto, R.; Kajikawa, M.; Koshiba-Takeuchi, K.; Ina, J.; Yano, M.; Tsuchiya, A.; Ueta, Y.; Soma, A.; Kanda, H.; et al. HtrA1 serine protease inhibits signaling mediated by Tgfβ family proteins. Development 2004, 131, 1041–1053. [Google Scholar] [CrossRef] [Green Version]
  80. Graham, J.R.; Chamberland, A.; Lin, Q.; Li, X.J.; Dai, D.; Zeng, W.; Ryan, M.S.; Rivera-Bermúdez, M.A.; Flannery, C.R.; Yang, Z. Serine protease HTRA1 antagonizes transforming growth factor-β signaling by cleaving its receptors and loss of HTRA1 in vivo enhances bone formation. PLoS ONE 2013, 8, e74094. [Google Scholar] [CrossRef] [Green Version]
  81. Zhu, F.; Jin, L.; Luo, T.P.; Luo, G.H.; Tan, Y.; Qin, X.H. Serine protease HtrA1 expression in human hepatocellular carcinoma. Hepatobiliary Pancreat. Dis. Int. 2010, 9, 508–512. [Google Scholar]
  82. Tacchi, L.; Secombes, C.J.; Bickerdike, R.; Adler, M.A.; Venegas, C.; Takle, H.; Martin, S.A.M. Transcriptomic and physiological responses to fishmeal substitution with plant proteins in formulated feed in farmed Atlantic salmon (Salmo salar). BMC Genom. 2012, 13, 363. [Google Scholar] [CrossRef] [Green Version]
  83. Bakay, M.; Zhao, P.; Chen, J.; Hoffman, E.P. A web-accessible complete transcriptome of normal human and DMD muscle. Neuromuscul. Disord. 2002, 12, S125–S141. [Google Scholar] [CrossRef]
  84. Tiaden, A.N.; Richards, P.J. The emerging roles of HTRA1 in musculoskeletal disease. Am. J. Pathol. 2013, 182, 1482–1488. [Google Scholar] [CrossRef] [PubMed] [Green Version]
  85. Kokkinos, P.A.; Kazantzi, A.; Sfyroera, G.; Zarkadis, I.K. Molecular cloning of leukocyte cell-derived chemotaxin 2 in rainbow trout. Fish Shellfish Immunol. 2005, 18, 371–380. [Google Scholar] [CrossRef] [PubMed]
  86. Wei, J.; Guo, M.; Cui, H.; Yan, Y.; Ouyang, Z.; Qin, Q. A new leukocyte cell-derived chemotaxin-2 from marine fish grouper, Epinephelus coioides: Molecular cloning and expression analysis. Fish Shellfish Immunol. 2011, 31, 600–605. [Google Scholar] [CrossRef]
  87. Chen, J.; Chen, Q.; Lu, X.J.; Li, C.H. LECT2 improves the outcomes in ayu with Vibrio anguillarum infection via monocytes/macrophages. Fish Shellfish Immunol. 2014, 41, 586–592. [Google Scholar] [CrossRef]
  88. Fu, G.H.; Bai, Z.Y.; Xia, J.H.; Liu, X.J.; Liu, F.; Wan, Z.Y.; Yue, G.H. Characterization of the LECT2 gene and its associations with resistance to the big belly disease in Asian seabass. Fish Shellfish Immunol. 2014, 37, 131–138. [Google Scholar] [CrossRef]
  89. Lan, F.; Misu, H.; Chikamoto, K.; Takayama, H.; Kikuchi, A.; Mohri, K.; Takata, N.; Hayashi, H.; Matsuzawa-Nagata, N.; Takeshita, Y.; et al. LECT2 functions as a hepatokine that links obesity to skeletal muscle insulin resistance. Diabetes 2014, 63, 1649–1664. [Google Scholar] [CrossRef] [Green Version]
  90. Jung, T.W.; Chung, Y.H.; Kim, H.; Elaty, A.M.A.; Jeong, J.H. LECT2 promotes inflammation and insulin resistance in adipocytes via P38 pathways. J. Mol. Endocrinol. 2018, 61, 37–45. [Google Scholar] [CrossRef]
  91. Todorčević, M.; Škugor, S.; Krasnov, A.; Ruyter, B. Gene expression profiles in Atlantic salmon adipose-derived stromo-vascular fraction during differentiation into adipocytes. BMC Genom. 2010, 11, 39. [Google Scholar] [CrossRef] [Green Version]
  92. Kortner, T.M.; Björkhem, I.; Krasnov, A.; Timmerhaus, G.; Krogdahl, Å. Dietary cholesterol supplementation to a plant-based diet suppresses the complete pathway of cholesterol synthesis and induces bile acid production in Atlantic salmon (Salmo salar L.). Br. J. Nutr. 2014, 111, 2089–2103. [Google Scholar] [CrossRef] [Green Version]
  93. Calder, P.C. Immunoregulatory and anti-inflammatory effects of n-3 polyunsaturated fatty acids. Braz. J. Med. Biol. Res. 1998, 31, 467–490. [Google Scholar] [CrossRef] [Green Version]
  94. Pompéia, C.; Lopes, L.R.; Miyasaka, C.K.; Procópio, J.; Sannomiya, P.; Curi, R. Effect of fatty acids on leukocyte function. Braz. J. Med. Biol. Res. 2000, 33, 1255–1268. [Google Scholar] [CrossRef]
  95. Geay, F.; Ferraresso, S.; Zambonino-Infante, J.L.; Bargelloni, L.; Quentel, C.; Vandeputte, M.; Kaushik, S.; Cahu, C.L.; Mazurais, D. Effects of the total replacement of fish-based diet with plant-based diet on the hepatic transcriptome of two European sea bass (Dicentrarchus labrax) half-sibfamilies showing different growth rates with the plant-based diet. BMC Genom. 2011, 12, 522. [Google Scholar] [CrossRef] [Green Version]
  96. Xia, S.H.; Wang, J.; Kang, J.X. Decreased n-6/n-3 fatty acid ratio reduces the invasive potential of human lung cancer cells by downregulation of cell adhesion/invasion-related genes. Carcinogenesis 2005, 26, 779–784. [Google Scholar] [CrossRef] [Green Version]
  97. Ivakhno, S.S.; Kornelyuk, A.I. Cytokine-like activities of some aminoacyl-tRna synthetases and auxiliary p43 cofactor of aminoacylation reaction and their role in oncogenesis. Exp. Oncol. 2004, 26, 250–255. [Google Scholar]
  98. Ko, Y.G.; Park, H.; Kim, T.; Lee, J.W.; Park, S.G.; Seol, W.; Kim, J.E.; Lee, W.H.; Kim, S.H.; Park, J.E.; et al. A cofactor of mRNA synthetase, p43, is secreted to up-regulate proinflammatory genes. J. Biol. Chem. 2001, 276, 23028–23033. [Google Scholar] [CrossRef] [Green Version]
  99. Park, H.; Park, S.G.; Kim, J.; Ko, Y.G.; Kim, S. Signaling pathways for TNF production induced by human aminoacyl-tRNA synthetase-associating factor, p43. Cytokine 2002, 20, 148–153. [Google Scholar] [CrossRef]
  100. Sang, G.P.; Shin, H.; Young, K.S.; Lee, Y.; Choi, E.C.; Park, B.J.; Kim, S. The novel cytokine p43 stimulates dermal fibroblast proliferation and wound repair. Am. J. Pathol. 2005, 166, 387–398. [Google Scholar] [CrossRef] [Green Version]
  101. Le, X.; Pugach, E.K.; Hettmer, S.; Storer, N.Y.; Liu, J.; Wills, A.A.; DiBiase, A.; Chen, E.Y.; Ignatius, M.S.; Poss, K.D.; et al. A novel chemical screening strategy in zebrafish identifies common pathways in embryogenesis and rhabdomyosarcoma development. Development 2012, 140, 2354–2364. [Google Scholar] [CrossRef] [Green Version]
  102. Faught, E.; Vijayan, M.M. Loss of the glucocorticoid receptor in zebrafish improves muscle glucose availability and increases growth. Am. J. Physiol. Endocrinol. Metab. 2019, 316, E1093–E1104. [Google Scholar] [CrossRef]
  103. Sen, N.D.; Zhou, F.; Harris, M.S.; Ingolia, N.T.; Hinnebusch, A.G. EIF4B stimulates translation of long mRNAs with structured 5′ UTRs and low closed-loop potential but weak dependence on eIF4G. Proc. Natl. Acad. Sci. USA 2016, 113, 10464–10472. [Google Scholar] [CrossRef] [Green Version]
  104. Harding, H.P.; Zhang, Y.; Bertolotti, A.; Zeng, H.; Ron, D. Perk is essential for translational regulation and cell survival during the unfolded protein response. Mol. Cell 2000, 5, 897–904. [Google Scholar] [CrossRef]
  105. Howarth, D.L.; Lindtner, C.; Vacaru, A.M.; Sachidanandam, R.; Tsedensodnom, O.; Vasilkova, T.; Buettner, C.; Sadler, K.C. Activating transcription factor 6 is necessary and sufficient for alcoholic fatty liver disease in zebrafish. PLoS Genet. 2014, 10, e1004335. [Google Scholar] [CrossRef]
  106. Kavaliauskis, A.; Arnemo, M.; Rishovd, A.L.; Gjøen, T. Activation of unfolded protein response pathway during infectious salmon anemia virus (ISAV) infection in vitro and in vivo. Dev. Comp. Immunol. 2016, 54, 46–54. [Google Scholar] [CrossRef]
  107. Saelens, X.; Kalai, M.; Vandenabeele, P. Translation inhibition in apoptosis: Caspase-dependent PKR activation and eIF2-α phosphorylation. J. Biol. Chem. 2001, 276, 41620–41628. [Google Scholar] [CrossRef] [Green Version]
  108. Morley, S.J.; Coldwell, M.J.; Clemens, M.J. Initiation factor modifications in the preapoptotic phase. Cell Death Differ. 2005, 12, 571–584. [Google Scholar] [CrossRef] [Green Version]
  109. Smith, G.I.; Atherton, P.; Reeds, D.N.; Mohammed, B.S.; Rankin, D.; Rennie, M.J.; Mittendorfer, B. Dietary omega-3 fatty acid supplementation increases the rate of muscle protein synthesis in older adults: A randomized controlled trial. Am. J. Clin. Nutr. 2011, 93, 402–412. [Google Scholar] [CrossRef] [PubMed] [Green Version]
  110. Panserat, S.; Hortopan, G.A.; Plagnes-Juan, E.; Kolditz, C.; Lansard, M.; Skiba-Cassy, S.; Esquerré, D.; Geurden, I.; Médale, F.; Kaushik, S.; et al. Differential gene expression after total replacement of dietary fish meal and fish oil by plant products in rainbow trout (Oncorhynchus mykiss) liver. Aquaculture 2009, 294, 123–131. [Google Scholar] [CrossRef] [Green Version]
  111. Houlihan, D.F.; Carter, C.G. Protein synthesis. Fish Physiol. 2001, 20, 31–75. [Google Scholar] [CrossRef]
  112. Kaushik, S.J.; Seiliez, I. Protein and amino acid nutrition and metabolism in fish: Current knowledge and future needs. Aquac. Res. 2010, 41, 322–332. [Google Scholar] [CrossRef]
Figure 1. Pearson correlation matrix and hierarchical clustering of liver transcript expression (qPCR relative quantity values (RQ)), liver lipid composition, and somatic indices in Atlantic salmon fed diets with varying ω6 to ω3 fatty acid ratios. Correlation coefficients were described when correlations were statistically significant (p < 0.05). Red signifies negative and green signifies positive relationships. ΣSFA, ΣMUFA, and ΣPUFA represents total saturated, monounsaturated and polyunsaturated fatty acids, respectively. 20:5ω3, 22:6ω3, and 20:4ω6 represent EPA, DHA, and ARA, respectively. TAG, ST and PL represent triacylglycerols, sterols, and phospholipids, respectively. HSI and VSI represent hepatosomatic and viscerosomatic indices, respectively.
Biology 10 00578 g001
Figure 2. Pearson correlation matrix and hierarchical clustering of liver transcript expression (qPCR relative quantity values (RQ)), muscle lipid composition, and growth in Atlantic salmon fed diets with varying ω6 to ω3 fatty acid ratios. Correlation coefficients were described when correlations were statistically significant (p < 0.05). Red signifies negative and green signifies positive relationships. ΣSFA, ΣMUFA, and ΣPUFA represent total saturated, monounsaturated and polyunsaturated fatty acids, respectively. 20:5ω3, 22:6ω3, and 20:4ω6 represent EPA, DHA, and ARA, respectively. TAG, ST and PL represent triacylglycerols, sterols, and phospholipids, respectively. WG and CF represent weight gain and condition factor, respectively.
Biology 10 00578 g002
Figure 3. Overlapping Pearson correlations between the liver and muscle analyses. Liver transcript expression (qPCR relative quantity values (RQ)) of GOIs was correlated with liver and muscle lipid composition in Atlantic salmon fed diets with varying ω6 to ω3 fatty acid ratios. Statistically significant (p < 0.05) correlations are shown. Green and red cells signify positive and negative relationships, respectively. Upper panel shows correlation coefficients (A), and lower panel depicts p-values (B). Commas separated values from the liver and muscle analyses, respectively (A,B).
Biology 10 00578 g003
Table 1. qPCR primers.
Gene Name (Symbol) aNucleotide Sequence (5′-3′) bAmplification Efficiency (%)Amplicon Size (bp)GenBank Accession Number
Serine protease HTRA1 a (htra1a) cF:GCTGATGTGGTGGAGGAGAT113.3127NM001141717
R:TCAAGCCGTCCTCTGACAC---
Serine protease HTRA1 b (htra1b) cF:ATGATGACTCTCACACCAATGC95.4104EG831192
R:GTTTTTGGGATGACCTCGATT---
Aminoacyl tRNA synthase complex-interacting multifunctional protein 1 (p43)F:GGAAGACGAATGCAGAGGAC97.282.0BT044000
R:GGAGCGGTCATTCACACTTT---
Eukaryotic translation initiation factor 2A (eif2a)F:TAAACCCAGATGCCCTTGAG94.9143NM001140088
R:GGCTTTCAGCTCGTCGATAG---
Eukaryotic translation initiation factor 4B 1 (eif4b1)F:CGCAGGGACCGGGATGAT85.3123BT072661
R:TCGGTCCTC5CTGTCCGC---
Eukaryotic translation initiation factor 4B 2 (eif4b2)F:CACATCCAGGAAGTACCTCT87.494.0DY739566
R:TCGTCCTCCTTACCGCTGA---
Cytochrome c oxidase subunit 2 (mtco2) dF:CACCGATTACGAAGACTTAGGC107.9136DW554935
R:TGAAACTAGGACCCGGATTG---
Leukocyte cell-derived chemotaxin 2 precursor a (lect2a) cF:CAGATGGGGACAAGGACACT94.6150BT059281
R:GCCTTCTTCGGGTCTGTGTA---
Leukocyte cell-derived chemotaxin 2 precursor b (lect2b) cF:ACAACTGGGGACAAGGACAG84.8125DV106130
R:CACTTTGCCGTTGAGTTTCA---
60S ribosomal protein L18 (rpl18)F:AGTTCCACGACTCGAAGATC93.8143DW535031
R:TTTTATTGTGCCGCACAAGGT---
Myocyte-specific enhancer factor 2D (mef2d)F:GCAGCAACATCAACAACAGC89.5160XM014177143
R:CTCATCTCTACCCAAGAGGA---
Helicase with zinc finger domain 2 a (helz2a, alias pric285a) eF:GCAAGGTTGGGTATGAGGAA91.3149BT072427
R:TTCGGAGTTGCTCCAGTCTT---
Helicase with zinc finger domain 2 b (helz2b, alias pric285b) eF:AGACGTAGTGGTTCGGATCG82.0145EG928625
R:GACCGTGATTTCGTCCAGTT---
Integrin beta-5-like (itgb5) fF:CCTGCCAGCGGCTATGCAA94.1147DW540995/
XM014165323
R:AGGACTGACATGCCGTTGG--
Elongation factor 1 alpha-2 (eef1α-2) gF:GCACAGTAACACCGAAACGA86.4132BG933853
R:ATGCCTCCGCACTTGTAGAT---
60S ribosomal protein 32 (rpl32) gF:AGGCGGTTTAAGGGTCAGAT96.1119BT043656
R:TCGAGCTCCTTGATGTTGTG---
a Bolded gene symbols refer to microarray-identified transcripts. b F is forward and R is reverse primer. c Primers that were previously published in Caballero-Solares et al. [40]. d The Salmo salar sequence of mtco2 used in the qPCR assay showed 87% identity with the 60 mer microarray probe (C060R108) affiliated with rainbow trout (Oncorhynchus mykiss). e Primers that were previously published in Caballero-Solares et al. [15] (annotated as VHSV-induced protein in that study). Alias pric285 stands for peroxisomal proliferator-activated receptor A interacting complex 285. f The Atlantic salmon sequences of itgb5 used in the qPCR assay showed 86% identity with the 60mer microarray probe (C002R106) affiliated with rainbow trout. Primers were designed based on common regions between DW540995 and XM014165323. g Primers that were previously published in Katan et al. [26].
Table 2. Microarray-identified transcripts that were significantly differentially expressed in the liver of salmon fed high ω6 compared to high ω3 diet.
Probe ID aBLASTx Identification b Gene Ontology (GO) of Putative Human Orthologues dFold-Change e
Best Named BLASTx Hit (Species) cAccession No.E-Value% ID (AA)
C187R103Lipoma HMGIC fusion partner-like 4 protein (lhpl4) (Salmo salar)NP_0011401420272/272 (100%)BP: regulation of inhibitory synapse assembly, gamma-aminobutyric acid receptor clustering. MF: protein binding, GABA receptor binding. CC: inhibitory synapse, postsynaptic membrane, cell projection, plasma membrane, cell junction. 4.78
C231R170Serine protease HTRA1 (htra1b) (Salvelinus alpinus)XP_0238646114e−171248/256 (97%)BP: proteolysis, extracellular matrix disassembly, negative regulation of transforming growth factor beta receptor signaling pathway, negative regulation of defense response to virus, positive regulation of epithelial cell proliferation. MF: serine-type endopeptidase and peptidase activity, insulin-like growth factor binding, hydrolase activity. CC: collagen-containing extracellular matrix, extracellular space, plasma membrane, cytoplasm.3.57
C103R052Aminoacyl tRNA synthase complex-interacting multifunctional protein 1 (p43) (Salmo trutta)XP_0296222210321/326 (98%)BP: inflammatory response, apoptotic process, response to wounding, tRNA aminoacylation for protein translation, defense response to virus, leukocyte migration, angiogenesis, chemotaxis, positive regulation of glucagon secretion. MF: RNA binding, tRNA binding, protein binding, cytokine activity, protein homodimerization activity. CC: aminoacyl-tRNA synthetase multienzyme complex, nucleus, cytosol, endoplasmic reticulum, extracellular region.−2.79
C067R040Eukaryotic translation initiation factor 2A (eif2a) (Salmo salar)NP_0011335600576/576 (100%)BP: translational initiation, ribosome assembly, protein phosphorylation, SREBP signaling pathway, response to amino acid starvation. MF: translation initiation factor activity, cadherin binding, ribosome binding, tRNA binding, protein binding. CC: blood microparticle, extracellular space, cytosolic small ribosomal subunit.−3.13
C253R093Eukaryotic translation initiation factor 4B (eif4b1) (Salvelinus alpinus)XP_0238529696e−1137/40 (93%)BP: translational initiation, eukaryotic translation initiation factor 4F complex assembly. MF: RNA binding, protein binding, translation initiation factor activity, RNA strand annealing activity. CC: polysome, cytosol, eukaryotic translation initiation factor 4F complex.−3.23
C060R108Cytochrome c oxidase subunit 2 (mtco2) (Oncorhynchus masou masou)ASB295457e−74115/182 (63%)BP: electron transport chain, oxidation-reduction process. MF: cytochrome-c oxidase activity, copper ion binding, metal ion binding, oxidoreductase activity. CC: membrane, respirasome, mitochondrion.−3.27
C159R112Leukocyte cell-derived chemotaxin 2 precursor (lect2a) (Salmo salar)ACI679166e−102155/156 (99%)BP: chemotaxis, skeletal system development. MF: protein binding, metal ion binding. CC: cytoplasm, extracellular space.−3.48
C152R05760S ribosomal protein L18 (rpl18) (Salmo trutta)XP_0295997413e−122172/173 (99%)BP: translation, viral transcription, SRP-dependent cotranslational protein targeting to membrane. MF: structural constituent of ribosome, protein binding, RNA binding. CC: ribosome, cytosolic large ribosomal subunit, cytosol.−4.37
C133R018Myocyte-specific enhancer factor 2D (mef2d) (Oncorhynchus mykiss)XP_0214278163e−70193/193 (100%)BP: positive regulation of vascular smooth muscle cell proliferation, muscle organ development, skeletal muscle and neuronal cell differentiation, apoptotic process, positive regulation of transcription by RNA polymerase II, adult heart development, nervous system development. MF: DNA-binding transcription factor activity, RNA polymerase II-specific, protein binding, histone deacetylase binding, protein heterodimerization activity. CC: nucleus, nuclear chromatin, intracellular membrane-bounded organelle, nucleoplasm.−4.54
C065R088Helicase with zinc finger domain 2 (helz2a alias, pric285a) (Salmo trutta)XP_0295489420694/714 (97%)BP: regulation of lipid metabolic process, positive regulation of transcription by RNA polymerase II, nuclear-transcribed mRNA catabolic process, nonsense-mediated decay. MF: nuclear receptor transcription activity, helicase activity, ribonuclease activity, hydrolase activity, RNA binding, ATP binding, protein binding, metal ion binding. CC: nucleus, membrane, nucleoplasm.−4.71
C002R106 *Integrin beta-5-like (itgb5) (Oncorhynchus mykiss)XP_0214531130283/315 (90%)BP: cell adhesion mediated by integrin, integrin-mediated signaling pathway, muscle contraction, antigen processing and presentation of exogenous peptide antigen via MHC class I, TAP-dependent, viral process, transforming growth factor beta receptor signaling pathway. MF: protein binding, signaling receptor activity, virus receptor activity. CC: cell surface, extracellular exosome, phagocytic vesicle, plasma membrane, integrin complex.−5.12
C188R069Cytochrome c oxidase subunit 1 (mtco1) (Oncorhynchus tshawytscha) *NP_1489400410/437 (94%)BP: oxidation-reduction process, oxidative phosphorylation, electron transport chain, aerobic respiration. MF: oxidoreductase activity, cytochrome-c oxidase activity, heme binding, metal ion binding. CC: mitochondrial inner membrane, respiratory chain complex IV, respirasome.−7.11
a Refers to the identity of the probe on the 44 K array. Probes that are shown in bold font are features that were identified by SAM (FDR < 10%), and the remaining features were identified by RP analysis (PFP < 10%). The probe with an asterisk represents a feature that was identified in both SAM and RP analysis. Two 4 × 44 K array slides (slides # 11,504–11,505; representing 4 fish per treatment) were used in the RP analysis. However, the RP-identified mef2d was obtained using 3 slides (slides # 11,503–11,505; representing 6 fish per treatment). SAM-identified features were obtained using three slides (slides # 11,503–11,505). b Genes were identified by BLASTx, using the contig from which the microarray probe was designed against the NCBI non-redundant database. The best BLASTx hit with E-value < 10−5 and an informative protein name was used, and presented with species name, GenBank accession number, E-value and % amino acid (AA) identity. c All microarray-identified genes, with the exception of lhpl4 and mtco1, were quantified by qPCR (see Materials and Methods). d Gene Ontology (GO) terms were selected from putative Homo sapiens orthologues (i.e., best BLASTx hit). Representative GO terms were identified (i.e., redundancies were not included), and divided into the categories: biological process (BP), molecular function (MF) and cellular component (CC). e Fold-change values between the 2 dietary treatments (high ω6/high ω3) for each of the significant microarray features. Down-regulated transcripts are shown with negative values (−(1/fold-change)) The SAM- and RP-identified itgb5 showed fold-changes of −5.12 and −5.25, respectively.
Table 3. Hepatic qPCR analysis of microarray-identified transcripts, and comparison between the microarray and qPCR results.
Microarray Probe aTranscript NameqPCR RQ Values bp-Value (qPCR) cFold-Change d
High ω3BalancedHigh ω6MicroarrayqPCR
N/Ahtra1a2.2 ± 0.411.9 ± 0.293.0 ± 0.650.25N/A1.34
C231R170htra1b6.0 ± 2.1410.7 ± 3.5622.4 ± 7.430.073.573.75
C103R052p433.4 ± 0.662.9 ± 0.412.2 ± 0.470.24−2.79−1.59
C067R040eif2a5.2 ± 0.405.3 ± 0.743.5 ± 0.920.19−3.13−1.47
C253R093eif4b18.8 ± 1.786.7 ± 1.435.5 ± 1.530.29−3.23−1.59
N/Aeif4b22.7 ± 0.302.7 ± 0.402.2 ± 0.300.55N/A−1.22
C060R108mtco21.4 ± 0.101.2 ± 0.061.4 ± 0.140.43−3.271.07
C159R112lect2a7.6 ± 2.584.0 ± 1.204.2 ± 0.960.38−3.48−1.79
N/Alect2b3.4 ± 0.743.7 ± 0.893.8 ± 0.610.96N/A1.12
C152R057rpl182.0 ± 0.172.1 ± 0.252.2 ± 0.160.88−4.371.08
C133R018mef2d1.9 ± 0.10 a,b2.0 ± 0.11 a1.5 ± 0.13 b0.03−4.54−1.22
C065R088helz2a2.3 ± 0.32 a1.6 ± 0.15 a,b1.5 ± 0.14 b0.04−4.71−1.49
N/Ahelz2b2.3 ± 0.21 a1.4 ± 0.09 b1.4 ± 0.11 b0.002N/A−1.61
C002R106itgb52.1 ± 0.231.9 ± 0.081.6 ± 0.080.13−5.25−1.34
a Refers to the identity of the probe on the 44 K array. Transcripts with no probe ID are paralogues of microarray-identified transcripts. b Mean relative quantity (RQ) ± standard error (n = 6–8). RQ values were normalized to elongation factor 1 alpha-2 (eef1α-2) and 60S ribosomal protein 32 (rpl32), and calibrated to the lowest expressing individual for each gene of interest. Different letters indicate significant differences among treatments (General linear model followed by Tukey pairwise comparison). c p-values obtained in the qPCR study. Differences were considered statistically significant when p < 0.05. d Microarray and qPCR comparison of fold-changes (i.e., high ω6/high ω3). Down-regulated transcripts are negative values (−(1/fold-change)). qPCR fold-changes corresponding to GOI with significant differences between the high ω6 and high ω3 treatments are bolded.
Publisher’s Note: MDPI stays neutral with regard to jurisdictional claims in published maps and institutional affiliations.

