
Study of Probiotic Effects of Bifidobacterium animalis subsp. lactis BB-12 and Lactobacillus plantarum 299v Strains on Biochemical and Morphometric Parameters of Rabbits after Obesity Induction

 , ,
, , 
Abstract
:Simple Summary
Abstract
1. Introduction
2. Materials and Methods
2.1. Experiment 1
2.1.1. Animals and Breeding Conditions
2.1.2. Plasma Measurements
2.1.3. Morphometric Measurements
2.1.4. Oral Glucose Tolerance Test (OGTT)
2.2. Experiment 2
- (i)
- Group 1: Obese witnesses (TO) rabbits (n = 6) used as control and without any probiotic in their feed.
- (ii)
- (iii)
- Group 3: Obese (OB) rabbits (n = 6) receiving 1 × 10⁹ CFU/mL of Bifidobacterium animalis subsp. lactis BB-12® [35].
2.3. Statistical Analyses
3. Results and Discussion
3.1. Experiment 1
3.1.1. Fasting Blood Sugar and Oral Glucose Tolerance Test
- Fasting Blood Sugar
- OGTT
3.1.2. Lipids
3.1.3. Total Protein, Creatinine and Albumin
3.1.4. Aspartate Aminotransferase (ASAT) and Alanine Aminotransferase (ALAT)
3.1.5. Alkaline Phosphatase
3.1.6. Morphometric Parameters
3.1.7. Overall Discussion of the Impact of Cafeteria Diet
3.1.8. Overall Discussion Concerning the Induction Obesity and Metabolic Syndrome
3.2. Experiment 2
3.2.1. Fasting Blood Sugar and Oral Glucose Tolerance Test
- Fasting Blood Sugar
- OGTT
3.2.2. Lipids
3.2.3. Creatinine, ALB, PT, ASAT, ALAT and AP in Experiment 2
3.2.4. Morphometric Parameters
3.2.5. Overall Discussion about the Effect of Probiotics Supplementation on Obesity and Metabolic Syndrome
4. Conclusions
Supplementary Materials
Author Contributions
Funding
Institutional Review Board Statement
Informed Consent Statement
Data Availability Statement
Acknowledgments
Conflicts of Interest
References
- Andersen, R.E. The spread of the childhood obesity epidemic. Can. Med. Assoc. J. 2000, 163, 1461–1462. [Google Scholar]
- Lecomte, V.; Kaakoush, N.O.; Maloney, C.A.; Raipuria, M.; Huinao, K.D.; Mitchell, H.M.; Morris, M.J. Changes in Gut Microbiota in Rats Fed a High Fat Diet Correlate with Obesity-Associated Metabolic Parameters. PLoS ONE 2015, 10, e0126931. [Google Scholar] [CrossRef] [Green Version]
- Martorell, R.; Khan, L.K.; Hughes, M.L.; Grummer-Strawn, L.M. Overweight and obesity in preschool children from developing countries. Int. J. Obes. 2000, 24, 959–967. [Google Scholar] [CrossRef] [Green Version]
- Misra, A.; Gopalan, H.; Jayawardena, R.; Hills, A.P.; Soares, M.; Reza-Albarrán, A.A.; Ramaiya, K.L. Diabetes in developing countries. J. Diabetes 2019, 11, 522–539. [Google Scholar] [CrossRef]
- Hotamisligil, G.S. Inflammation and metabolic disorders. Nature 2006, 444, 860–867. [Google Scholar] [CrossRef] [PubMed]
- Shi, H.; Kokoeva, M.V.; Inouye, K.; Tzameli, I.; Yin, H.; Flier, J.S. TLR4 links innate immunity and fatty acid–induced insulin resistance. J. Clin. Investig. 2006, 116, 3015–3025. [Google Scholar] [CrossRef] [PubMed]
- Shoelson, S.E.; Lee, J.; Goldfine, A.B. Inflammation and insulin resistance. J. Clin. Investig. 2006, 116, 1793–1801. [Google Scholar] [CrossRef] [PubMed]
- Grundy, S.M. Pre-Diabetes, Metabolic Syndrome, and Cardiovascular Risk. J. Am. Coll. Cardiol. 2012, 59, 635–643. [Google Scholar] [CrossRef] [Green Version]
- DiBaise, J.K.; Zhang, H.; Crowell, M.D.; Krajmalnik-Brown, R.; Decker, G.A.; Rittmann, B.E. Gut Microbiota and Its Possible Relationship With Obesity. Mayo Clin. Proc. 2008, 83, 460–469. [Google Scholar] [CrossRef] [PubMed] [Green Version]
- Eckburg, P.B.; Bik, E.M.; Bernstein, C.N.; Purdom, E.; Dethlefsen, L.; Sargent, M.; Gill, S.R.; Nelson, K.E.; Relman, D.A. Diversity of the Human Intestinal Microbial Flora. Science 2005, 308, 1635–1638. [Google Scholar] [CrossRef] [Green Version]
- Tremaroli, V.; Bäckhed, F. Functional interactions between the gut microbiota and host metabolism. Nature 2012, 489, 242–249. [Google Scholar] [CrossRef]
- Turnbaugh, P.J.; Ley, R.E.; Mahowald, M.A.; Magrini, V.; Mardis, E.R.; Gordon, J.I. An obesity-associated gut microbiome with increased capacity for energy harvest. Nature 2006, 444, 1027–1031. [Google Scholar] [CrossRef]
- Duncan, S.H.; Louis, P.; Flint, H.J. Cultivable bacterial diversity from the human colon. Lett. Appl. Microbiol. 2007, 44, 343–350. [Google Scholar] [CrossRef]
- Duncan, S.H.; Lobley, G.E.; Holtrop, G.; Ince, J.; Johnstone, A.M.; Louis, P.; Flint, H.J. Human colonic microbiota associated with diet, obesity and weight loss. Int. J. Obes. 2008, 32, 1720–1724. [Google Scholar] [CrossRef] [PubMed] [Green Version]
- Delzenne, N.M.; Neyrinck, A.M.; Cani, P.D. Gut microbiota and metabolic disorders: How prebiotic can work? Br. J. Nutr. 2013, 109, S81–S85. [Google Scholar] [CrossRef] [PubMed] [Green Version]
- Gorbach, S.L. Probiotics and gastrointestinal health. Am. J. Gastroenterol. 2000, 95, S2–S4. [Google Scholar] [CrossRef]
- Timmerman, H.M.; Mulder, L.; Everts, H.; van Espen, D.C.; van der Wal, E.; Klaassen, G.; Rouwers, S.M.G.; Hartemink, R.; Rombouts, F.M.; Beynen, A.C. Health and Growth of Veal Calves Fed Milk Replacers With or Without Probiotics. J. Dairy Sci. 2005, 88, 2154–2165. [Google Scholar] [CrossRef] [Green Version]
- Timmerman, H.M.; Veldman, A.; van den Elsen, E.; Rombouts, F.M.; Beynen, A.C. Mortality and Growth Performance of Broilers Given Drinking Water Supplemented with Chicken-Specific Probiotics. Poult. Sci. 2006, 85, 1383–1388. [Google Scholar] [CrossRef]
- Delzenne, N.M.; Neyrinck, A.M.; Bäckhed, F.; Cani, P.D. Targeting gut microbiota in obesity: Effects of prebiotics and probiotics. Nat. Rev. Endocrinol. 2011, 7, 639–646. [Google Scholar] [CrossRef] [PubMed]
- Gerritsen, J.; Smidt, H.; Rijkers, G.T.; de Vos, W.M. Intestinal microbiota in human health and disease: The impact of probiotics. Genes Nutr. 2011, 6, 209–240. [Google Scholar] [CrossRef] [Green Version]
- Aronsson, L.; Huang, Y.; Parini, P.; Korach-André, M.; Håkansson, J.; Gustafsson, J.-Å.; Pettersson, S.; Arulampalam, V.; Rafter, J. Decreased Fat Storage by Lactobacillus Paracasei Is Associated with Increased Levels of Angiopoietin-Like 4 Protein (ANGPTL4). PLoS ONE 2010, 5, e13087. [Google Scholar] [CrossRef]
- Furet, J.-P.; Kong, L.-C.; Tap, J.; Poitou, C.; Basdevant, A.; Bouillot, J.-L.; Mariat, D.; Corthier, G.; Doré, J.; Henegar, C.; et al. Differential Adaptation of Human Gut Microbiota to Bariatric Surgery–Induced weight loss: Links with Metabolic and Low-Grade Inflammation Markers. Diabetes 2010, 59, 3049–3057. [Google Scholar] [CrossRef] [Green Version]
- Arora, T.; Anastasovska, J.; Gibson, G.; Tuohy, K.; Sharma, R.K.; Bell, J.; Frost, G. Effect of Lactobacillus acidophilus NCDC 13 supplementation on the progression of obesity in diet-induced obese mice. Br. J. Nutr. 2012, 108, 1382–1389. [Google Scholar] [CrossRef] [Green Version]
- Cani, P.D.; Bibiloni, R.; Knauf, C.; Waget, A.; Neyrinck, A.M.; Delzenne, N.M.; Burcelin, R. Changes in Gut Microbiota Control Metabolic Endotoxemia-Induced Inflammation in High-Fat Diet–Induced Obesity and Diabetes in Mice. Diabetes 2008, 57, 1470–1481. [Google Scholar] [CrossRef] [PubMed] [Green Version]
- Fan, J.; Watanabe, T. Cholesterol-fed and transgenic rabbit models for the study of atherosclerosis. J. Atheroscler. Thromb. 2000, 7, 26–32. [Google Scholar] [CrossRef] [PubMed] [Green Version]
- Waqar, A.B.; Koike, T.; Yu, Y.; Inoue, T.; Aoki, T.; Liu, E.; Fan, J. High-fat diet without excess calories induces metabolic disorders and enhances atherosclerosis in rabbits. Atherosclerosis 2010, 213, 148–155. [Google Scholar] [CrossRef]
- Lozano, W.M.; Arias-Mutis, O.J.; Calvo, C.J.; Chorro, F.J.; Zarzoso, M. Diet-Induced Rabbit Models for the Study of Metabolic Syndrome. Animals 2019, 9, 463. [Google Scholar] [CrossRef] [Green Version]
- Gacem, M.; Zerrouki, N.; Lebas, F.; Bolet, G. Strategy for developing rabbit meat production in Algeria: Creation and selection of a synthetic strain. In Proceedings of the 9th World Rabbit Congress, Verona, Italy, 10–13 June 2008; pp. 85–89. [Google Scholar]
- Darimont, C.; Turini, M.; Epitaux, M.; Zbinden, I.; Richelle, M.; Montell, E.; Ferrer-Martinez, A.; Macé, K. β3-adrenoceptor agonist prevents alterations of muscle diacylglycerol and adipose tissue phospholipids induced by a cafeteria diet. Nutr. Metab. 2004, 1, 4. [Google Scholar] [CrossRef] [Green Version]
- Arias-Mutis, O.J.; Marrachelli, V.G.; Ruiz-Saurí, A.; Alberola, A.; Morales, J.M.; Such-Miquel, L.; Monleon, D.; Chorro, F.J.; Such, L.; Zarzoso, M. Development and characterization of an experimental model of diet-induced metabolic syndrome in rabbit. PLoS ONE 2017, 12, e0178315. [Google Scholar] [CrossRef] [PubMed] [Green Version]
- Kammoun, M.; Picard, B.; Astruc, T.; Gagaoua, M.; Aubert, D.; Bonnet, M.; Blanquet, V.; Cassar-Malek, I. The Invalidation of HspB1 Gene in Mouse Alters the Ultrastructural Phenotype of Muscles. PLoS ONE 2016, 11, e0158644. [Google Scholar] [CrossRef] [PubMed]
- Zarzoso, M.; Mironov, S.; Guerrero-Serna, G.; Willis, B.C.; Pandit, S.V. Ventricular remodelling in rabbits with sustained high-fat diet. Acta Physiol. 2014, 211, 36–47. [Google Scholar] [CrossRef] [Green Version]
- Nelson, R.W.; Himsel, C.A.; Feldman, E.C.; Bottoms, G.D. Glucose tolerance and insulin response in normal-weight and obese cats. Am. J. Vet. Res. 1990, 51, 1357–1362. [Google Scholar] [PubMed]
- Park, K.Y.; Kim, B.; Hyun, C.K. Lactobacillus rhamnosus GG improves glucose tolerance through alleviating ER stress and suppressing macrophage activation in db/db mice. J. Clin. Biochem. Nutr. 2015, 56, 240–246. [Google Scholar] [CrossRef] [PubMed] [Green Version]
- Zhang, J.; Wang, S.; Zeng, Z.; Qin, Y.; Shen, Q.; Li, P. Anti-diabetic effects of Bifidobacterium animalis 01 through improving hepatic insulin sensitivity in type 2 diabetic rat model. J. Funct. Foods 2020, 67, 103843. [Google Scholar] [CrossRef]
- Bukowska, H.; Pieczul-Mróz, J.; Jastrzebska, M.; Chełstowski, K.; Naruszewicz, M. Decrease in fibrinogen and LDL-cholesterol levels upon supplementation of diet with Lactobacillus plantarum in subjects with moderately elevated cholesterol. Atherosclerosis 1998, 137, 437–438. [Google Scholar] [CrossRef] [PubMed]
- Yin, W.; Yuan, Z.; Wang, Z.; Yang, B.; Yang, Y. A diet high in saturated fat and sucrose alters glucoregulation and induces aortic fatty streaks in New Zealand White rabbits. Int. J. Exp. Diabetes Res. 2002, 3, 179–184. [Google Scholar] [CrossRef] [PubMed] [Green Version]
- Zhao, S.; Chu, Y.; Zhang, C.; Lin, Y.; Xu, K.; Yang, P.; Fan, J.; Liu, E. Diet-induced central obesity and insulin resistance in rabbits. J. Anim. Physiol. Anim. Nutr. 2008, 92, 105–111. [Google Scholar] [CrossRef]
- Ning, B.; Wang, X.; Yu, Y.; Waqar, A.B.; Yu, Q.; Koike, T.; Shiomi, M.; Liu, E.; Wang, Y.; Fan, J. High-fructose and high-fat diet-induced insulin resistance enhances atherosclerosis in Watanabe heritable hyperlipidemic rabbits. Nutr. Metab. 2015, 12, 30. [Google Scholar] [CrossRef] [Green Version]
- Eckel, R.H.; Grundy, S.M.; Zimmet, P.Z. The metabolic syndrome. Lancet 2005, 365, 1415–1428. [Google Scholar] [CrossRef]
- Hotamisligil, G.S.; Shargill, N.S.; Spiegelman, B.M. Adipose expression of tumor necrosis factor-alpha: Direct role in obesity-linked insulin resistance. Science 1993, 259, 87–91. [Google Scholar] [CrossRef]
- Boden, G.; Shulman, G. Free fatty acids in obesity and type 2 diabetes: Defining their role in the development of insulin resistance and β-cell dysfunction. Eur. J. Clin. Investig. 2002, 32, 14–23. [Google Scholar] [CrossRef]
- Kitajima, S.; Morimoto, M.; Liu, E.; Koike, T.; Higaki, Y.; Taura, Y.; Mamba, K.; Itamoto, K.; Watanabe, T.; Tsutsumi, K. Overexpression of lipoprotein lipase improves insulin resistance induced by a high-fat diet in transgenic rabbits. Diabetologia 2004, 47, 1202–1209. [Google Scholar] [CrossRef] [Green Version]
- Olefsky, J.M. The effects of spontaneous obesity on insulin binding, glucose transport, and glucose oxidation of isolated rat adipocytes. J. Clin. Investig. 1976, 57, 842–851. [Google Scholar] [CrossRef]
- Saisho, Y. Importance of beta cell function for the treatment of type 2 diabetes. J. Clin. Med. 2014, 3, 923–943. [Google Scholar] [CrossRef] [Green Version]
- Caeër, C. Inflammation du Tissu Adipeux au Cours de L’obésité Humaine: Implication des Lymphocytes Th17. Ph.D. Thesis, Pierre and Marie Curie University, Paris, France, 2016. [Google Scholar]
- Sugatani, J.; Osabe, M.; Wada, T.; Yamakawa, K.; Yamazaki, Y.; Takahashi, T.; Ikari, A.; Miwa, M. Comparison of enzymatically synthesized inulin, resistant maltodextrin and clofibrate effects on biomarkers of metabolic disease in rats fed a high-fat and high-sucrose (cafeteria) diet. Eur. J. Nutr. 2008, 47, 192–200. [Google Scholar] [CrossRef]
- Zeeni, N.; Daher, C.; Fromentin, G.; Tomé, D.; Darcel, N.; Chaumontet, C. A cafeteria diet modifies the response to chronic variable stress in rats. Stress 2013, 16, 211–219. [Google Scholar] [CrossRef]
- Nielsen, S.; Karpe, F. Determinants of VLDL-triglycerides production. Curr. Opin. Lipidol. 2012, 23, 321–326. [Google Scholar] [CrossRef] [PubMed]
- Wolfe, R.R.; Klein, S.; Carraro, F.; Weber, J.-M. Role of triglyceride-fatty acid cycle in controlling fat metabolism in humans during and after exercise. Am. J. Physiol. Endocrinol. Metab. 1990, 258, E382–E389. [Google Scholar] [CrossRef] [PubMed]
- Guo, X.; Meng, G.; Liu, F.; Zhang, Q.; Liu, L.; Wu, H.; Du, H.; Shi, H.; Xia, Y.; Liu, X. Serum levels of immunoglobulins in an adult population and their relationship with type 2 diabetes. Diabetes Res. Clin. Pract. 2016, 115, 76–82. [Google Scholar] [CrossRef] [PubMed] [Green Version]
- Sahebkar, A.; Sancho, E.; Abelló, D.; Camps, J.; Joven, J. Novel circulating biomarkers for non-alcoholic fatty liver disease: A systematic review. J. Cell. Physiol. 2018, 233, 849–855. [Google Scholar] [CrossRef] [PubMed]
- Adu, O.; Ladipo, M.; Adebiyi, O.; Akinfemi, A.; Igbasan, F. Performance and blood characteristics of pre-pubertal rabbits fed varied levels of dietary rare earth element (REE). World Appl. Sci. J. 2009, 6, 1489–1494. [Google Scholar]
- Ewuola, E.; Egbunike, G. Haematological and serum biochemical response of growing rabbit bucks fed dietary fumonisin B1. Afr. J. Biotechnol. 2008, 7. [Google Scholar]
- Elamin, K.M. Age and sex effects on blood biochemical profile of local rabbits in Sudan. Wayamba J. Anim. Sci. 2013, 5, 548–553. [Google Scholar]
- Semenkovich, C.F.; Heinecke, J.W. The mystery of diabetes and atherosclerosis: Time for a new plot. Diabetes 1997, 46, 327–334. [Google Scholar] [CrossRef] [PubMed]
- Ali, S.Y.; Sajdera, S.; Anderson, H. Isolation and characterization of calcifying matrix vesicles from epiphyseal cartilage. Proc. Natl. Acad. Sci. USA 1970, 67, 1513–1520. [Google Scholar] [CrossRef] [Green Version]
- Takagi, M.; Toda, Y. Electron microscopic study of the intercellular activity of alkaline phosphatase in rat epiphyseal cartilage. Microscopy 1979, 28, 117–127. [Google Scholar]
- Ohta, N.; Kawai, N.; Kawaji, W.; Hirano, H. Changes in alkaline phosphatase activity in rabbit articular cartilage associated with ageing and joint contracture. Histochemistry 1983, 77, 417–422. [Google Scholar] [CrossRef] [PubMed]
- Thyberg, J.; Friberg, U. Electron microscopic enzyme histochemical studies on the cellular genesis of matrix vesicles in the epiphyseal plate. J. Ultrastruct. Res. 1972, 41, 43–59. [Google Scholar] [CrossRef]
- Carroll, J.F.; Dwyer, T.M.; Grady, A.W.; Reinhart, G.A.; Montani, J.-P.; Cockrell, K.; Meydrech, E.F.; Mizelle, H.L. Hypertension, cardiac hypertrophy, and neurohumoral activity in a new animal model of obesity. Am. J. Physiol. Heart Circ. Physiol. 1996, 271, H373–H378. [Google Scholar] [CrossRef]
- Milagro, F.I.; Campión, J.; Martínez, J.A. Weight gain induced by high-fat feeding involves increased liver oxidative stress. Obesity 2006, 14, 1118–1123. [Google Scholar] [CrossRef]
- Brunner, A.; Henn, C.; Drewniak, E.; Lesieur-Brooks, A.; Machan, J.; Crisco, J.; Ehrlich, M. High dietary fat and the development of osteoarthritis in a rabbit model. Osteoarthr. Cartil. 2012, 20, 584–592. [Google Scholar] [CrossRef] [PubMed] [Green Version]
- Hariri, N.; Gougeon, R.; Thibault, L. A highly saturated fat-rich diet is more obesogenic than diets with lower saturated fat content. Nutr. Res. 2010, 30, 632–643. [Google Scholar] [CrossRef] [PubMed]
- Audet, M.; Baillot, A.; Vibarel-Rebot, N. Obésité féminine et activité physique: Mieux comprendre les enjeux liés à la stigmatisation. Santé Publique 2016, 1, 127–134. [Google Scholar] [CrossRef]
- Alarcon, G.; Roco, J.; Medina, M.; Medina, A.; Peral, M.; Jerez, S. High fat diet-induced metabolically obese and normal weight rabbit model shows early vascular dysfunction: Mechanisms involved. Int. J. Obes. 2018, 42, 1535–1543. [Google Scholar] [CrossRef] [PubMed]
- Halade, G.V.; Rahman, M.M.; Williams, P.J.; Fernandes, G. High fat diet-induced animal model of age-associated obesity and osteoporosis. J. Nutr. Biochem. 2010, 21, 1162–1169. [Google Scholar] [CrossRef] [Green Version]
- Soria, A.; Chicco, A.; D’Alessandro, M.a.E.; Rossi, A.; Lombardo, Y.B. Dietary fish oil reverse epididymal tissue adiposity, cell hypertrophy and insulin resistance in dyslipemic sucrose fed rat model. J. Nutr. Biochem. 2002, 13, 209–218. [Google Scholar] [CrossRef]
- Romestaing, C.; Piquet, M.-A.; Bedu, E.; Rouleau, V.; Dautresme, M.; Hourmand-Ollivier, I.; Filippi, C.; Duchamp, C.; Sibille, B. Long term highly saturated fat diet does not induce NASH in Wistar rats. Nutr. Metab. 2007, 4, 4. [Google Scholar] [CrossRef] [Green Version]
- Sampey, B.P.; Vanhoose, A.M.; Winfield, H.M.; Freemerman, A.J.; Muehlbauer, M.J.; Fueger, P.T.; Newgard, C.B.; Makowski, L. Cafeteria diet is a robust model of human metabolic syndrome with liver and adipose inflammation: Comparison to high-fat diet. Obesity 2011, 19, 1109–1117. [Google Scholar] [CrossRef]
- Alberti, K.; Eckel, R.H.; Grundy, S.M.; Zimmet, P.Z.; Cleeman, J.I.; Donato, K.A.; Fruchart, J.-C.; James, W.P.T.; Loria, C.M.; Smith, S.C., Jr. Harmonizing the metabolic syndrome: A joint interim statement of the international diabetes federation task force on epidemiology and prevention; national heart, lung, and blood institute; American heart association; world heart federation; international atherosclerosis society; and international association for the study of obesity. Circulation 2009, 120, 1640–1645. [Google Scholar]
- Gomez-Smith, M.; Karthikeyan, S.; Jeffers, M.S.; Janik, R.; Thomason, L.A.; Stefanovic, B.; Corbett, D. A physiological characterization of the Cafeteria diet model of metabolic syndrome in the rat. Physiol. Behav. 2016, 167, 382–391. [Google Scholar] [CrossRef] [PubMed]
- Tonucci, L.B.; Dos Santos, K.M.O.; de Oliveira, L.L.; Ribeiro, S.M.R.; Martino, H.S.D. Clinical application of probiotics in type 2 diabetes mellitus: A randomized, double-blind, placebo-controlled study. Clin. Nutr. 2017, 36, 85–92. [Google Scholar] [CrossRef]
- Sato, M.; Uzu, K.; Yoshida, T.; Hamad, E.M.; Kawakami, H.; Matsuyama, H.; Abd El-Gawad, I.A.; Imaizumi, K. Effects of milk fermented byLactobacillusgasseri SBT2055 on adipocyte size in rats. Br. J. Nutr. 2008, 99, 1013–1017. [Google Scholar] [CrossRef] [Green Version]
- Hamad, E.M.; Sato, M.; Uzu, K.; Yoshida, T.; Higashi, S.; Kawakami, H.; Kadooka, Y.; Matsuyama, H.; Abd El-Gawad, I.A.; Imaizumi, K. Milk fermented by Lactobacillus gasseri SBT2055 influences adipocyte size via inhibition of dietary fat absorption in Zucker rats. Br. J. Nutr. 2008, 101, 716–724. [Google Scholar] [CrossRef] [Green Version]
- Yin, Y.-N.; Yu, Q.-F.; Fu, N.; Liu, X.-W.; Lu, F.-G. Effects of four Bifidobacteria on obesity in high-fat diet induced rats. World J. Gastroenterol. WJG 2010, 16, 3394. [Google Scholar] [CrossRef]
- Stenman, L.; Waget, A.; Garret, C.; Klopp, P.; Burcelin, R.; Lahtinen, S. Potential probiotic Bifidobacterium animalis ssp. lactis 420 prevents weight gain and glucose intolerance in diet-induced obese mice. Benef. Microbes 2014, 5, 437–445. [Google Scholar] [CrossRef] [PubMed] [Green Version]
- Roediger, W. Role of anaerobic bacteria in the metabolic welfare of the colonic mucosa in man. Gut 1980, 21, 793–798. [Google Scholar] [CrossRef] [PubMed] [Green Version]
- Fleming, S.; Fitch, M.; DeVries, S.; Liu, M.; Kight, C. Nutrient utilization by cells isolated from rat jejunum, cecum and colon. J. Nutr. 1991, 121, 869–878. [Google Scholar] [CrossRef] [PubMed]
- Vrieze, A.; Holleman, F.; Zoetendal, E.; De Vos, W.; Hoekstra, J.; Nieuwdorp, M. The environment within: How gut microbiota may influence metabolism and body composition. Diabetologia 2010, 53, 606–613. [Google Scholar] [CrossRef] [Green Version]
- Elli, M.; Colombo, O.; Tagliabue, A. A common core microbiota between obese individuals and their lean relatives? Evaluation of the predisposition to obesity on the basis of the fecal microflora profile. Med. Hypotheses 2010, 75, 350–352. [Google Scholar] [CrossRef] [PubMed]
- Xiao, J.; Kondo, S.; Takahashi, N.; Miyaji, K.; Oshida, K.; Hiramatsu, A.; Iwatsuki, K.; Kokubo, S.; Hosono, A. Effects of milk products fermented by Bifidobacterium longum on blood lipids in rats and healthy adult male volunteers. J. Dairy Sci. 2003, 86, 2452–2461. [Google Scholar] [CrossRef]
- Wang, Y.; Xu, N.; Xi, A.; Ahmed, Z.; Zhang, B.; Bai, X. Effects of Lactobacillus plantarum MA2 isolated from Tibet kefir on lipid metabolism and intestinal microflora of rats fed on high-cholesterol diet. Appl. Microbiol. Biotechnol. 2009, 84, 341–347. [Google Scholar] [CrossRef] [PubMed]
- Kalavathy, R.; Abdullah, N.; Jalaludin, S.; Ho, Y. Effects of Lactobacillus cultures on growth performance, abdominal fat deposition, serum lipids and weight of organs of broiler chickens. Br. Poult. Sci. 2003, 44, 139–144. [Google Scholar] [CrossRef] [PubMed]
- Abd El-Hady, A.; El-Ghalid, O.; El-Raffa, A. Influence of a herbal feed additives (Digestarom®) on productive performance and blood constituents of growing rabbits. Egypt. J. Anim. Prod. 2013, 50, 27–37. [Google Scholar]
- Wang, C.; Li, F.; Zhu, Y.; Wang, X.; Sun, L. Impact of probiotics on intestinal microbial community diversity of growing Rex rabbits. In Proceedings of the 10th World Rabbit Congress, Qingdao, China, 15–18 June 2016; pp. 635–639. [Google Scholar]
- Younis, T.; Al-Gamal, M.; Hesham, A. Impact of probiotic (Lactobacillus planterium) supplementation on productive and physiological performance of growing rabbits under egyptian conditions. Egypt. J. Rabbit Sci. 2019, 29, 125–148. [Google Scholar]
- Abdel-Azeem, A.; Hassan, A.; Basyony, M.; Abu Hafsa, S.H. Rabbit growth, carcass characteristic, digestion, caecal fermentation, microflora, and some blood biochemical components affected by oral administration of anaerobic probiotic (ZAD®). Egypt. J. Nutr. Feed. 2018, 21, 693–710. [Google Scholar] [CrossRef] [Green Version]
- Mikirova, N.A.; Casciari, J.J.; Hunninghake, R.E.; Beezley, M.M. Effect of weight reduction on cardiovascular risk factors and CD34-positive cells in circulation. Int. J. Med. Sci. 2011, 8, 445. [Google Scholar] [CrossRef] [Green Version]
- Mekkes, M.; Weenen, T.; Brummer, R.J.; Claassen, E. The development of probiotic treatment in obesity: A review. Benef. Microbes 2014, 5, 19–28. [Google Scholar] [CrossRef]
- Cano, P.G.; Santacruz, A.; Trejo, F.M.; Sanz, Y. Bifidobacterium CECT 7765 improves metabolic and immunological alterations associated with obesity in high-fat diet-fed mice. Obesity 2013, 21, 2310–2321. [Google Scholar] [CrossRef] [PubMed]
- Ley, R.E.; Turnbaugh, P.J.; Klein, S.; Gordon, J.I. Human gut microbes associated with obesity. Nature 2006, 444, 1022–1023. [Google Scholar] [CrossRef]


| Parameters 1 | Sex | Control | Obese | Effects 2 | ||||||||||
|---|---|---|---|---|---|---|---|---|---|---|---|---|---|---|
| 0 | 8 | 14 | 0 | 8 | 14 | Group 3 | Time | Sex | S × T | G × T | S × G | G × T × S | ||
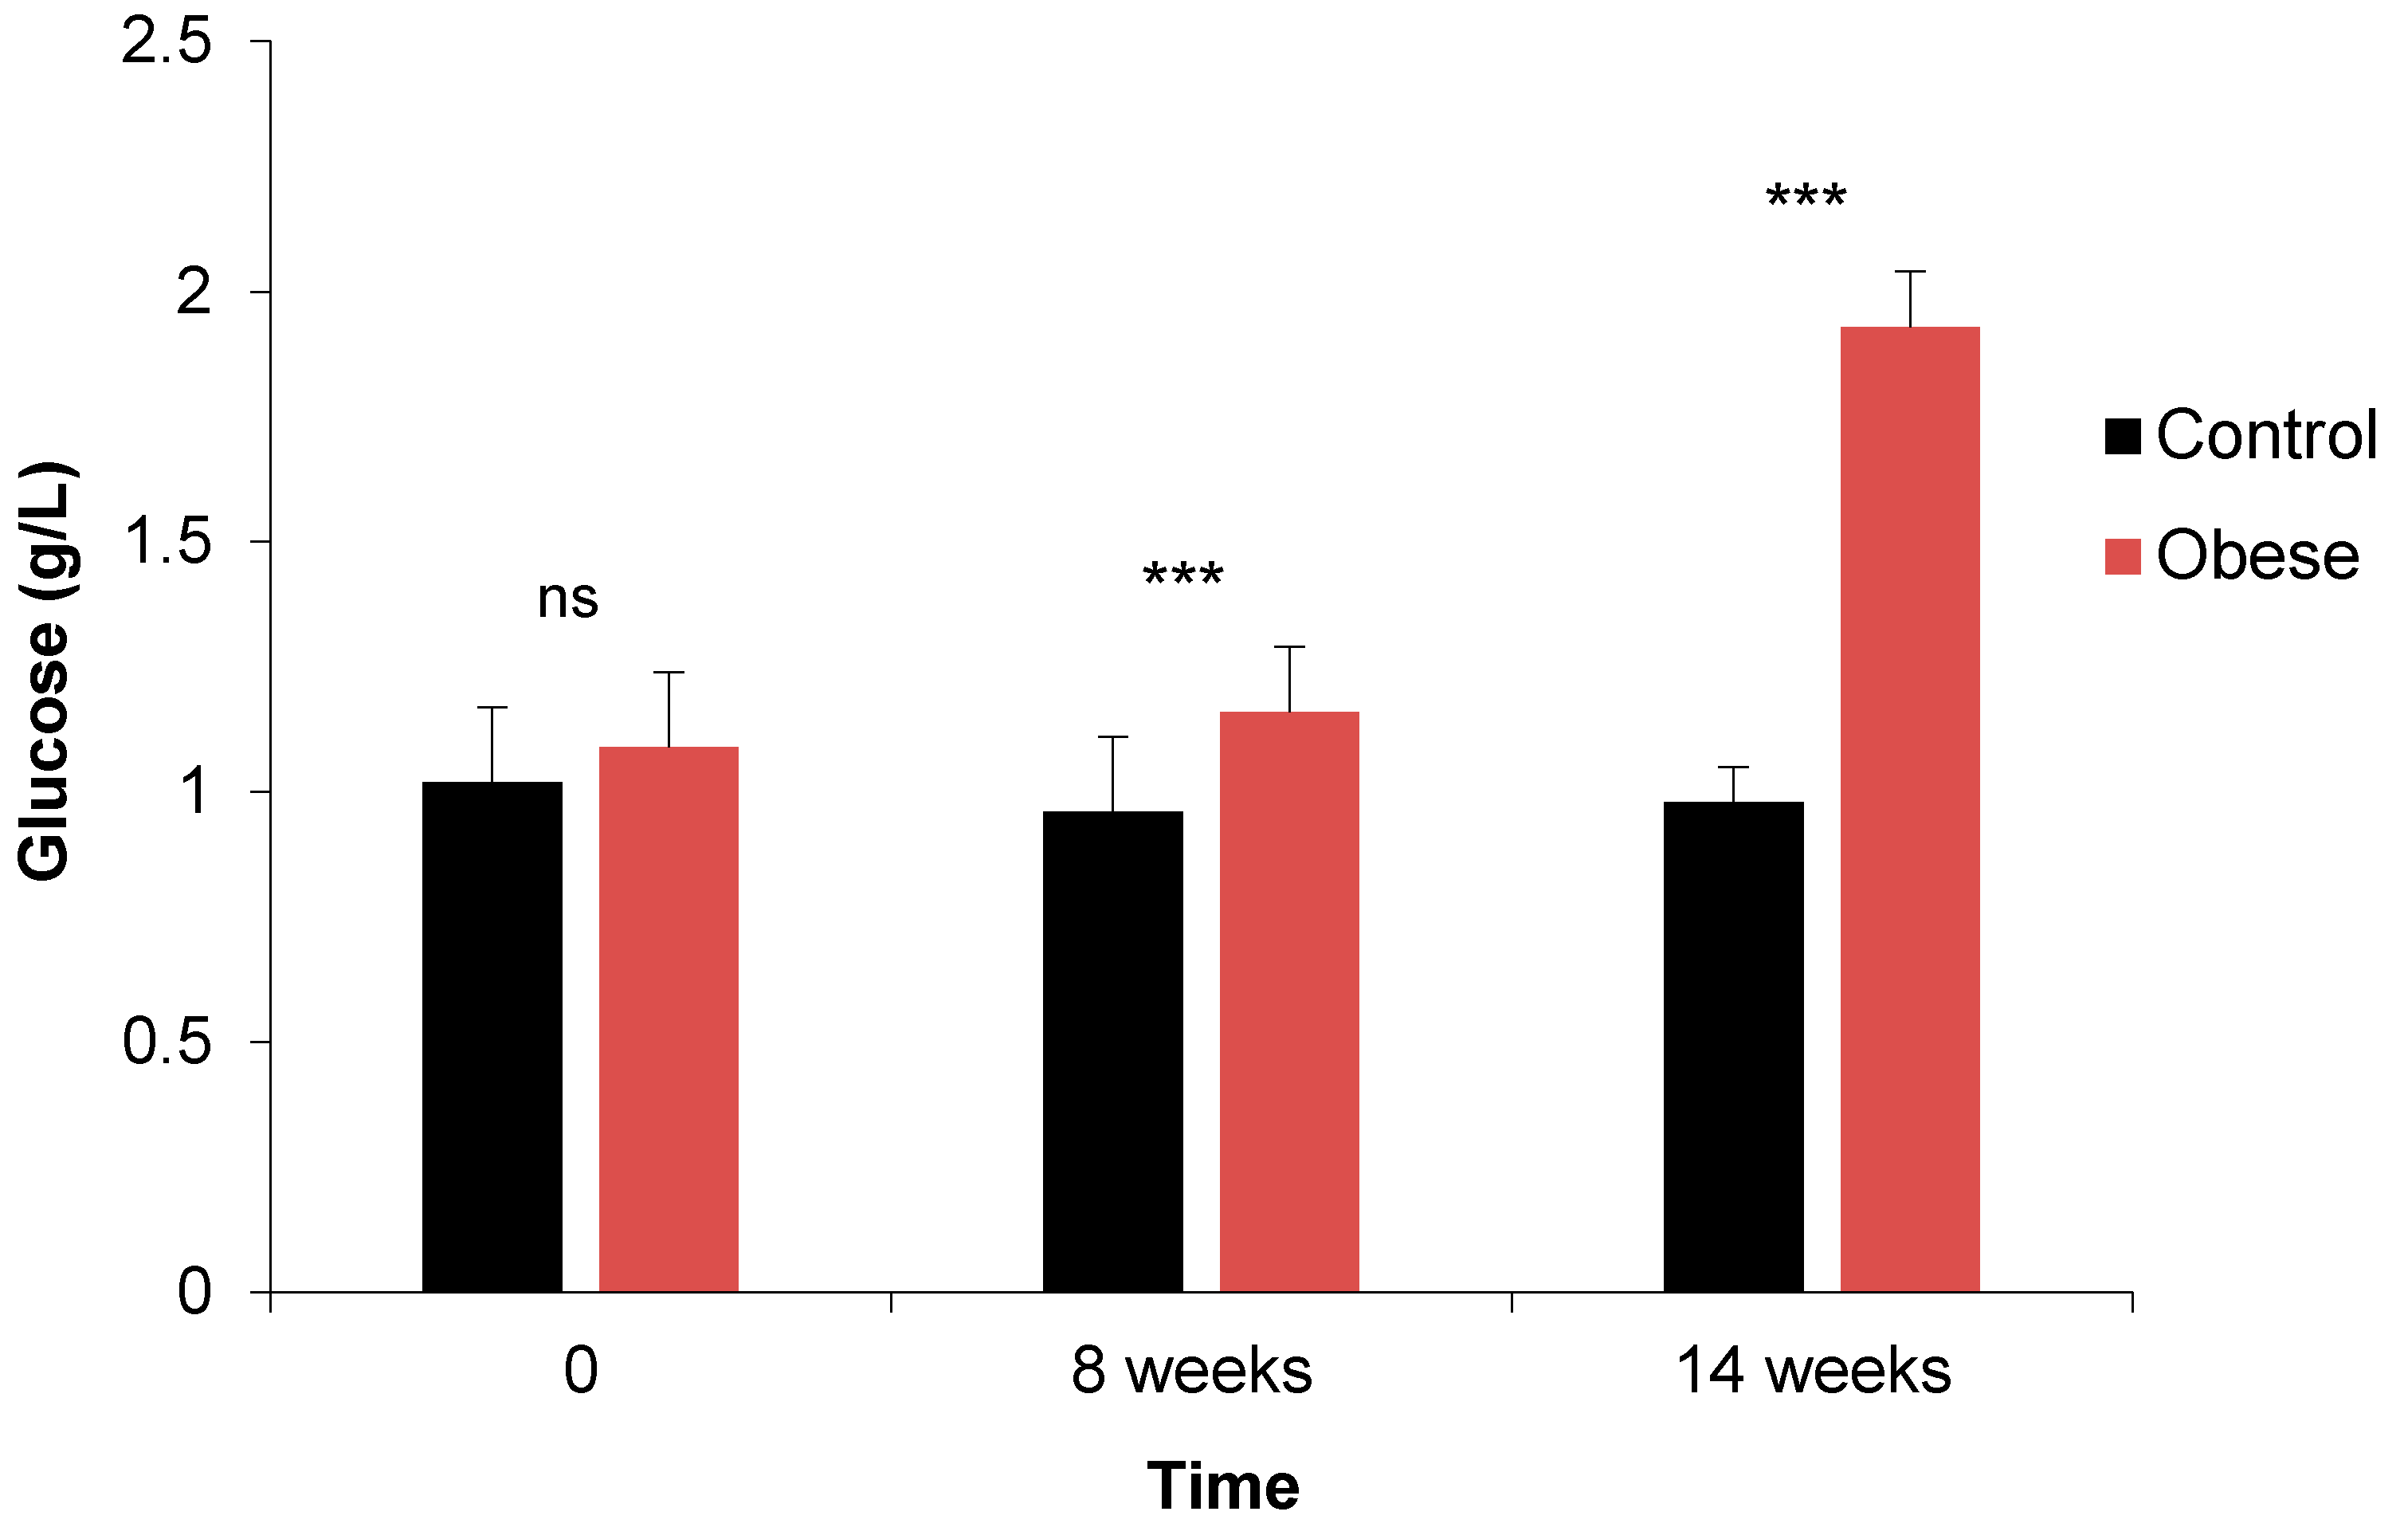
| GLU g/L | M | 1.02 bc | 0.93 c | 0.99 bc | 1.12 bc | 1.18 b | 1.91 a | *** | *** | ns | ns | *** | ns | ns |
| F | 1.02 bc | 0.99 bc | 0.99 bc | 1.08 bc | 1.16 b | 1.96 a | ||||||||
| TC (g/L) | M | 0.66 def | 1.14 de | 1.23 d | 0.46 f | 1.86 bc | 2.62 a | *** | *** | ns | ns | *** | ns | ns |
| F | 0.55 f | 1.17 de | 1.23 d | 0.61 ef | 1.84 c | 2.44 ab | ||||||||
| HDL (g/L) | M | 0.16 cde | 0.24 abc | 0.29 ab | 0.14 de | 0.19 cde | 0.17 cde | *** | *** | ns | ns | *** | ns | ns |
| F | 0.15 cde | 0.25 abc | 0.32 a | 0.14 e | 0.19 cde | 0.17 cde | ||||||||
| LDL (g/L) | M | 0.65 bc | 0.78 bc | 0.95 bc | 0.64 bc | 0.85 bc | 1.46 a | *** | *** | ns | ns | *** | ns | ns |
| F | 0.58 c | 0.86 bc | 0.86 bc | 0.65 bc | 1.01 b | 1.48 a | ||||||||
| TG (g/L) | M | 0.34 c | 0.43 c | 0.49 c | 0.28 c | 1.23 b | 3.30 a | *** | *** | ns | ns | *** | ns | ns |
| F | 0.29 c | 0.41 c | 0.49 c | 0.36 c | 1.21 b | 3.30 a | ||||||||
| CREA (mg/L) | M | 4.87 b | 12.19 a | 12.57 a | 5.01 b | 11.98 a | 12.85 a | ns | *** | ns | ns | ns | ns | ns |
| F | 5.56 b | 12.46 a | 12.76 a | 5.06 b | 12.82 a | 13.15 a | ||||||||
| TP(g/L) | M | 56.15 abc | 56.92 abc | 58.31 abc | 55.04 bc | 68.20 abc | 79.71 a | ** | *** | ns | ns | * | ns | ns |
| F | 48.25 c | 52.06 c | 59.01 abc | 49.59 c | 55.28 bc | 76.74 ab | ||||||||
| ALB (g/L) | M | 27.40 b | 40.40 ab | 40.76 ab | 35.58 ab | 45.56 a | 45.87 a | ns | ** | ns | ns | ns | * | ns |
| F | 37.83 ab | 42.92 ab | 43.20 ab | 32.29 ab | 37.95 ab | 38.27 ab | ||||||||
| ASAT(UI/L) | M | 43.85 | 44.89 | 47.36 | 52.80 | 55.34 | 62.33 | ns | ns | ns | ns | ns | *** | ns |
| F | 51.80 | 52.36 | 51.18 | 41.56 | 44.28 | 48.28 | ||||||||
| ALAT(UI/L) | M | 47.58 | 47.92 | 47.27 | 46.39 | 47.75 | 47.66 | ns | ns | ns | ns | ns | ns | ns |
| F | 45.74 | 45.89 | 45.41 | 46.11 | 48.15 | 47.89 | ||||||||
| ASAT/ALAT | M | 0.94 | 0.96 | 1.03 | 1.13 | 1.15 | 1.29 | ns | ns | ns | ns | ns | *** | ns |
| F | 1.19 | 1.20 | 1.18 | 0.92 | 0.92 | 1.03 | ||||||||
| AP (UI/L) | M | 203.00 a | 93.40 c | 91.20 c | 189.50 ab | 92.90 c | 105.40 bc | ns | *** | ns | ns | ns | ns | ns |
| F | 166.70 abc | 92.00 c | 100.00 bc | 176.90 abc | 98.40 bc | 106.20 bc | ||||||||
| Parameters 1 | Sex | Control | Obese | Effects 2 | ||||||||||
|---|---|---|---|---|---|---|---|---|---|---|---|---|---|---|
| 0 | 8 | 14 | 0 | 8 | 14 | Group 3 | Time | Sex | S × T | G × T | S × G | G × T × S | ||
| OGTT (T0) (g/L) | M | 1.02 bc | 0.93 c | 0.99 bc | 1.12 bc | 1.18 b | 1.91 a | *** | *** | ns | ns | *** | ns | ns |
| F | 1.02 bc | 0.99 bc | 0.99 bc | 1.08 bc | 1.16 b | 1.96 a | ||||||||
| OGTT (T30) (g/L) | M | 2.32 cd | 2.13 d | 3.04 bc | 2.69 cd | 3.55 ab | 3.92 a | *** | *** | ns | ns | ** | ns | ** |
| F | 2.16 d | 2.52 cd | 2.31 cd | 2.59 cd | 3.01 bc | 3.89 a | ||||||||
| OGTT (T60) (g/L) | M | 1.33 bc | 2.09 ab c | 2.31 ab c | 2.10 ab c | 2.58 ab | 3.03 a | *** | *** | ns | ns | ns | ns | ns |
| F | 1.32 bc | 1.99 ab c | 1.95 ab c | 1.21 c | 2.30 ab c | 2.96 a | ||||||||
| OGTT (T90) (g/L) | M | 1.11 c | 1.50 bc | 1.48 c | 1.16 c | 2.13 ab | 2.39 a | *** | *** | ns | ns | *** | ns | ns |
| F | 1.29 c | 1.49 c | 1.61 bc | 1.11 c | 1.74 bc | 2.47 a | ||||||||
| OGTT (T120) (g/L) | M | 0.97 b | 1.10 b | 1.17 b | 1.01 b | 1.11 b | 1.83 a | *** | *** | ns | ns | *** | ns | ns |
| F | 1.00 b | 1.10 b | 1.01 b | 0.92 b | 1.11 b | 2.02 a | ||||||||
| OGTT (T180) (g/L) | M | 0.94 b | 0.97 b | 0.94 b | 1.00 b | 0.97 b | 1.30 a | ** | *** | ns | ns | *** | ns | ns |
| F | 0.98 b | 0.97 b | 1.01 ab | 0.94 b | 0.95 b | 1.30 a | ||||||||
| Parameters | Sex | Control | Obese | Effects 1 | ||||||||||
|---|---|---|---|---|---|---|---|---|---|---|---|---|---|---|
| 0 | 8 | 14 | 0 | 8 | 14 | Group 2 | Time | Sex | S × T | G × T | S × G | G × T × S | ||
| Length (cm) | M | 38.40 b | 43.90 a | 44.50 a | 38.90 b | 43.50 a | 44.60 a | ns | *** | ns | ns | ns | ns | ns |
| F | 39.40 b | 43.50 a | 44.50 a | 38.40 b | 43.70 a | 45.40 a | ||||||||
| Height (cm) | M | 20.00 d | 23.50 c | 26.00 a | 19.70 d | 23.40 c | 25.20 ab | ns | *** | ns | ns | ns | ns | ns |
| F | 19.90 d | 24.00 bc | 25.40 ab | 19.90 d | 23.10 c | 25.70 a | ||||||||
| Abdominal Circumference (cm) | M | 30.80 d | 41.80 bc | 42.10 bc | 30.80 d | 43.30 b | 46.90 a | *** | *** | ns | ns | *** | ns | ns |
| F | 31.20 d | 40.60 c | 43.10 b | 31.20 d | 42.80 bc | 47.30 a | ||||||||
| Abdominal Circumference/Length ratio | M | 0.80 c | 0.95 b | 0.95 b | 0.79 c | 1.00 ab | 1.05 a | *** | *** | ns | ns | ** | ns | ns |
| F | 0.79 c | 0.93 b | 0.97 b | 0.81 c | 0.98 ab | 1.05 a | ||||||||
| BMI 3 (kg/m2) | M | 1.99 e | 20.09 bc | 18.49 c | 12.34 d | 32.63 a | 32.68 a | *** | *** | ** | ns | ns | ns | ns |
| F | 2.15 e | 22.21 bc | 23.09 b | 13.26 d | 32.89 a | 33.92 a | ||||||||
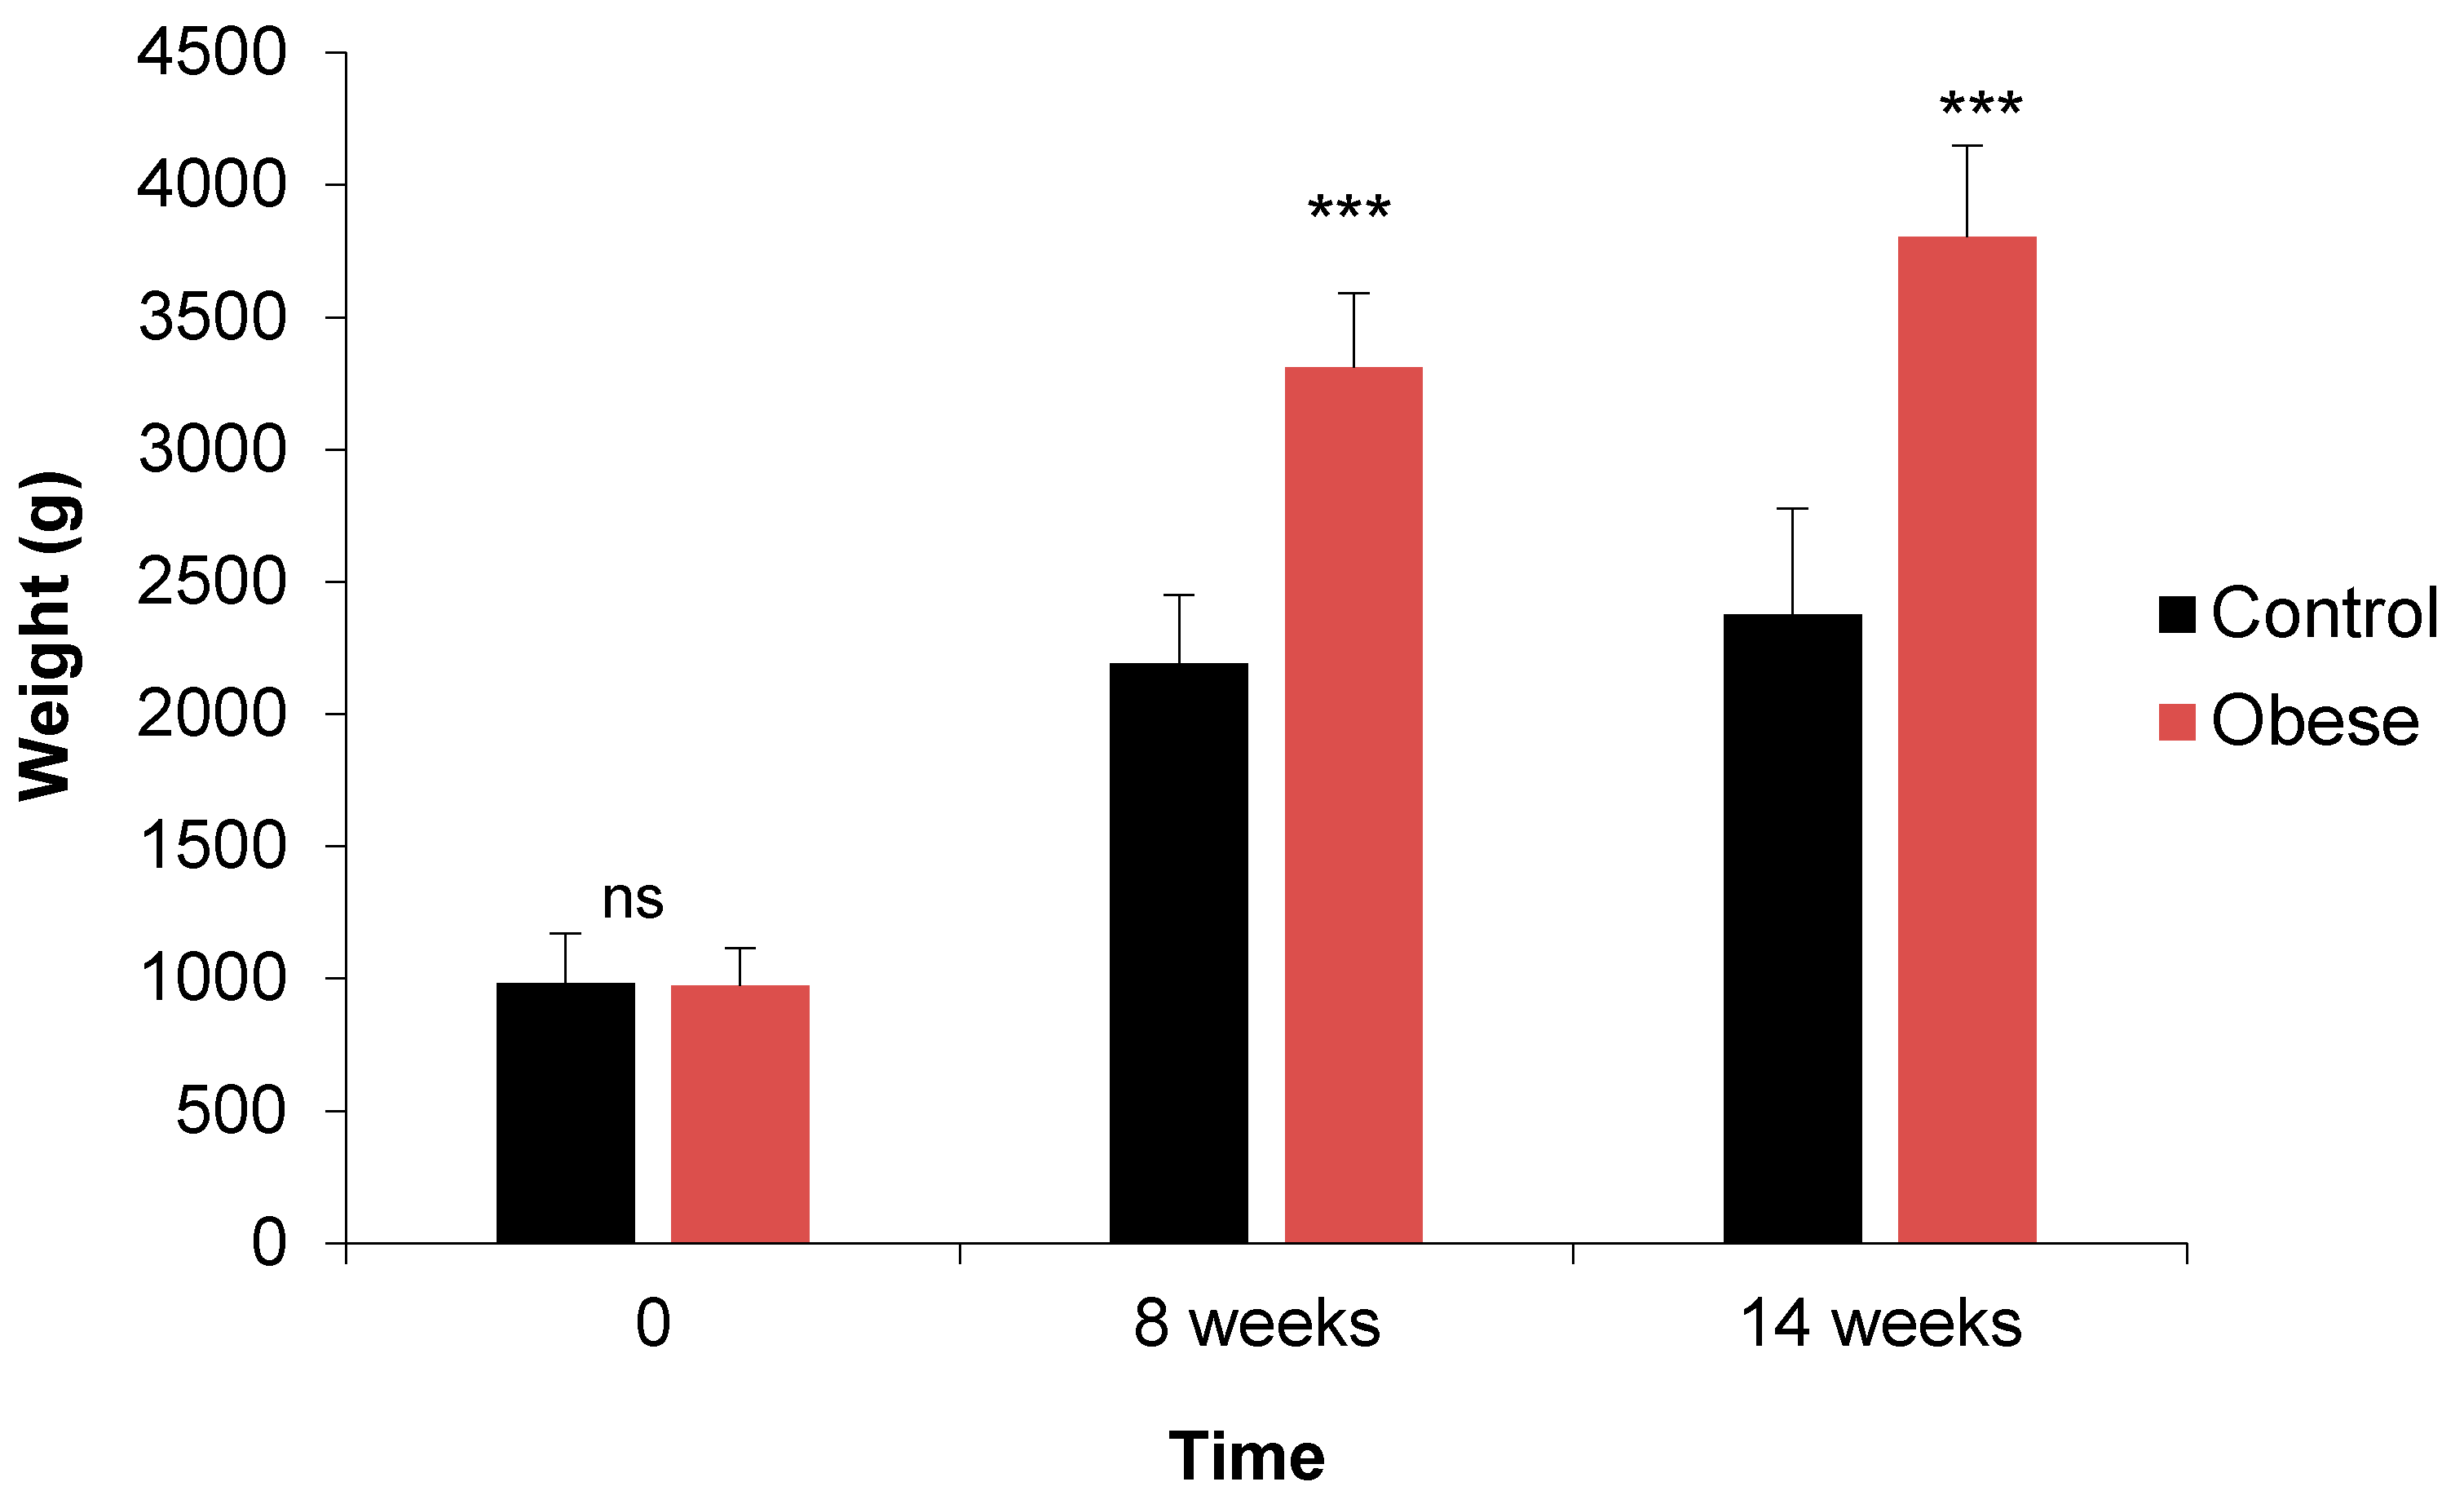
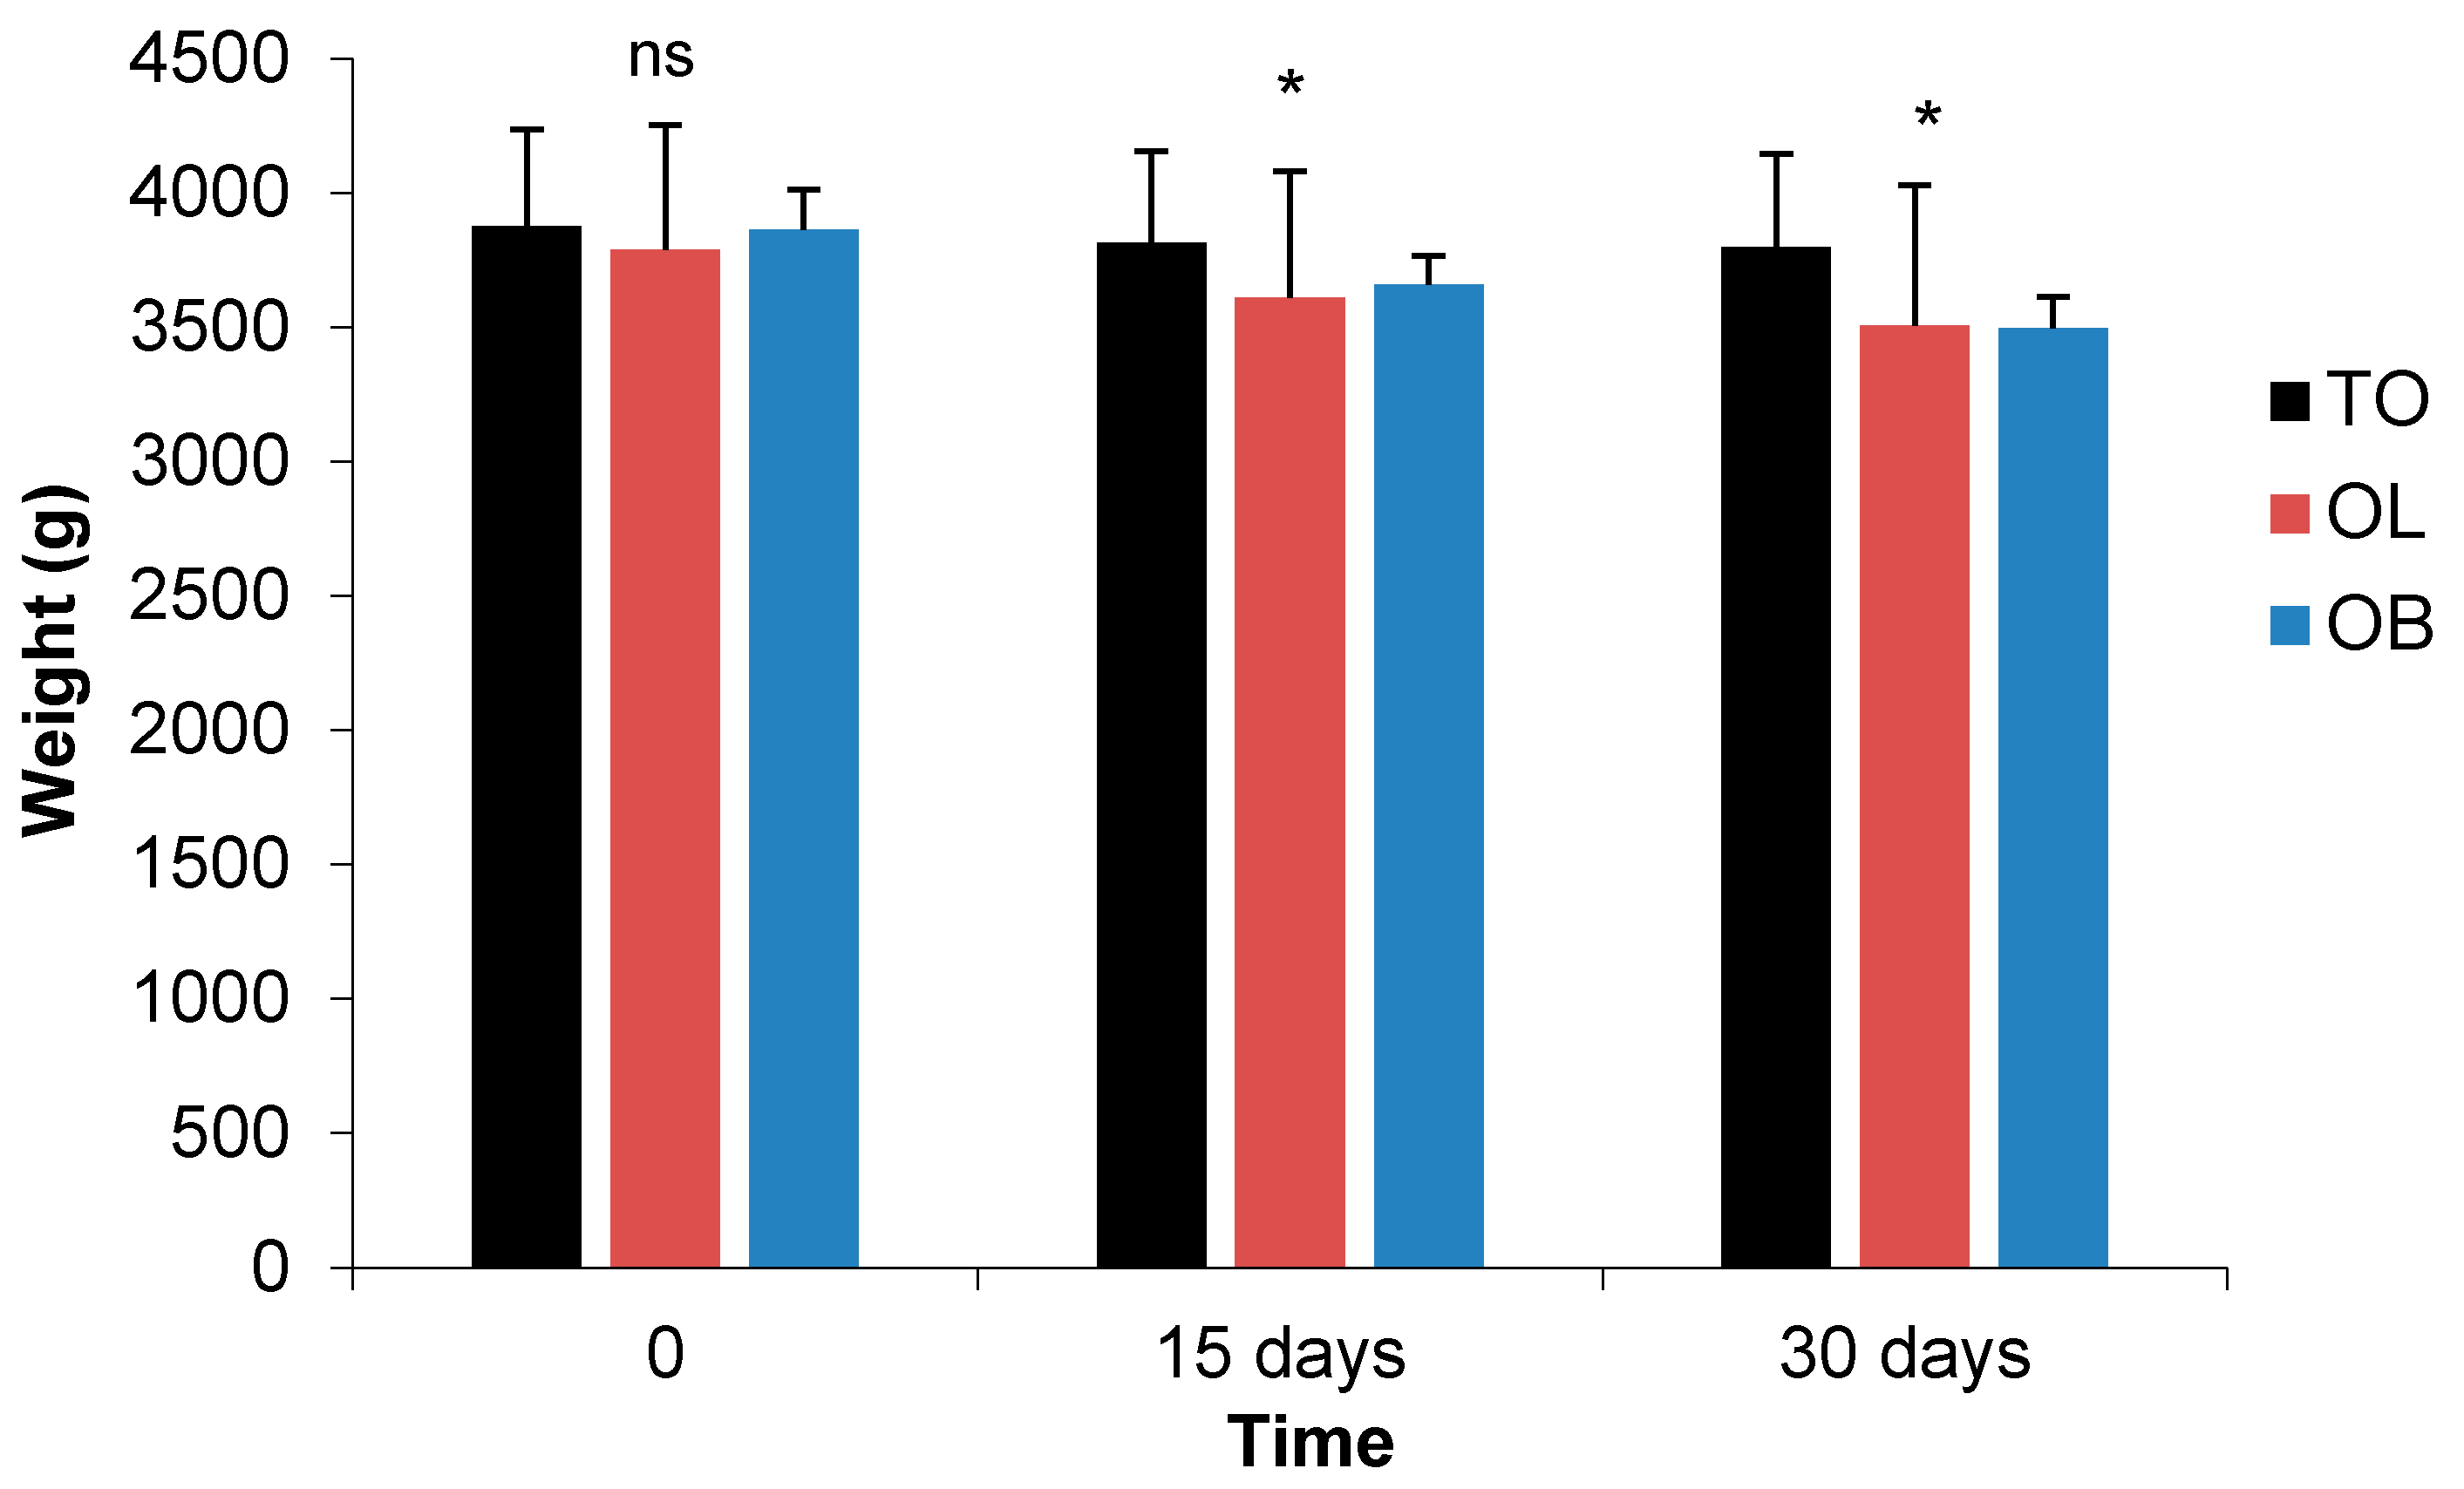
| Weight (g) | M | 996 e | 2064 d | 2138 d | 944 e | 3308 b | 3665 ab | *** | *** | *** | *** | *** | ns | ns |
| F | 969 e | 2318 cd | 2613 c | 1004 e | 3311 b | 3943 a | ||||||||
| Parameters 1 | Sex | TO | OB | OL | Effects 2 | ||||||||||||
|---|---|---|---|---|---|---|---|---|---|---|---|---|---|---|---|---|---|
| 0 | 15 | 30 | 0 | 15 | 30 | 0 | 15 | 30 | Group 3 | Time | Sex | S × T | G × T | S × G | G × T × S | ||
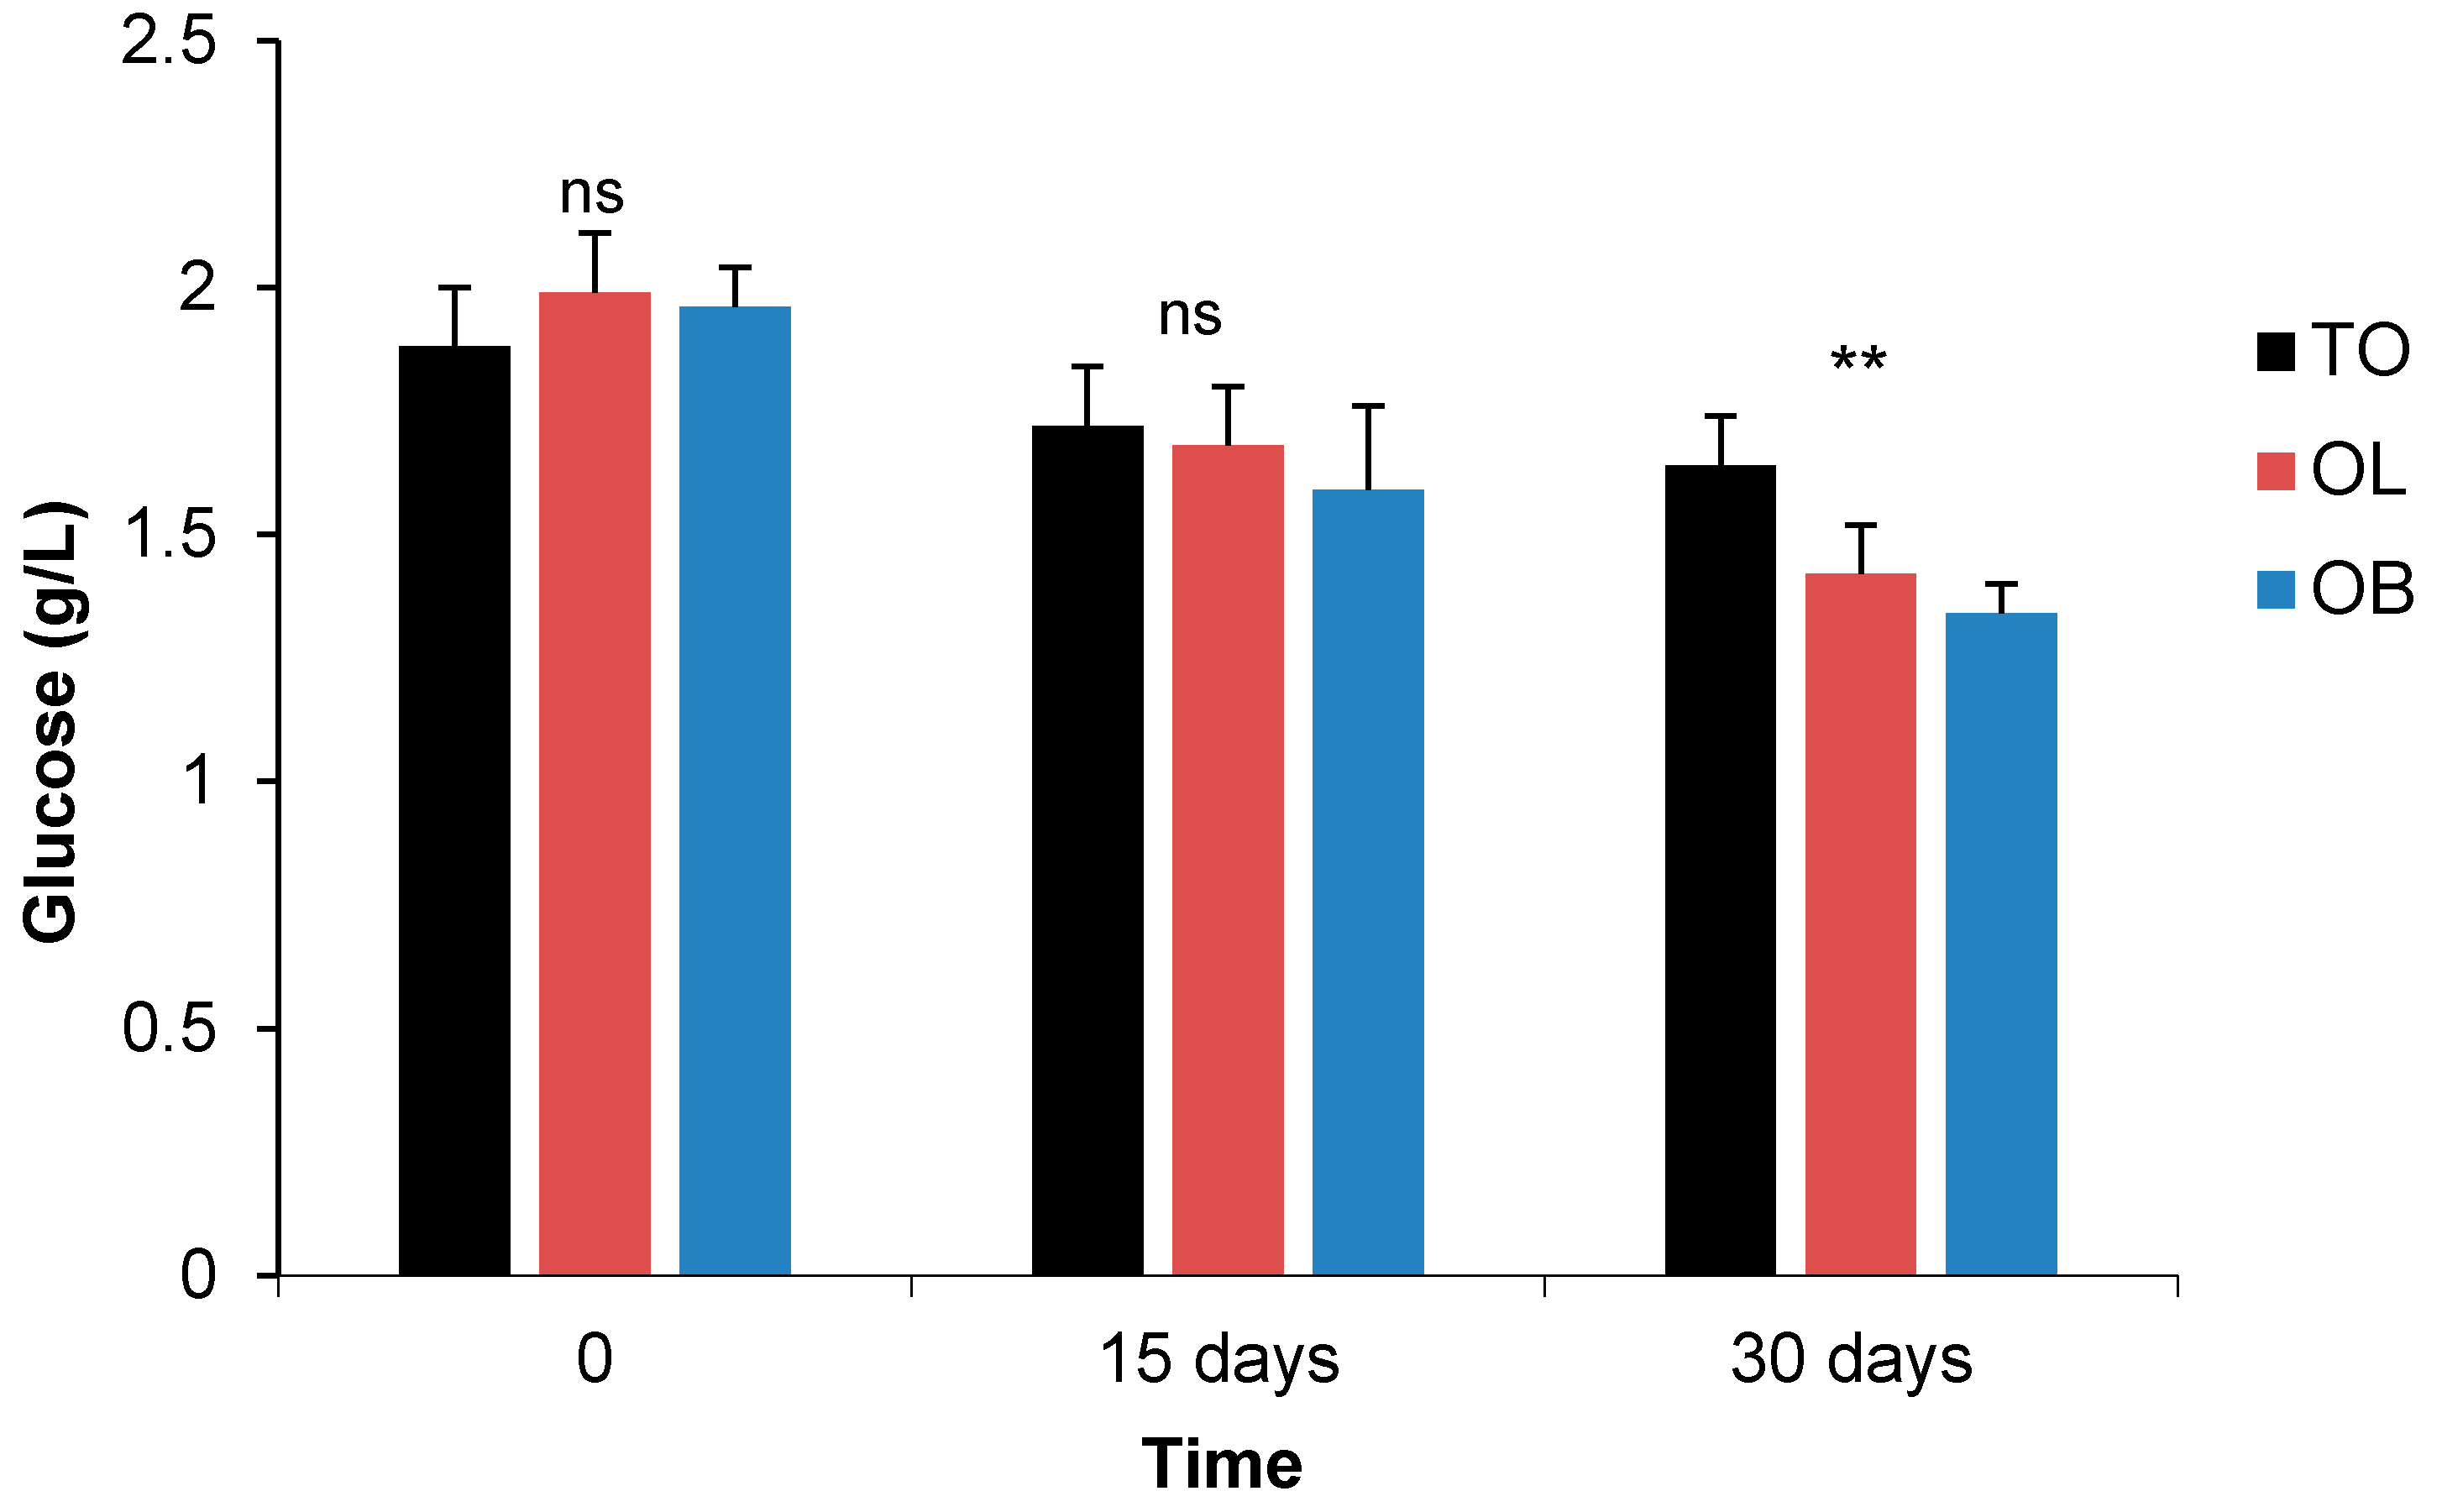
| GLU g/L | M | 1.83 a | 1.72 b | 1.58 bc | 2.01 a | 1.59 c | 1.30 d | 1.94 a | 1.73 bc | 1.42 d | * | *** | ns | ns | ** | ns | ns |
| F | 1.95 a | 1.72 b | 1.72 b | 1.91 a | 1.59 c | 1.38 d | 2.04 a | 1.64 bc | 1.43 d | ||||||||
| TC (g/L) | M | 2.02 ab | 1.85 bc | 1.76 bc | 2.46 ab c | 1.86 bc | 1.47 d | 2.03 a | 1.89 bc | 1.51 d | ** | *** | ns | ns | ns | *** | ns |
| F | 2.89 a | 2.45 ab c | 2.43 bc | 2.57 ab | 1.77 bc | 1.59 d | 2.02 ab | 1.80 bc | 1.57 d | ||||||||
| HDL (g/L) | M | 0.15 b | 0.21 ab | 0.22 ab | 0.21 ab | 0.19 ab | 0.24 ab | 0.17 ab | 0.23 ab | 0.27 a | ns | * | ns | ns | ns | ns | ns |
| F | 0.20 ab | 0.18 ab | 0.17 ab | 0.17 ab | 0.17 ab | 0.21 ab | 0.19 ab | 0.21 ab | 0.20 ab | ||||||||
| LDL (g/L) | M | 1.44 a | 1.37 bc | 1.20 bc | 1.55 a | 0.93 d | 0.82 d | 1.44 a | 0.98 d | 0.94 d | ** | *** | ns | ns | * | ns | ns |
| F | 1.42 a | 1.25 bc | 1.21 bc | 1.50 a | 1.00 d | 0.92 d | 1.46 a | 0.84 d | 0.76 d | ||||||||
| TG (g/L) | M | 3.75 | 2.94 | 2.73 | 2.85 | 2.93 | 2.57 | 3.53 | 2.30 | 2.04 | ns | * | ns | ns | ns | ns | ns |
| F | 3.08 | 2.67 | 2.83 | 2.83 | 2.43 | 2.03 | 2.83 | 2.70 | 2.22 | ||||||||
| CREA (mg/L) | M | 13.13 | 12.78 | 12.77 | 12.64 | 12.69 | 12.60 | 13.69 | 13.65 | 13.65 | ns | ns | ns | ns | ns | * | ns |
| F | 13.00 | 12.97 | 12.91 | 12.85 | 12.76 | 12.47 | 12.18 | 12.18 | 12.09 | ||||||||
| TP (g/L) | M | 79.51 | 65.33 | 64.33 | 78.40 | 68.67 | 68.01 | 66.33 | 67.00 | 68.76 | ns | ns | * | ns | ns | ns | ns |
| F | 68.13 | 88.43 | 88.60 | 84.37 | 82.40 | 66.21 | 89.33 | 81.33 | 69.48 | ||||||||
| ALB (g/L) | M | 47.36 | 42.05 | 42.05 | 44.06 | 43.17 | 43.00 | 38.67 | 38.73 | 38.75 | ns | ns | ns | ns | ns | ns | ns |
| F | 41.18 | 42.23 | 42.23 | 36.24 | 40.60 | 39.07 | 46.16 | 45.40 | 45.40 | ||||||||
| ASAT (UI/L) | M | 61.90 | 53.33 | 51.14 | 48.75 | 49.93 | 49.13 | 47.53 | 46.67 | 47.90 | ns | ns | ns | ns | ns | ns | ns |
| F | 47.10 | 55.33 | 54.00 | 59.13 | 57.83 | 55.40 | 62.73 | 61.30 | 49.83 | ||||||||
| ALAT (UI/L) | M | 47.59 | 46.25 | 47.50 | 52.30 | 42.74 | 41.36 | 45.41 | 42.58 | 42.58 | ns | ns | * | ns | ns | ns | ns |
| F | 45.13 | 48.62 | 47.23 | 47.53 | 51.48 | 52.80 | 49.02 | 50.10 | 50.10 | ||||||||
| ASAT/ALAT | M | 1.32 | 1.19 | 1.08 | 1.00 | 1.18 | 1.20 | 1.09 | 1.11 | 1.13 | ns | ns | ns | ns | ns | ns | ns |
| F | 1.06 | 1.14 | 1.17 | 1.23 | 1.15 | 1.06 | 1.26 | 1.25 | 1.01 | ||||||||
| AP (UI/L) | M | 102.2 | 104.0 | 103.0 | 107.5 | 100.6 | 99.0 | 99.6 | 100.3 | 101.3 | ns | ns | ns | ns | ns | ns | ns |
| F | 102.0 | 105.0 | 105.0 | 104.0 | 104.3 | 105.6 | 108.0 | 106.6 | 104.6 | ||||||||
| Parameters 1 | TO | OB | OL | Effects 2 | |||||||||||||
|---|---|---|---|---|---|---|---|---|---|---|---|---|---|---|---|---|---|
| 0 | 15 | 30 | 0 | 15 | 30 | 0 | 15 | 30 | Group 3 | Time | Sex | S × T | G × T | S × G | G × T × S | ||
| OGTT (T0) (g/L) | M | 2.03 a | 1.92 ab | 1.92 ab | 1.9 ab | 1.16 de | 1.06 e | 1.97 ab | 1.56 bcd | 1.30 cde | *** | *** | *** | ns | *** | ** | ns |
| F | 1.81 ab | 1.71 abc | 1.62 abc | 1.96 ab | 1.13 de | 1.03 e | 1.80 ab | 1.11 e | 0.99 e | ||||||||
| OGTT (T30) (g/L) | M | 3.97 | 3.40 | 3.17 | 3.85 | 2.55 | 2.32 | 3.94 | 2.72 | 2.60 | ns | ns | ns | ns | ns | ns | ns |
| F | 3.86 | 3.41 | 3.35 | 3.92 | 3.86 | 3.34 | 3.88 | 3.74 | 3.59 | ||||||||
| OGTT (T60) (g/L) | M | 3.17 | 2.90 | 2.59 | 3.27 | 3.07 | 2.94 | 2.87 | 2.63 | 2.52 | ns | ns | ns | ns | ns | ** | ns |
| F | 3.01 | 2.96 | 2.91 | 2.67 | 2.57 | 2.25 | 3.27 | 3.18 | 2.91 | ||||||||
| OGTT (T90) (g/L) | M | 2.46 | 2.08 | 1.92 | 2.72 | 2.47 | 2.31 | 2.36 | 2.23 | 2.14 | ns | ** | ns | ns | ns | ns | ns |
| F | 2.49 | 2.36 | 2.26 | 2.69 | 2.27 | 2.17 | 2.72 | 2.53 | 2.38 | ||||||||
| OGTT (T120) (g/L) | M | 2.19 ab | 1.88 ab | 1.78 ab | 2.23 ab | 2.04 ab | 1.91 ab | 2.09 ab | 1.84 ab | 1.71 ab | * | * | ns | ns | ns | *** | ns |
| F | 2.14 ab | 2.04 ab | 2.04 ab | 1.64 ab | 1.36 ab | 1.28 b | 2.27 a | 2.11 ab | 2.00 ab | ||||||||
| OGTT (T180) (g/L) | M | 1.20 | 1.73 | 1.49 | 1.11 | 1.00 | 0.98 | 1.28 | 1.07 | 0.96 | ns | ns | ** | ns | ns | ns | ns |
| F | 1.67 | 1.65 | 1.59 | 1.66 | 1.61 | 1.20 | 1.62 | 1.49 | 0.38 | ||||||||
| Parameters 1 | TO | OB | OL | Effects 3 | |||||||||||||
|---|---|---|---|---|---|---|---|---|---|---|---|---|---|---|---|---|---|
| Sex | 0 | 15 | 30 | 0 | 15 | 30 | 0 | 15 | 30 | Group 2 | Time | Sex | S × T | G × T | S × G | G × T × S | |
| Length (cm) | M | 44.25 | 44.0 | 44.0 | 44.0 | 44.33 | 44.33 | 46.0 | 46.0 | 46.0 | ns | ns | * | ns | ns | *** | ns |
| F | 47.67 | 47.67 | 47.67 | 46.33 | 46.33 | 46.33 | 44.0 | 44.0 | 44.0 | ||||||||
| Height (cm) | M | 25.75 | 25.67 | 25.67 | 25.50 | 25.67 | 25.67 | 24.67 | 24.67 | 24.67 | ns | ns | ns | ns | ns | ns | ns |
| F | 25.67 | 25.67 | 25.67 | 25.67 | 25.67 | 25.67 | 25.67 | 25.67 | 25.67 | ||||||||
| Abdominal Circumference (AB) (cm) | M | 47.00 | 46.33 | 46.33 | 47.0 | 46.67 | 45.33 | 46.67 | 46.33 | 46.0 | ns | * | ns | ns | ns | ns | ns |
| F | 47.33 | 46.67 | 46.67 | 47.33 | 46.33 | 45.0 | 47.00 | 46.33 | 45.33 | ||||||||
| AB/Length ratio | M | 1.06 | 1.05 | 1.05 | 1.07 | 1.06 | 1.02 | 1.01 | 1.01 | 1.00 | ns | ns | ns | ns | ns | ** | ns |
| F | 1.00 | 0.98 | 0.98 | 1.02 | 1.00 | 0.97 | 1.07 | 1.05 | 1.03 | ||||||||
| BMI 1 (kg/m2) | M | 31.63 | 31.43 | 31.22 | 34.34 | 31.58 | 30.13 | 31.22 | 29.50 | 28.05 | ns | * | ** | ns | ns | * | ns |
| F | 34.13 | 33.45 | 33.38 | 33.33 | 31.50 | 30.15 | 35.84 | 34.40 | 34.05 | ||||||||
Publisher’s Note: MDPI stays neutral with regard to jurisdictional claims in published maps and institutional affiliations. |
© 2021 by the authors. Licensee MDPI, Basel, Switzerland. This article is an open access article distributed under the terms and conditions of the Creative Commons Attribution (CC BY) license (http://creativecommons.org/licenses/by/4.0/).
Share and Cite
Bouaziz, A.; Dib, A.L.; Lakhdara, N.; Kadja, L.; Espigares, E.; Moreno, E.; Bouaziz, O.; Gagaoua, M. Study of Probiotic Effects of Bifidobacterium animalis subsp. lactis BB-12 and Lactobacillus plantarum 299v Strains on Biochemical and Morphometric Parameters of Rabbits after Obesity Induction. Biology 2021, 10, 131. https://doi.org/10.3390/biology10020131
Bouaziz A, Dib AL, Lakhdara N, Kadja L, Espigares E, Moreno E, Bouaziz O, Gagaoua M. Study of Probiotic Effects of Bifidobacterium animalis subsp. lactis BB-12 and Lactobacillus plantarum 299v Strains on Biochemical and Morphometric Parameters of Rabbits after Obesity Induction. Biology. 2021; 10(2):131. https://doi.org/10.3390/biology10020131
Chicago/Turabian StyleBouaziz, Assia, Amira Leila Dib, Nedjoua Lakhdara, Louiza Kadja, Elena Espigares, Elena Moreno, Omar Bouaziz, and Mohammed Gagaoua. 2021. "Study of Probiotic Effects of Bifidobacterium animalis subsp. lactis BB-12 and Lactobacillus plantarum 299v Strains on Biochemical and Morphometric Parameters of Rabbits after Obesity Induction" Biology 10, no. 2: 131. https://doi.org/10.3390/biology10020131