
Brains in Metamorphosis: Temporal Transcriptome Dynamics in Hatchery-Reared Flatfishes

 , and
, and
Abstract
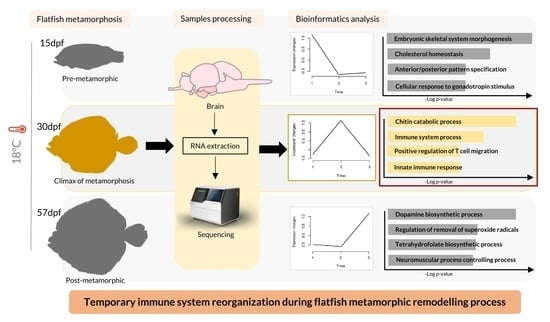
:Simple Summary
Abstract
1. Introduction
2. Materials and Methods
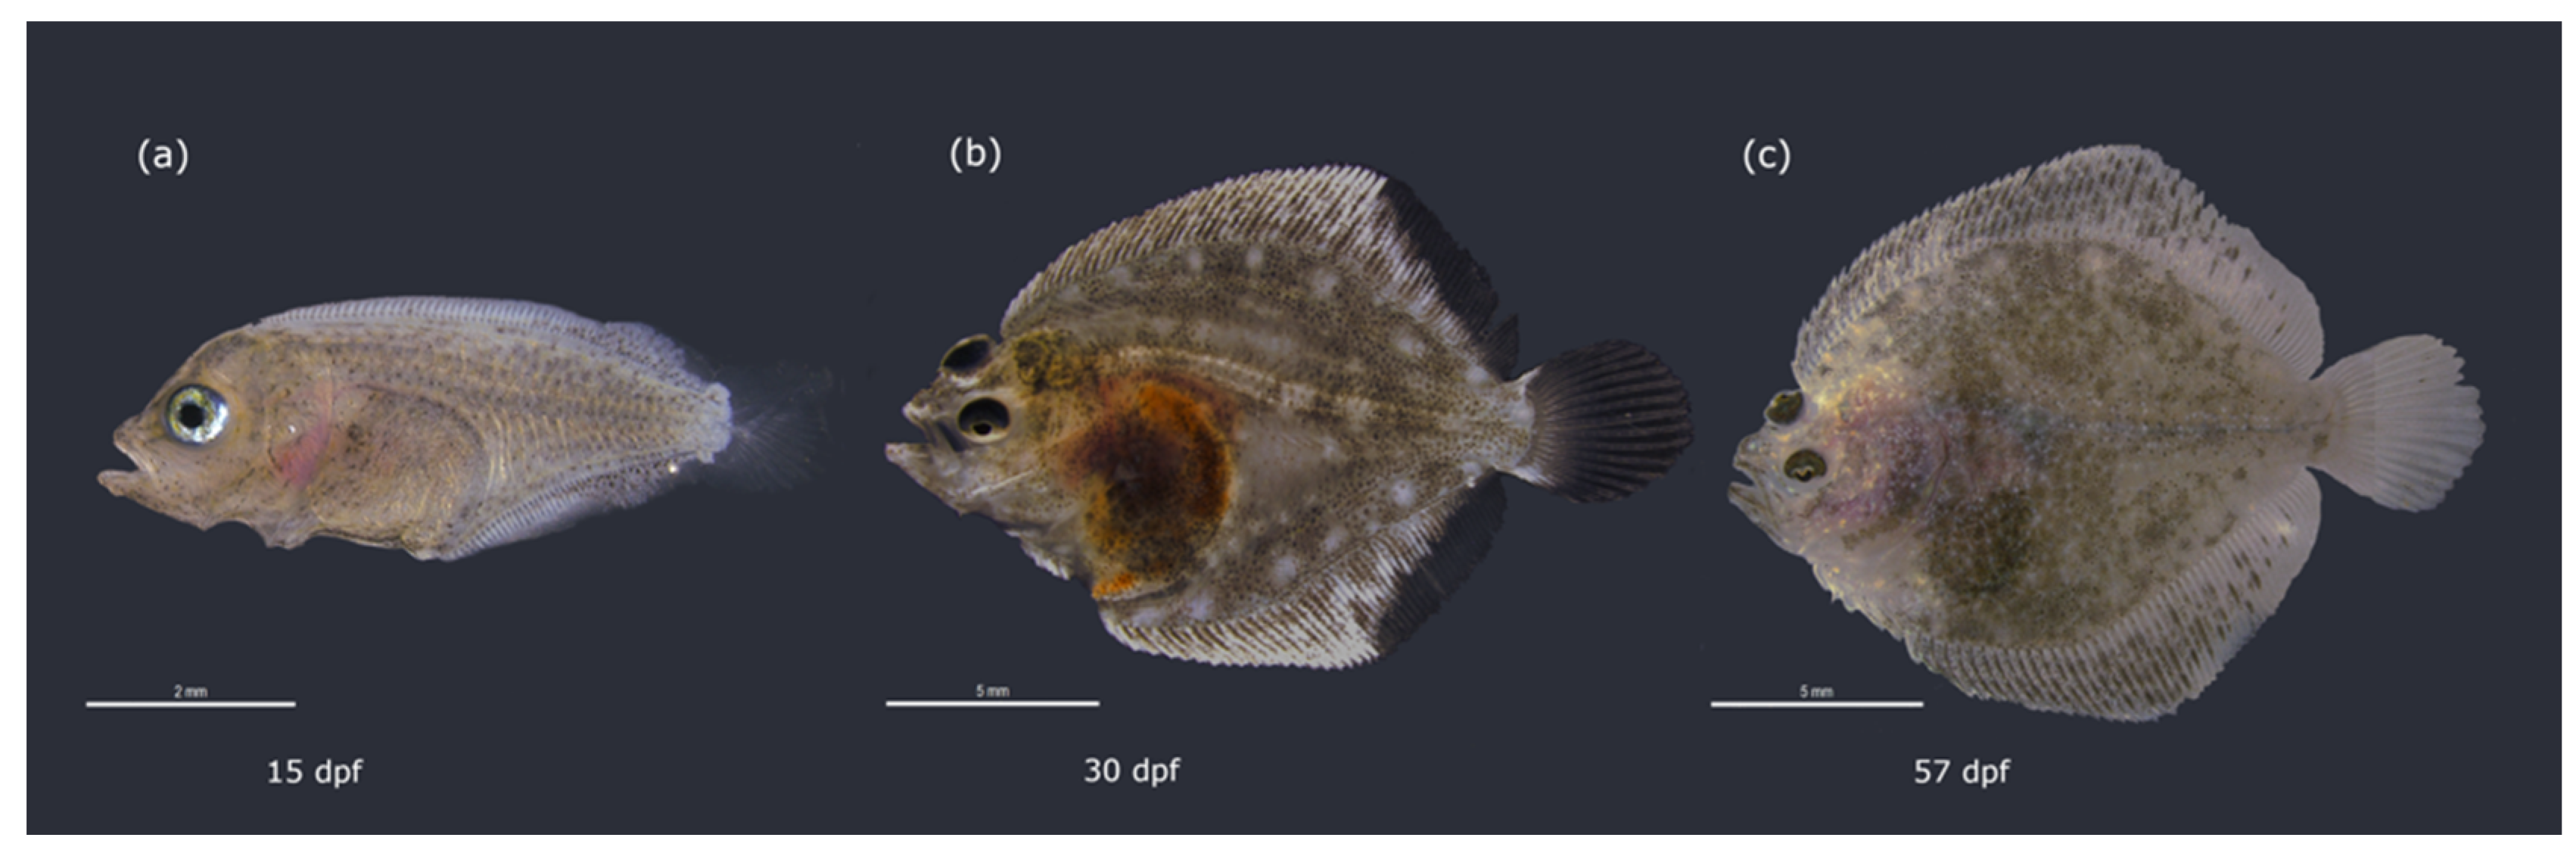
2.1. Fish Collection and Sampling
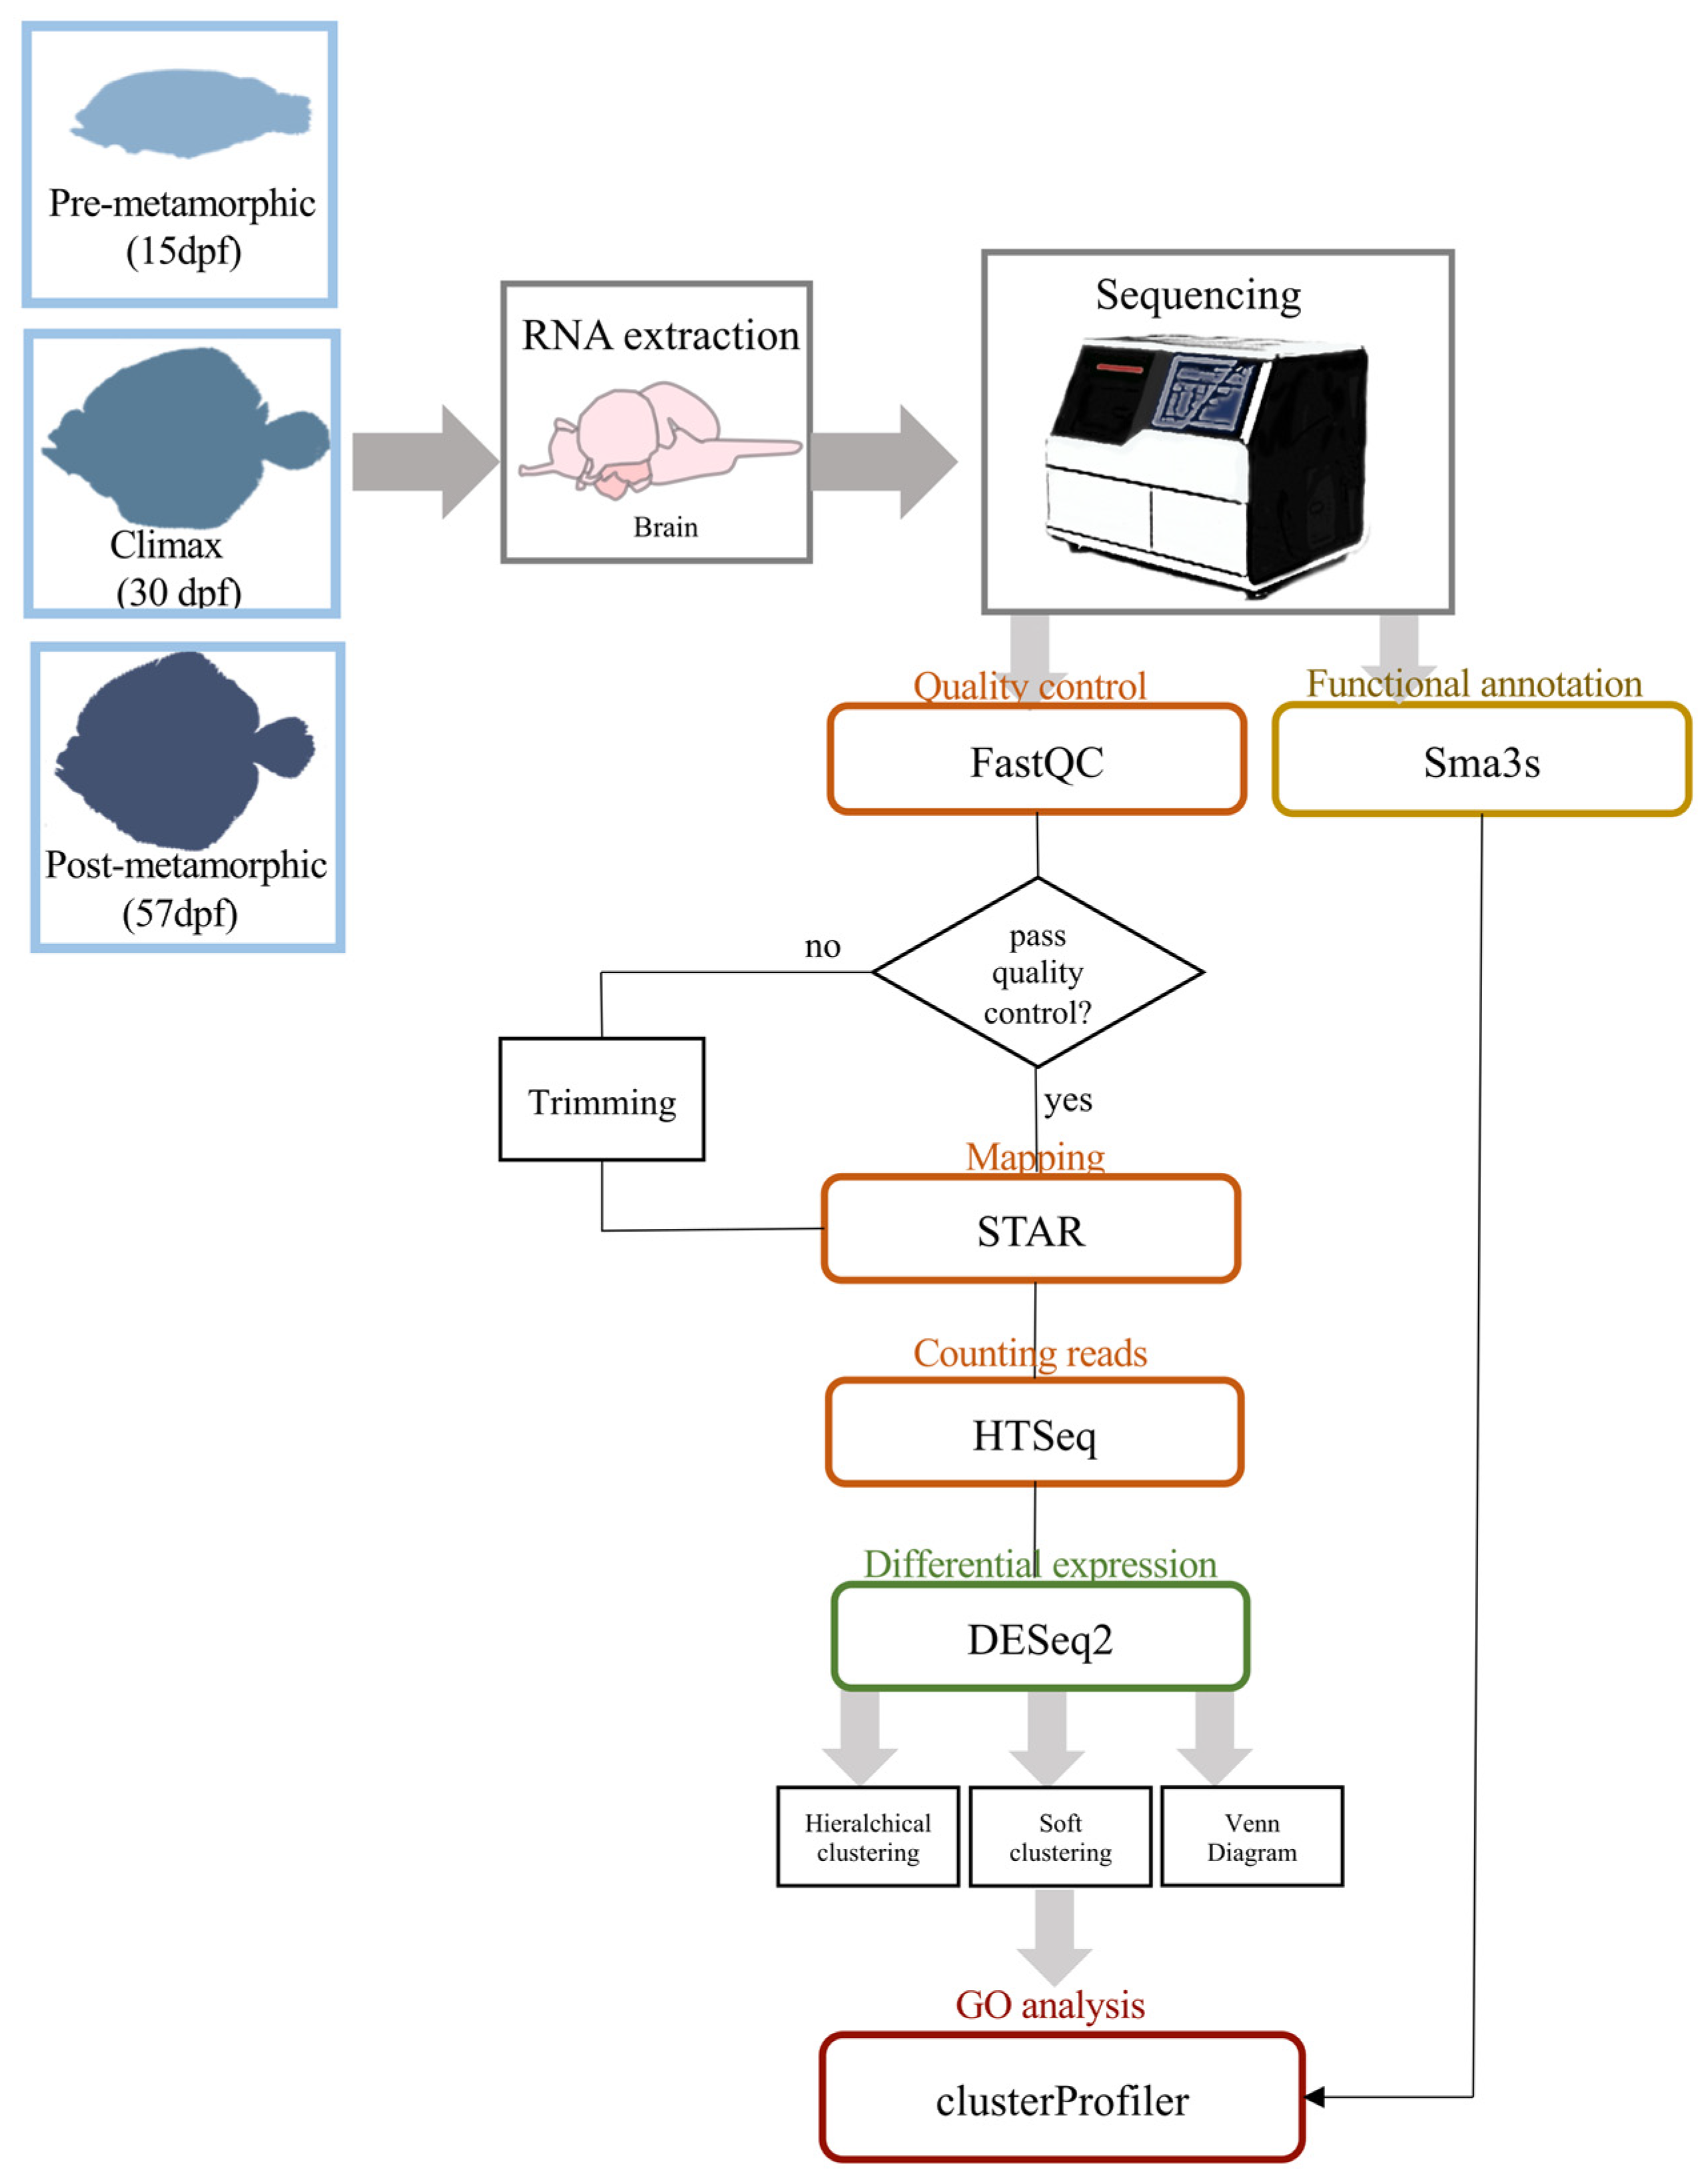
2.2. RNA Isolation and Sequencing
2.3. Transcriptome Analysis and Annotation
2.4. Differential Expression Analysis, Clustering and GO Enrichment
2.5. Quantitative Real-Time PCR (qRT-PCR)
3. Results
3.1. Transcriptome Assembly and Annotation
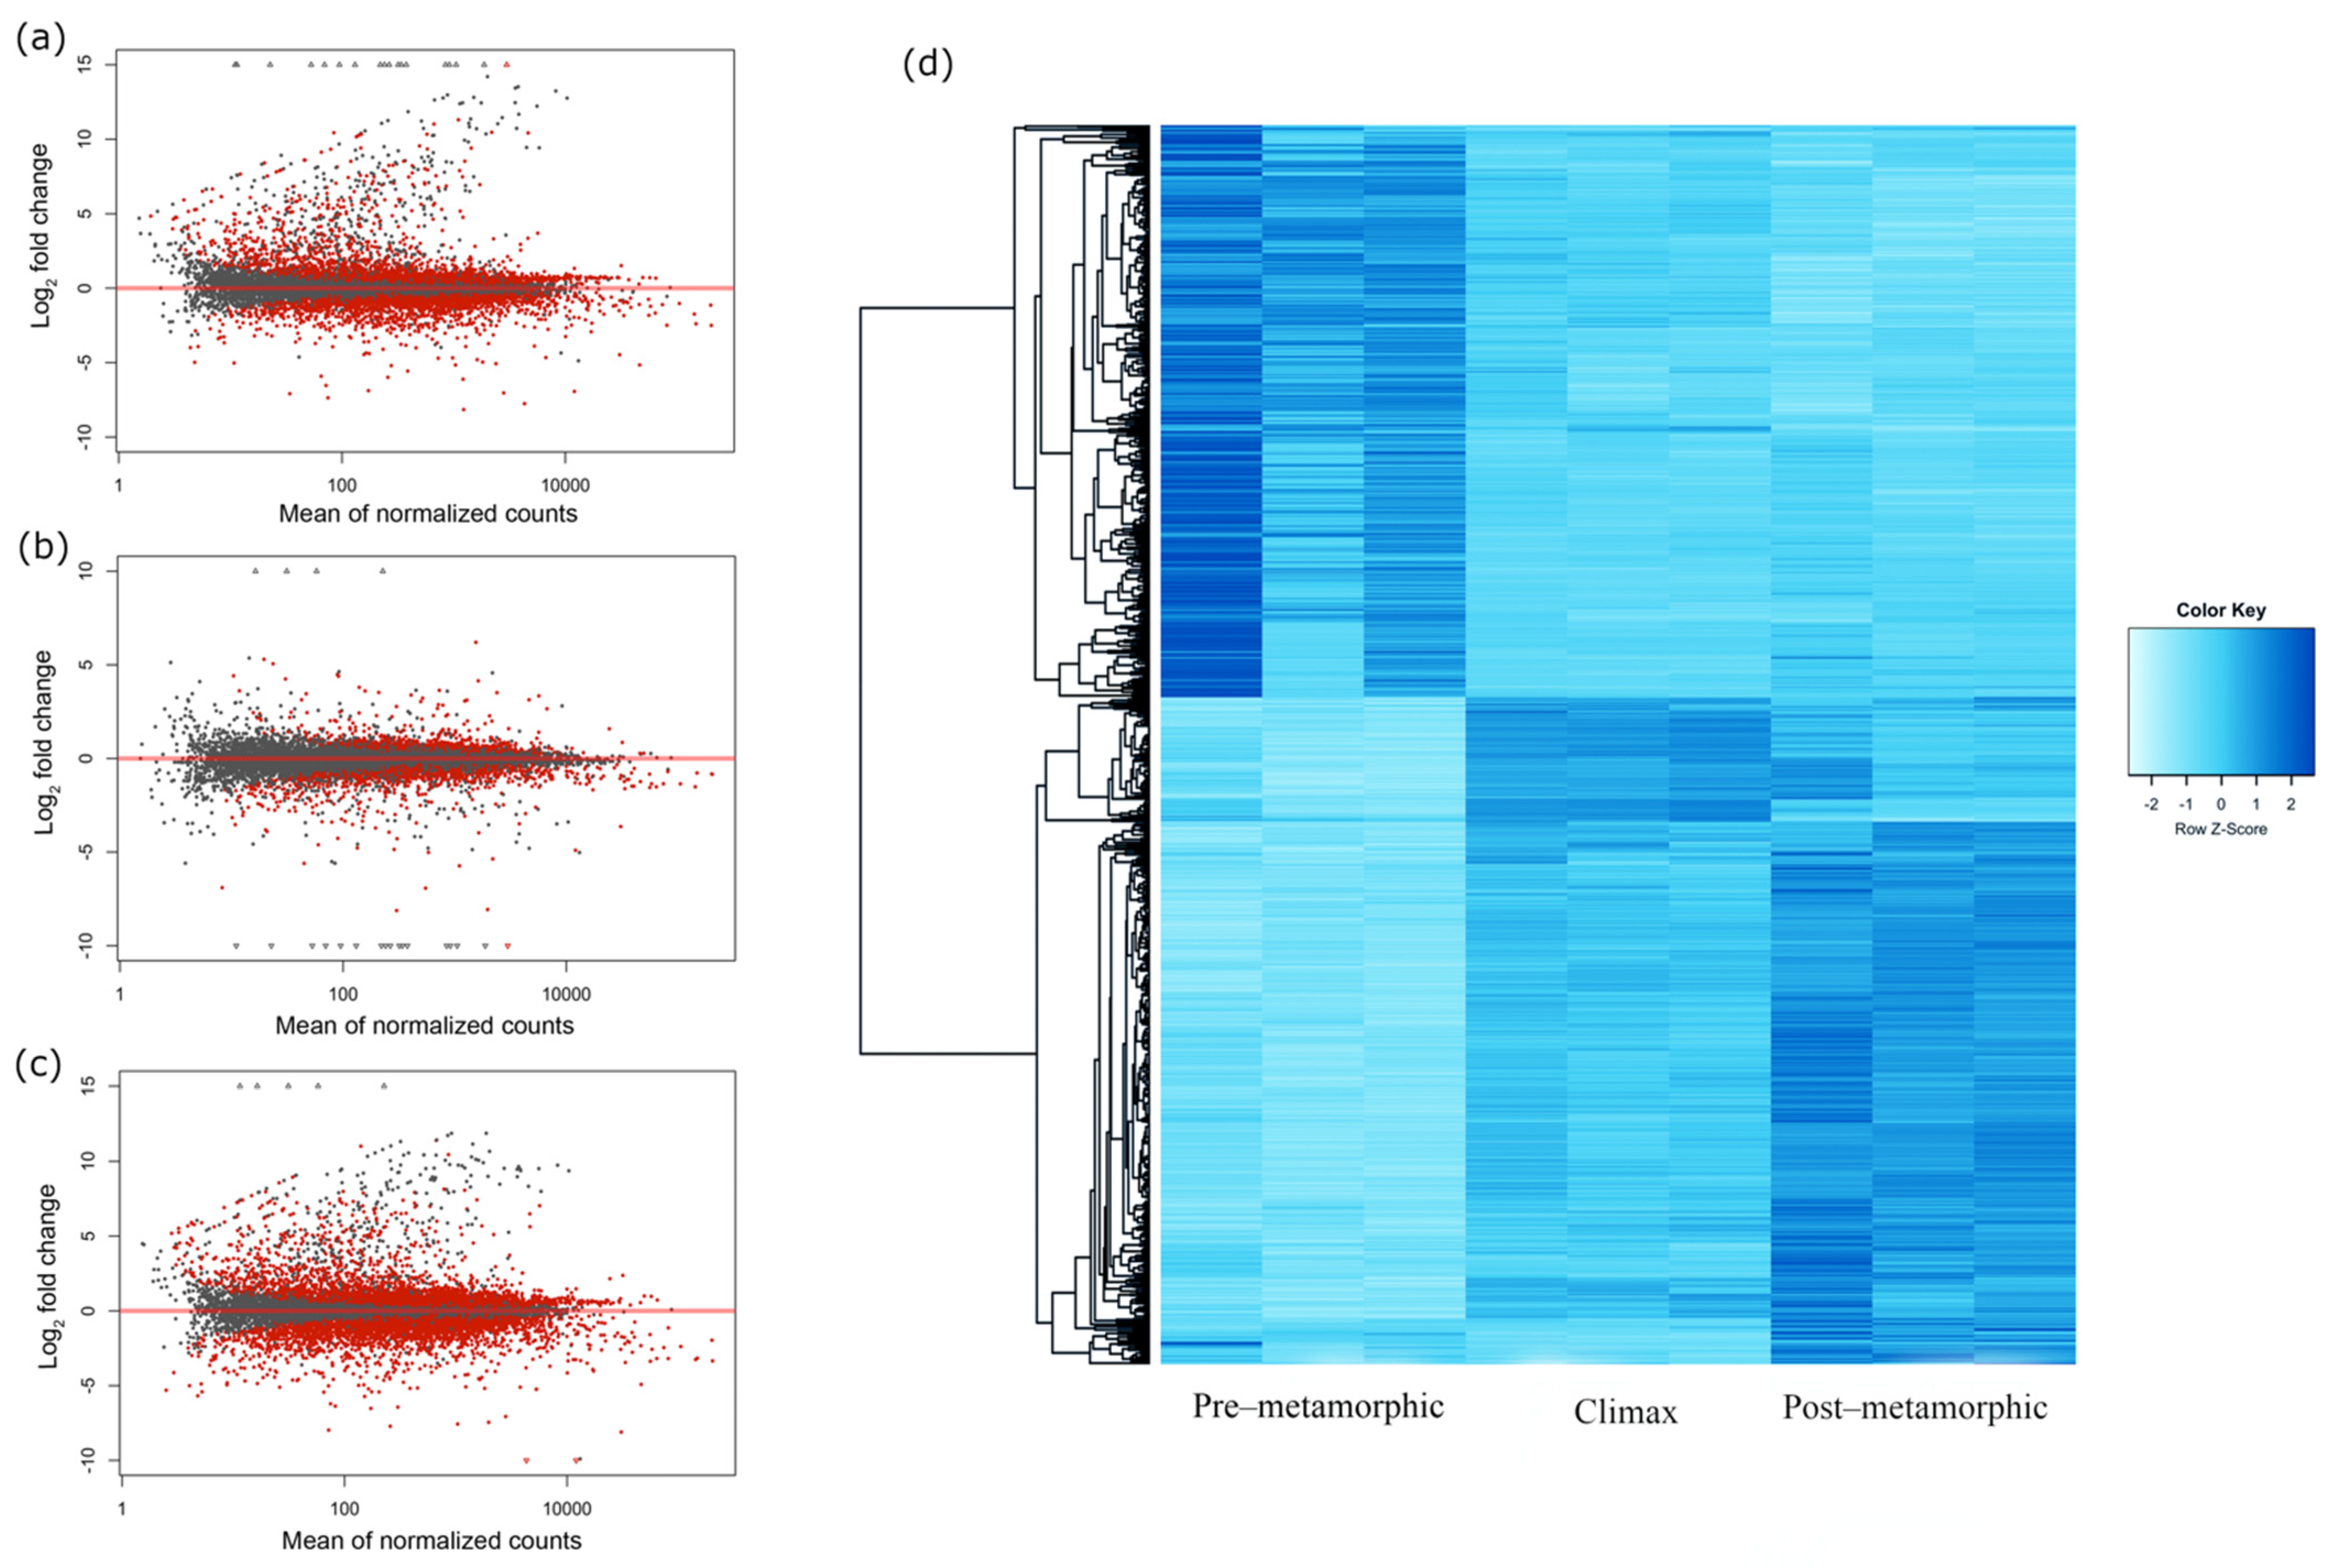
3.2. Gene Expression Dynamics in Metamorphosing Turbot Brains
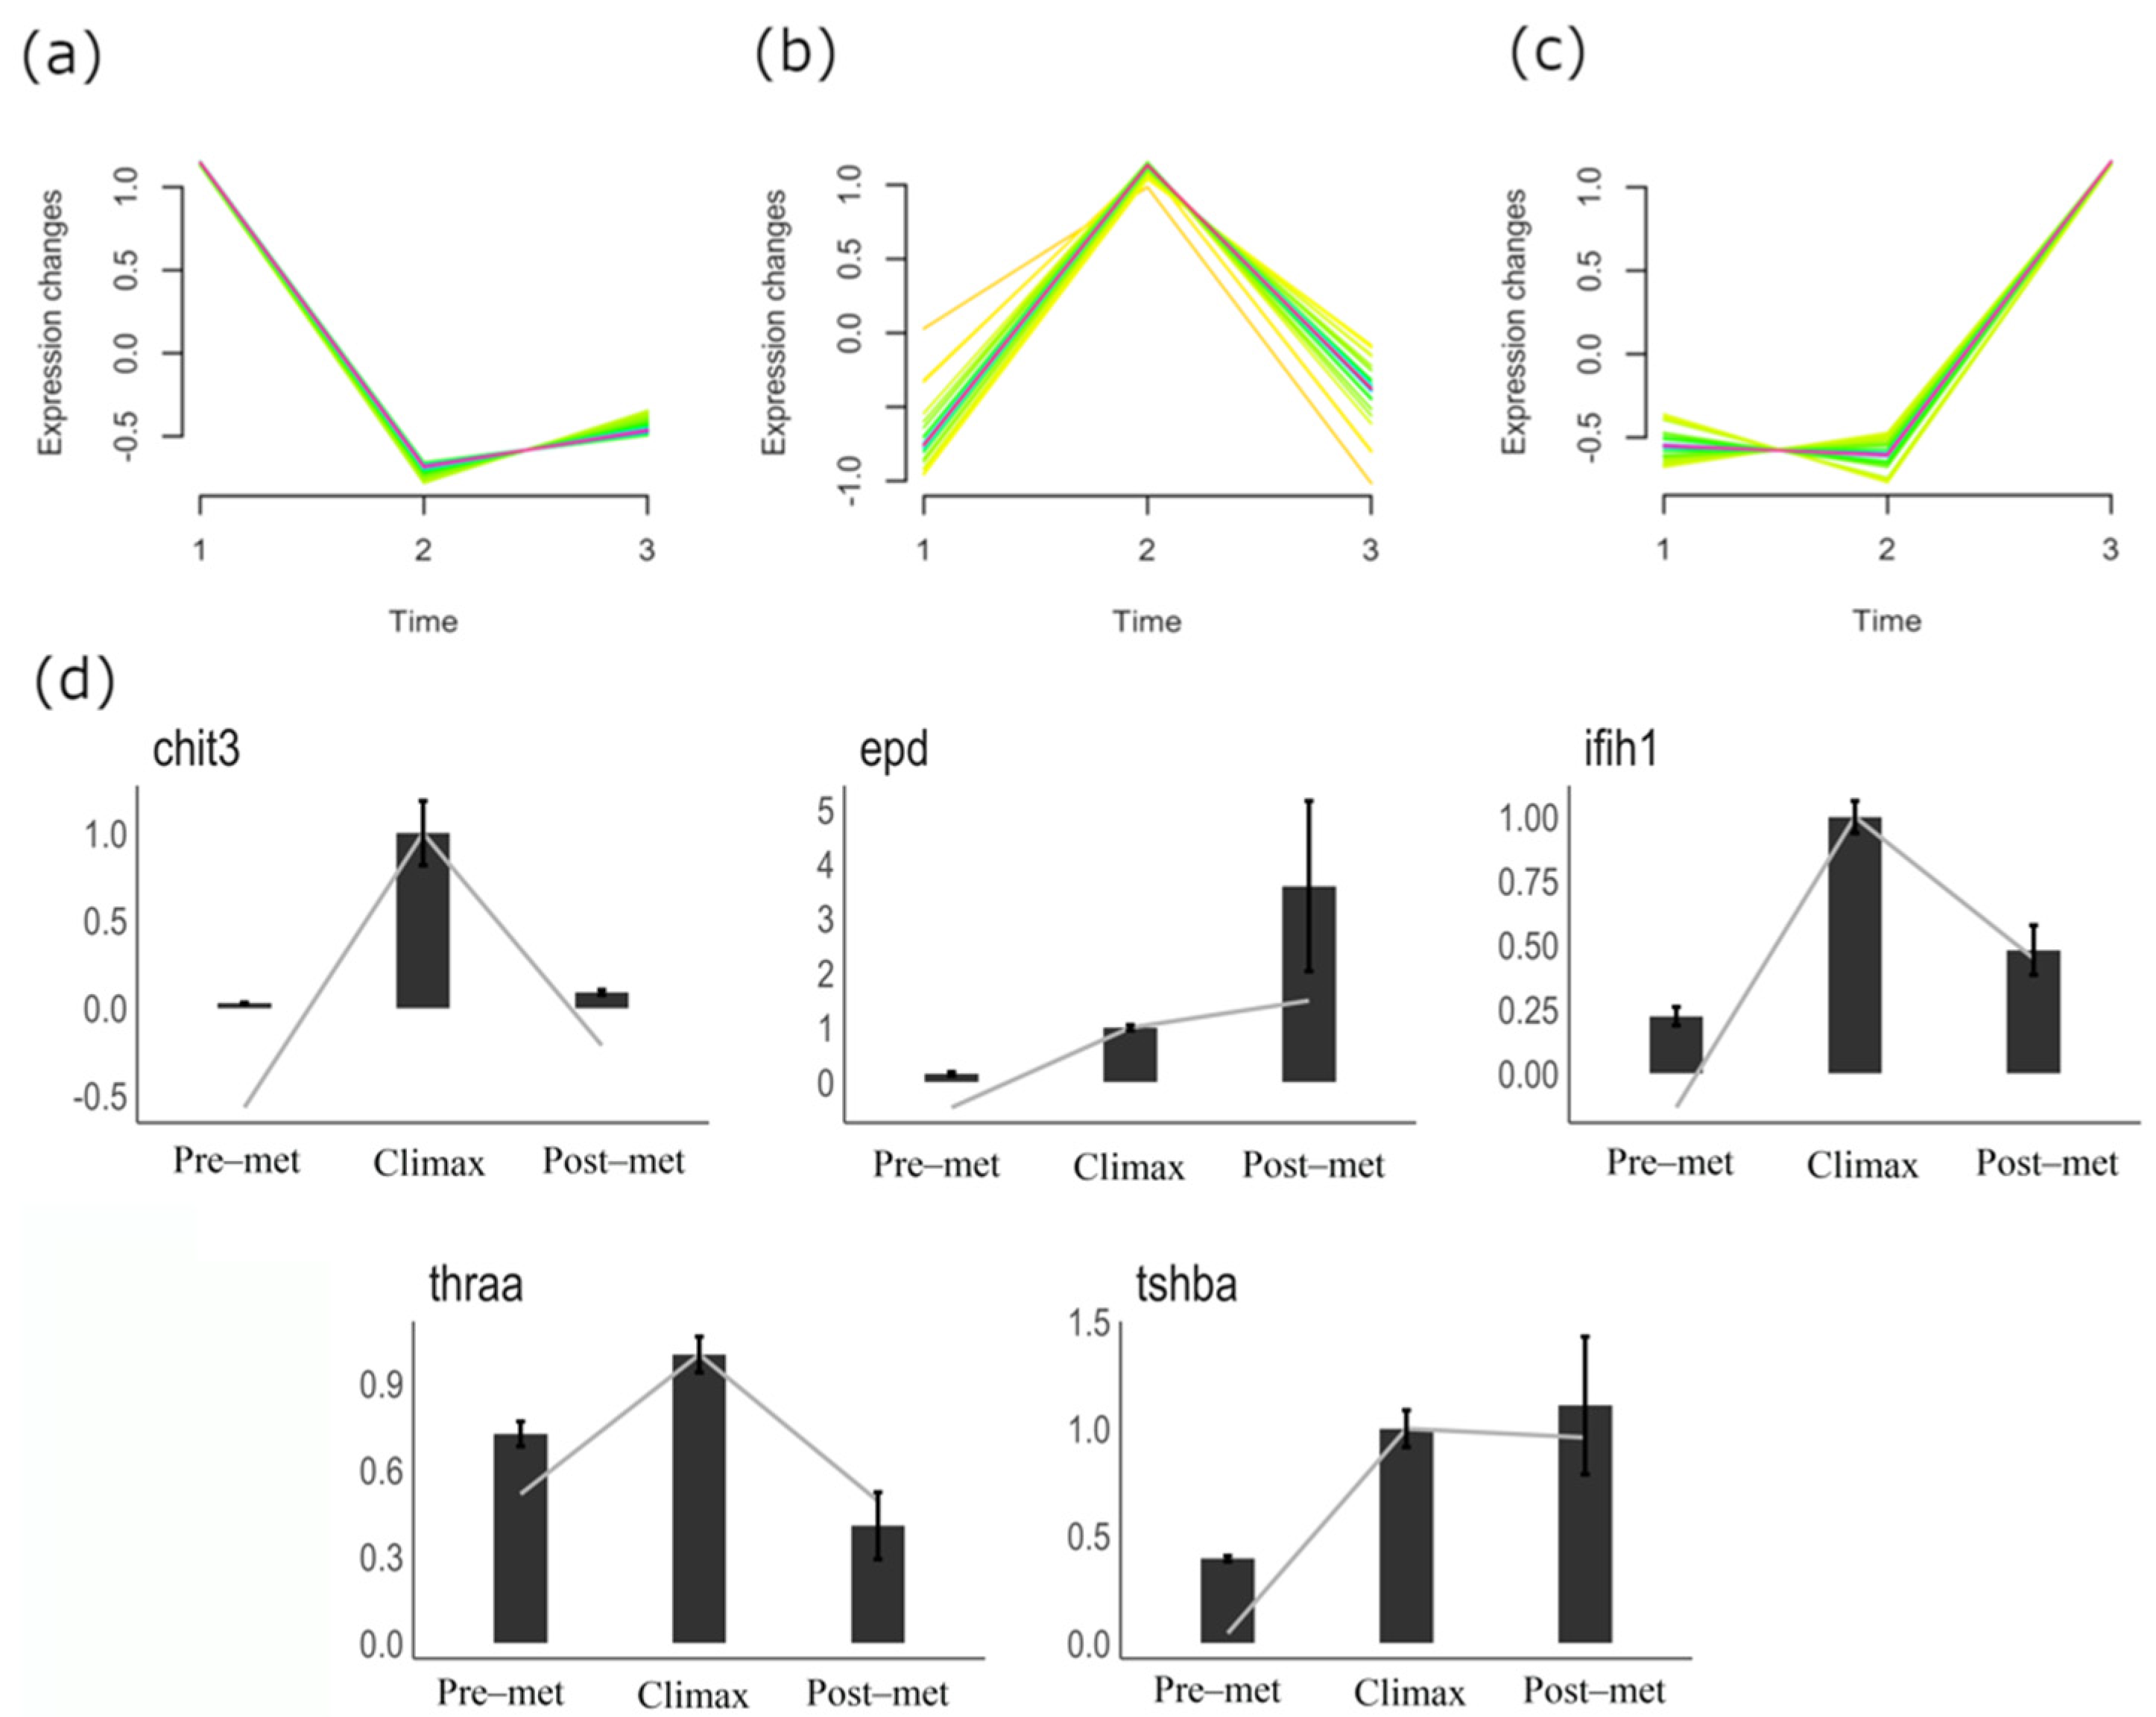
3.3. qPCR Validation of Gene Expression Patterns
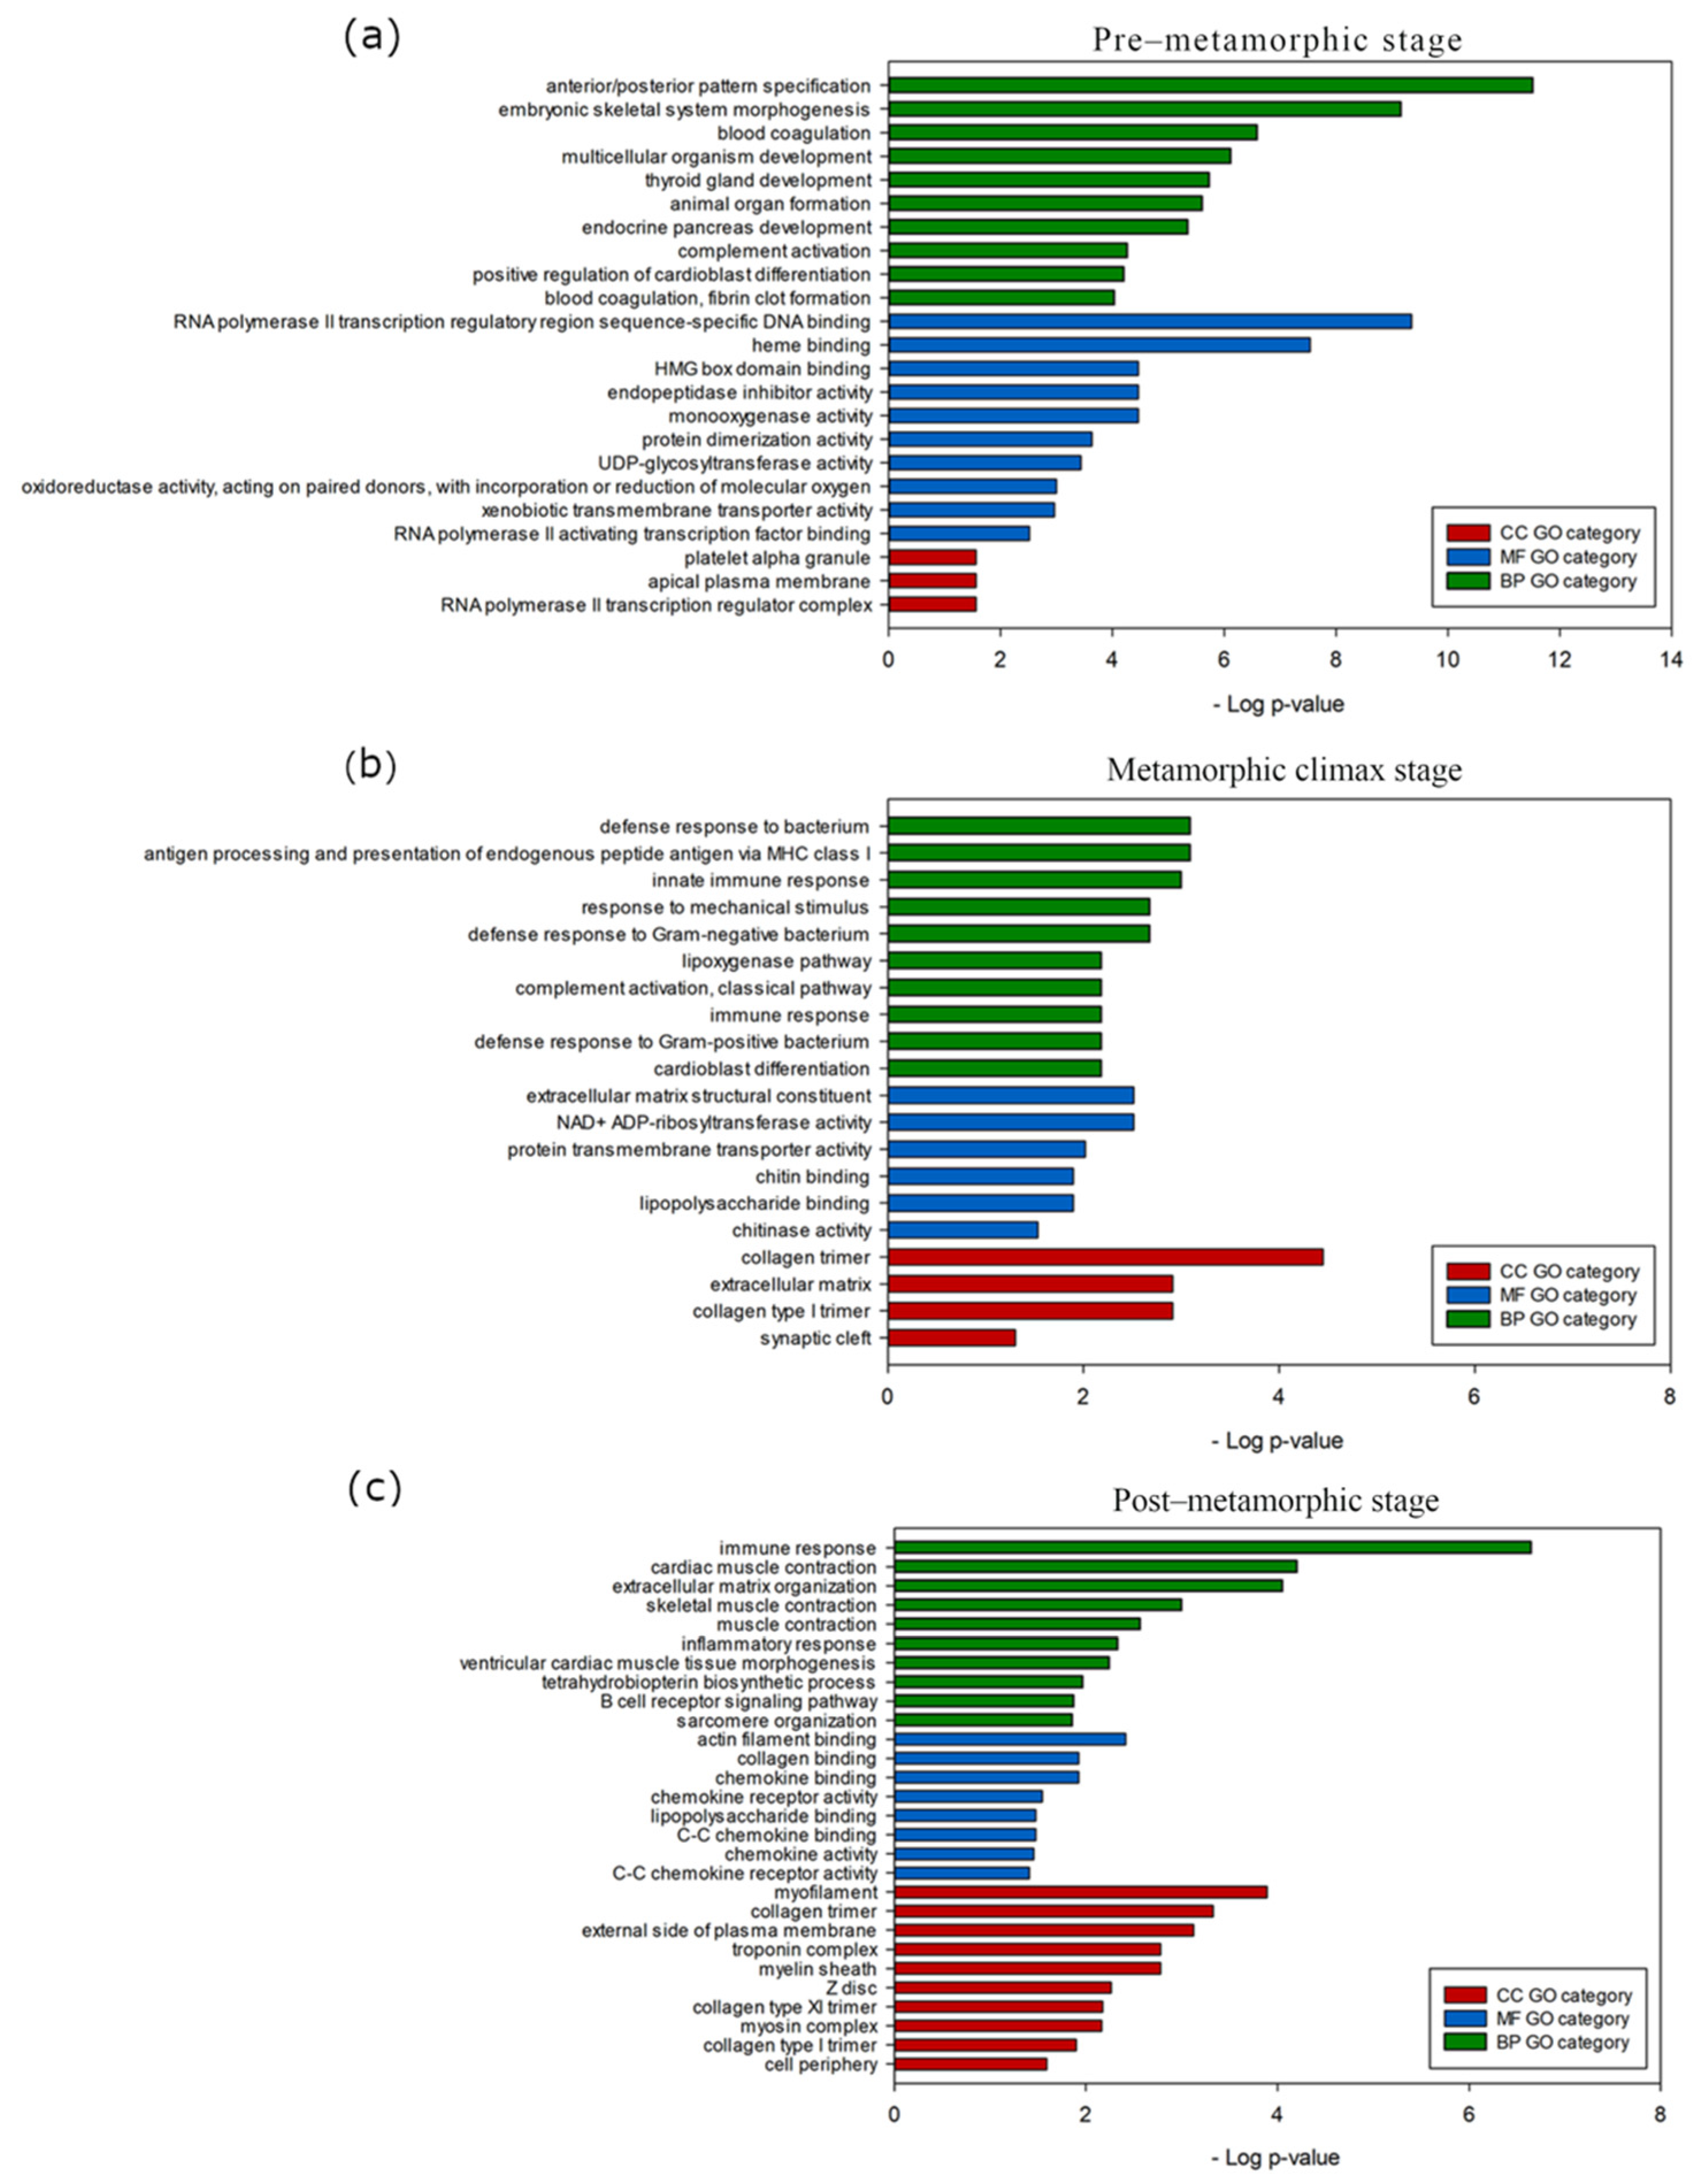
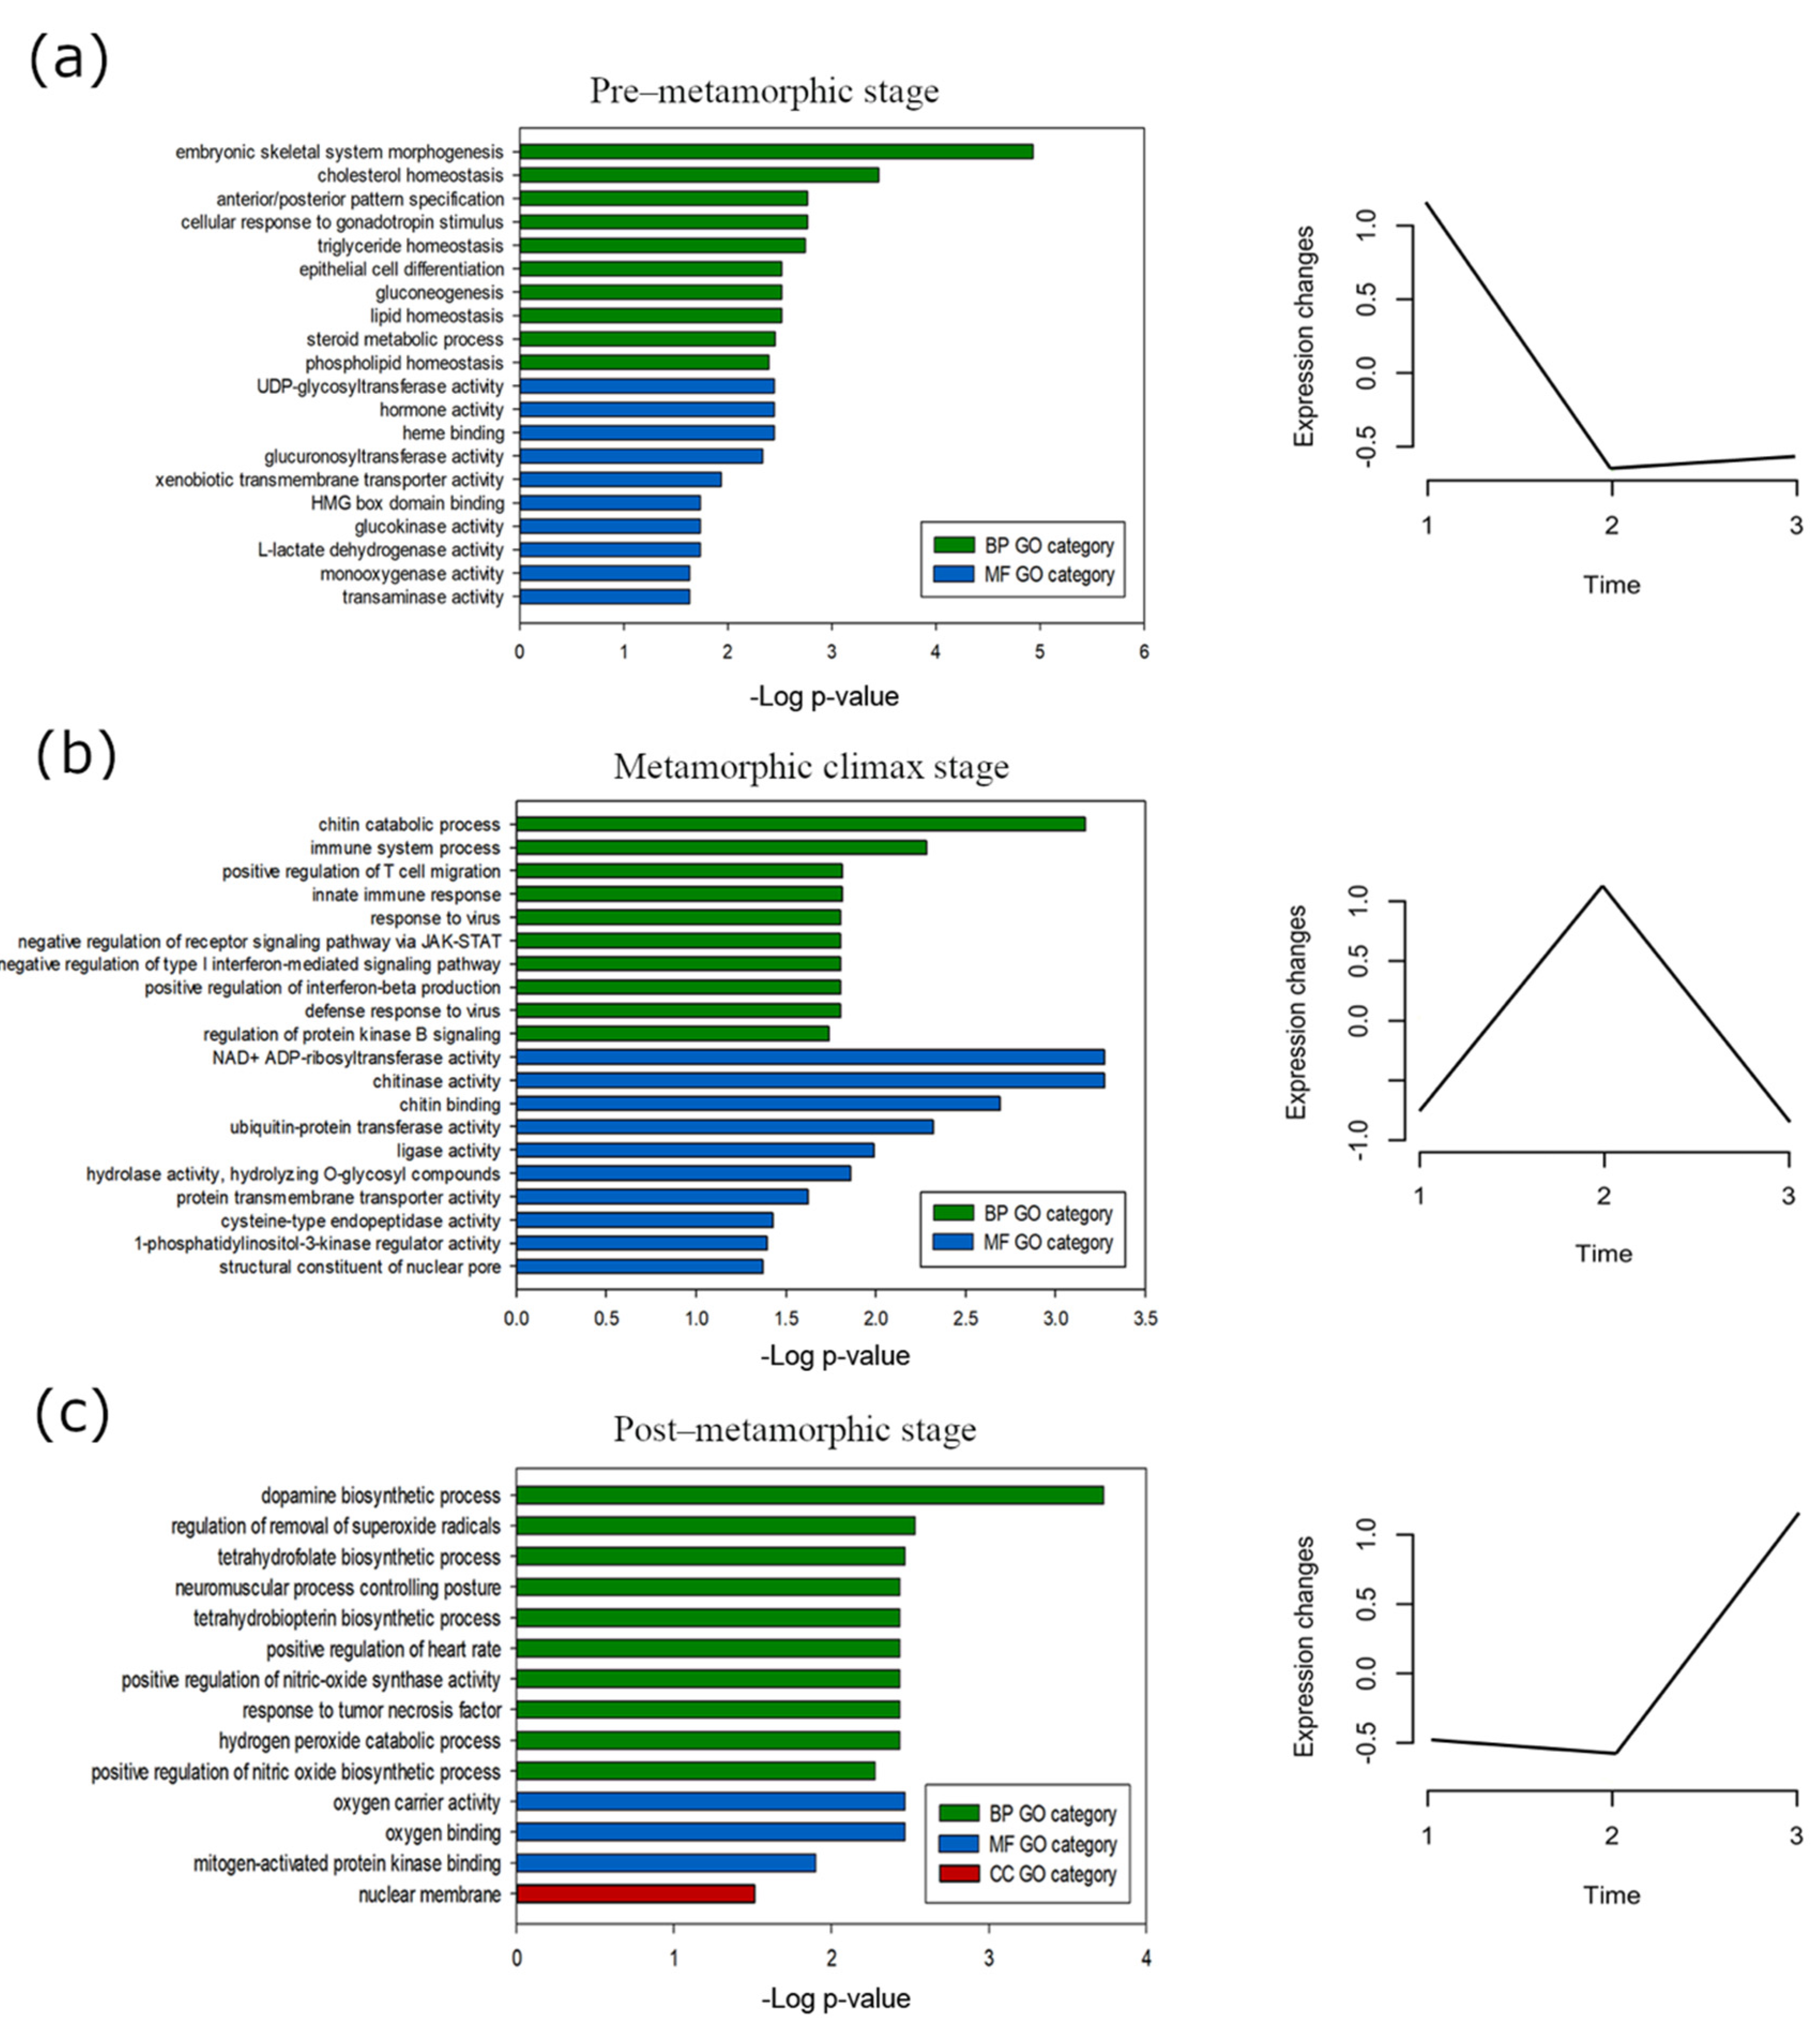
3.4. Stage-Specific Gene Expression and GO Enrichment Analysis
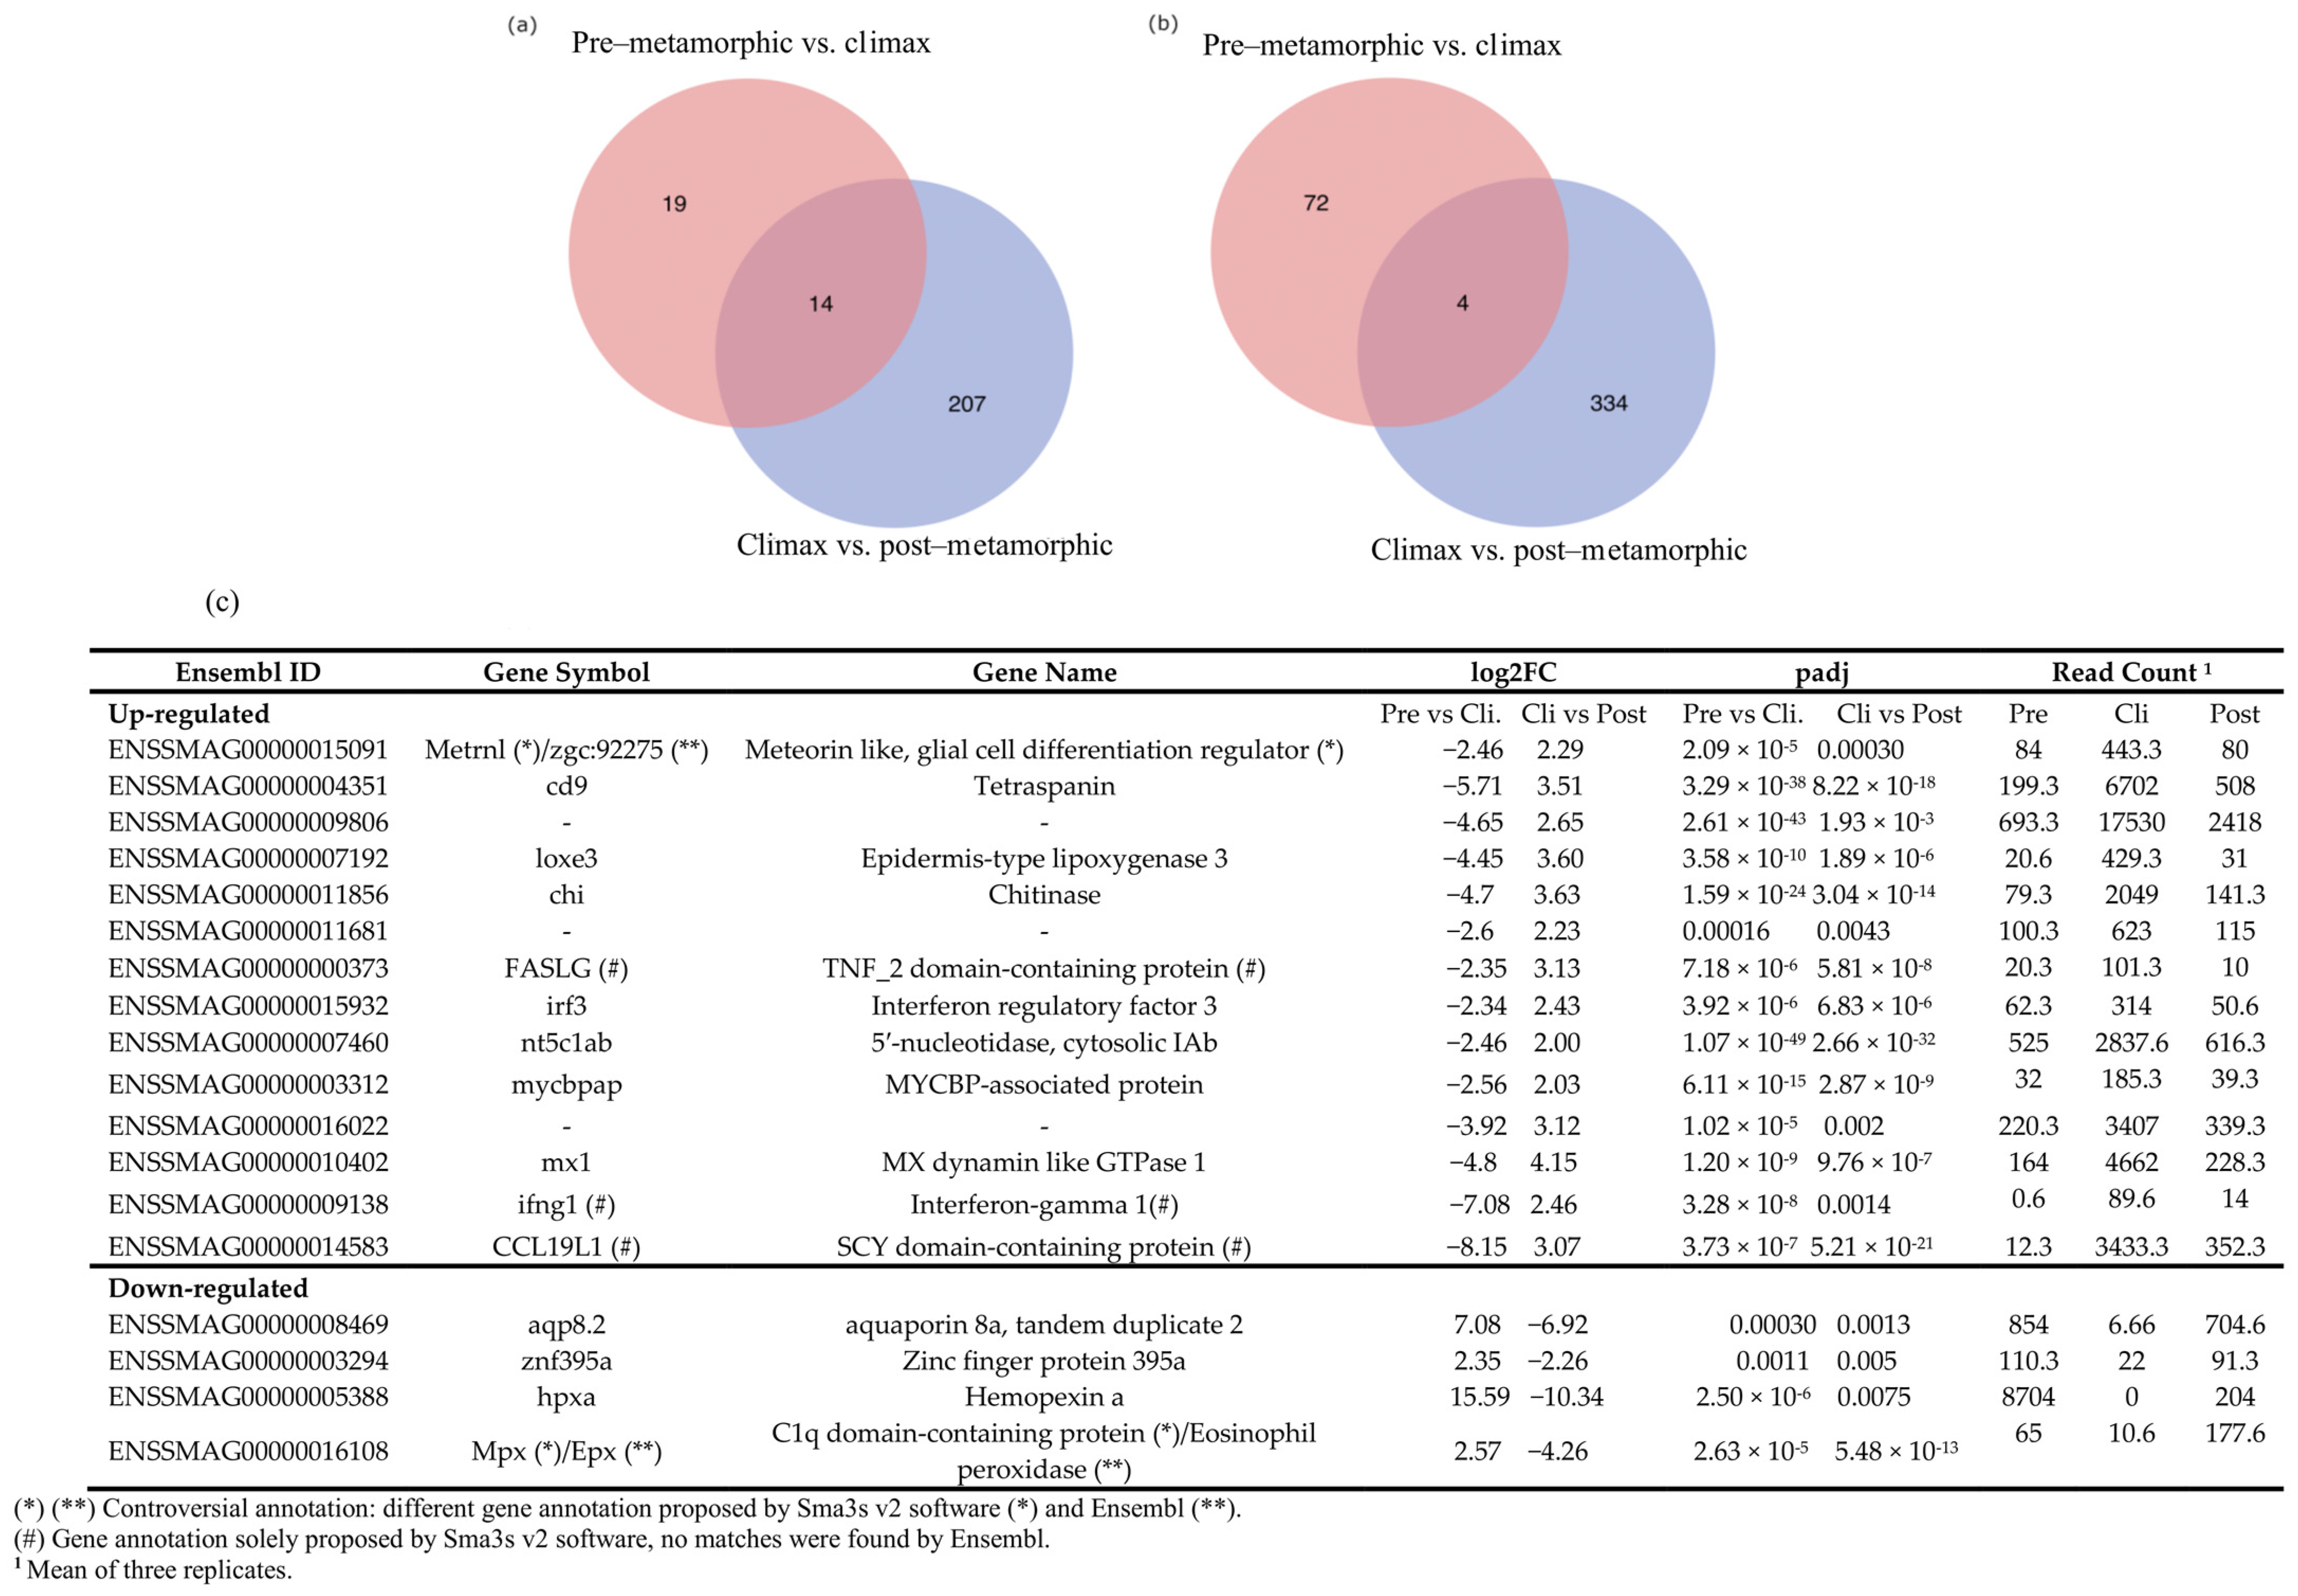
3.5. Snapshot of Up- and Down-Regulated Gene Expression at the Metamorphic Climax
4. Discussion
5. Conclusions
Supplementary Materials
Author Contributions
Funding
Institutional Review Board Statement
Data Availability Statement
Acknowledgments
Conflicts of Interest
References
- Bishop, C.D.; Erezyilmaz, D.F.; Flatt, T.; Georgiou, C.D.; Hadfield, M.G.; Heyland, A.; Hodin, J.; Jacobs, M.W.; Maslakova, S.A.; Pires, A.; et al. What is metamorphosis? Integr. Comp. Biol. 2006, 46, 655–661. [Google Scholar] [CrossRef]
- Ten Brink, H.; de Roos, A.M.; Dieckmann, U. The evolutionary ecology of metamorphosis. Am. Nat. 2019, 193, E116–E131. [Google Scholar] [CrossRef] [Green Version]
- Nielsen, C. The origin of metamorphosis. Evol. Dev. 2000, 2, 127–129. [Google Scholar] [CrossRef] [PubMed]
- Rolff, J.; Johnston, P.R.; Reynolds, S. Complete metamorphosis of insects. Philos. Trans. R. Soc. B Biol. Sci. 2019, 374. [Google Scholar] [CrossRef] [PubMed]
- Truman, J.W. The Evolution of Insect Metamorphosis. Curr. Biol. 2019, 29, R1252–R1268. [Google Scholar] [CrossRef]
- Fritzsch, B. The evolution of metamorphosis in amphibians. J. Neurobiol. 1990, 21, 1011–1021. [Google Scholar] [CrossRef]
- Laudet, V. The Origins and Evolution of Vertebrate Metamorphosis. Curr. Biol. 2011, 21, R726–R737. [Google Scholar] [CrossRef] [Green Version]
- Campinho, M.A. Teleost metamorphosis: The role of thyroid hormone. Front. Endocrinol. 2019, 10, 1–12. [Google Scholar] [CrossRef]
- McMenamin, S.K.; Parichy, D.M. Chapter Five–Metamorphosis in Teleosts. Curr. Top. Dev. Biol. 2013, 103, 127–165. [Google Scholar] [CrossRef] [Green Version]
- Schreiber, A.M. Chapter Six—Flatfish: An Asymmetric Perspective on Metamorphosis. Curr. Top. Dev. Biol. 2013, 103, 167–194. [Google Scholar] [CrossRef] [PubMed]
- Sun, M.; Wei, F.; Liu, H.; Hu, J.; Chen, X.; Gong, X.; Tian, Y.; Chen, S.; Bao, B. Distortion of frontal bones results from cell apoptosis by the mechanical force from the up-migrating eye during metamorphosis in Paralichthys olivaceus. Mech. Dev. 2015, 136, 87–98. [Google Scholar] [CrossRef]
- Brewster, B. Eye migration and cranial development during flatfish metamorphosis: A reappraisal (Teleostei: Pleuronectiformes). J. Fish Biol. 1987, 31, 805–833. [Google Scholar] [CrossRef]
- Sæle, Ø.; Smáradóttir, H.; Pittman, K. Twisted story of eye migration in flatfish. J. Morphol. 2006, 267, 730–738. [Google Scholar] [CrossRef] [PubMed]
- Chen, Q.; Sato, K.; Yokoi, H.; Suzuki, T. Developmental regulatory system of ocular-side-specific asymmetric pigmentation in flounder: Critical role of retinoic acid signaling. J. Exp. Zool. Part B Mol. Dev. Evol. 2020, 334, 156–167. [Google Scholar] [CrossRef]
- Geffen, A.J.; van der Veer, H.W.; Nash, R.D.M. The cost of metamorphosis in flatfishes. J. Sea Res. 2007, 58, 35–45. [Google Scholar] [CrossRef]
- Power, D.M.; Einarsdóttir, I.E.; Pittman, K.; Sweeney, G.E.; Hildahl, J.; Campinho, M.A.; Silva, N.; Sæle, Ø.; Galay-Burgos, M.; Smáradóttir, F.; et al. The molecular and endocrine basis of flatfish metamorphosis. Rev. Fish. Sci. 2008, 16, 93–109. [Google Scholar] [CrossRef]
- Tata, J.R. Amphibian metamorphosis as a model for studying the developmental actions of thyroid hormone. Cell Res. 1998, 8, 259–272. [Google Scholar] [CrossRef] [PubMed]
- De Jesus, E.G.; Hirano, T.; Inui, Y. Flounder metamorphosis: Its regulation by various hormones. Fish Physiol. Biochem. 1993, 11, 323–328. [Google Scholar] [CrossRef] [PubMed]
- Gomes, A.S.; Alves, R.N.; Rønnestad, I.; Power, D.M. Orchestrating change: The thyroid hormones and GI-tract development in flatfish metamorphosis. Gen. Comp. Endocrinol. 2015, 220, 2–12. [Google Scholar] [CrossRef] [PubMed]
- Einarsdóttir, I.E.; Silva, N.; Power, D.M.; Smáradóttir, H.; Björnsson, B.T. Thyroid and pituitary gland development from hatching through metamorphosis of a teleost flatfish, the Atlantic halibut. Anat. Embryol. 2006, 211, 47–60. [Google Scholar] [CrossRef] [Green Version]
- Deal, C.K.; Volkoff, H. The Role of the Thyroid Axis in Fish. Front. Endocrinol. 2020, 11, 1–25. [Google Scholar] [CrossRef] [PubMed]
- Ortiga-Carvalho, T.M.; Chiamolera, M.I.; Pazos-Moura, C.C.; Wondisford, F.E. Hypothalamus-pituitary-thyroid axis. Compr. Physiol. 2016, 6, 1387–1428. [Google Scholar] [CrossRef]
- Graf, W.; Baker, R. Neuronal adaptation accompanying metamorphosis in the flatfish. J. Neurobiol. 1990, 21, 1136–1152. [Google Scholar] [CrossRef]
- Campinho, M.A.; Silva, N.; Martins, G.G.; Anjos, L.; Florindo, C.; Roman-Padilla, J.; Garcia-Cegarra, A.; Louro, B.; Mnachado, M.; Power, D.M. A thyroid hormone regulated asymmetric responsive centre is correlated with eye migration during flatfish metamorphosis. Sci. Rep. 2018, 8, 12267. [Google Scholar] [CrossRef] [Green Version]
- Briñón, J.G.; Médina, M.; Arévalo, R.; Alonso, J.R.; Lara, J.M.; Aijón, J. Volumetric Analysis of the Telencephalon and Tectum During Metamorphosis in a Flatfish, the Turbot Scophthalmus maximus. Brain. Behav. Evol. 1993, 41, 1–5. [Google Scholar] [CrossRef] [PubMed]
- Al-Maghazachi, S.J.; Gibson, R. The developmental stages of larval turbot, Scophthalmus maximus (L.). J. Exp. Mar. Bio. Ecol. 1984, 82, 35–51. [Google Scholar] [CrossRef]
- Suarez-Bregua, P.; Pérez-Figueroa, A.; Hernández-Urcera, J.; Morán, P.; Rotllant, J. Temperature-independent genome-wide DNA methylation profile in turbot post-embryonic development. J. Therm. Biol. 2020, 88, 1–7. [Google Scholar] [CrossRef] [PubMed]
- Part II—Methods of Euthanasia. Available online: https://www.avma.org/sites/default/files/2020-01/2020_Euthanasia_Final_1-15-20.pdf (accessed on 27 October 2021).
- Figueras, A.; Robledo, D.; Corvelo, A.; Hermida, M.; Pereiro, P.; Rubiolo, J.A.; Gomez-Garrido, J.; Carrete, L.; Bello, X.; Gut, M.; et al. Whole genome sequencing of turbot (Scophthalmus maximus; Pleuronectiformes): A fish adapted to demersal life. DNA Res. 2016, 23, 181–192. [Google Scholar] [CrossRef] [Green Version]
- Dobin, A.; Davis, C.A.; Schlesinger, F.; Drenkow, J.; Zaleski, C.; Jha, S.; Batut, P.; Chaisson, M.; Gingeras, T.R. STAR: Ultrafast universal RNA-seq aligner. Bioinformatics 2013, 29, 15–21. [Google Scholar] [CrossRef] [PubMed]
- Anders, S.; Pyl, P.T.; Huber, W. HTSeq-A Python framework to work with high-throughput sequencing data. Bioinformatics 2015, 31, 166–169. [Google Scholar] [CrossRef]
- Muñoz-Mérida, A.; Viguera, E.; Claros, M.G.; Trelles, O.; Pérez-Pulido, A.J. Sma3s: A three-step modular annotator for large sequence datasets. DNA Res. 2014, 21, 341–353. [Google Scholar] [CrossRef] [Green Version]
- Love, M.I.; Huber, W.; Anders, S. Moderated estimation of fold change and dispersion for RNA-seq data with DESeq2. Genome Biol. 2014, 15, 550. [Google Scholar] [CrossRef] [PubMed] [Green Version]
- Benjamini, Y.; Hochberg, Y. Controlling the False Discovery Rate: A Practical and Powerful Approach to Multiple Testing. J. R. Stat. Soc. Ser. B 1995, 57, 289–300. [Google Scholar] [CrossRef]
- Kumar, L.; Futschik, M.E. Mfuzz: A software package for soft clustering of microarray data. Bioinformation 2007, 2, 5–7. [Google Scholar] [CrossRef]
- Yu, G.; Wang, L.G.; Han, Y.; He, Q.Y. ClusterProfiler: An R package for comparing biological themes among gene clusters. Omi. A J. Integr. Biol. 2012, 16, 284–287. [Google Scholar] [CrossRef]
- Pfaffl, M.W. A new mathematical model for relative quantification in real-time RT-PCR. Nucleic Acids Res. 2001, 29, 2002–2007. [Google Scholar] [CrossRef]
- Zoologie, R.C.; De Mazurais, D.; Darias, M.; Cahu, C.L. Transcriptomics for understanding marine fish larval development. Can. J. Zool. 2011, 89, 599–611. [Google Scholar]
- Kavouras, M.; Malandrakis, E.E.; Golomazou, E.; Konstantinidis, I.; Blom, E.; Palstra, A.P.; Anastassiadis, K.; Panagiotaki, P.; Exadactylos, A. Hox gene expression profiles during embryonic development of common sole. Anim. Biol. 2019, 69, 183–198. [Google Scholar] [CrossRef]
- Mallo, M.; Wellik, D.M.; Deschamps, J. Hox genes and regional patterning of the vertebrate body plan. Dev. Biol. 2010, 344, 7–15. [Google Scholar] [CrossRef] [PubMed] [Green Version]
- Cunha, I.; Galante-Oliveira, S.; Rocha, E.; Urbatzka, R.; Castro, L.F.C. Expression of intercellular lipid transport and cholesterol metabolism genes in eggs and early larvae stages of turbot, Scophthalmus maximus, a marine aquaculture species. Mar. Biol. 2015, 162, 1673–1683. [Google Scholar] [CrossRef]
- Cunha, I.; Galante-Oliveira, S.; Rocha, E.; Planas, M.; Urbatzka, R.; Castro, L.F.C. Dynamics of PPARs, fatty acid metabolism genes and lipid classes in eggs and early larvae of a teleost. Comp. Biochem. Physiol. B Biochem. Mol. Biol. 2013, 164, 247–258. [Google Scholar] [CrossRef] [Green Version]
- Larsen, D.A.; Swanson, P.; Dickey, J.T.; Rivier, J.; Dickhoff, W.W. In vitro thyrotropin-releasing activity of corticotropin-releasing hormone-family peptides in coho salmon, Oncorhynchus kisutch. Gen. Comp. Endocrinol. 1998, 109, 276–285. [Google Scholar] [CrossRef]
- Gao, C.; Cai, X.; Zhang, Y.; Su, B.; Song, H.; Wenqi, W.; Li, C. Characterization and expression analysis of chitinase genes (CHIT1, CHIT2 and CHIT3) in turbot (Scophthalmus maximus L.) following bacterial challenge. Fish Shellfish Immunol. 2017, 64, 357–366. [Google Scholar] [CrossRef] [Green Version]
- Teng, Z.; Sun, C.; Liu, S.; Wang, H.; Zhang, S. Functional characterization of chitinase-3 reveals involvement of chitinases in early embryo immunity in zebrafish. Dev. Comp. Immunol. 2014, 46, 489–498. [Google Scholar] [CrossRef]
- Brisse, M.; Ly, H. Comparative structure and function analysis of the RIG-I-like receptors: RIG-I and MDA5. Front. Immunol. 2019, 10, 1–27. [Google Scholar] [CrossRef]
- Sadler, A.J. The role of MDA5 in the development of autoimmune disease. J. Leukoc. Biol. 2017, 103, 185–192. [Google Scholar] [CrossRef] [Green Version]
- Morimoto, K.; Nakajima, K. Role of the Immune System in the Development of the Central Nervous System. Front. Neurosci. 2019, 13. [Google Scholar] [CrossRef] [PubMed] [Green Version]
- Orozco, S.; Oberst, A. RIPK3 in cell death and inflammation: The Good, the Bad, and the Ugly. Immunol. Rev. 2017, 277, 102–112. [Google Scholar] [CrossRef] [PubMed] [Green Version]
- Numajiri Haruki, A.; Naito, T.; Nishie, T.; Saito, S.; Nagata, K. Interferon-inducible antiviral protein MxA enhances cell death triggered by endoplasmic reticulum stress. J. Interf. Cytokine Res. 2011, 31, 847–856. [Google Scholar] [CrossRef]
- Andersen, M.H.; Schrama, D.; Thor Straten, P.; Becker, J.C. Cytotoxic T cells. J. Invest. Dermatol. 2006, 126, 32–41. [Google Scholar] [CrossRef] [PubMed] [Green Version]
- Yu, J.; Zhou, X.; Chang, M.; Nakaya, M.; Chang, J.-H.; Xiao, Y.J.; Lindsey, W.; Dorta-Estremera, S.; Cao, W.; Zal, N.; et al. Regulation of T-cell activation and migration by the kinase TBK1 during neuroinflammation. Nat. Commun. 2015, 6, 6074. [Google Scholar] [CrossRef] [Green Version]
- Rollins-Smith, L.A. Metamorphosis and the amphibian immune system. Immunol. Rev. 1998, 166, 221–230. [Google Scholar] [CrossRef] [PubMed]
- Pollet, N. Expression of immune genes during metamorphosis of Xenopus: A survey. Front. Biosci. 2010, 15, 348–358. [Google Scholar] [CrossRef] [Green Version]
- Roelfsema, F.; Boelen, A.; Kalsbeek, A.; Fliers, E. Regulatory aspects of the human hypothalamus-pituitary-thyroid axis. Best Pract. Res. Clin. Endocrinol. Metab. 2017, 31, 487–503. [Google Scholar] [CrossRef] [PubMed]
- Khansari, N.; Shakiba, Y.; Mahmoudi, M. Chronic Inflammation and Oxidative Stress as a Major Cause of Age- Related Diseases and Cancer. Recent Pat. Inflamm. Allergy Drug Discov. 2009, 3, 73–80. [Google Scholar] [CrossRef]
- Carbone, D.; Faggio, C. Importance of prebiotics in aquaculture as immunostimulants. Effects on immune system of Sparus aurata and Dicentrarchus labrax. Fish Shellfish Immunol. 2016, 54, 172–178. [Google Scholar] [CrossRef] [PubMed]
- Remen, M.; Nederlof, M.A.J.; Folkedal, O.; Thorsheim, G.; Sitjà-Bobadilla, A.; Pérez-Sánchez, J.; Oppedal, F.; Olsen, R.E. Effect of temperature on the metabolism, behaviour and oxygen requirements of Sparus aurata. Aquac. Environ. Interact. 2015, 7, 115–123. [Google Scholar] [CrossRef] [Green Version]


| Pre-Metamorphic Stage | Climax Stage | Post-Metamorphic Stage | Total | |||||||
|---|---|---|---|---|---|---|---|---|---|---|
| R1 | R2 | R3 | R1 | R2 | R3 | R1 | R2 | R3 | ||
| Reads | 24,000,160 | 22,065,907 | 23,172,275 | 23,261,839 | 23,167,451 | 23,191,562 | 23,275,068 | 23,173,993 | 23,358,252 | 208,666,507 |
| Mapped reads | 21,366,876 | 19,668,853 | 20,569,271 | 20,699,424 | 20,540,205 | 20,569,248 | 20,731,453 | 20,676,181 | 20,882,737 | 185,704,248 |
| Mapping rate (%) | 89.03 | 89.14 | 88.77 | 88.98 | 88.66 | 88.69 | 89.07 | 89.22 | 89.40 | - |
| Number of genes | 19,137 | 19,058 | 19,162 | 19,042 | 19,045 | 19,048 | 18,977 | 18,993 | 19,017 | - |
Publisher’s Note: MDPI stays neutral with regard to jurisdictional claims in published maps and institutional affiliations. |
© 2021 by the authors. Licensee MDPI, Basel, Switzerland. This article is an open access article distributed under the terms and conditions of the Creative Commons Attribution (CC BY) license (https://creativecommons.org/licenses/by/4.0/).
Share and Cite
Guerrero-Peña, L.; Suarez-Bregua, P.; Méndez-Martínez, L.; García-Fernández, P.; Tur, R.; Rubiolo, J.A.; Tena, J.J.; Rotllant, J. Brains in Metamorphosis: Temporal Transcriptome Dynamics in Hatchery-Reared Flatfishes. Biology 2021, 10, 1256. https://doi.org/10.3390/biology10121256
Guerrero-Peña L, Suarez-Bregua P, Méndez-Martínez L, García-Fernández P, Tur R, Rubiolo JA, Tena JJ, Rotllant J. Brains in Metamorphosis: Temporal Transcriptome Dynamics in Hatchery-Reared Flatfishes. Biology. 2021; 10(12):1256. https://doi.org/10.3390/biology10121256
Chicago/Turabian StyleGuerrero-Peña, Laura, Paula Suarez-Bregua, Luis Méndez-Martínez, Pablo García-Fernández, Ricardo Tur, Juan A. Rubiolo, Juan J. Tena, and Josep Rotllant. 2021. "Brains in Metamorphosis: Temporal Transcriptome Dynamics in Hatchery-Reared Flatfishes" Biology 10, no. 12: 1256. https://doi.org/10.3390/biology10121256