Article

Artificial Neural Networks to Predict the Mechanical Properties of Natural Fibre-Reinforced Compressed Earth Blocks (CEBs)

ISISE, Department of Civil Engineering, University of Minho, 4800-058 Guimarães, Portugal
*
Author to whom correspondence should be addressed.
Fibers 2021, 9(12), 78; https://doi.org/10.3390/fib9120078
Submission received: 20 October 2021 / Revised: 12 November 2021 / Accepted: 16 November 2021 / Published: 1 December 2021
(This article belongs to the Special Issue Fibres in Construction: Mechanical Modelling and Characterisation)

Abstract

:
The purpose of this study is to explore Artificial Neural Networks (ANNs) to predict the compressive and tensile strengths of natural fibre-reinforced Compressed Earth Blocks (CEBs). To this end, a database was created by collecting data from the available literature. Data relating to 332 specimens (Database 1) were used for the prediction of the compressive strength (ANN1), and, due to the lack of some information, those relating to 130 specimens (Database 2) were used for the prediction of the tensile strength (ANN2). The developed tools showed high accuracy, i.e., correlation coefficients (R-value) equal to 0.97 for ANN1 and 0.91 for ANN2. Such promising results prompt their applicability for the design and orientation of experimental campaigns and support numerical investigations.

1. Introduction

Compressed Earth Blocks (CEBs) are spreading as an innovative construction technology as they combine the advantages of earthen constructions without neglecting the sustainability requirements of modern buildings.
CEBs represent the evolution of traditional adobe or rammed earth [1,2,3]. Their production process involves a compaction force on the mould (manually operated or using a hydraulic machine) to obtain a denser and stronger block. Earth is the main component of the mixture. It guarantees high indoor hygrothermal comfort and a high level of air quality [4]. Furthermore, the blocks are unfired, which means low embodied carbon and energy [5,6,7], and they are entirely recyclable at the end of the life cycle [5,6].
Researchers worldwide are currently facing the problem of overcoming the main disadvantages of earth-based materials, e.g., durability, dimensional stability, mechanical strength, etc. To this end, several additives ranging from cement to fibres are commonly adopted to minimise such issues [7,8,9,10]. In particular, natural or synthetic fibres are usually introduced to (i) reduce excessive swelling and shrinkage phenomena and (ii) improve blocks’ ductility and fracture resistance [7,8,9,11,12,13,14,15,16,17]. Even though this dual role is widely accepted in the literature, many doubts remain about fibre type, quantity and the chemical interaction with the soil. The studies mentioned show that the presence of fibres induces a beneficial effect on blocks up to a certain threshold. When exceeding that limit, there is a decline in physical and mechanical properties [18]. Such an overload leads the fibres to be not distributed homogeneously, overlapping themselves and consequently resulting in a less compact block. This threshold is obviously not unique but depends on numerous factors such as the aspect ratio (the ratio between length and diameter), the density of the fibre, its physical composition and surface roughness. Chemical treatments such as the alkaline treatment proposed by Vodounon et al. [19] also improve the surface of the fibres within certain duration limits. What emerges is an enormous variability of the variables involved. Therefore, a complete knowledge of the rules for the mixture design has not yet been achieved, making fibre-reinforced CEBs with randomly distributed fibres a challenging topic that needs to be investigated [20].
In broad terms, researchers agree on the effect produced by fibres in bridging microfractures, behaving similarly to roots in the ground soil [18]. In 2015, Danso et al. [21] proved that this bridging function is proportional to fibres’ length, i.e., their aspect ratio, by comparing the response of different blocks reinforced with coconut coir, sugarcane bagasse and oil palm fibres. In 2016, Aymerich et al. [11] investigated how different lengths and percentages of hemp fibres influence the fracture resistance and energy absorption capacity of an earthen material subjected to static and impacted bending load. They demonstrated that the post-cracking performance is significantly enhanced by increasing fibre content and length for large displacements, while the mechanism is only marginal for small displacement.
One can note how the available scientific literature mainly focuses on experimental analyses to assess the macroscopic mechanical performance of various fibre-reinforced CEBs [18,19,22,23,24,25,26,27,28]. Authors usually investigate the flexural and tensile strengths by three-point bending and tensile splitting tests, respectively. In general, fibre-reinforced CEBs demonstrate a more gradual failure than simple units. Such a phenomenon suggests that the ductility and the fracture resistance of the blocks are improved by introducing fibres. Still, few attempts have focused on accurately describing the physical interaction between fibres and matrix. Recently, Danso et al. [29] accomplished a series of experimental tests at the micro-scale with this purpose. First, the computerised tomography scanning showed the random distribution of fibres. Second, the optical microscopy and scanning electron microscopy revealed gaps between fibres and soil matrix, especially in the case of coconut coir (other fibres used were sugarcane bagasse and oil palm fibres). Further experiments suggested that these gaps are caused by fibre shrinkage during the drying process and by the compaction force during the preparation process (result also confirmed from the study by Taallah and Guettala [23]). However, a complete understanding of the failure has not yet been achieved. The most widely known issues concern the intrinsic diversity affecting the raw materials involved in the manufacturing process of the blocks, curing time and methods, etc. The diverse soils and fibres in nature make each blend practically unique, and, as a result, their responses are reasonably different. Furthermore, the measured resistance value depends on the size of samples and test procedures, which revealed poor standardisation [7].
The literature analysis underlines the effort that the experimental determination of the mechanical characteristics of these blocks requires. To achieve a reliable and statistically relevant knowledge of the information sought for the development of each product, extensive experimental campaigns employing large quantities of resources (e.g., materials, energy, tools) are needed. Therefore, it is important to use computational tools to predict some of the characteristics of the blocks. With this purpose, the present study proposes the use of Artificial Neural Networks (ANNs), computational systems belonging to the broader Machine Learning (ML) methods [30]. Their use is widespread in many engineering research fields [31,32,33,34,35,36,37,38,39,40,41,42,43,44,45,46], but not yet in the area of interest. Among the few studies found that are related to this topic, ANNs were used in 2017 by Ongpeng et al. [47] to optimise the mixture design of CEBs containing rice straw, and in 2016 by Sitton et al. [34] to obtain a rapid soil classification for use in CEBs.
Unlike those studies, the primary objective of this research is to generate two ANN models devoted to predicting the uniaxial compressive strength and tensile splitting strength of various natural fibre-reinforced CEBs. To enhance the potential of this building technology, it also aims to initiate a more organic and stimulating discussion on the topic through the use of advanced computational tools and the creation of a common database.
The methodology adopted consists of the following main steps: (i) data collection, (ii) modelling of the ANNs, and (iii) performance evaluation of the generated networks. In particular, the second phase includes three sub-steps: (ii.a) data processing, (ii.b) definition of the ANNs architecture, and (ii.c) training of the networks. Each network can be re-trained several times until attaining an acceptable prediction accuracy. Once the desired model is obtained, the network is saved and used with new, unknown data for the prediction purpose (iv). Figure 1 provides a graphical visualisation of the proposed workflow.
This paper is organised as follows. Section 2 briefly frames the artificial intelligence family and summarises the ANN theory; Section 3 and Section 4 focus on the data collection and modelling of the ANNs; Section 5 discusses the performance of the ANNs. Finally, some key conclusions are reported in Section 6.

2. Artificial Neural Networks: Theoretical Background

In computer science, ML is a subcategory of artificial intelligence (Figure 2). The concept behind ML is to train computers, through examples, to recognise attributes [48]. ANNs are supervised ML models, generally used to predict a continuous output as a function of some inputs (regression).
A generic ANN, i.e., a multi-layer perceptron network [30], is characterised by two fundamental elements, the architecture and the learning technique. The term architecture refers to the main structure: the input layer, the hidden layer(s), and the output layer, where neurons are located. The information moves from the input layer to the output layer in a feed-forward way [30]. Thus, neurons belonging to a layer are connected to the subsequential layer in only one direction with no cycles or loops; the path is linear.
Figure 3 shows the scheme of a generic network with R input variables and S neurons. Accordingly, p is the input vector, W is the weight matrix of S × R size, b is the bias vector of size S, f is the activation function, and a is the output vector of length S.
The back-propagation algorithms represent the most popular learning techniques on function approximation problems [30]. These algorithms compare the output with the target, sending the resulting error back to adjust the weight assigned to each neuron connection [30,49]. This process is looped until the error is minimised within a specific range in which the target and output values converge. The back-propagation algorithms can only be applied on networks with differentiable activation functions.
The general network n of Figure 3 can be expressed by Equation (1), in which W is the weight matrix applied to the input vector p, and b is the bias vector.
n = W p + b
The actual output a depends on the chosen activation function f, or transfer function [30], which can be either linear or non-linear. In multi-layer neural networks trained using the back-propagation algorithm, a commonly used activation function is the log-sigmoid function (2):
a = f ( n ) = 1 1 + e n
The advantage of this transfer function is that it is differentiable and can take any inputs, squashing the outputs into the range 0–1 [30]. One can note that an ANN without the activation function is simply equivalent to a regression model, which just tries to approximate data distribution with a straight line. In many cases, a straight line is not sufficient to properly represent the problem.
In contemporary literature, many authors have used ML models, simply based on datasets, to estimate the material strength as a function of the mixture [33,36,43,46,50,51,52], for example. Indeed, similar issues are currently addressed in other fields of material science and engineering, such as fibre-reinforced concrete, lightweight concrete, recycled coarse aggregate concrete, construction and demolition waste concrete, just to name a few. These materials have in common the extreme variability of the characteristics of the components: fibre type, aggregate dimensions, recycled material provenience, etc. The virtue of ML is that it allows precisely considering datasets of several independent variables, and the outcomes produced are not affected by the heterogeneity of the features. The computational approach is based on a learning phase during which the network is trained with known experimental results.
ANNs are considered highly effective in fitting functions, and the literature produced in the past two decades demonstrates that a relatively simple ANN can adapt to any practical problem. However, despite the spreading use of ML algorithms, no applications for CEBs have been identified. This represents a substantial gap in research as the entire understanding of the behaviour of Earth-based materials, just like concrete, is hindered by the heterogeneity of the raw materials on which they are based.

3. Data collection

ML algorithms requires the use of extensive databases to guarantee adequate model generation. A suitable database must be composed of a set of independent variables (features), and the corresponding values of the dependent variables that have to be predicted (targets). The quality of the initial database affects the predictive ability of the model. Therefore, data collection and post-processing are the most crucial stages of the whole process.
In this study, the database was created by collecting data arising from the available literature. At first, all available information relating to the observations were retained (even in text form). Then, only those common to all studies were considered. Unfortunately, the lack of data did not allow a single database to predict both the compressive and tensile strength. Table 1 qualitatively summarises the features assessed in the research works considered in the present study.
Hence, from total data relating to 332 specimens (Database 1) used to predict the compressive strength, only those relating to 130 specimens (Database 2) have been used to predict the tensile strength (Table 2).

3.1. Database 1

Database 1 has been used for the prediction of the compressive strength of fibre-reinforced CEBs. It is composed of 332 experimental data extracted by six studies: 130 specimens including (separately) coconut coir, sugarcane bagasse, and oil palm fibres [53]; 70 specimens including banana fibres [22,54]; 36 specimens including pig hair fibres [55]; and 96 specimens including treated pineapple fibres [19]. Unfortunately, concerning the data extracted from the study by Lejano et al. [55], the tensile strength value of the pig hair was missing. Therefore, to obtain a complete data set, it was assumed to be equal to 99 MPa, according to Araya-Letelier et al. [56].
The seven adopted independent variables (features) are clay content ( x 1 1 ) , optimum moisture content ( x 2 1 ) , cement content ( x 3 1 ) , fibre content ( x 4 1 ) , fibre length ( x 5 1 ) , fibre tensile strength ( x 6 1 ) , and specimen’s age ( x 7 1 ) . The dependent variable is the compressive strength ( y 1 ) , measured through the uniaxial compressive strength test. Table 3 provides the descriptive statistics of this database.
Clay plays a key role in the workability and plasticity of the mixture, defining the quality of the blocks produced. Delgado and Guerriero [57] recommended a minimum clay content of 5% and a maximum between 10% to 22%. Among soils included in this database, clay content varies from 8% to 35%.
The OMC (optimum moisture content), obtained by the Proctor test [58], represents the water needed to achieve the maximum soil compaction and, therefore, the ultimate dry density [59]. This optimal value is even more important if one considers the presence of cement, the mineral binder commonly used to stabilise CEBs.
Even though it is usually recommended not to exceed the 5% threshold [19], the cement percentage ranges from 0% to 7% by weight in this database. According to general prescriptions [2], cement content increases with clay content. However, it is more effective with leaner or sandy soil due to chemical interactions occurring with mineral components.
The presence of cement requires slow and constantly wet curing and drying process. Indeed, the best results in terms of quality of blocks are generally achieved after 28 days. Blocks included in this database are cured for 7, 14, 21, and 28 days.
Finally, with reinforcement purpose, several fibre types, content (0–5%), length (0–100 mm), and tensile strength (0–751.95 MPa) are used in CEBs included in this database.
A graphical representation of the relationship between each feature included in Database 1 and the corresponding compressive strength value is presented in Figure 4.

3.2. Database 2

Database 2 has been used for the prediction of the tensile strength of fibre-reinforced CEBs. It comprises 130 experimental data collected from the study by Danso et al. [53] including (separately) coconut coir, sugarcane bagasse, and oil palm fibres.
The five adopted features are clay content ( x 1 2 ) , fibre content ( x 2 2 ) , fibre length ( x 2 2 ) , fibre density ( x 4 2 ) , and fibre tensile strength ( x 5 2 ) . The dependent variable is the tensile strength ( y 2 ) , measured through the tensile splitting test. Table 4 provides the descriptive statistics of this second database.
Unlike Database 1, in Database 2, the influence of some variables was not considered relevant due to the low variability range. For example, among the data available, cement content was always equal to zero, or the OMC and age were the same for all the specimens considered. Therefore, those features were removed. Likewise, in both databases, specimen sizes, water content, gravel, and sand and silt content were also removed.
Figure 5 reports the relationship between each of the features included in Database 2 and the corresponding tensile strength values.
The histograms reported in Figure 6 show the two distributions of the target values: on the left, uniaxial compressive strength, and on the right, tensile splitting strength. One can note how the distribution of the compressive strength values is skewed slightly on the left, while the tensile strength distribution is normal.

4. Modelling of the ANNs

In this section, the modelling strategy of the ANNs is presented. As expressed in the workflow of Figure 1, the first step of the second phase consists of data processing. This step includes data analysis, scaling, and division into the three datasets (training, validation, and testing set). Then, the procedure followed for the definition of the architecture of the two networks is explained and thoroughly described. Finally, the training of the networks is performed.

4.1. Data Processing

Data collected and shown in Figure 4, Figure 5 and Figure 6 are heterogeneous, as they include several units of measure and vary in a different range of values (see Table 3 and Table 4). It has already been mentioned in Section 3 that this situation does not limit the application of ML methods; instead, it represents a likely scenario. However, such data cannot be used in a rough way as those with a wider range of values would influence the expected final result more. Therefore, assigning the same weight to all data is needed for a fair comparison. This procedure is called feature scaling.
In this study, each feature was scaled using the normalisation technique according to Equation (3):
x n o r m = x i   min ( x i ) max ( x i )   min ( x i )  
where x i is the i-th feature to be transformed, min( x i ) and max( x i ) are the minimum and the maximum values assumed by that specific feature into the database.
To prevent multicollinearity problems, the relationship between normalised features included in the same database is shown in Figure 7. Unlike the previous graph, all the features are compared here to ensure their complete independence.
Figure 7a confirms the absence of correlation between the variables belonging to Database 1. Similarly, the scatterplot matrix reported in Figure 7b shows the poor connection between the features included in Database 2.
After completing the analysis and scaling stages, each database was randomly divided into three datasets. In both cases, 70% was used for training, 15% for validation, and 15% for model testing. The training set usually represents the most considerable portion of the database since it is needed to train the network. On the other hand, the validation set serves to evaluate the model ability to generalise the problem. Specifically, the back-propagation algorithm performs continuous iteration loops to reduce the gap between the target value and the predicted output. The training phase is interrupted when the model stops improving (constant errors). Finally, the testing set is used as an independent measure of network performance.

4.2. Definition of the Networks Architecture

As mentioned above, ANNs consist of the input layer, hidden layer(s), and output layer. The number of layers and their size (number of neurons) define the architecture of the network. Even though the definition of this architecture is arbitrary, the choice of the number of neurons in the hidden layer is a delicate phase that requires some essential iterations to avoid the generation of underfitted or overfitted models.
Referring to Database 1, Figure 8 represents the trend of the root means square error (RMSE, Equation (4)) of the training and validation sets as a function of the number of neurons in the hidden layer. In this case, a variable number of neurons ranging from 0 to 140 is sufficient to adequately show the error trend.
R M S E =   1 n p = 1 n ( t i y i ) 2
In Equation (4), n is the number of the p-th neurons in the hidden layer, t i is the i-th target value, and y i is the i-th predicted output.
Figure 8 represents two opposite situations. At the beginning of the graph, for a number of neurons in the hidden layer between 0 and 5, the RMSE of the training and validation set is high (about 0.6) due to the poor capability of the model to depict the input–target relationship. This situation reflects an underfitted model because the chosen architecture is insufficient to represent the complexity of the data provided. As the number of neurons increases, the RMSE of the validation set grows, diverging from the RMSE of the training set. As a result, the model becomes overfitted, which means that the high variance does not allow it to generalise the problem properly. Over 40 neurons, the model correctly predicts the compressive strength values included in the training set (low error), but not those included in the validation set (high error). Hence, such a model will not adapt to the new unknown data for which it was built. It can be seen that a highly complex model does not always work better than a simple model.
According to this strategy, the point at which the RMSE of the validation set is minimum was chosen as the optimal number of neurons for ANN1 (prediction of the compressive strength). Namely, the lowest RMSE is equal to 0.265 for 33 neurons. An identical strategy was used for ANN2, in which the lowest RMSE is equal to 0.008 for 35 neurons (Figure 9).
The architecture defined for the two networks is a two-layer feed-forward network with a sigmoid transfer function in the hidden layer and a linear transfer function in the output layer (Figure 10).

4.3. Training of the Networks

Once the architecture is defined, the Levenberg–Marquardt back-propagation algorithm is used to train the networks. For the specific case, this algorithm shows better performance (fastest convergence) than the Gauss–Newton or steepest descent algorithms since it represents an hybrid method that combines the advantages of the two previously mentioned ones [38,49].
The coding was performed in MATLAB® R2019a. The pseudocode of the developed algorithm is reported in Figure 11.
Once the accuracy and performance of the built network was verified, it was saved and reused to predict unknown outputs from new features.

5. Evaluation of the Performance
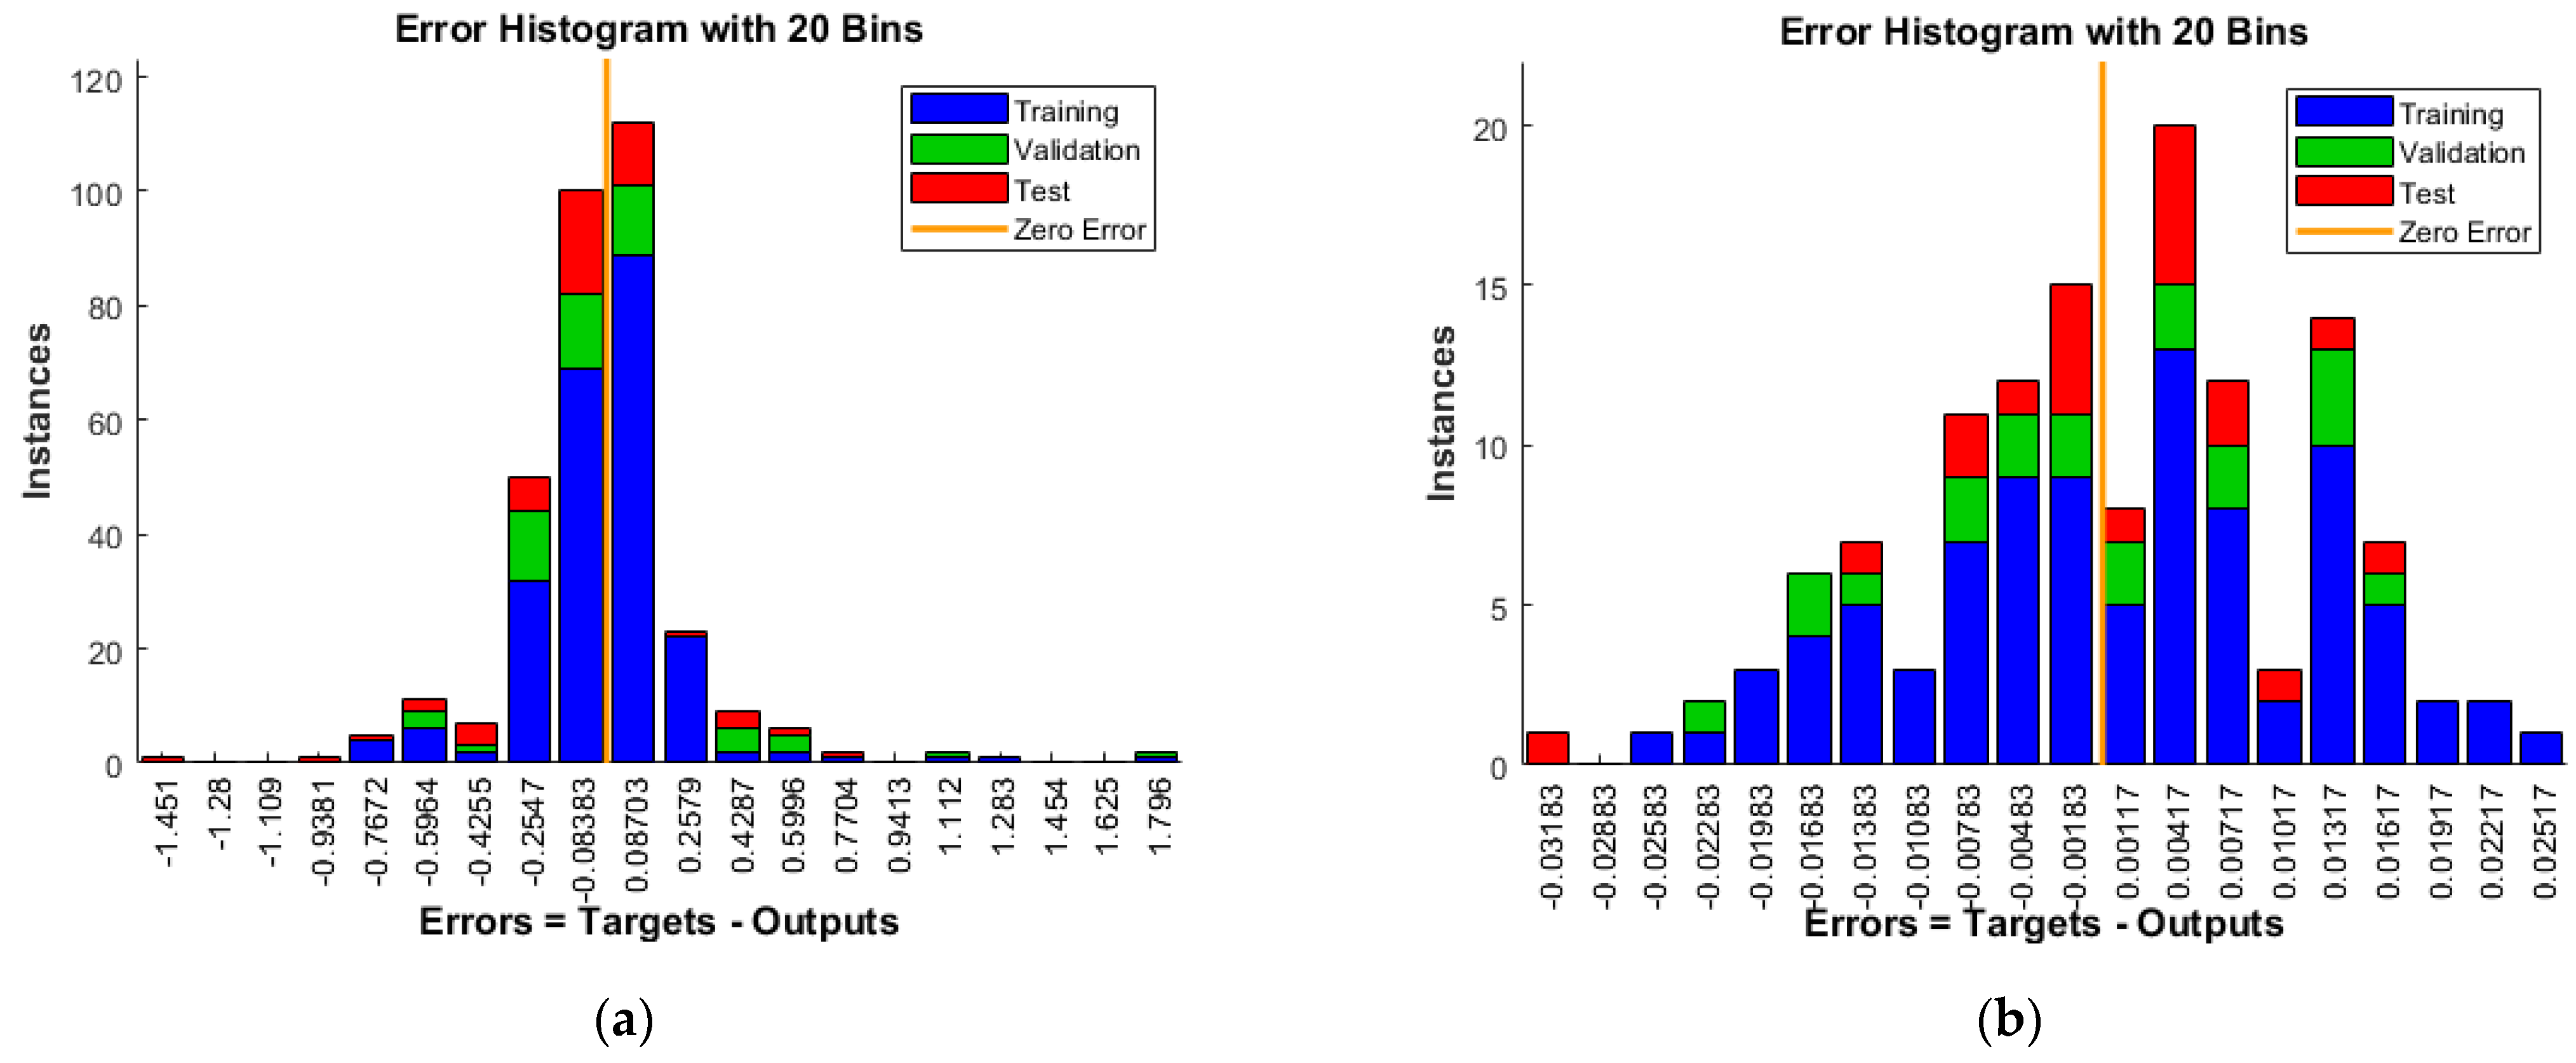
In this section, the performances of the two generated networks are evaluated by analysing (i) the error trend and (ii) the accuracy of the predicted outcomes.

5.1. Error Trend

The performance of the trained models can be assessed through the evaluation of the mean squared error (MSE), accordingly to Equation (5):
M S E = 1 n i = 1 n ( t i y i ) 2
where n is the number of the p-th neurons, t i is the i-th target value, and y i is the i-th predicted output. Unlike the RMSE (Equation (4)), the MSE formula does not have the square root; hence, the error can also assume negative values.
The graphs of Figure 12 indicate at which iteration (epoch) the validation phase reaches the lowest MSE value, i.e., the best performance. The convergence occurs at epoch 16, with the MSE equal to 0.16687 for ANN1, and epoch 5, with the MSE equal to 0.00016 for ANN2. The figures also confirm that the ANN models are correctly working since the MSEs trend of the training set is lower than those of the validation and testing sets which are reasonably similar.
Error histograms are presented in Figure 13. The error ranges from −1.451 to 1.796 for ANN1 and from −0.032 to 0.025 for ANN2. Analysing the first one (Figure 13a), outliers at the extreme sides of the graph are negligible. Most of the data used for training, validating, and model testing are centred in the histogram, close to the zero-error line. In the case of Figure 13b, the errors are instead more widely distributed within the interval. However, it should be noted that, in proportion to the values assumed by the tensile strength, the corresponding error values are acceptable.

5.2. Prediction Accuracy of the Compressive Strength (ANN1)

The first neural network (ANN1), trained with Database 1 to predict the compressive strength, showed sufficient accuracy. Figure 14 shows how the correlation coefficients (R-values) between output values and targets are very high: 0.98 for the training set, 0.95 for the validation set, 0.97 for the testing set, and 0.98 for the total response.
The dashed line represents the ideal relationship between the predicted and target values, and the solid line represents the real regression line (the most suitable between the predicted and target values).
It is worth noting that while the training set regression indicates the model ability to interpolate data, the validation set regression suggests the model ability to generalise the problem. Therefore, once the model correctly maps the features–targets relationship within the database (which must significantly represent the problem), it can be used with new unknown features to make some predictions.

5.3. Prediction Accuracy of the Tensile Strength (ANN2)

The second neural network (ANN2), trained with Database 2 for the prediction of the tensile strength, has also shown promising results. The correlation coefficients between output values and targets are still very high: 0.92 for the training set, 0.90 for the validation set, 0.92 for the testing set, and 0.91 for the total response (Figure 15).
The general correlation coefficients found in both cases, RANN1 = 0.98 and RANN2 = 0.91, still demonstrate the efficacy of neural networks applied to the search problem of fitting functions.

6. Conclusions

The purpose of this study was to generate two Artificial Neural Networks (ANNs) to predict the compressive (ANN1) and tensile strengths (ANN2) of natural fibre-reinforced CEBs. Despite the growing use of Machine Learning (ML) algorithms in engineering problems, few applications involve CEBs [34,47].
To train the ANNs, two databases were created by collecting data from five literature works [19,22,53,54,55]. In particular, data relating to 332 specimens were used to predict the compressive strength (Database 1) and data relating to 130 specimens were used to predict the tensile strength (Database 2). The developed networks showed sufficient prediction accuracy, i.e., R-values equal to 0.97 for ANN1 and 0.91 for ANN2. Building on these encouraging outcomes, the following conclusions can be drawn:
  • ANNs may be widely used within the scope of CEB optimisation to orient experimental campaigns and support numerical investigations. The possibility of executing many analyses in a short time represents valuable support to facilitate the development of a new durable and sustainable construction material, opening new opportunities for both researchers and practitioners.
  • The database used covers a range of values that reproduce the most commonly obtained laboratory results. It does not classify the fibres on the basis of their original natural source (type of plants or animals) but on the basis of their physical and mechanical characterisation (density, length, tensile strength). This approach does not affect the predictive capabilities of the proposed model, as both the compressive and tensile strength of fibre-reinforced CEBs with type of fibres not included in the database can still be deduced from the ANNs as long as the characteristics entered fall within the available ranges.
  • The prediction accuracy of the networks depends on the data sets used, and it would be advantageous to enhance and enrich it by providing new and increasingly variable data. To this end, a complete dataset should include mixture proportion (wt.%) comprising all components used (soil, as a composition of gravel, sand, silt and clay, cement, or other kinds of stabiliser, water, fibres, etc.), type of fibres, their length, tensile strength and chemical treatment, specimens’ size, age, etc. Such a list can be clearly extended with additional features according to the necessities.
  • Future developments should be aimed at continuing the experimentation on blocks, collecting new data and further investigating the mechanisms that regulate the effect of fibres in the earth matrix. In this regard, it is essential to point out the importance of carefully and adequately designing experiments through, for example, the Design of the Experiments (DoE) methods. This would mitigate many problems related to uncertainty, and the approach to studying this promising construction technology would be better defined, allowing the scientific community to collaborate in creating an appropriate physical model.
  • In addition to the mere prediction of the resistance values, ML algorithms can afterwards be used to optimise the design of the mixtures. In fact, it is well known that in the experiment-based approach, the user can rarely control all the variables, almost never reaching the optimal performing option. Especially in the case of new materials to be placed on the market, multi-objective optimisation problems are often faced, posing objectives that can also be in contrast with each other: compliance with regulatory standards, production costs, environmental impact, etc. To benefit from the support of AI, future studies should define variables, objectives, and constraints to ensure that the problem is correctly addressed.
This study can be considered as an attempt to develop a predictive model, as the available data are scarce. On the other hand, it represents only the first step towards elaborating a more sophisticated modelling strategy, moving towards the development of increasingly reliable computational tools capable of capturing and satisfying multiple needs to support decision makers.

Author Contributions

Conceptualisation, C.T. and M.F.F.; methodology, C.T.; software, C.T. and M.F.F.; validation, C.T.; formal analysis, C.T.; investigation, C.T.; data curation, C.T. and E.T.; writing—original draft preparation, C.T. and M.F.F.; writing—review and editing, C.T., R.M. and E.T.; visualisation, C.T.; supervision, R.M. and E.T.; project administration, R.M. and E.T. All authors have read and agreed to the published version of the manuscript.

Funding

This work was funded by the FCT (Foundation for Science and Technology), under grant agreement UIBD/150874/2021 attributed to the first author. This work was also partly financed by Fundação “La Caixa”, under the reference PV20-00072, and FCT/MCTES through national funds (PIDDAC) under the R&D Unit Institute for Sustainability and Innovation in Structural Engineering (ISISE), under reference UIDB/04029/2020.

Data Availability Statement

Data supporting the reported results in the present study are available upon request from the corresponding author.

Conflicts of Interest

The authors declare no conflict of interest.

References

  1. Rigassi, V. Compressed Earth Blocks: Manual of Production; GATE: Eschborn, Germany, 1985; Volume 1. [Google Scholar]
  2. Minke, G. Building with Earth: Design and Technology of a Sustainable Architecture, 2nd ed.; Birkhauser: Boston, MA, USA, 2009; pp. 30–32. [Google Scholar]
  3. Ben Mansour, M.; Jelidi, A.; Cherif, A.S.; Ben Jabrallah, S. Optimizing thermal and mechanical performance of compressed earth blocks (CEB). Constr. Build. Mater. 2016, 104, 44–51. [Google Scholar] [CrossRef]
  4. Teixeira, E.; Machado, G.; Junior, A.P.; Guarnier, C.; Fernandes, J.; Silva, S.; Mateus, R. Mechanical and Thermal Performance Characterisation of Compressed Earth Blocks. Energies 2020, 13, 2978. [Google Scholar] [CrossRef]
  5. Fernandes, J.; Peixoto, M.; Mateus, R.; Gervásio, H. Life cycle analysis of environmental impacts of earthen materials in the Portuguese context: Rammed earth and compressed earth blocks. J. Clean. Prod. 2019, 241, 118286. [Google Scholar] [CrossRef] [Green Version]
  6. Mateus, R.; Fernandes, J.; Teixeira, E.R. Environmental Life Cycle Analysis of Earthen Building Materials; Elsevier BV: Amsterdam, The Netherlands, 2020. [Google Scholar] [CrossRef] [Green Version]
  7. Jannat, N.; Hussien, A.; Abdullah, B.; Cotgrave, A. Application of agro and non-agro waste materials for unfired earth blocks construction: A review. Constr. Build. Mater. 2020, 254, 119346. [Google Scholar] [CrossRef]
  8. Laborel-Préneron, A.; Aubert, J.; Magniont, C.; Tribout, C.; Bertron, A. Plant aggregates and fibers in earth construction materials: A review. Constr. Build. Mater. 2016, 111, 719–734. [Google Scholar] [CrossRef]
  9. Danso, H.; Martinson, B.; Ali, M.; Mant, C. Performance characteristics of enhanced soil blocks: A quantitative review. Build. Res. Inf. 2014, 43, 253–262. [Google Scholar] [CrossRef] [Green Version]
  10. Pacheco-Torgal, F.; Jalali, S. Earth construction: Lessons from the past for future eco-efficient construction. Constr. Build. Mater. 2012, 29, 512–519. [Google Scholar] [CrossRef] [Green Version]
  11. Aymerich, F.; Fenu, L.; Francesconi, L.; Meloni, P. Fracture behaviour of a fibre reinforced earthen material under static and impact flexural loading. Constr. Build. Mater. 2016, 109, 109–119. [Google Scholar] [CrossRef]
  12. Salih, M.M.; Osofero, A.I.; Imbabi, M.S. Critical review of recent development in fiber reinforced adobe bricks for sustainable construction. Front. Struct. Civ. Eng. 2020, 14, 839–854. [Google Scholar] [CrossRef]
  13. Mohajerani, A.; Hui, S.-Q.; Mirzababaei, M.; Arulrajah, A.; Horpibulsuk, S.; Abdul Kadir, A.; Rahman, M.T.; Maghool, F. Amazing Types, Properties, and Applications of Fibres in Construction Materials. Materials 2019, 12, 2513. [Google Scholar] [CrossRef] [Green Version]
  14. Ramakrishnan, S.; Loganayagan, S.; Kowshika, G.; Ramprakash, C.; Aruneshwaran, M. Adobe blocks reinforced with natural fibres: A review. Mater. Today Proc. 2021, 45, 6493–6499. [Google Scholar] [CrossRef]
  15. Turco, C.; Junior, A.C.P.; Teixeira, E.R.; Mateus, R. Optimisation of Compressed Earth Blocks (CEBs) using natural origin materials: A systematic literature review. Constr. Build. Mater. 2021, 309, 125140. [Google Scholar] [CrossRef]
  16. Millogo, Y.; Aubert, J.-E.; Hamard, E.; Morel, J.-C. How Properties of Kenaf Fibers from Burkina Faso Contribute to the Reinforcement of Earth Blocks. Materials 2015, 8, 2332–2345. [Google Scholar] [CrossRef]
  17. Laibi, A.B.; Poullain, P.; Leklou, N.; Gomina, M.; Sohounhloué, D.K.C. Influence of the kenaf fiber length on the mechanical and thermal properties of Compressed Earth Blocks (CEB). KSCE J. Civ. Eng. 2017, 22, 785–793. [Google Scholar] [CrossRef]
  18. Danso, H.; Martinson, B.; Ali, M.; Williams, J. Physical, mechanical and durability properties of soil building blocks reinforced with natural fibres. Constr. Build. Mater. 2015, 101, 797–809. [Google Scholar] [CrossRef] [Green Version]
  19. Vodounon, N.A.; Kanali, C.; Mwero, J. Compressive and Flexural Strengths of Cement Stabilized Earth Bricks Reinforced with Treated and Untreated Pineapple Leaves Fibres. Open J. Compos. Mater. 2018, 8, 145–160. [Google Scholar] [CrossRef] [Green Version]
  20. Vincenzini, A.; Augarde, C.E.; Gioffrè, M. Experimental characterization of natural fibre–soil interaction: Lessons for earthen construction. Mater. Struct. 2021, 54, 110. [Google Scholar] [CrossRef]
  21. Danso, H.; Martinson, B.; Ali, M.; Williams, J. Effect of fibre aspect ratio on mechanical properties of soil building blocks. Constr. Build. Mater. 2015, 83, 314–319. [Google Scholar] [CrossRef] [Green Version]
  22. Mostafa, M.; Uddin, N. Effect of Banana Fibers on the Compressive and Flexural Strength of Compressed Earth Blocks. Buildings 2015, 5, 282–296. [Google Scholar] [CrossRef] [Green Version]
  23. Taallah, B.; Guettala, A. The mechanical and physical properties of compressed earth block stabilized with lime and filled with untreated and alkali-treated date palm fibers. Constr. Build. Mater. 2016, 104, 52–62. [Google Scholar] [CrossRef]
  24. Laborel-Préneron, A.; Aubert, J.-E.; Magniont, C.; Maillard, P.; Poirier, C. Effect of Plant Aggregates on Mechanical Properties of Earth Bricks. J. Mater. Civ. Eng. 2017, 29, 04017244. [Google Scholar] [CrossRef]
  25. Ajouguim, S.; Talibi, S.; Djelal-Dantec, C.; Hajjou, H.; Waqif, M.; Stefanidou, M.; Saadi, L. Effect of Alfa fibers on the mechanical and thermal properties of compacted earth bricks. Mater. Today Proc. 2021, 37, 4049–4057. [Google Scholar] [CrossRef]
  26. Hema, C.; Messan, A.; Lawane, A.; Soro, D.; Nshimiyimana, P.; van Moeseke, G. Improving the thermal comfort in hot region through the design of walls made of compressed earth blocks: An experimental investigation. J. Build. Eng. 2021, 38, 102148. [Google Scholar] [CrossRef]
  27. Nshimiyimana, P.; Hema, C.; Zoungrana, O.; Messan, A.; Courard, L. Courard, Thermophysical and mechanical properties of compressed earth blocks containing fibres: By-product of okra plant and polymer waste, WIT Trans. Built. Environ. 2020, 195, 149–161. [Google Scholar] [CrossRef]
  28. Velasco-Aquino, A.A.; Espuna-Mujica, J.A.; Perez-Sanchez, J.F.; Zuñiga-Leal, C.; Palacio-Perez, A.; Suarez-Dominguez, E.J. Compressed earth block reinforced with coconut fibers and stabilized with aloe vera and lime. J. Eng. Des. Technol. 2021, 19, 795–807. [Google Scholar] [CrossRef]
  29. Danso, H.; Martinson, B.; Ali, M.; Williams, J.B. Mechanisms by which the inclusion of natural fibres enhance the properties of soil blocks for construction. J. Compos. Mater. 2017, 51, 3835–3845. [Google Scholar] [CrossRef] [Green Version]
  30. Hagan, M.T.; Dcmuth, H.B.; Beale, M. Neural Network Design; PWS Publishing Co.: Boston, MA, USA, 1996. [Google Scholar]
  31. Lee, S.-C. Prediction of concrete strength using artificial neural networks. Eng. Struct. 2003, 25, 849–857. [Google Scholar] [CrossRef]
  32. Sarıdemir, M.; Topçu, I.B.; Özcan, F.; Severcan, M.H. Prediction of long-term effects of GGBFS on compressive strength of concrete by artificial neural networks and fuzzy logic. Constr. Build. Mater. 2009, 23, 1279–1286. [Google Scholar] [CrossRef]
  33. Topçu, İ.B.; Sarıdemir, M. Prediction of mechanical properties of recycled aggregate concretes containing silica fume using artificial neural networks and fuzzy logic. Comput. Mater. Sci. 2008, 42, 74–82. [Google Scholar] [CrossRef]
  34. Sitton, J.D.; Zeinali, Y.; Story, B.A. Rapid soil classification using artificial neural networks for use in constructing compressed earth blocks. Constr. Build. Mater. 2017, 138, 214–221. [Google Scholar] [CrossRef]
  35. Lan, G.; Wang, Y.; Zeng, G.; Zhang, J. Compressive strength of earth block masonry: Estimation based on neural networks and adaptive network-based fuzzy inference system. Compos. Struct. 2020, 235, 111731. [Google Scholar] [CrossRef]
  36. DeRousseau, M.; Kasprzyk, J.; Srubar, W. Computational design optimization of concrete mixtures: A review. Cem. Concr. Res. 2018, 109, 42–53. [Google Scholar] [CrossRef]
  37. Garzón-Roca, J.; Marco, C.O.; Adam, J.M. Compressive strength of masonry made of clay bricks and cement mortar: Estimation based on Neural Networks and Fuzzy Logic. Eng. Struct. 2013, 48, 21–27. [Google Scholar] [CrossRef]
  38. Zhou, Q.; Wang, F.; Zhu, F. Estimation of compressive strength of hollow concrete masonry prisms using artificial neural networks and adaptive neuro-fuzzy inference systems. Constr. Build. Mater. 2016, 125, 417–426. [Google Scholar] [CrossRef]
  39. Golafshani, E.M.; Behnood, A.; Arashpour, M. Predicting the compressive strength of normal and High-Performance Concretes using ANN and ANFIS hybridized with Grey Wolf Optimizer. Constr. Build. Mater. 2020, 232, 117266. [Google Scholar] [CrossRef]
  40. Azimi-Pour, M.; Eskandari-Naddaf, H. ANN and GEP prediction for simultaneous effect of nano and micro silica on the compressive and flexural strength of cement mortar. Constr. Build. Mater. 2018, 189, 978–992. [Google Scholar] [CrossRef]
  41. Güçlüer, K.; Özbeyaz, A.; Göymen, S.; Günaydın, O. A comparative investigation using machine learning methods for concrete compressive strength estimation. Mater. Today Commun. 2021, 27, 102278. [Google Scholar] [CrossRef]
  42. Teymen, A.; Mengüç, E.C. Comparative evaluation of different statistical tools for the prediction of uniaxial compressive strength of rocks. Int. J. Min. Sci. Technol. 2020, 30, 785–797. [Google Scholar] [CrossRef]
  43. Dantas, A.T.A.; Leite, M.B.; de Jesus Nagahama, K. Prediction of compressive strength of concrete containing construction and demolition waste using artificial neural networks. Constr. Build. Mater. 2013, 38, 717–722. [Google Scholar] [CrossRef]
  44. Duan, Z.; Kou, S.; Poon, C.S. Using artificial neural networks for predicting the elastic modulus of recycled aggregate concrete. Constr. Build. Mater. 2013, 44, 524–532. [Google Scholar] [CrossRef]
  45. Neeraja, D.; Swaroop, G. Prediction of Compressive Strength of Concrete using Artificial Neural Networks. Res. J. Pharm. Technol. 2017, 10, 35. [Google Scholar] [CrossRef]
  46. Topçu, I.B.; Sarıdemir, M. Prediction of compressive strength of concrete containing fly ash using artificial neural networks and fuzzy logic. Comput. Mater. Sci. 2008, 41, 305–311. [Google Scholar] [CrossRef]
  47. Ongpeng, J.M.C.; Gapuz, E.; Roxas, C.L.C. Optimization of mix proportions of compressed earth blocks with rice straw using artificial neural network. In Proceedings of the 2017 World Congress on Advances in Strucural Engineering and Mechanics (ASEM17), Seoul, Korea, 28 August–1 September 2017; pp. 1–14. [Google Scholar]
  48. Samuel, A.L. Some Studies in Machine Learning Using the Game of Checkers. IBM J. Res. Dev. 1959, 3, 210–229. [Google Scholar] [CrossRef]
  49. Marai, M.A.; Ahmed, M.A.; Mousa, S.E.-B. Neural networks for predicting compressive strength of structural light weight concrete. Constr. Build. Mater. 2009, 23, 2214–2219. [Google Scholar] [CrossRef]
  50. Kang, M.-C.; Yoo, D.-Y.; Gupta, R. Machine learning-based prediction for compressive and flexural strengths of steel fiber-reinforced concrete. Constr. Build. Mater. 2021, 266, 121117. [Google Scholar] [CrossRef]
  51. Huang, Y.; Zhang, J.; Ann, F.T.; Ma, G. Intelligent mixture design of steel fibre reinforced concrete using a support vector regression and firefly algorithm based multi-objective optimization model. Constr. Build. Mater. 2020, 260, 120457. [Google Scholar] [CrossRef]
  52. Young, B.A.; Hall, A.; Pilon, L.; Gupta, P.; Sant, G. Can the compressive strength of concrete be estimated from knowledge of the mixture proportions?: New insights from statistical analysis and machine learning methods. Cem. Concr. Res. 2019, 115, 379–388. [Google Scholar] [CrossRef]
  53. Danso, H. Use of Agricultural Waste Fibres as Enhancement of Soil Blocks for Low-Cost Housing in Ghana, University of Portsmouth. 2016. Available online: https://researchportal.port.ac.uk/en/studentTheses/use-of-agricultural-waste-fibres-as-enhancement-of-soil-blocks-fo (accessed on 27 September 2021).
  54. Mostafa, M.; Uddin, N. Experimental analysis of Compressed Earth Block (CEB) with banana fibers resisting flexural and compression forces. Case Stud. Constr. Mater. 2016, 5, 53–63. [Google Scholar] [CrossRef] [Green Version]
  55. Lejano, B.A.; Gabaldon, R.J.; Go, P.J.; Juan, C.G.; Wong, M. Compressed earth blocks with powdered green mussel shell as partial binder and pig hair as fiber reinforcement. Int. J. GEOMATE 2019, 16, 137–143. [Google Scholar] [CrossRef]
  56. Araya-Letelier, G.; Antico, F.C.; Urzua, J.; Bravo, R. Physical-mechanical characterization of fiber-reinforced mortar incorporating pig hair. In Proceedings of the 2nd International Conference on Bio-Based Building Materials & 1st Conference on ECOlogical Valorisation of GRAnular and FIbrous Materials, Clermont-Ferrand, France, 21–23 June 2017. [Google Scholar]
  57. Delgado, M.C.J.; Guerrero, I.C. The selection of soils for unstabilised earth building: A normative review. Constr. Build. Mater. 2007, 21, 237–251. [Google Scholar] [CrossRef]
  58. Day, R.W. Soil Testing Manual: Procedures, Classification Data, and Sampling Practices; McGraw Hill, Inc.: New York, NY, USA, 2001. [Google Scholar]
  59. Akhzouz, H.; El Minor, H.; Tatane, M.; Bendarma, A. Physical characterization of bio-composite CEB stabilized with Argan nut shell and cement. Mater. Today Proc. 2021, 36, 107–114. [Google Scholar] [CrossRef]
Figure 1. Schematic representation of the proposed workflow.
Fibers 09 00078 g001
Figure 2. Computer science subcategories.
Fibers 09 00078 g002
Figure 3. Scheme of a generic ANN of S neurons, adapted by [30].
Fibers 09 00078 g003
Figure 4. Relationship between each of the features of Database 1 (clay content (a), OMC (b), cement content (c), fibre content (d), fibre length (e), fibre tensile strength (f), age (g)) and the corresponding compressive strength values.
Fibers 09 00078 g004aFibers 09 00078 g004b
Figure 5. Relationship between each of the features of Database 2 (clay content (a), fibre content (b), fibre length (c), fibre density (d) and fibre tensile strength (e)) and the corresponding tensile strength values.
Fibers 09 00078 g005
Figure 6. Histograms of the target values: (a) uniaxial compressive strength; (b) tensile splitting strength.
Fibers 09 00078 g006
Figure 7. Scatterplot matrix: relationship between the normalised features of (a) Dataset 1 and (b) Dataset 2.
Fibers 09 00078 g007
Figure 8. Trend of the RMSE of the training (blue) and validation (orange) datasets within Database 1.
Fibers 09 00078 g008
Figure 9. Individuation of the optimal number of neurons in the hidden layer corresponding to the minimum RMSE for (a) ANN1 and (b) ANN2.
Fibers 09 00078 g009
Figure 10. Defined architecture for the two networks: (a) ANN1 and (b) ANN2.
Fibers 09 00078 g010aFibers 09 00078 g010b
Figure 11. ANN pseudocode.
Fibers 09 00078 g011
Figure 12. Performance of the trained networks: (a) ANN1 and (b) ANN2.
Fibers 09 00078 g012
Figure 13. Error histograms: (a) ANN1 and (b) ANN2.
Fibers 09 00078 g013
Figure 14. Linear regression between compressive strength target values and ANN1 actual outputs.
Fibers 09 00078 g014
Figure 15. Linear regression between tensile strength target values and ANN2 actual outputs.
Fibers 09 00078 g015
Table 1. Physical and mechanical properties assessed within the literature works considered.
Study Ref.Type of Fibre UsedDry DensityWater AbsorptionCompressive StrengthTensile StrengthFlexural StrengthFibres Tensile Strength
[53]Coconut coir
Sugarcane bagasse
Oil palm fibres
[22]Banana fibres
[54]Banana fibres
[55]Pig hair
[19]Pineapple leaves
Table 2. Overview of the two databases 1.
Database 1Database 2
Features’ matrix X 1 = [ 332 × 7 ] X 2 = [ 130 × 5 ]
Target vector t 1 = [ 332 × 1 ] t 2 = [ 130 × 1 ]
1 In the notation used: scalars are indicated with small italic letters ( x j , i k , ) , vectors are indicated with small bold letters ( x j k , ) , and matrices are indicated with bold capital letters ( X k , ) . The letter k represents the k-th database, j represents the j-th feature vector, and i represents the i-th feature of that vector.
Table 3. Descriptive statistics of the features of Database 1.
Feature VectorsU.M.MeanSt. Dev.Min.Max.
x 1 1 Clay content%0.230.090.080.35
x 2 1 OMC%0.200.080.100.31
x 3 1 Cement content%0.030.030.000.07
x 4 1 Fibre content%0.010.020.000.05
x 5 1 Fibre lengthmm42.3322.010.00100.00
x 6 1 Fibre tensile strengthMPa218.16227.730.00751.95
x 7 1 Specimen’s ageDays20.966.517.0028.00
Target vector
t 1 Compressive strengthMPa2.801.470.336.30
Table 4. Descriptive statistics of the features of Database 2.
Feature VectorsU.M.MeanSt. Dev.Min.Max.
x 1 2 Clay content%0.220.080.140.30
x 2 2 Fibre content%0.010.000.000.01
x 3 2 Fibre lengthmm51.6922.690.0080.00
x 4 2 Fibre densitykg/m3658.46218.160.00810.00
x 5 2 Fibre tensile strengthMPa92.0050.580.00152.50
Target vector
t 2 Tensile strengthMPa0.290.030.220.37
Publisher’s Note: MDPI stays neutral with regard to jurisdictional claims in published maps and institutional affiliations.

