
Influence of Recycled High-Density Polyethylene Fibers on the Mechanical and Electrochemical Properties of Reinforced Concrete

 ,
,  and
and
Abstract
:1. Introduction
2. Materials and Methods
2.1. Materials
2.2. HDPE Recycled Fibers
2.3. Physical and Mechanical Properties of the Fibers
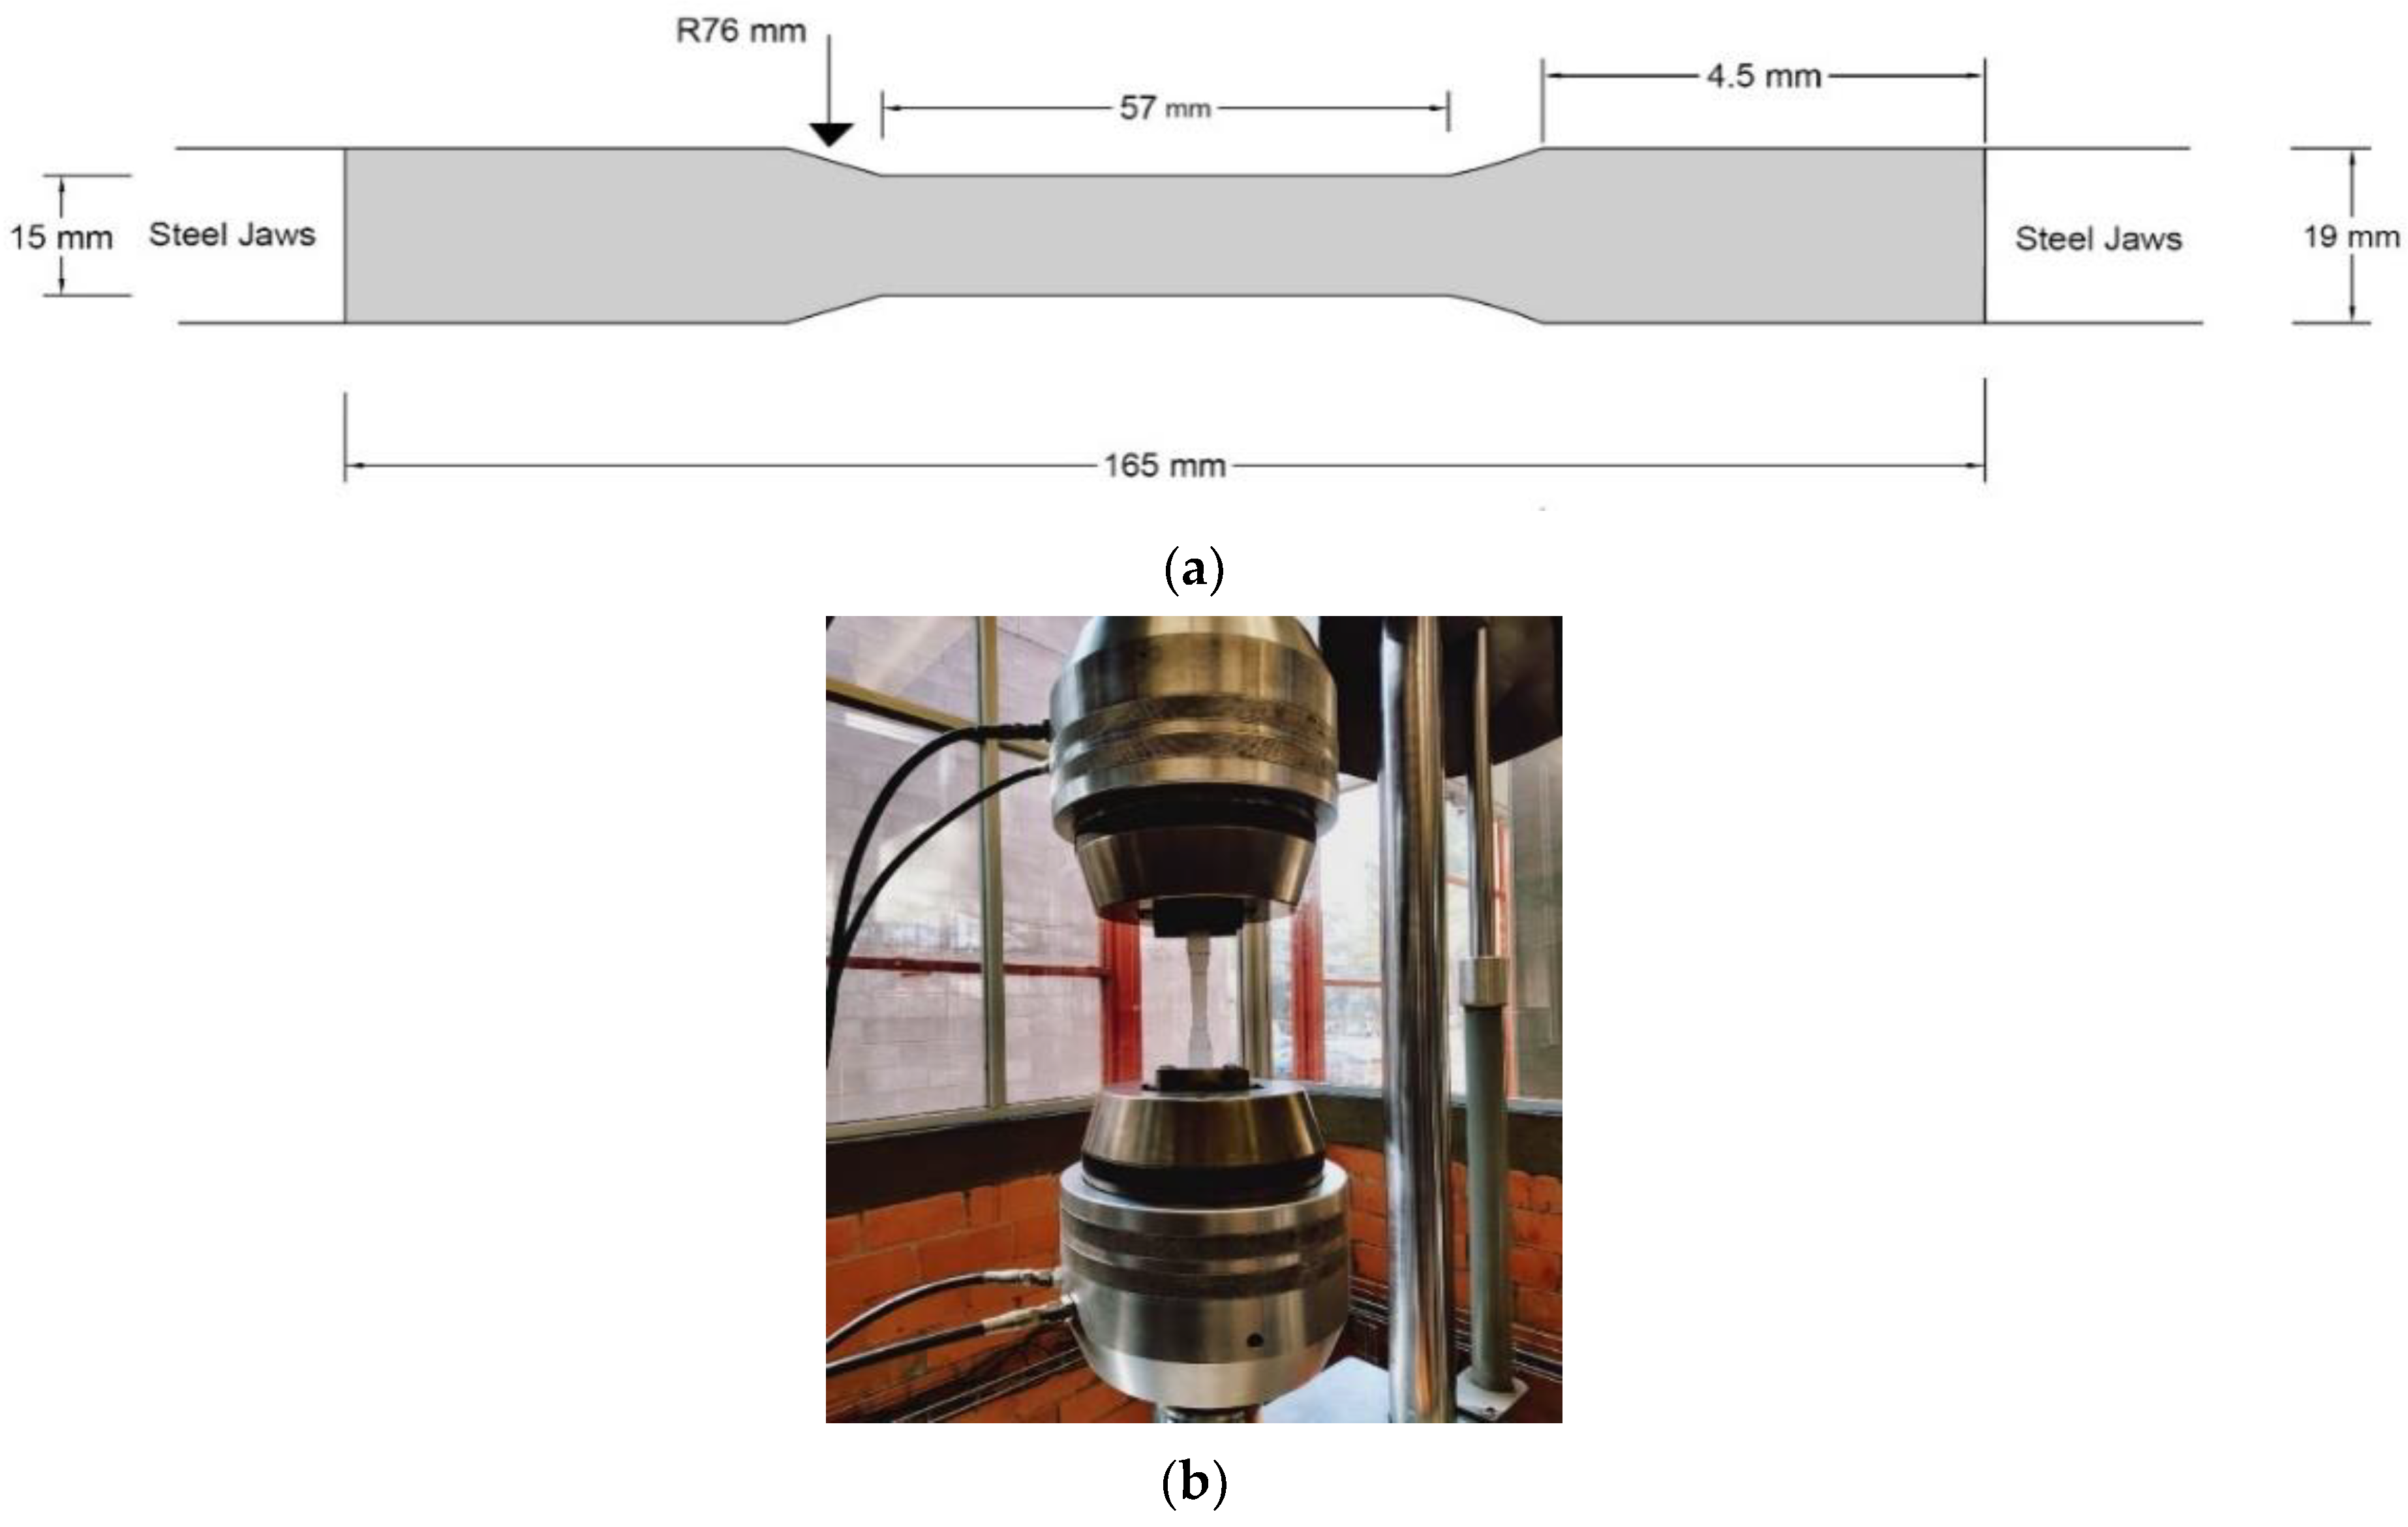
2.4. Physical and Mechanical Tests of the HDPE Fibers
2.5. Concrete Mix Proportions
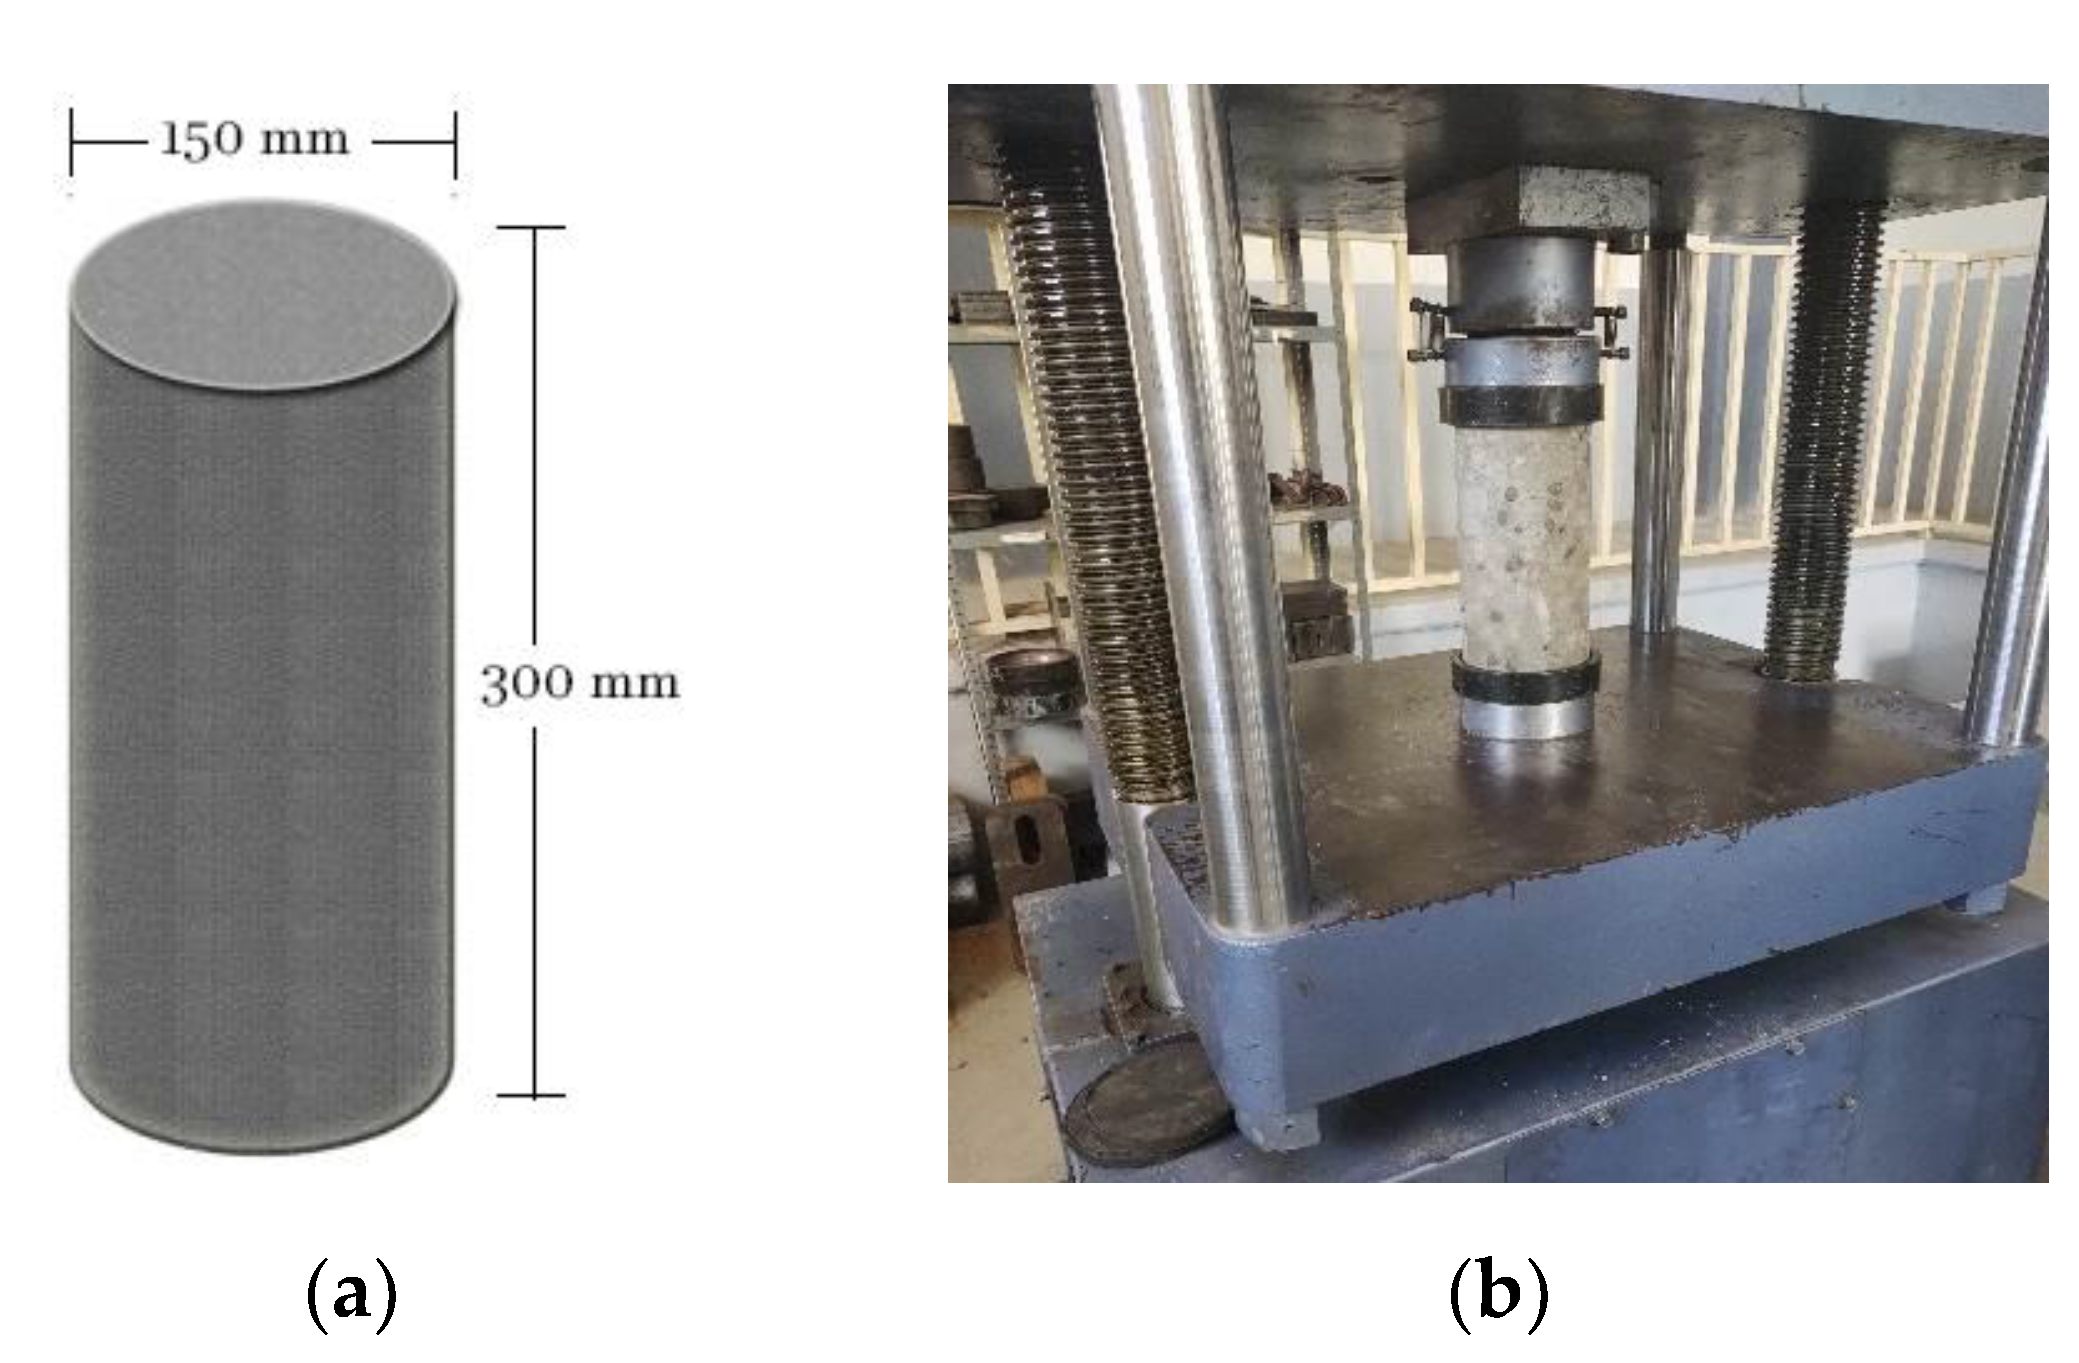
2.6. Specimen Preparation
2.7. Electrochemical Techniques
2.7.1. Half-Cell Potential (HCP)
2.7.2. Electrochemical Noise (EN)
2.7.3. Linear Polarization Resistance (LPR)
2.7.4. Electrochemical Impedance Spectroscopy (EIS)
3. Results
3.1. Freshly Mixed Concrete with Fibers
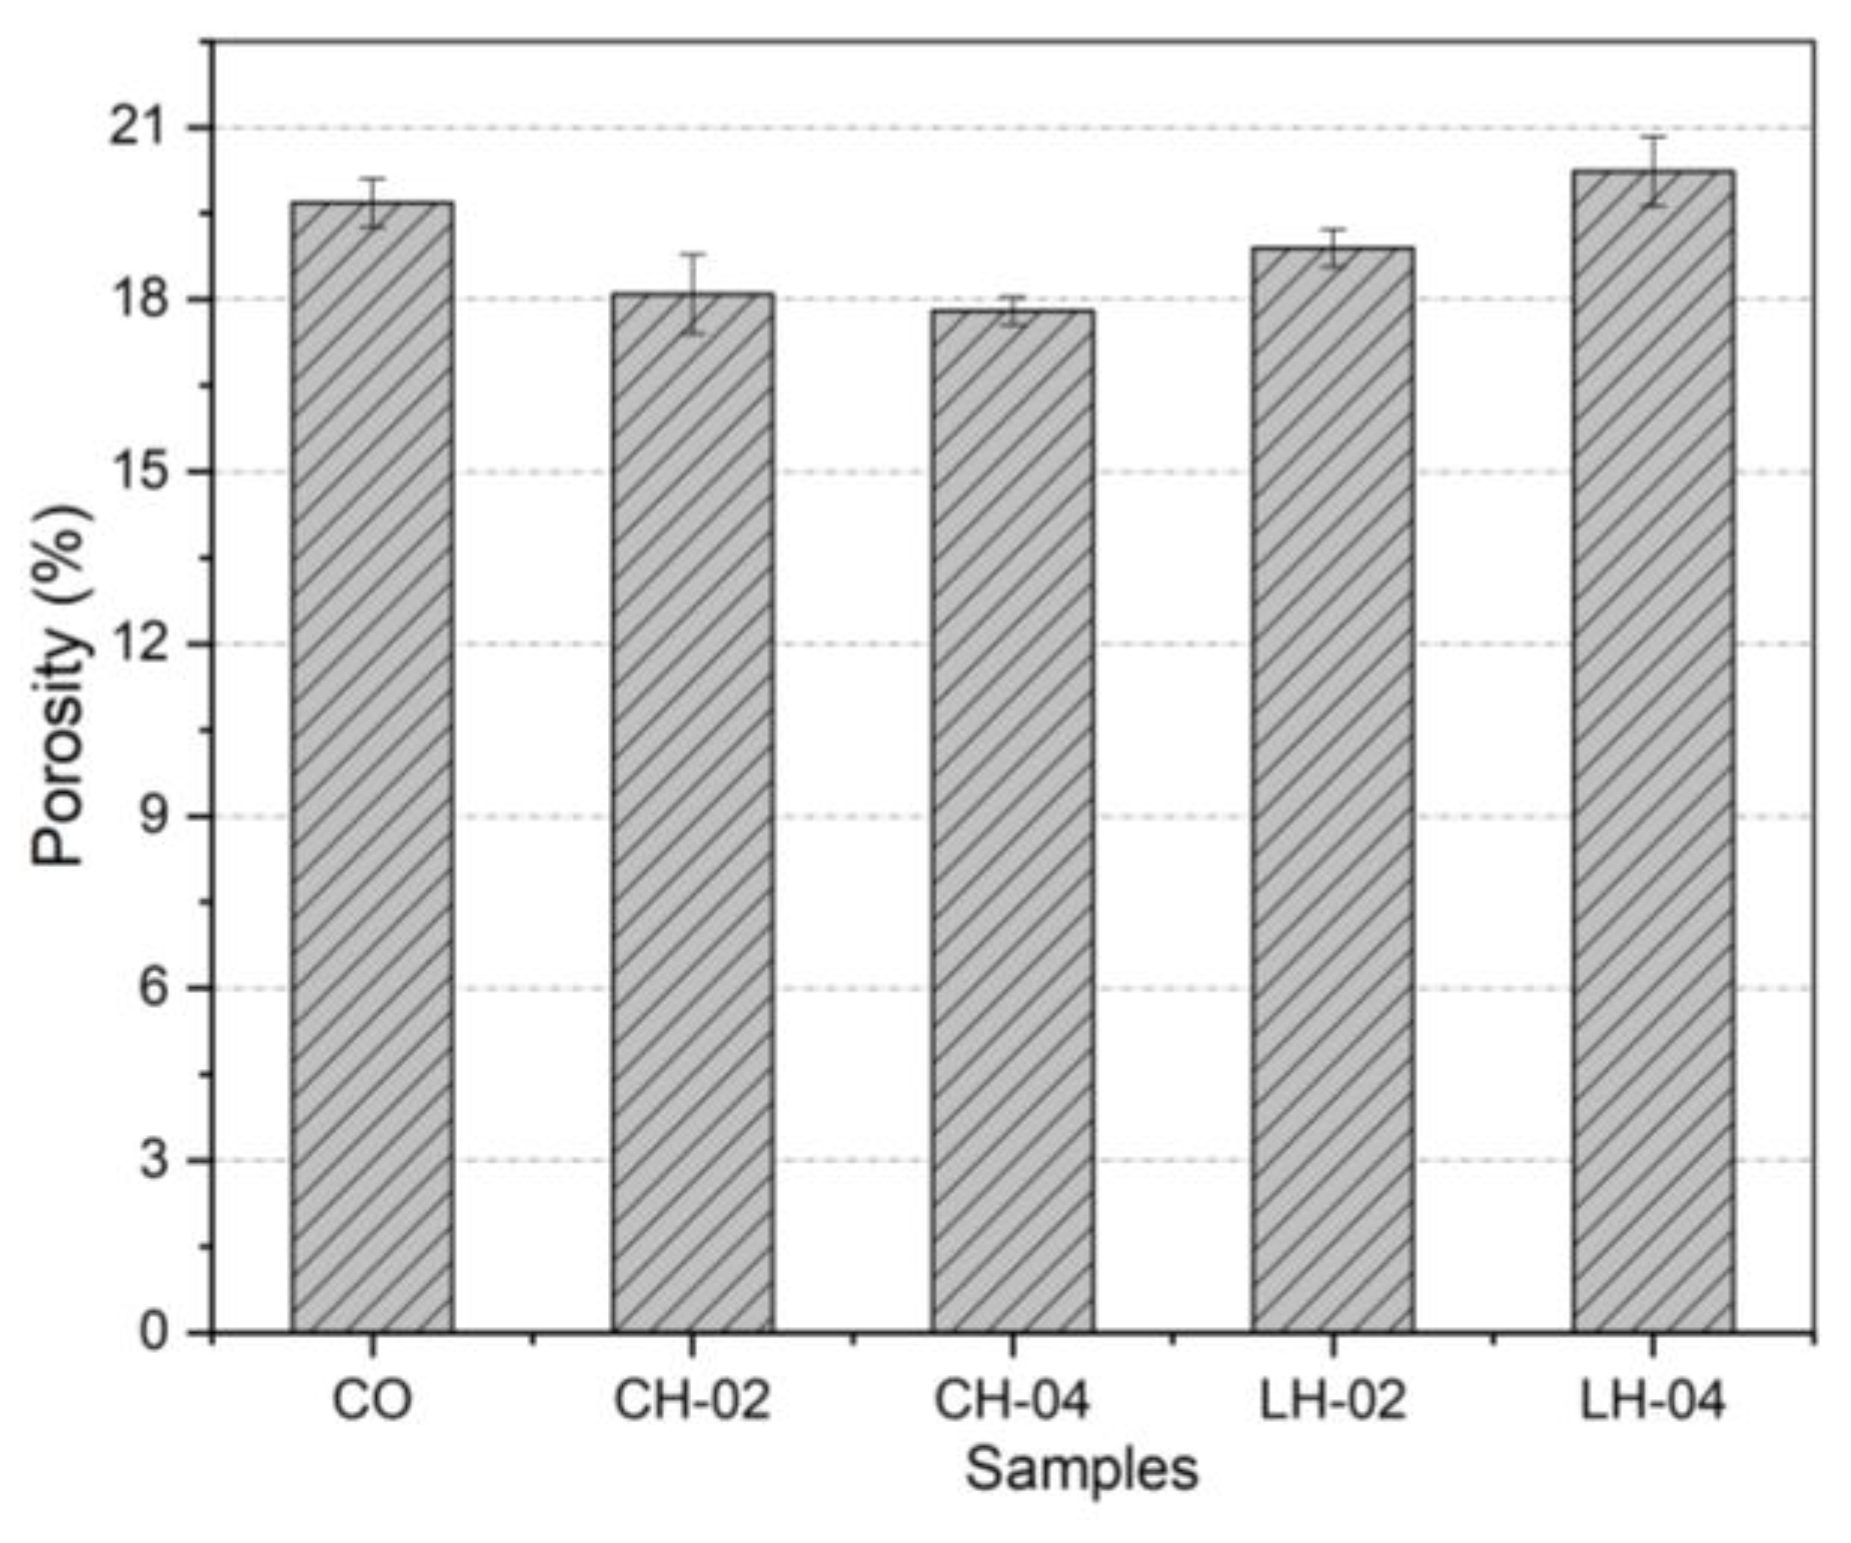
3.2. Concrete Porosity
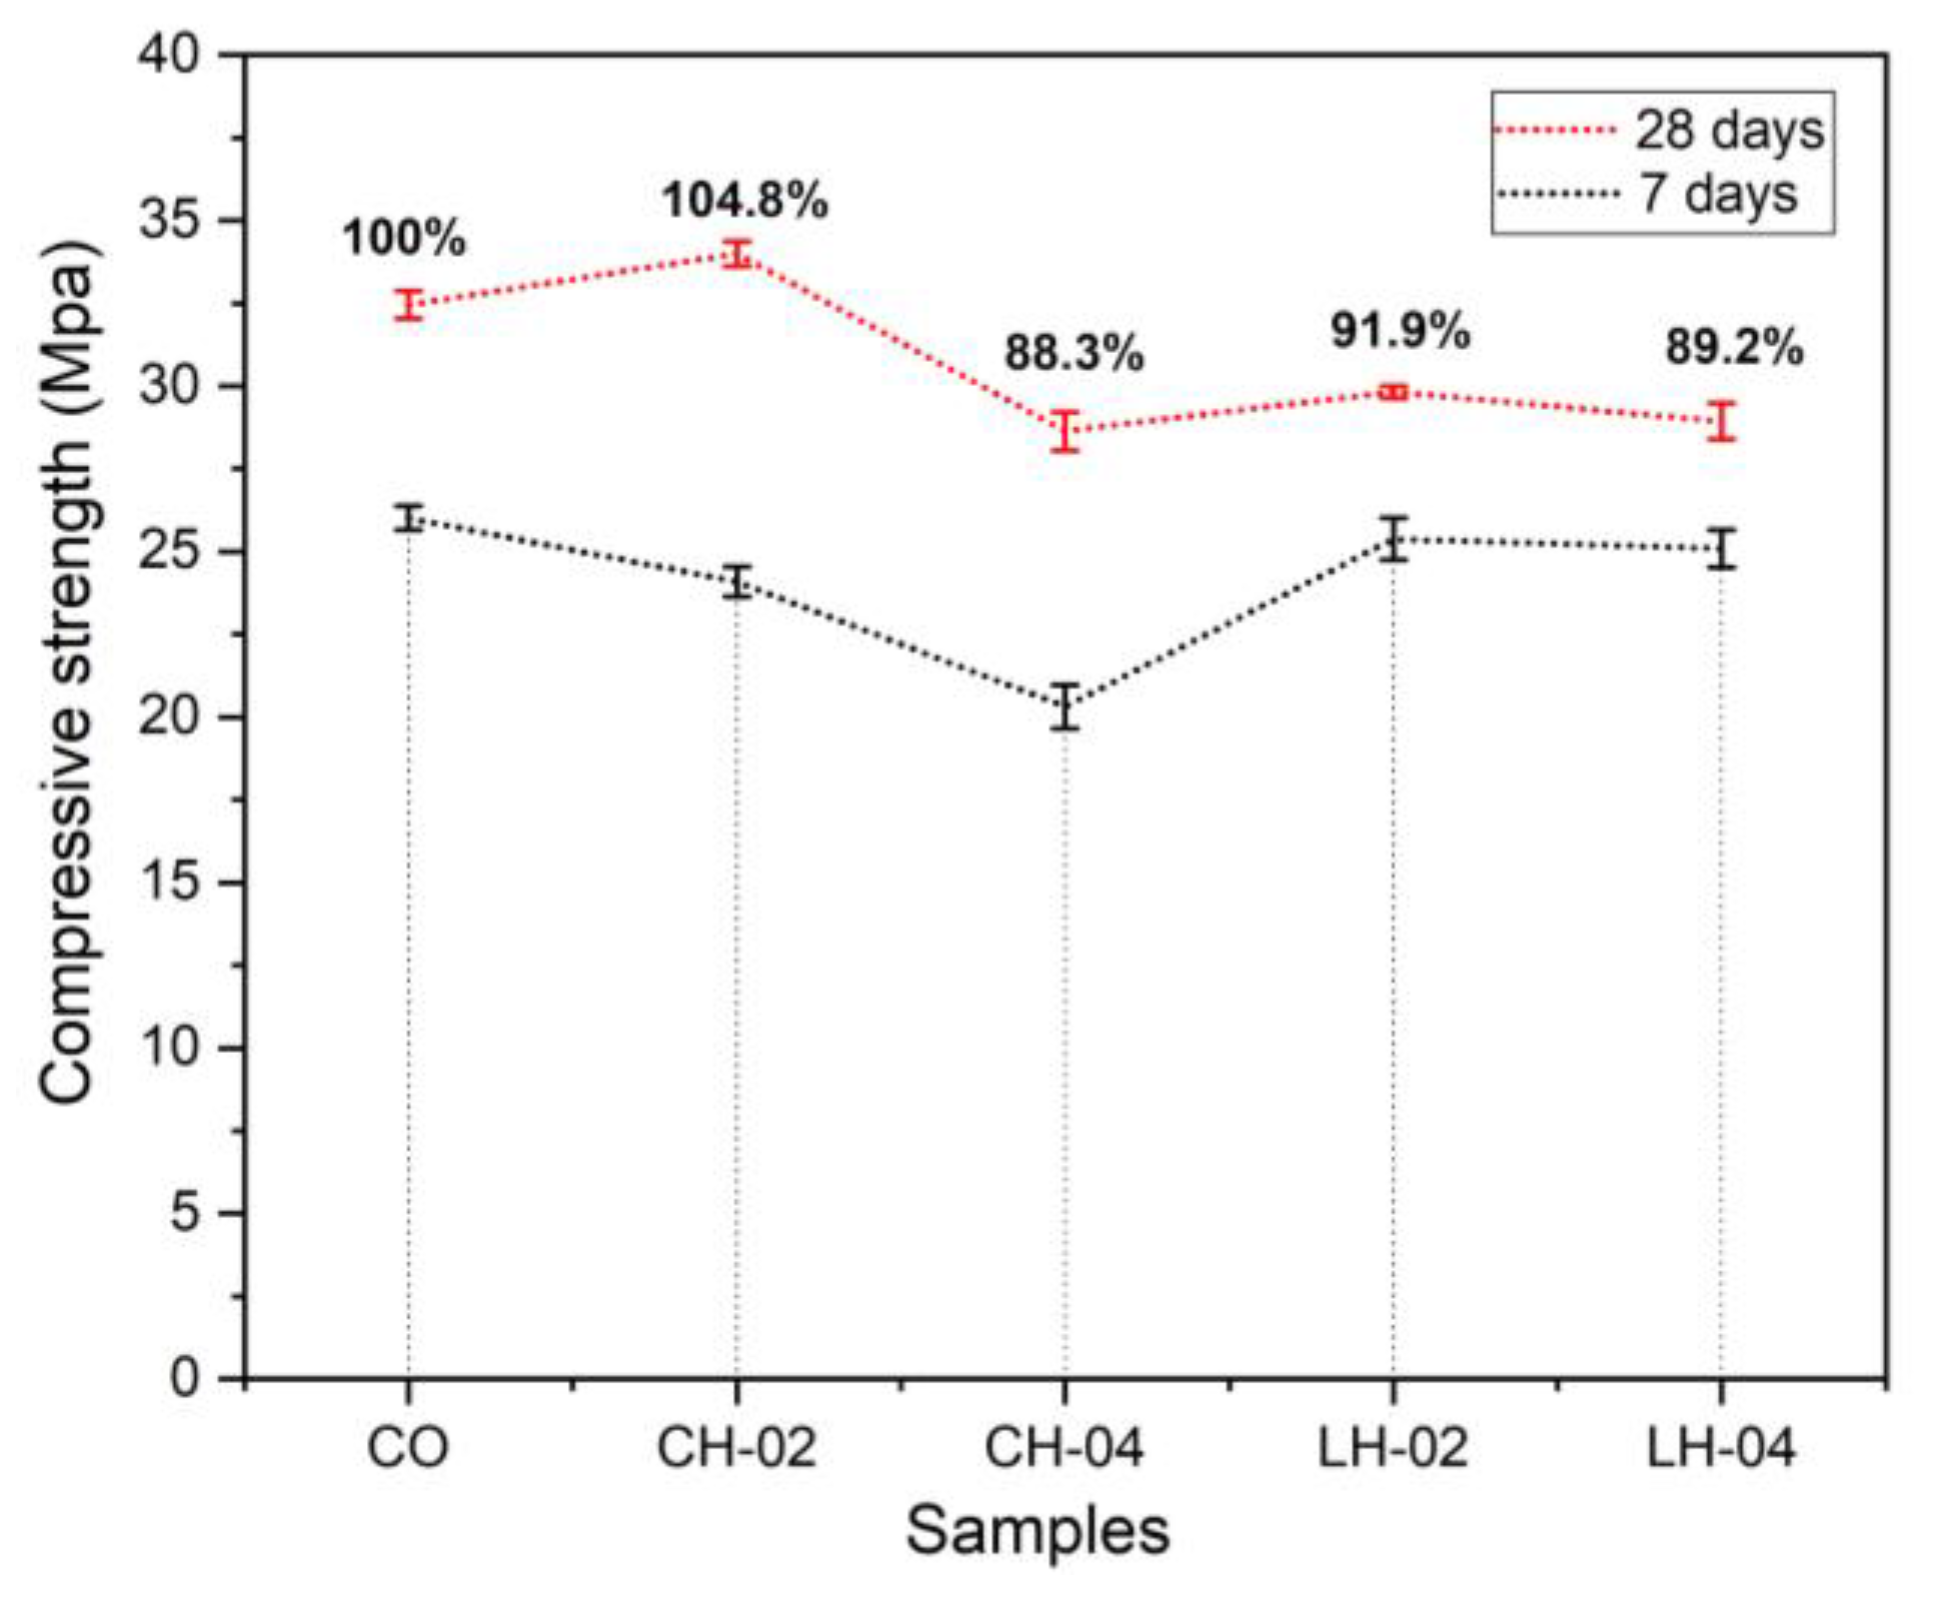
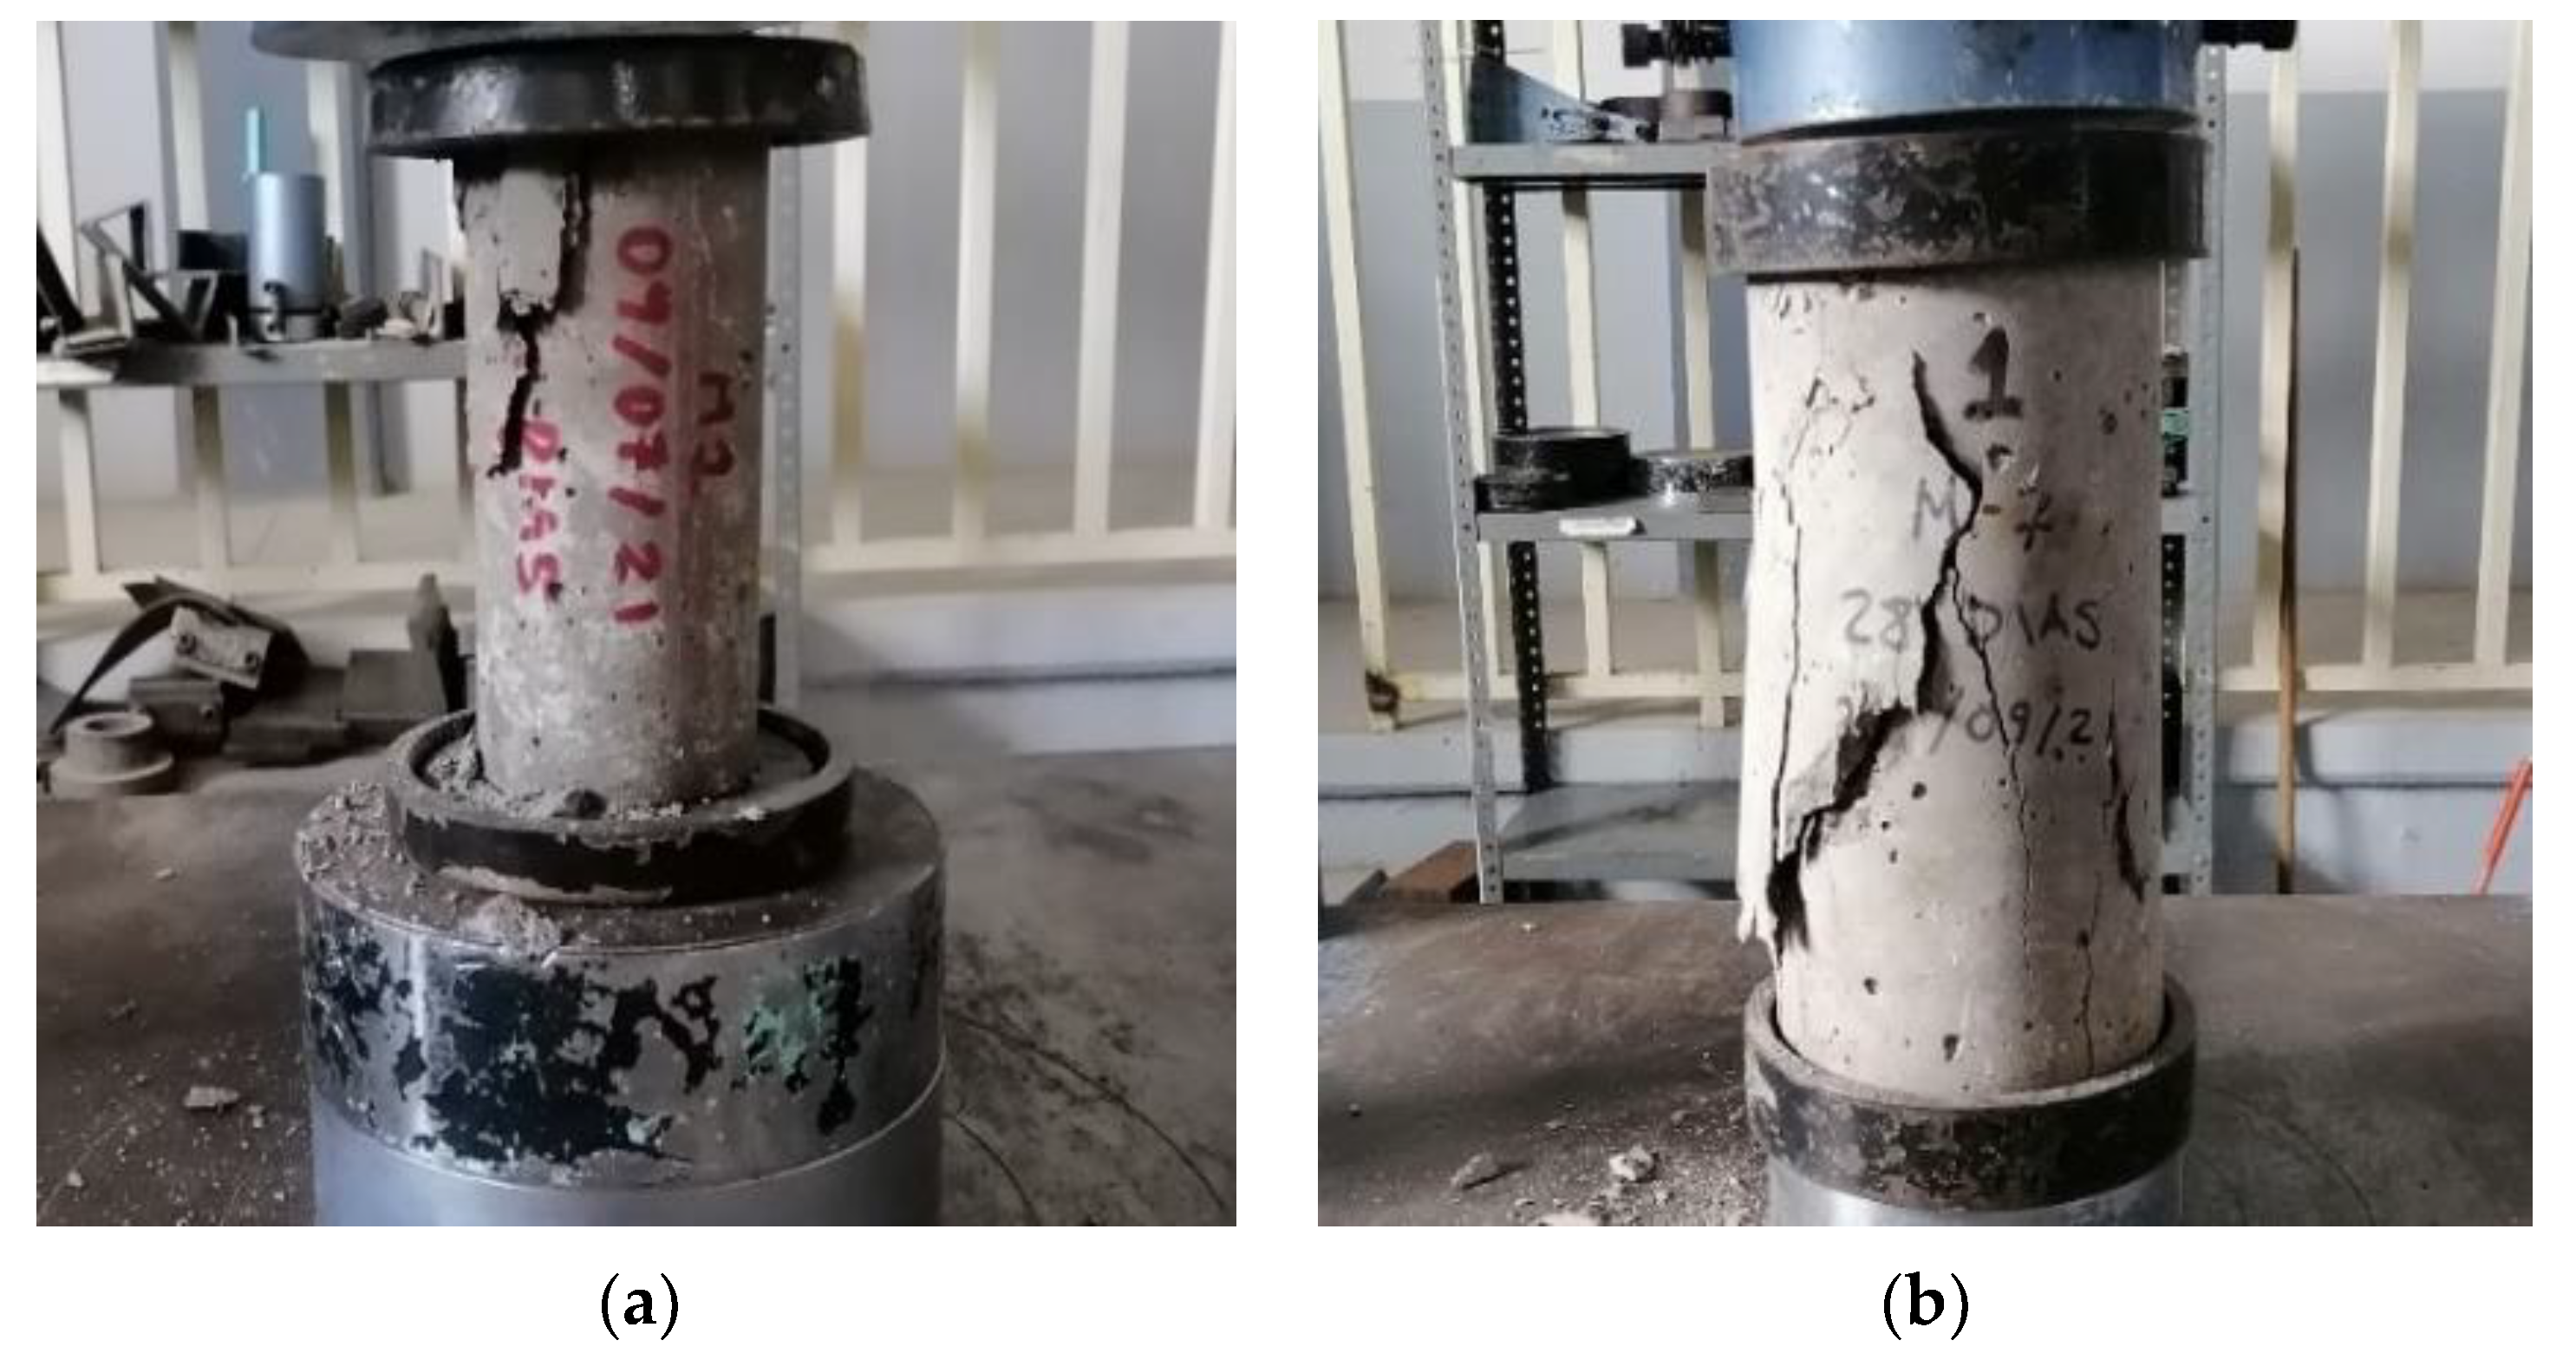
3.3. Compressive Strength
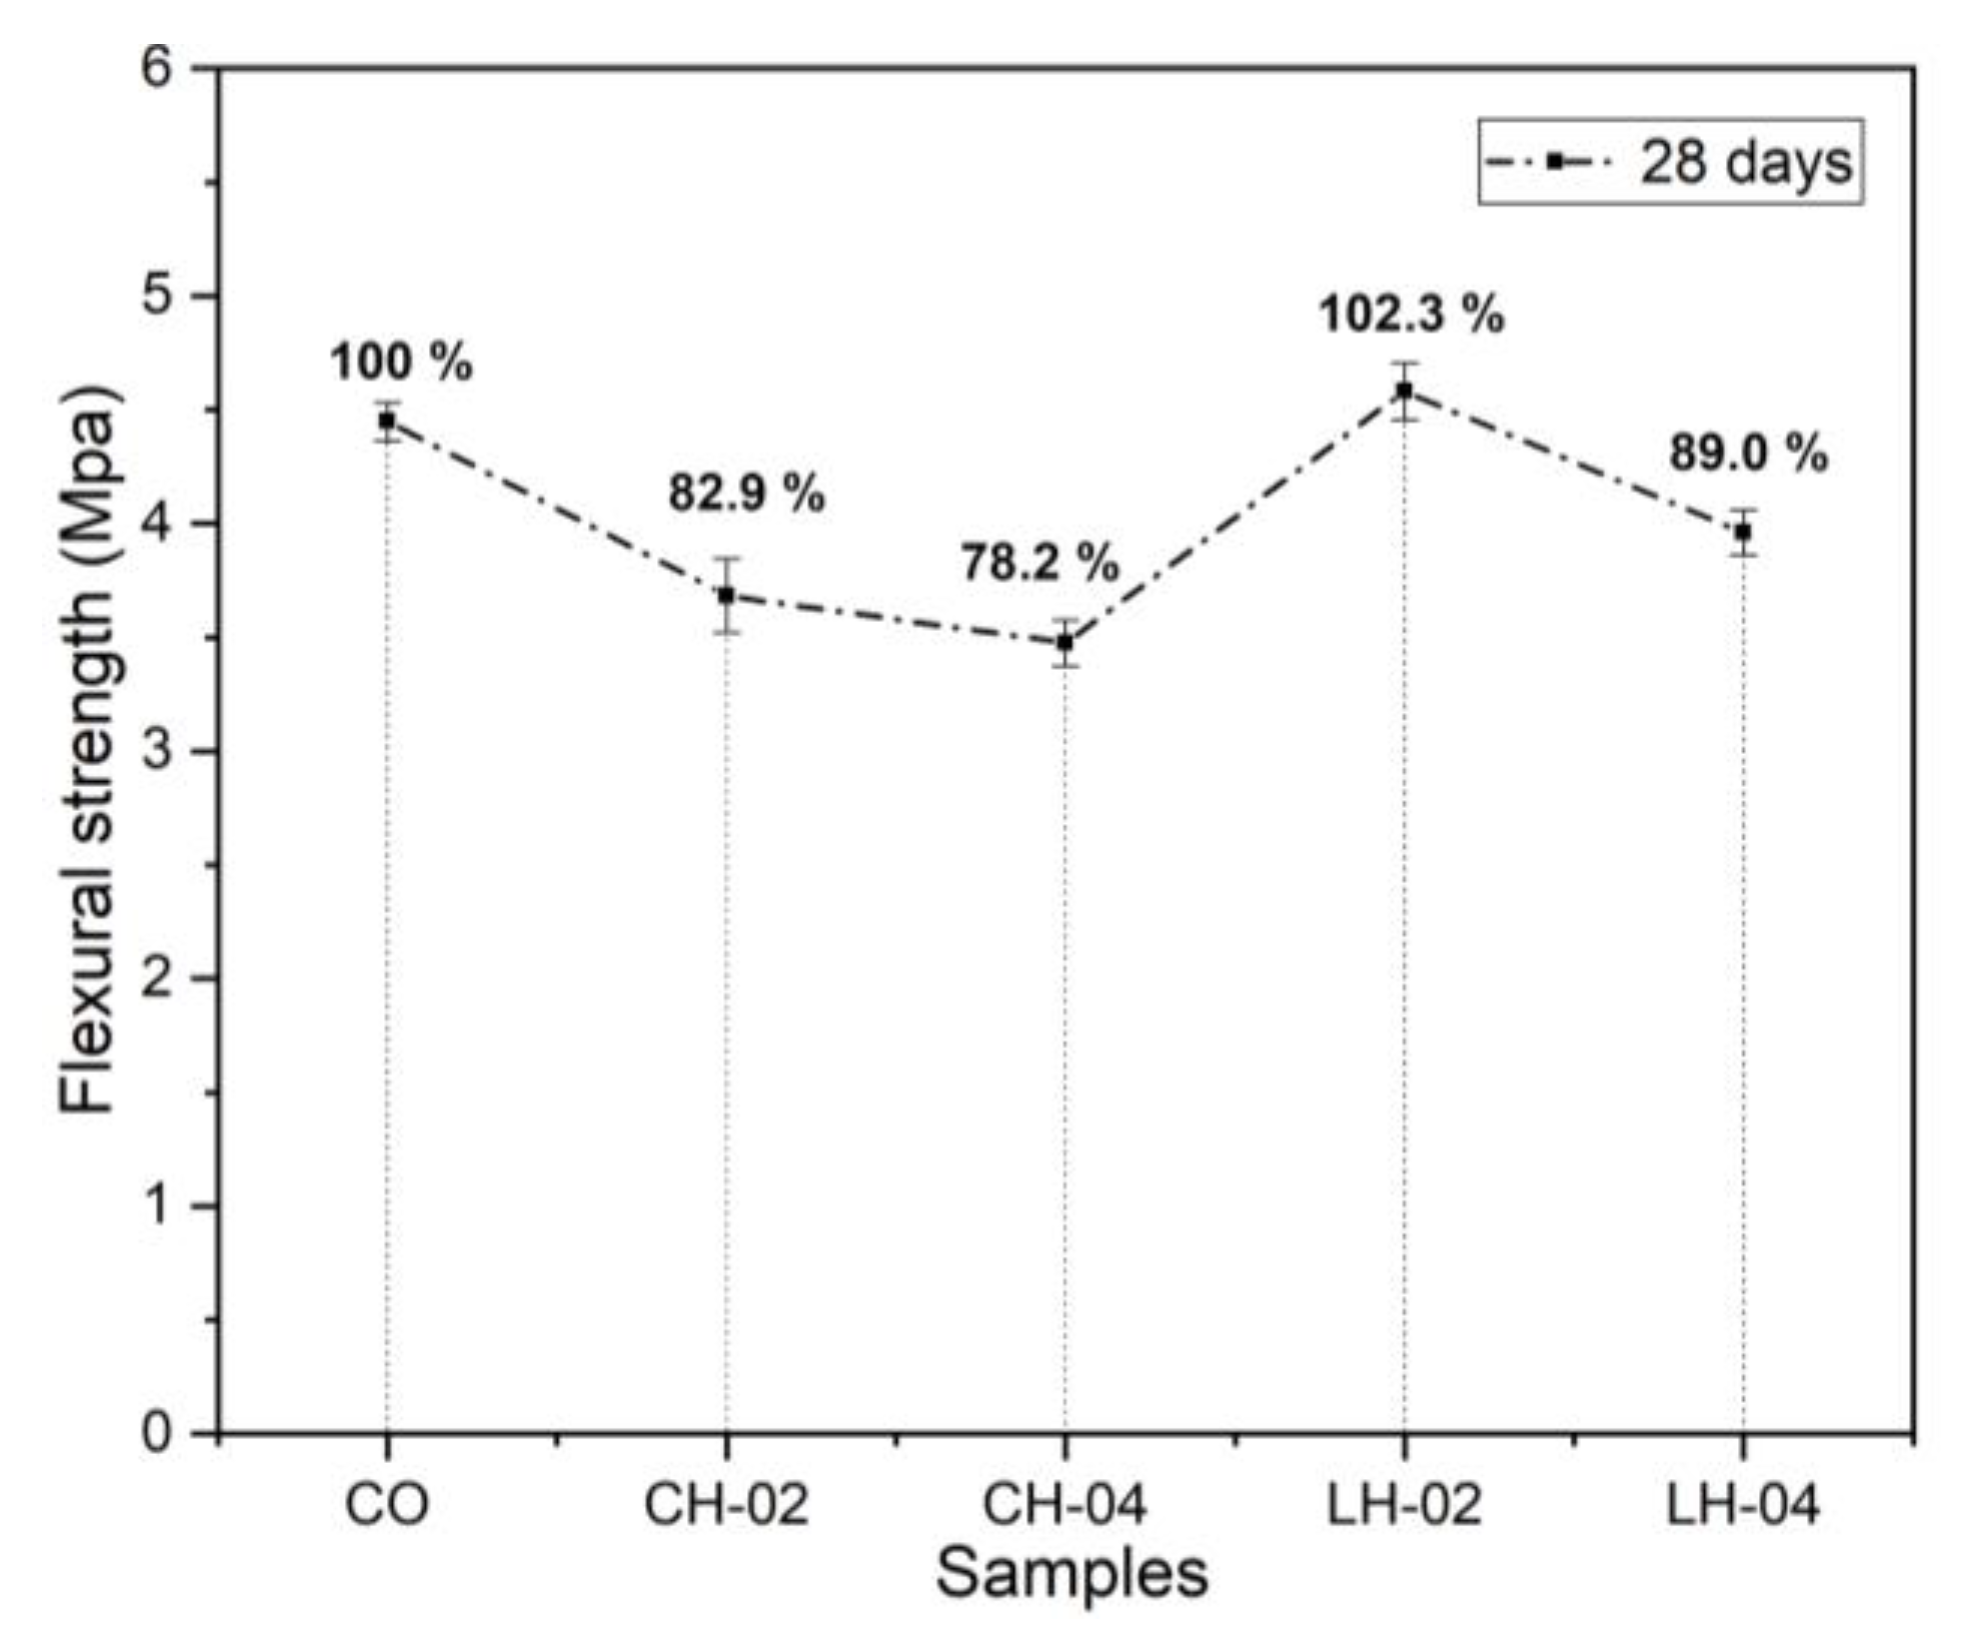
3.4. Flexural Strength
3.5. Half-Cell Potential Measurements
3.6. Electrochemical Noise Measurements
3.7. Linear Polarization Resistance Measurements
3.8. Electrochemical Impedance Spectroscopy Measurements
4. Discussion
4.1. Effect of Slump and Porosity of Concrete with HDPE
4.2. Flexural and Compressive Mechanical Properties of Concrete with HDPE Fibers
4.3. Corrosion of Reinforcing Steel in Concrete with HDPE Fibers
5. Conclusions
- The mechanical properties of the recycled fibers showed a decrease in tensile strength and toughness.
- Cement paste workability diminished with the increase in HDPE fibers of 20 and 35%, with respect to the control sample, from length and the interaction between fibers with aggregates.
- The air content or voids in the mix decreased for fibers with short geometry and less volume due to the fine distribution of polymer particles within the concrete structure. Concrete porosity is directly related to the number of voids; that is, porosity diminishes when fiber volume and particle length are lower.
- For concrete compressive strength, short-length fibers and a 0.2% content with respect to sand are recommended. This is because the sample presents a better mechanical response of 4.8% f’c compared with the control sample, thus retarding the cracking produced from applied stresses during the test.
- A slight 2.3% increase in concrete flexural strength for long fibers and low stress was observed, thus retarding the concrete cracking without a direct relationship to compression properties.
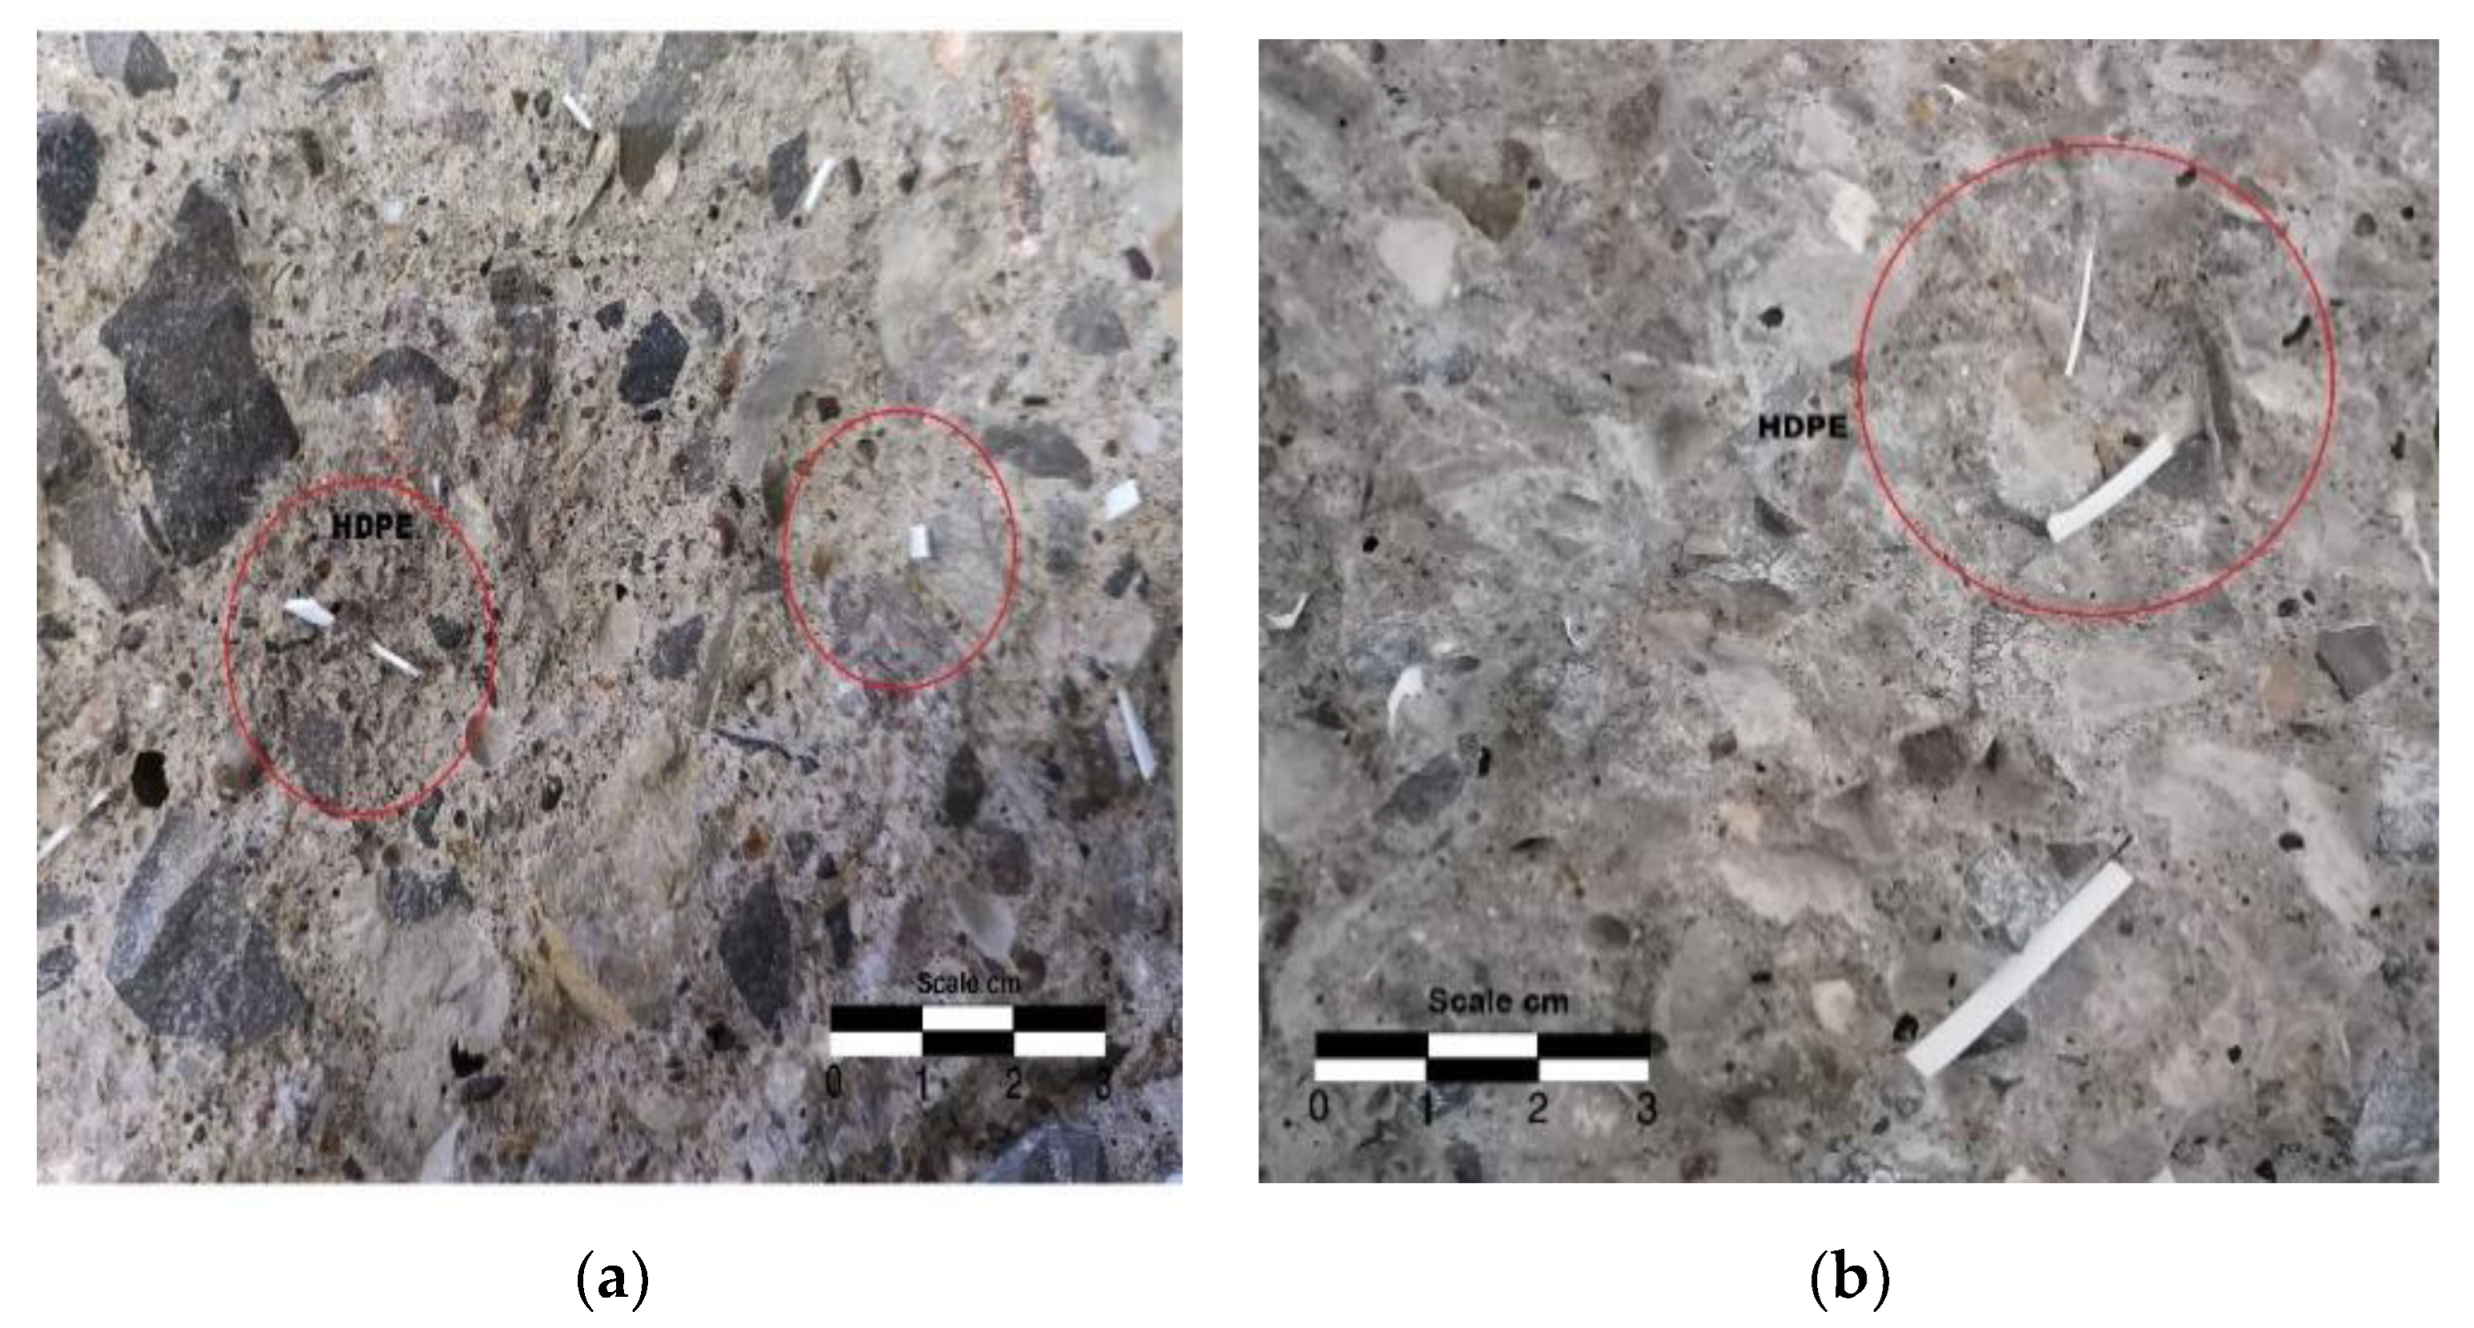
- A fragile adherence in the fiber/cement interface of concrete paste was evidenced by the complete detachment from the cement matrix. The fibers did not present damage or degradation from mechanical tests, and the concrete had high alkalinity and, therefore, longer durability.
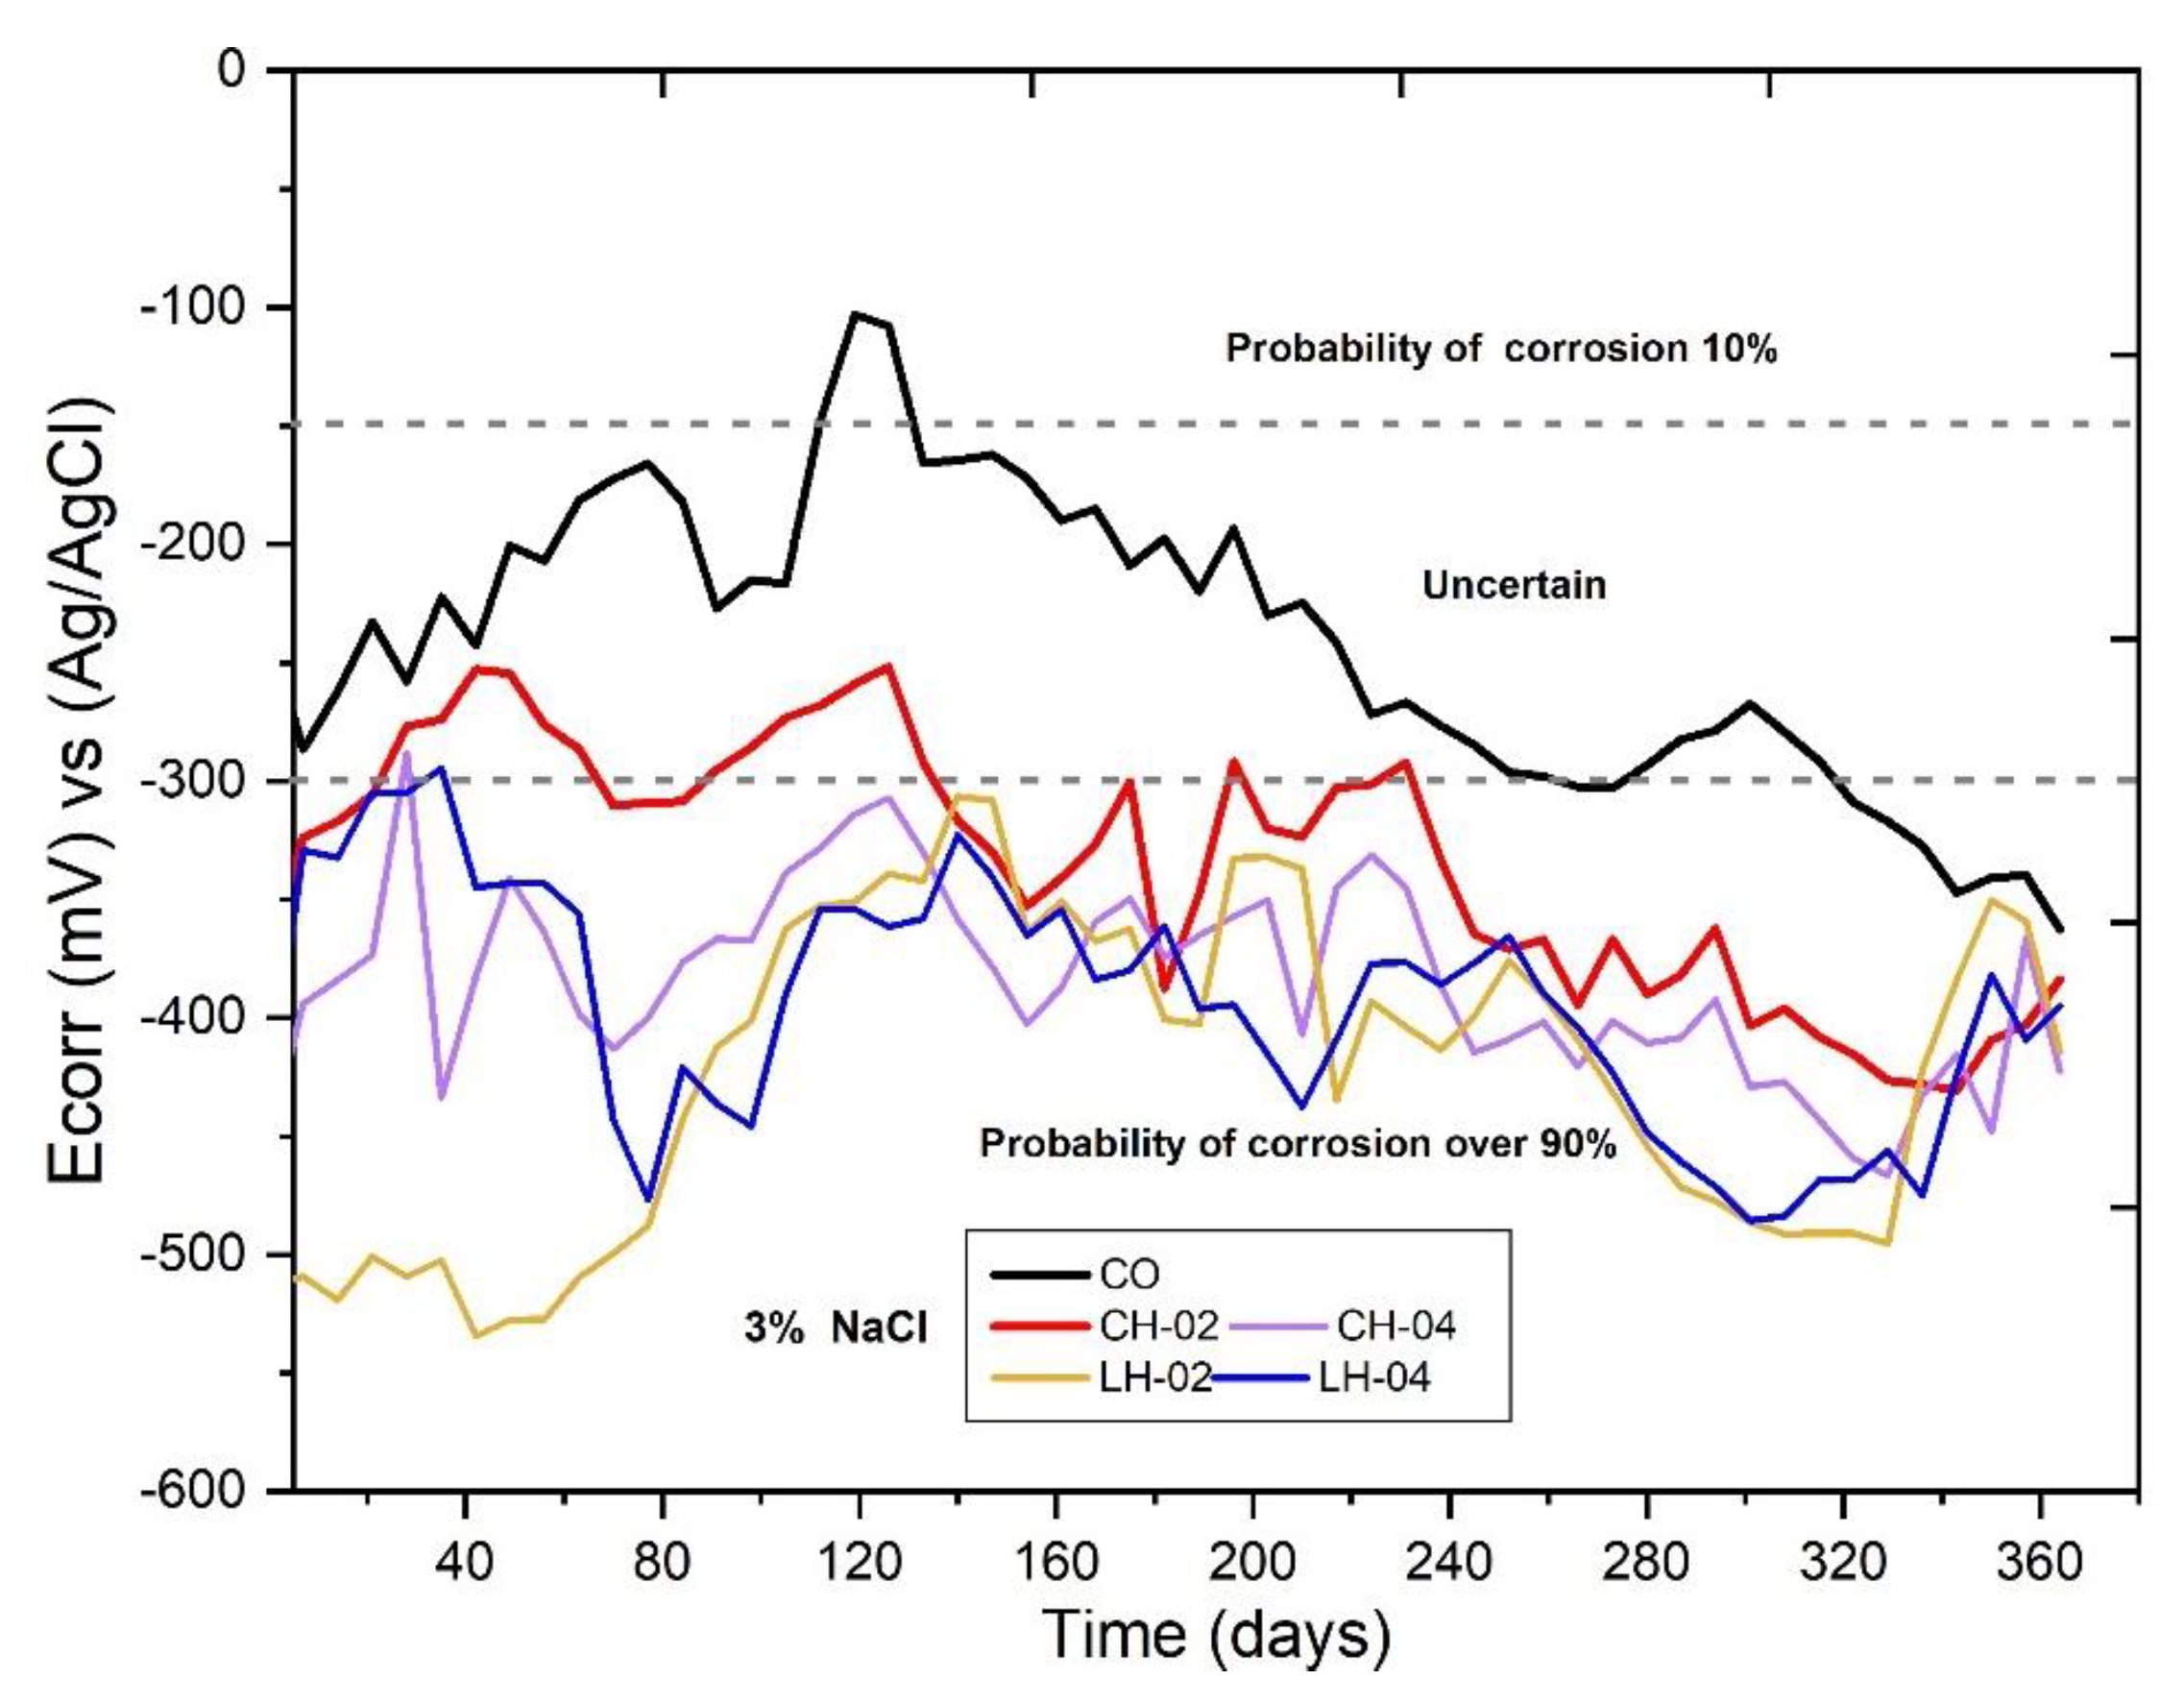
- In the HCP technique, all samples showed a 90% probability of corrosion due to increased corrosion potentials.
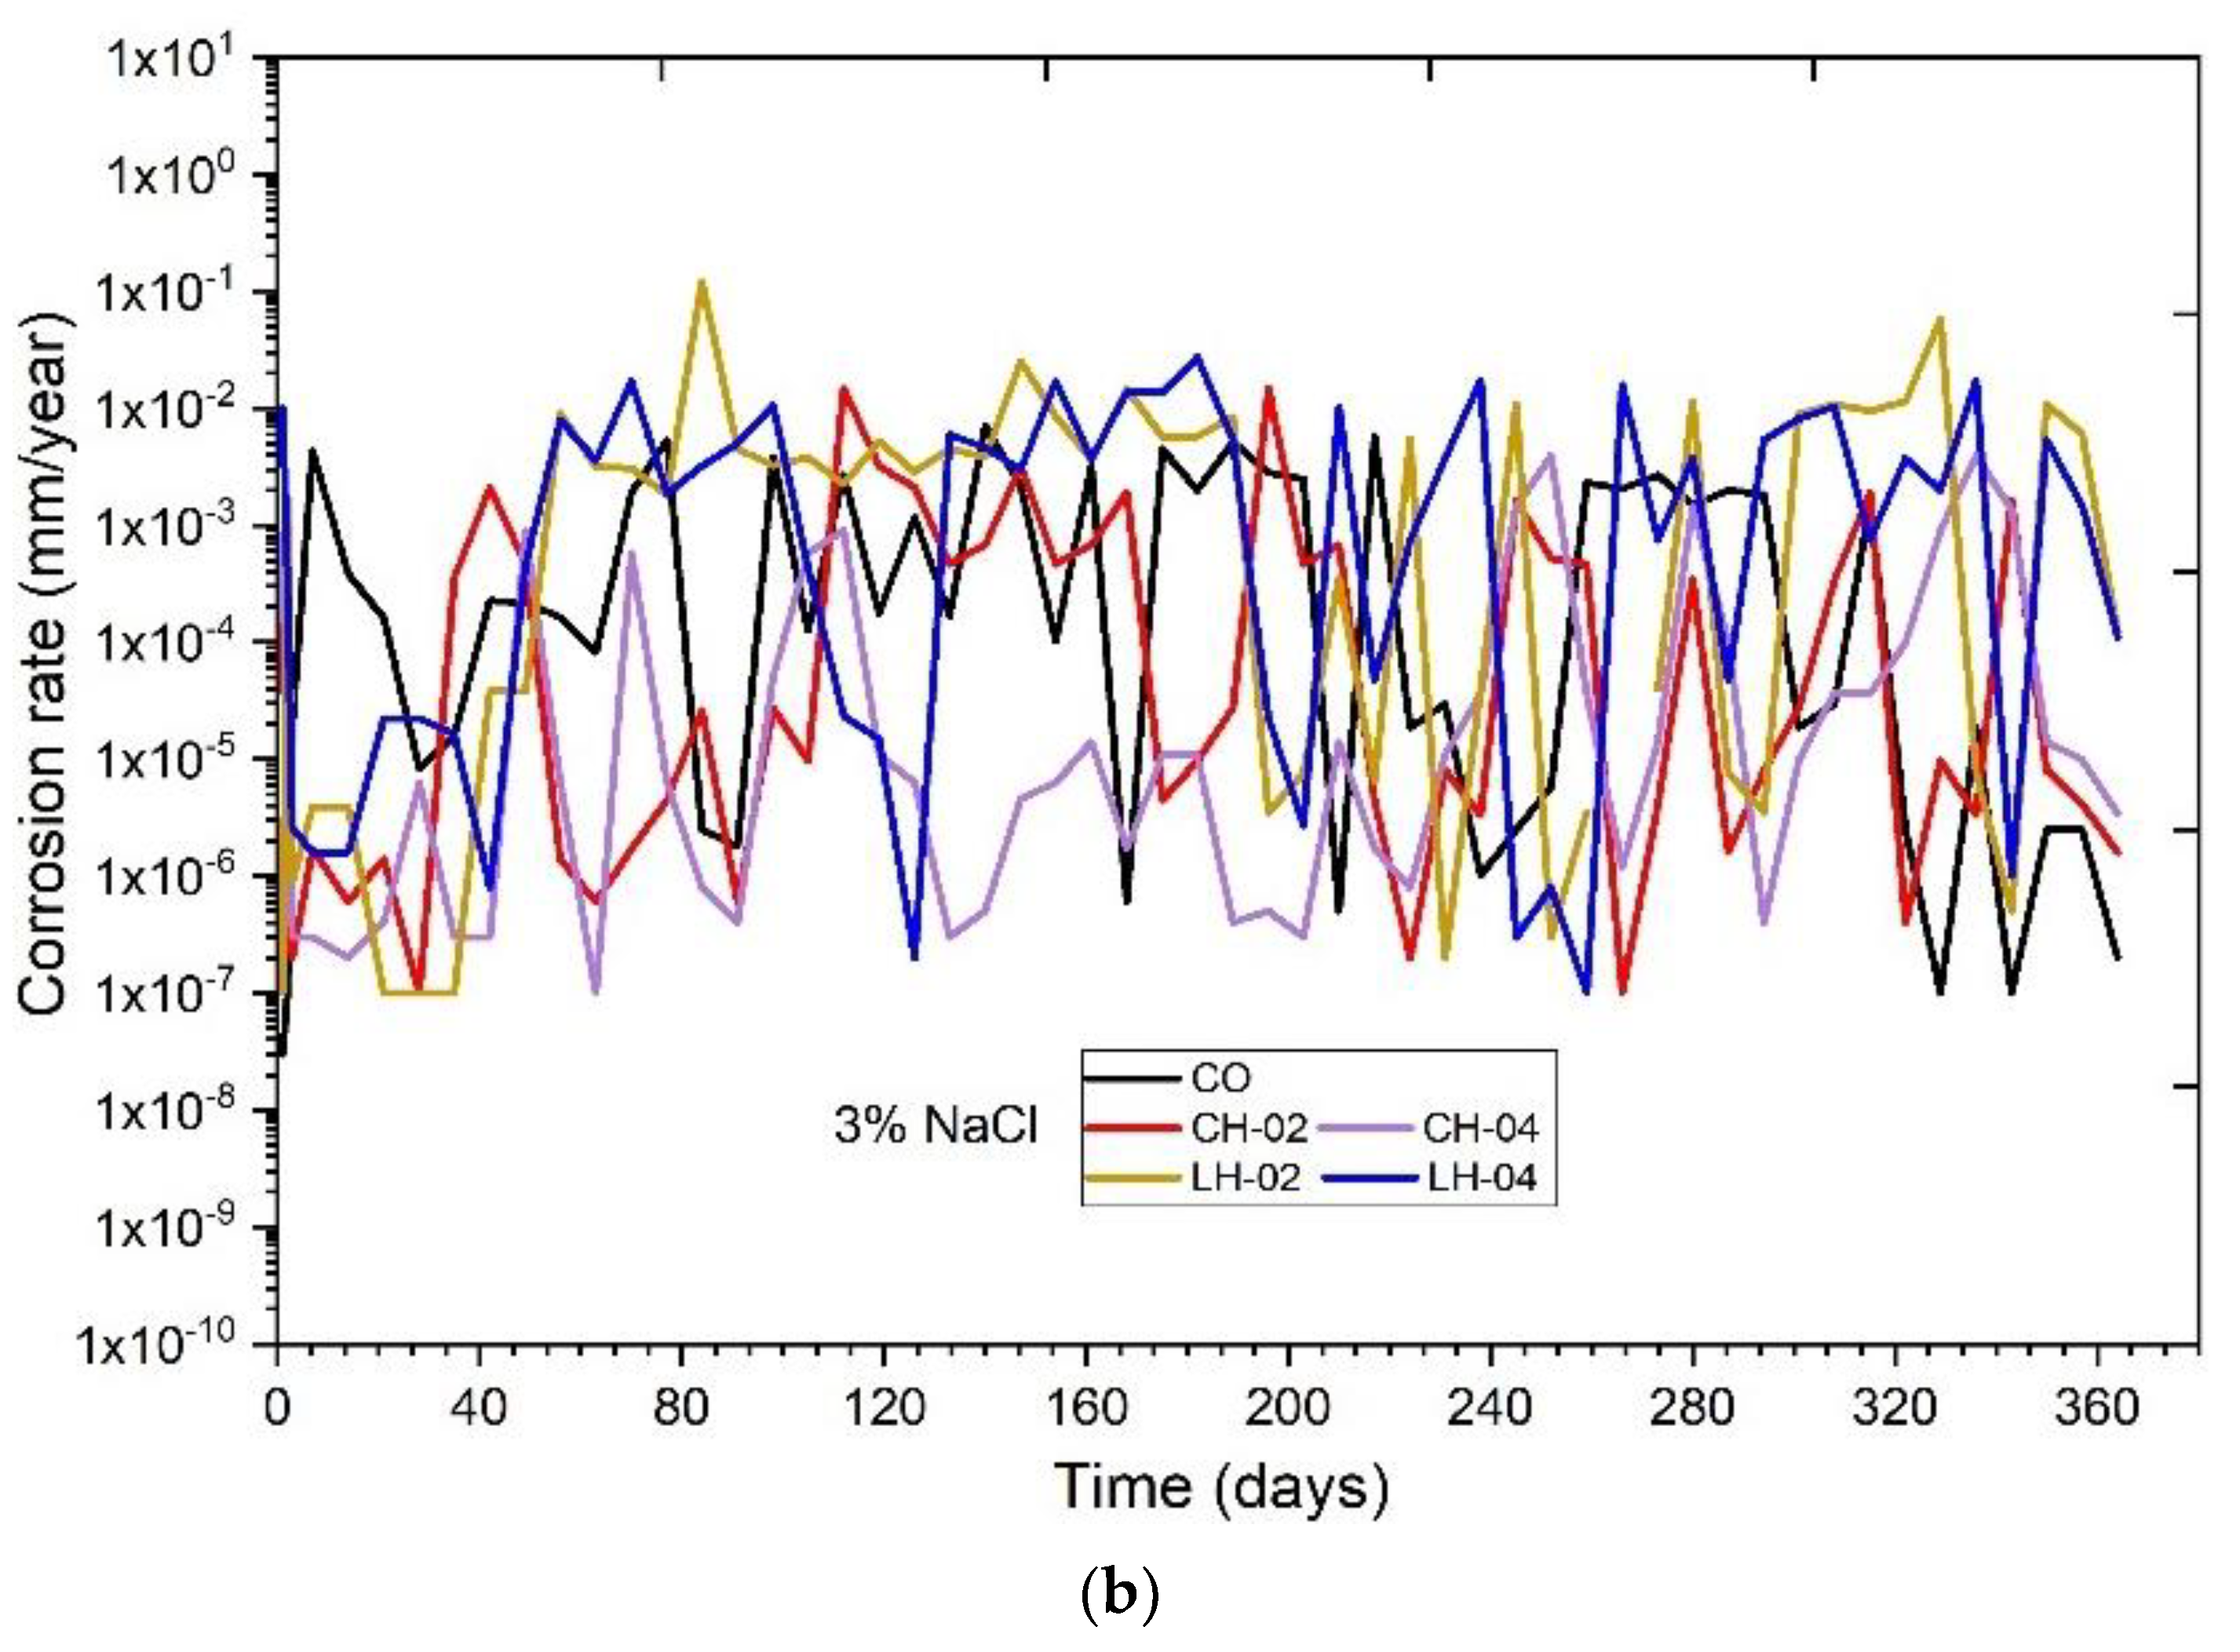
- Samples with short HDPE fiber dimensions showed high and low Rn values between 1 × 10⁵ and 1 × 10¹⁰ Ω·cm2 during the 365 days of exposure, indicating that the steel bars were passivated and depassivated by the interaction between Cl− and localized corrosion.
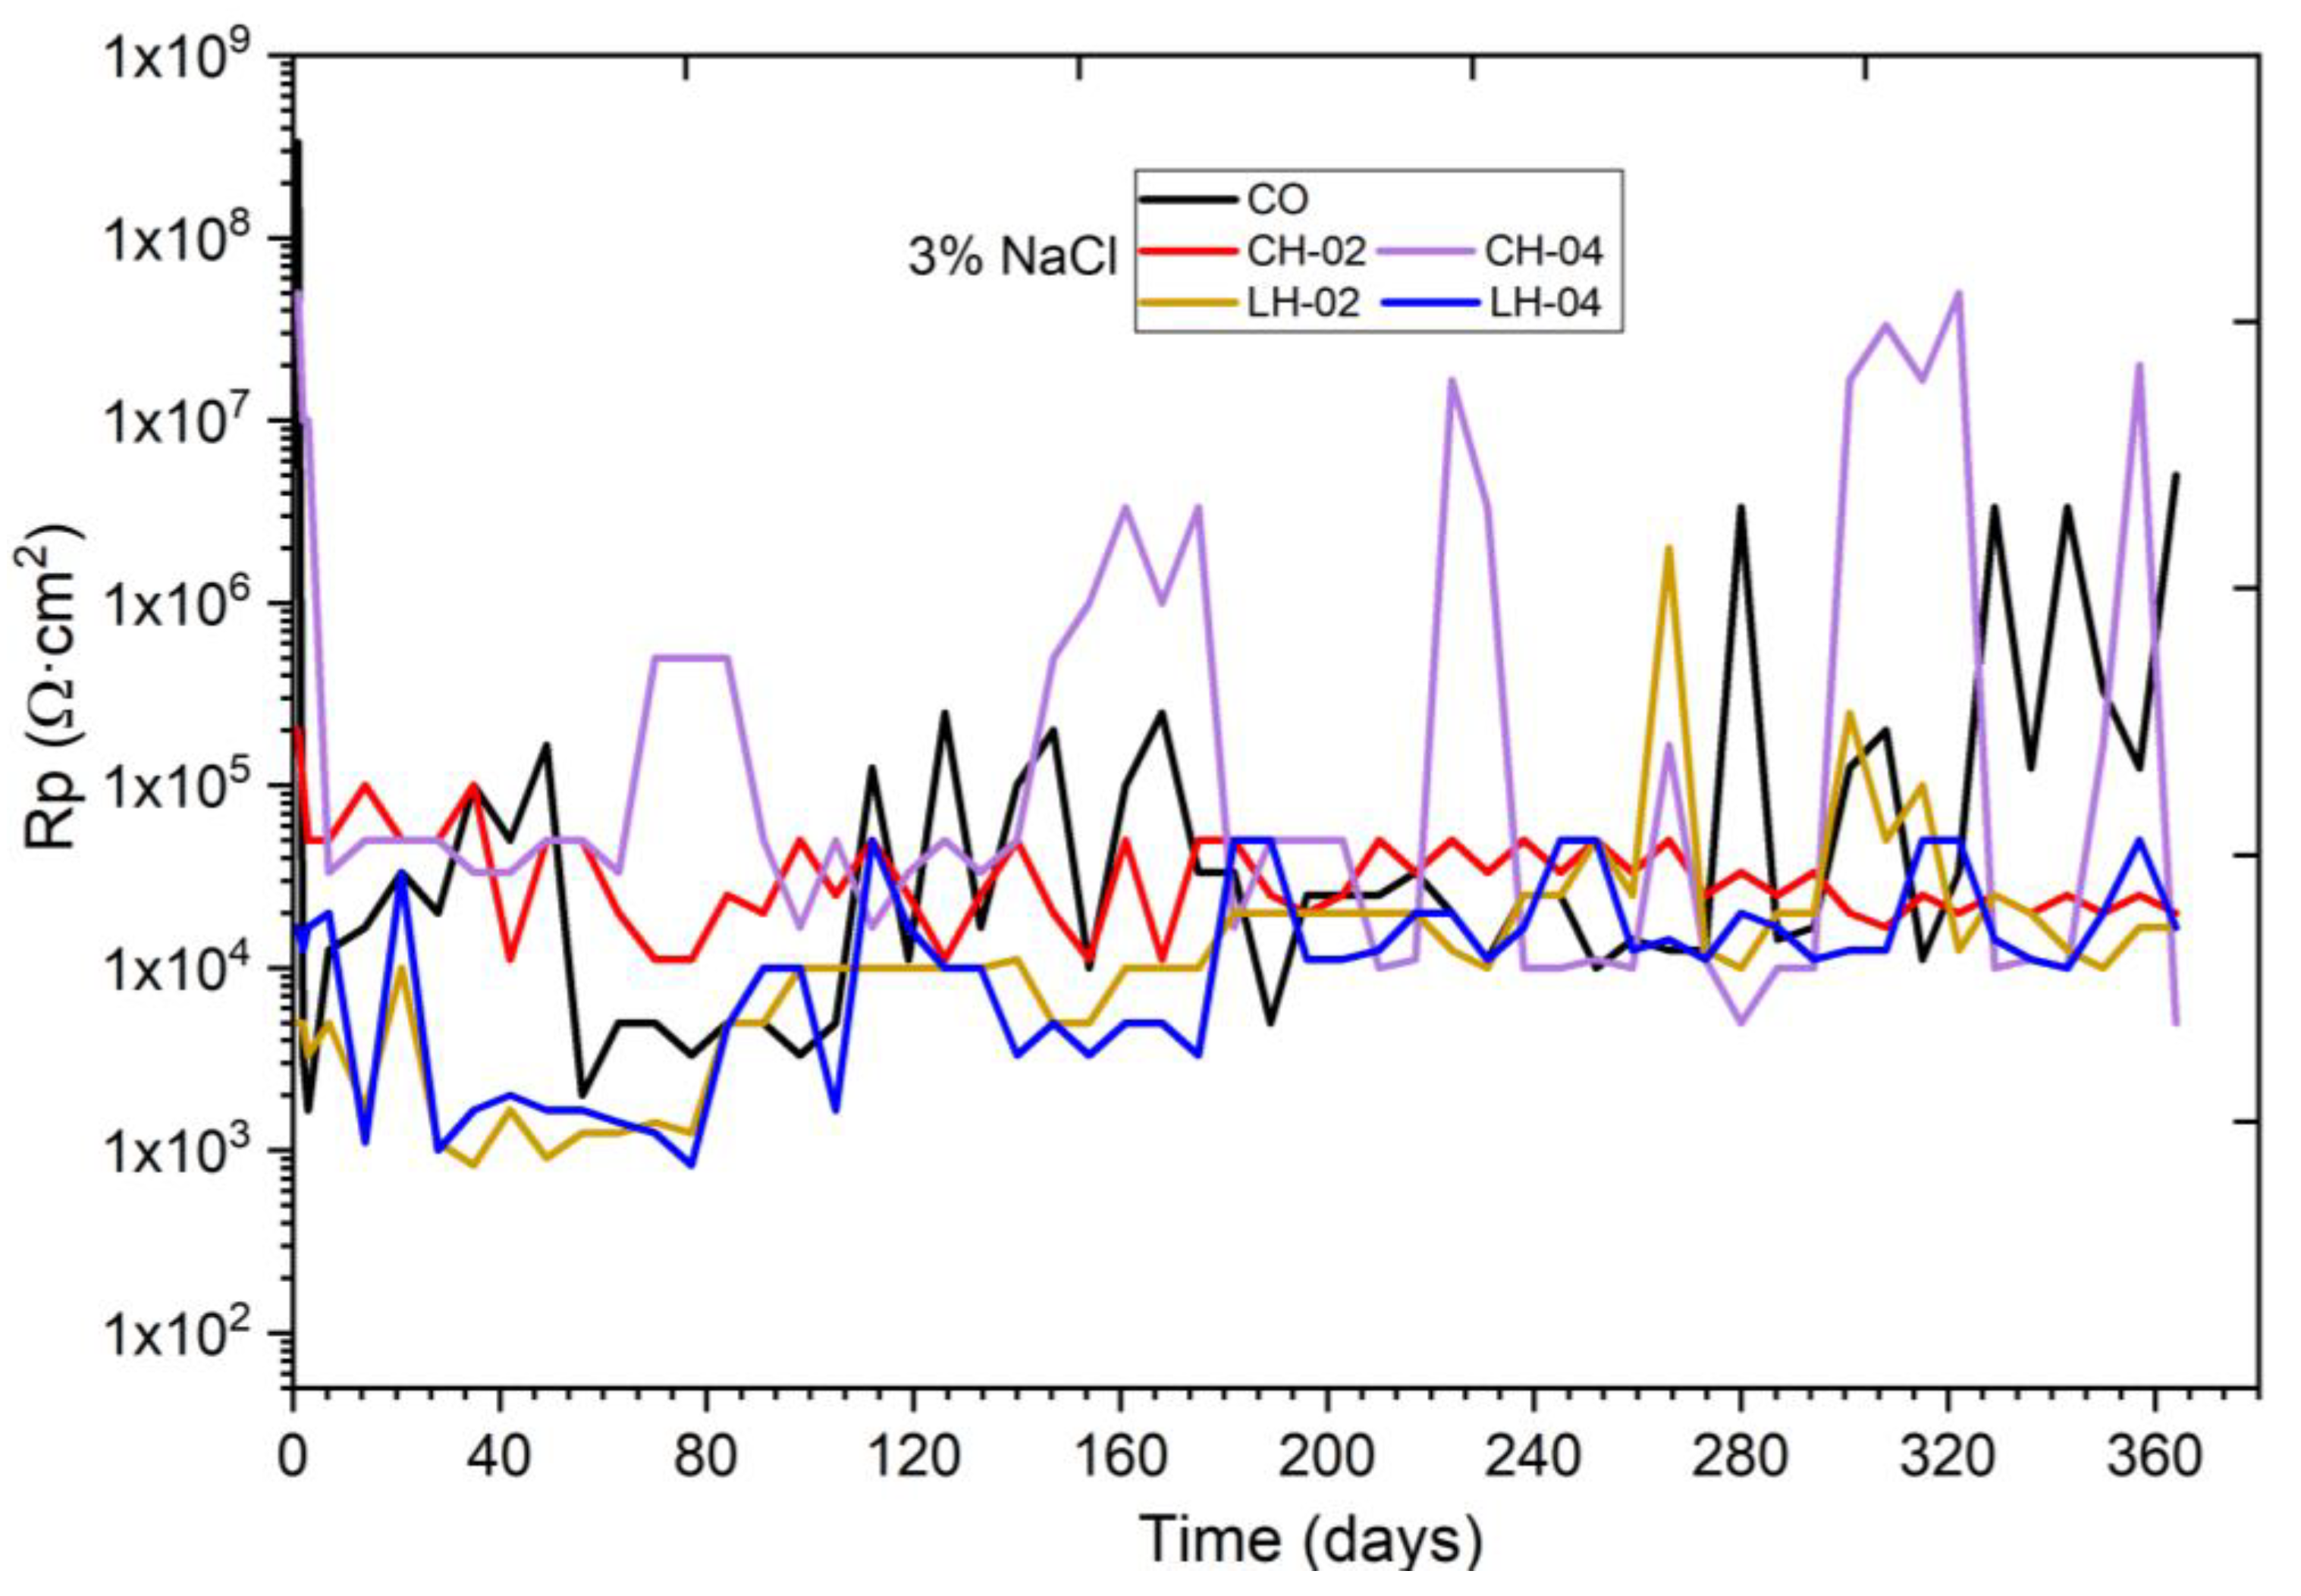
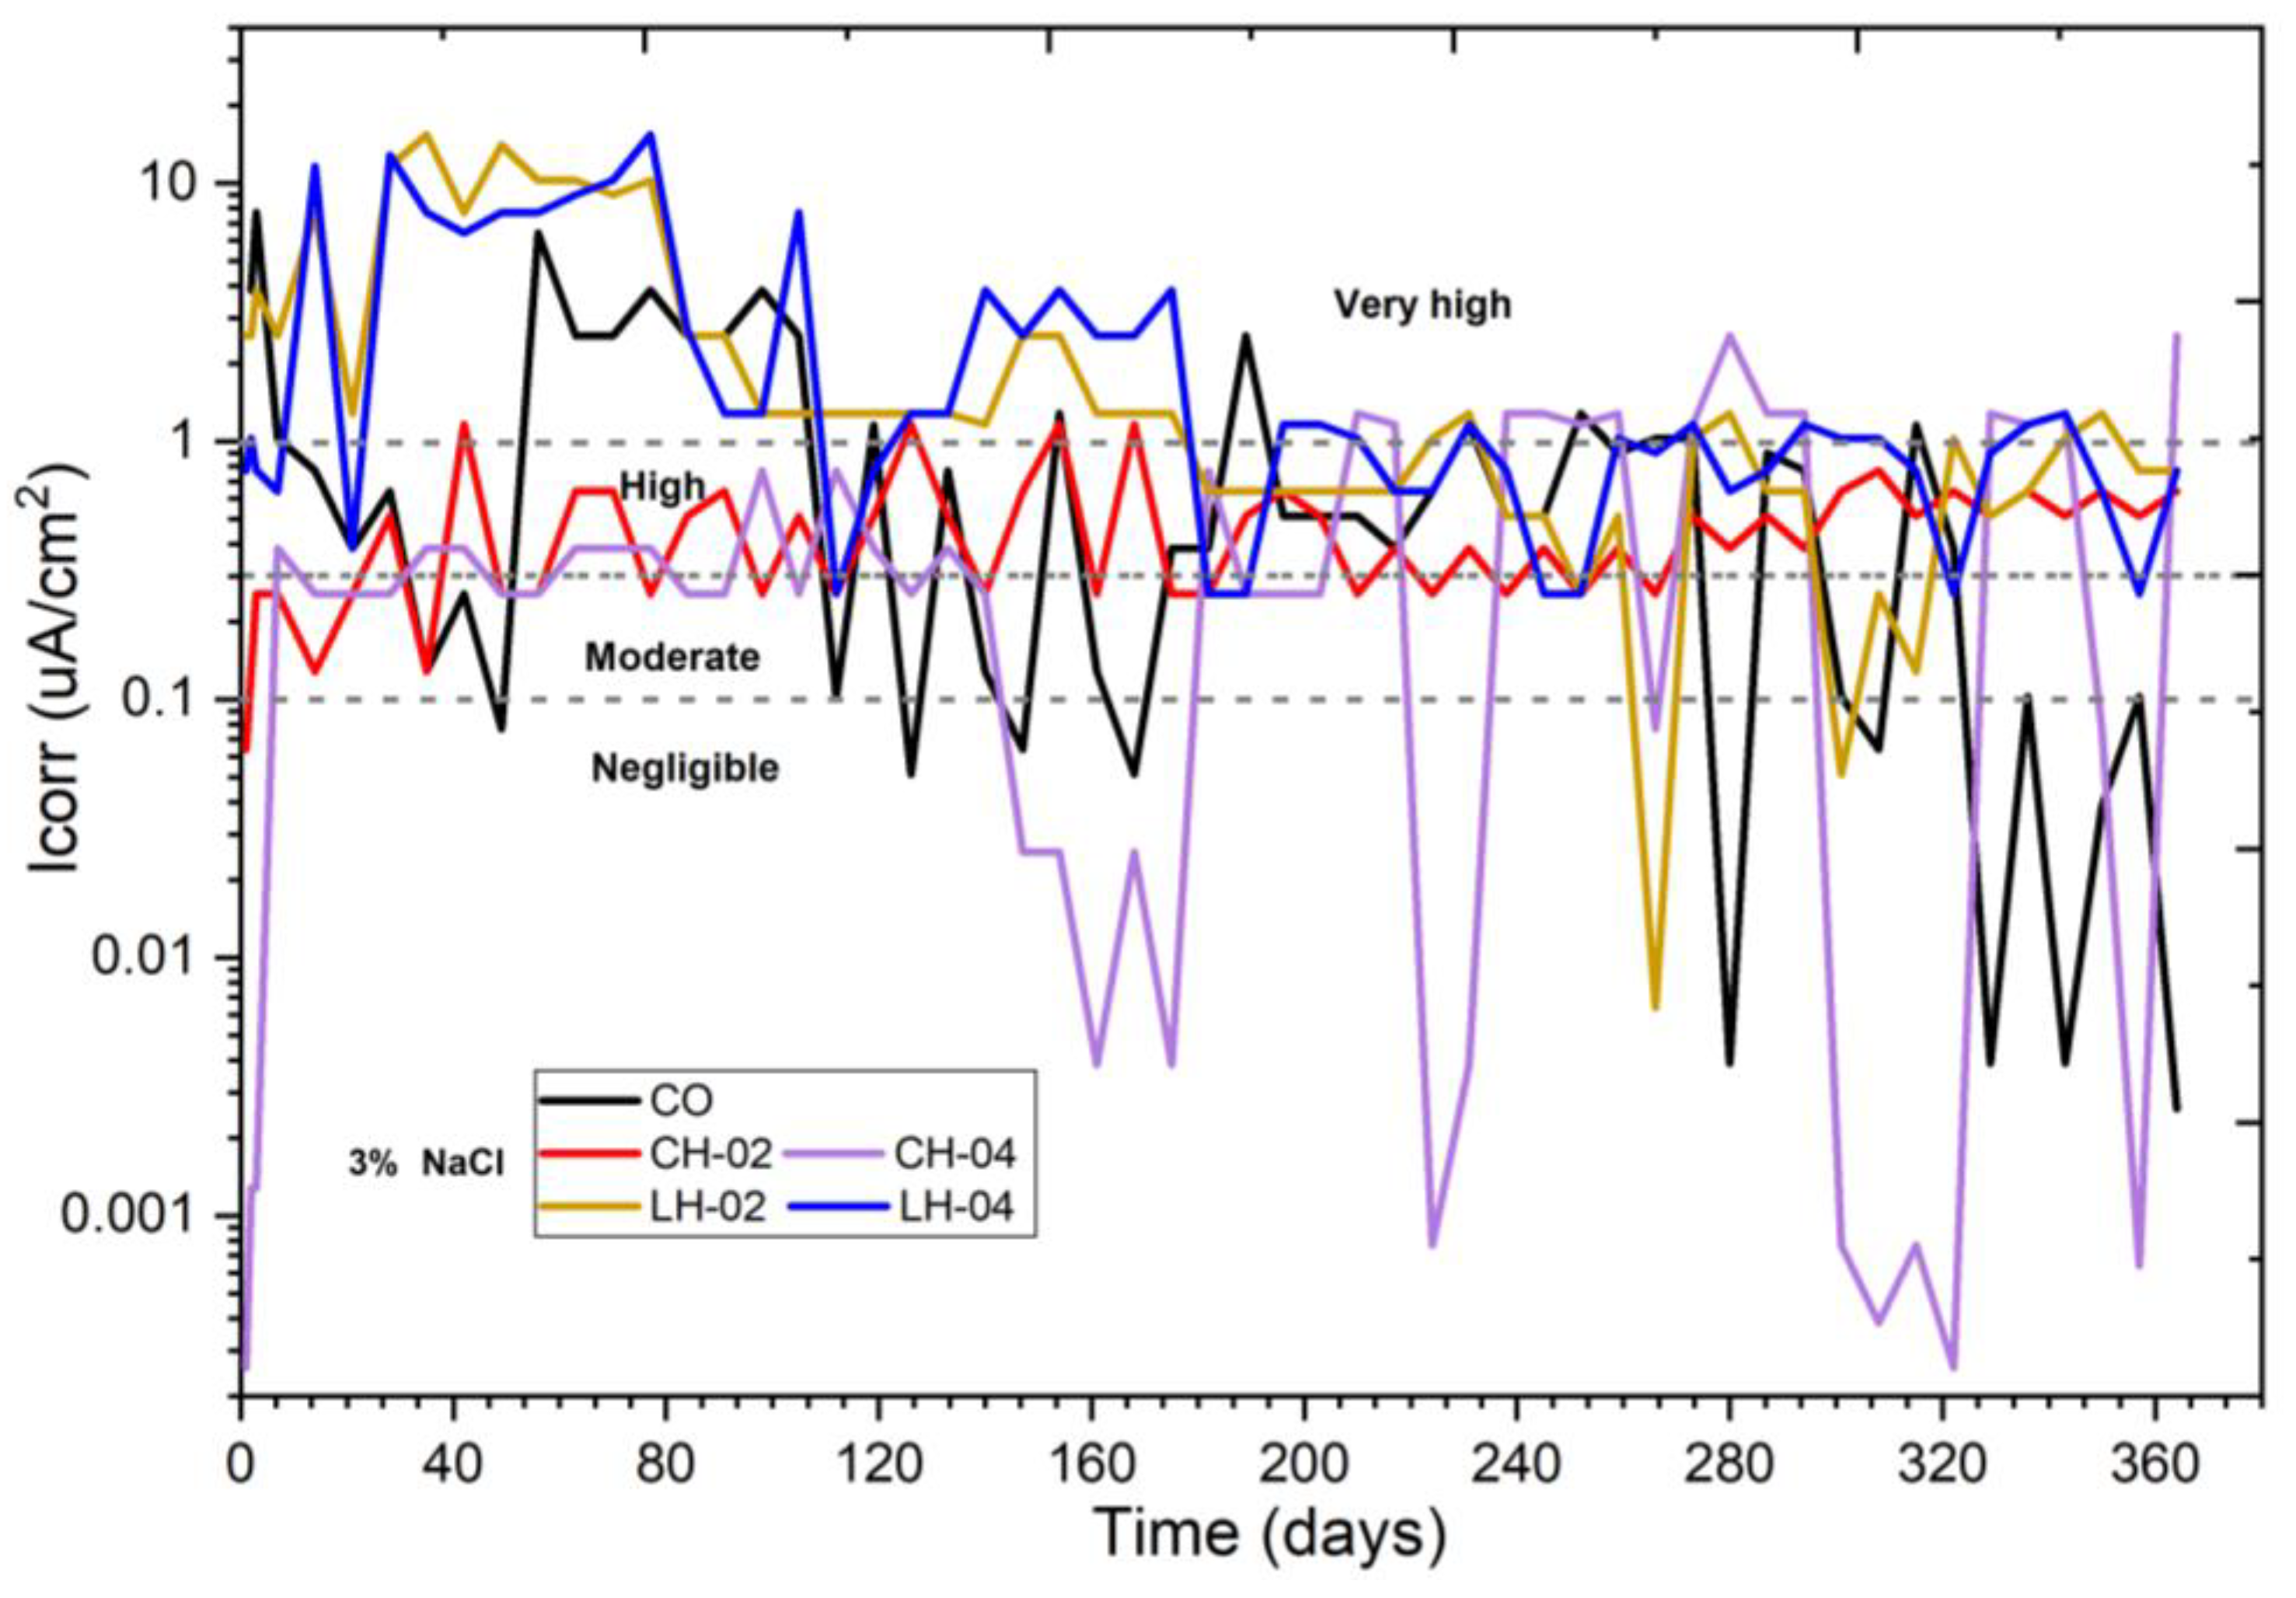
- The short fiber dimension and quantity had a direct influence on the degree of corrosion of the reinforcing bars in the concrete, presenting high Rp values and suggesting a concrete lifetime between high and negligible.
- The short fiber dimension and quantity had a direct influence on the degree of corrosion of the reinforcing bars in the concrete, presenting high Rp values and suggesting a high concrete lifetime.
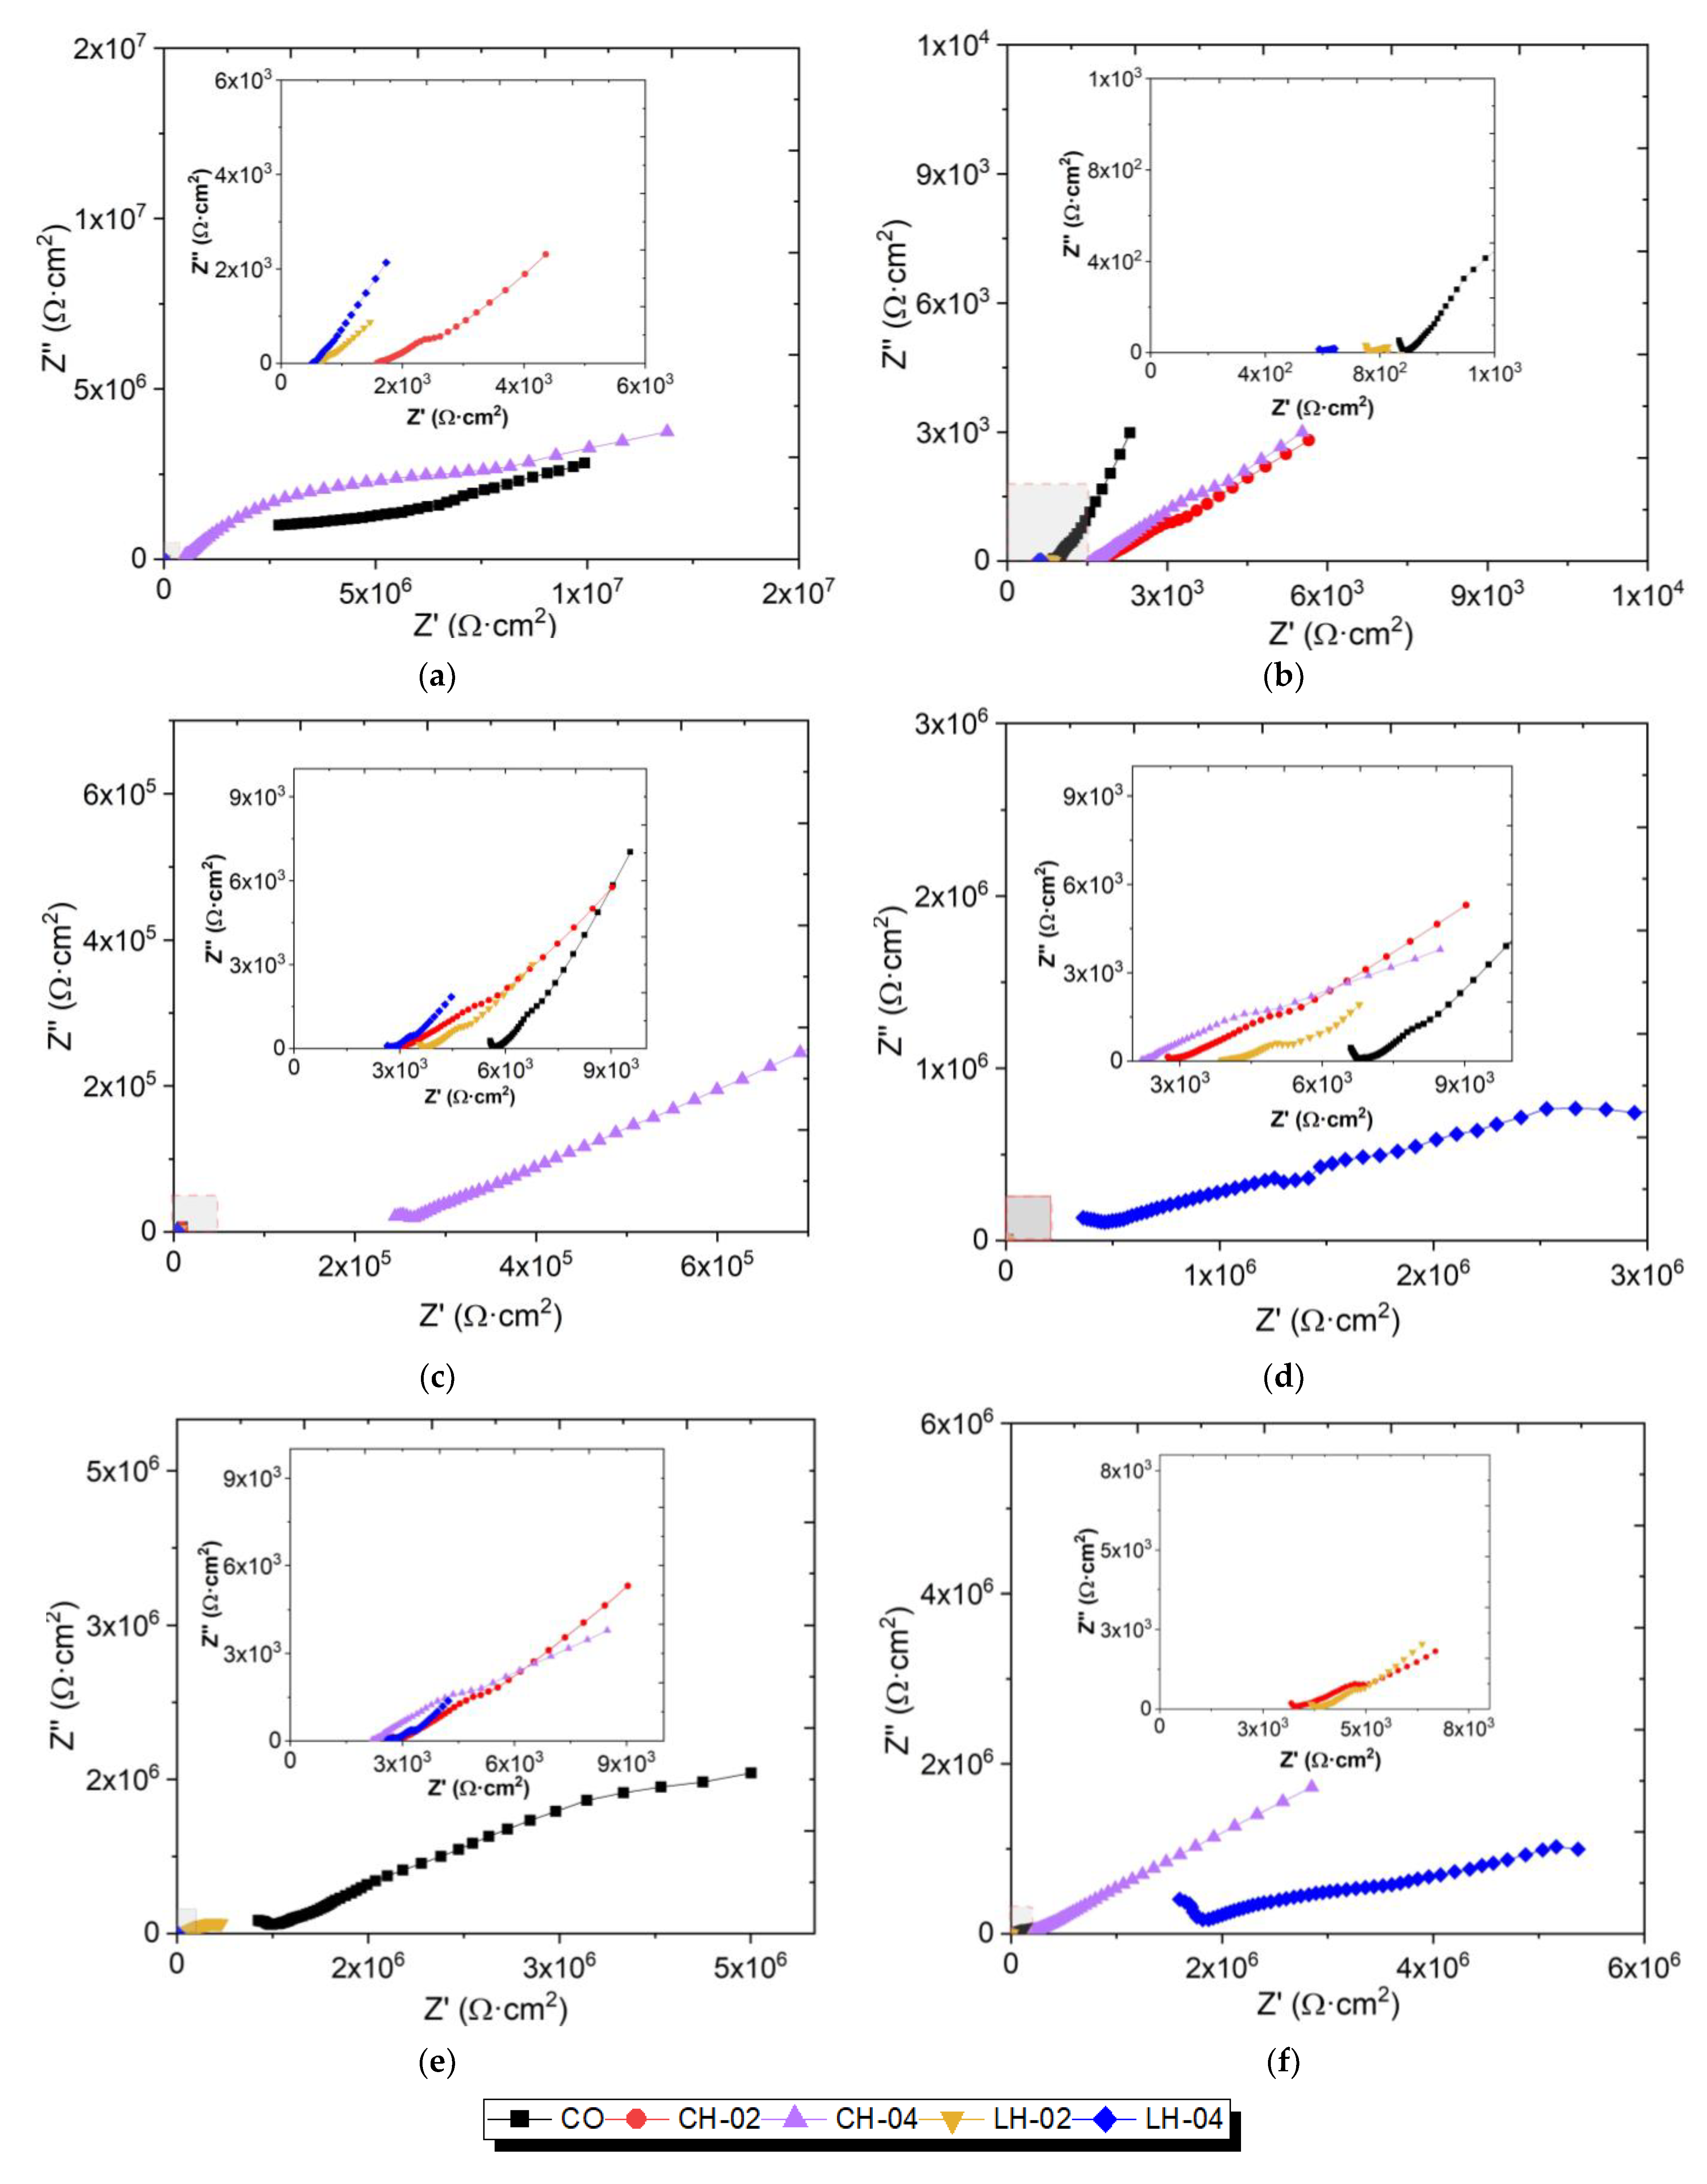
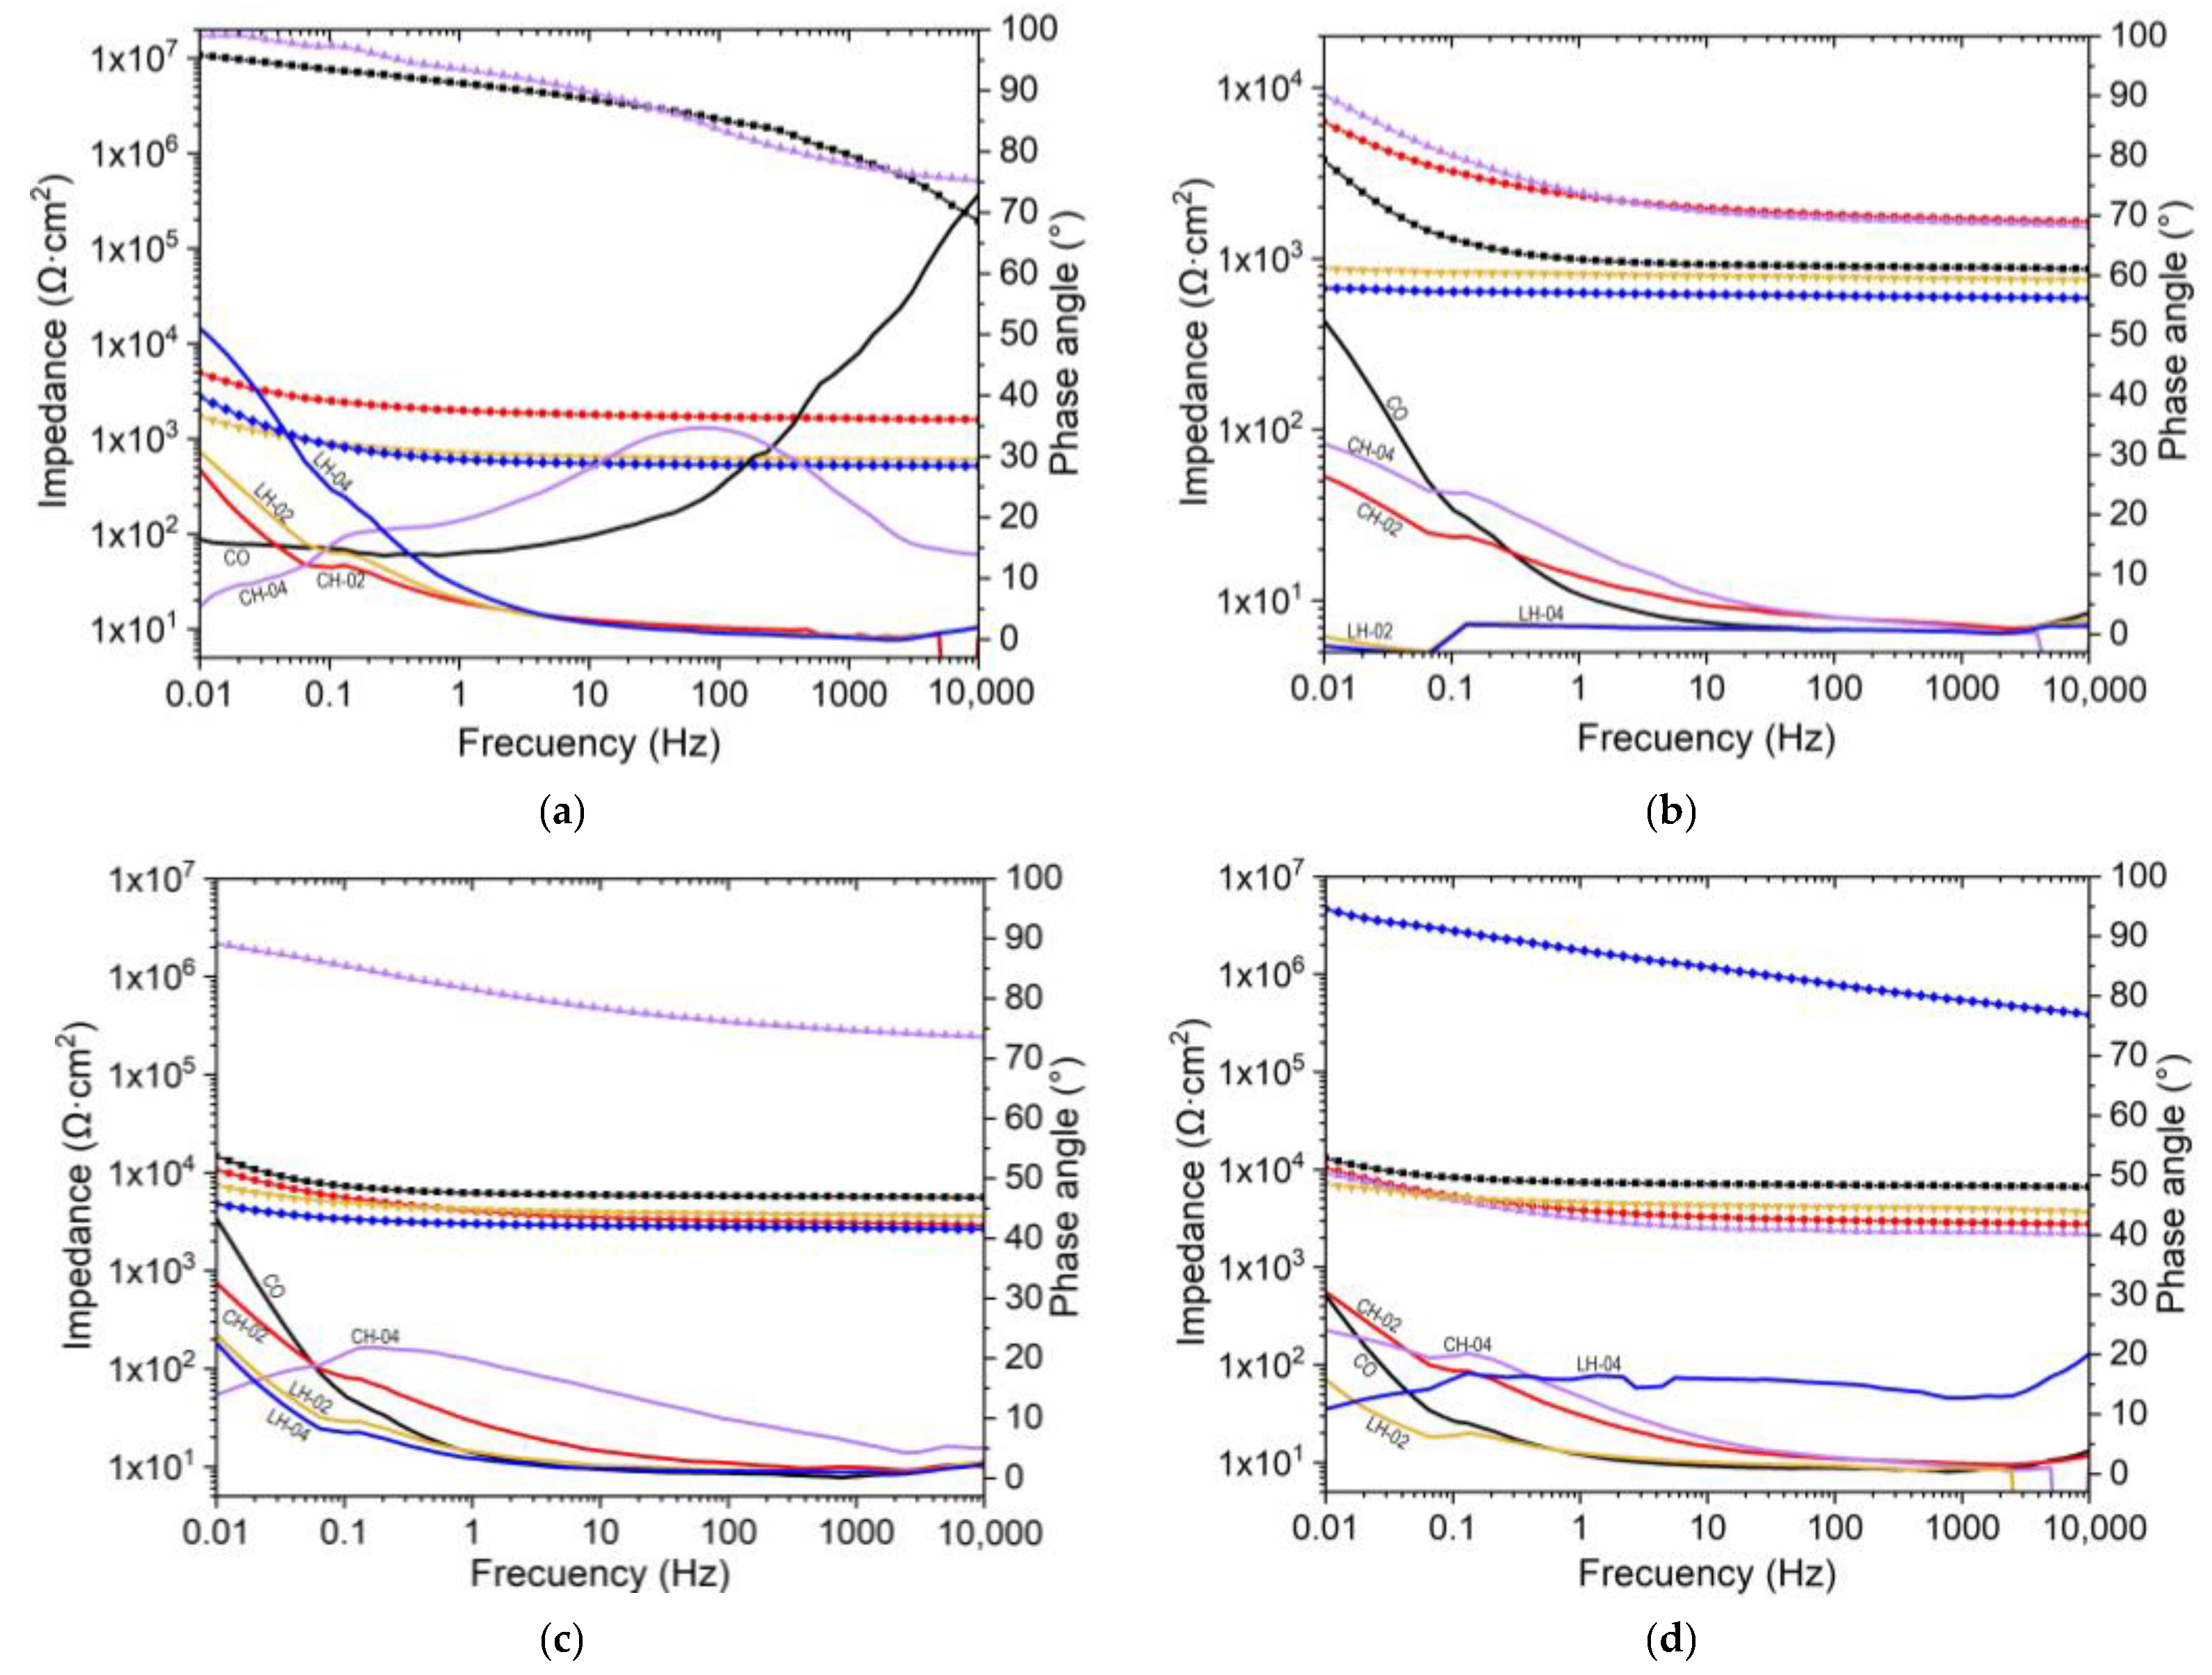
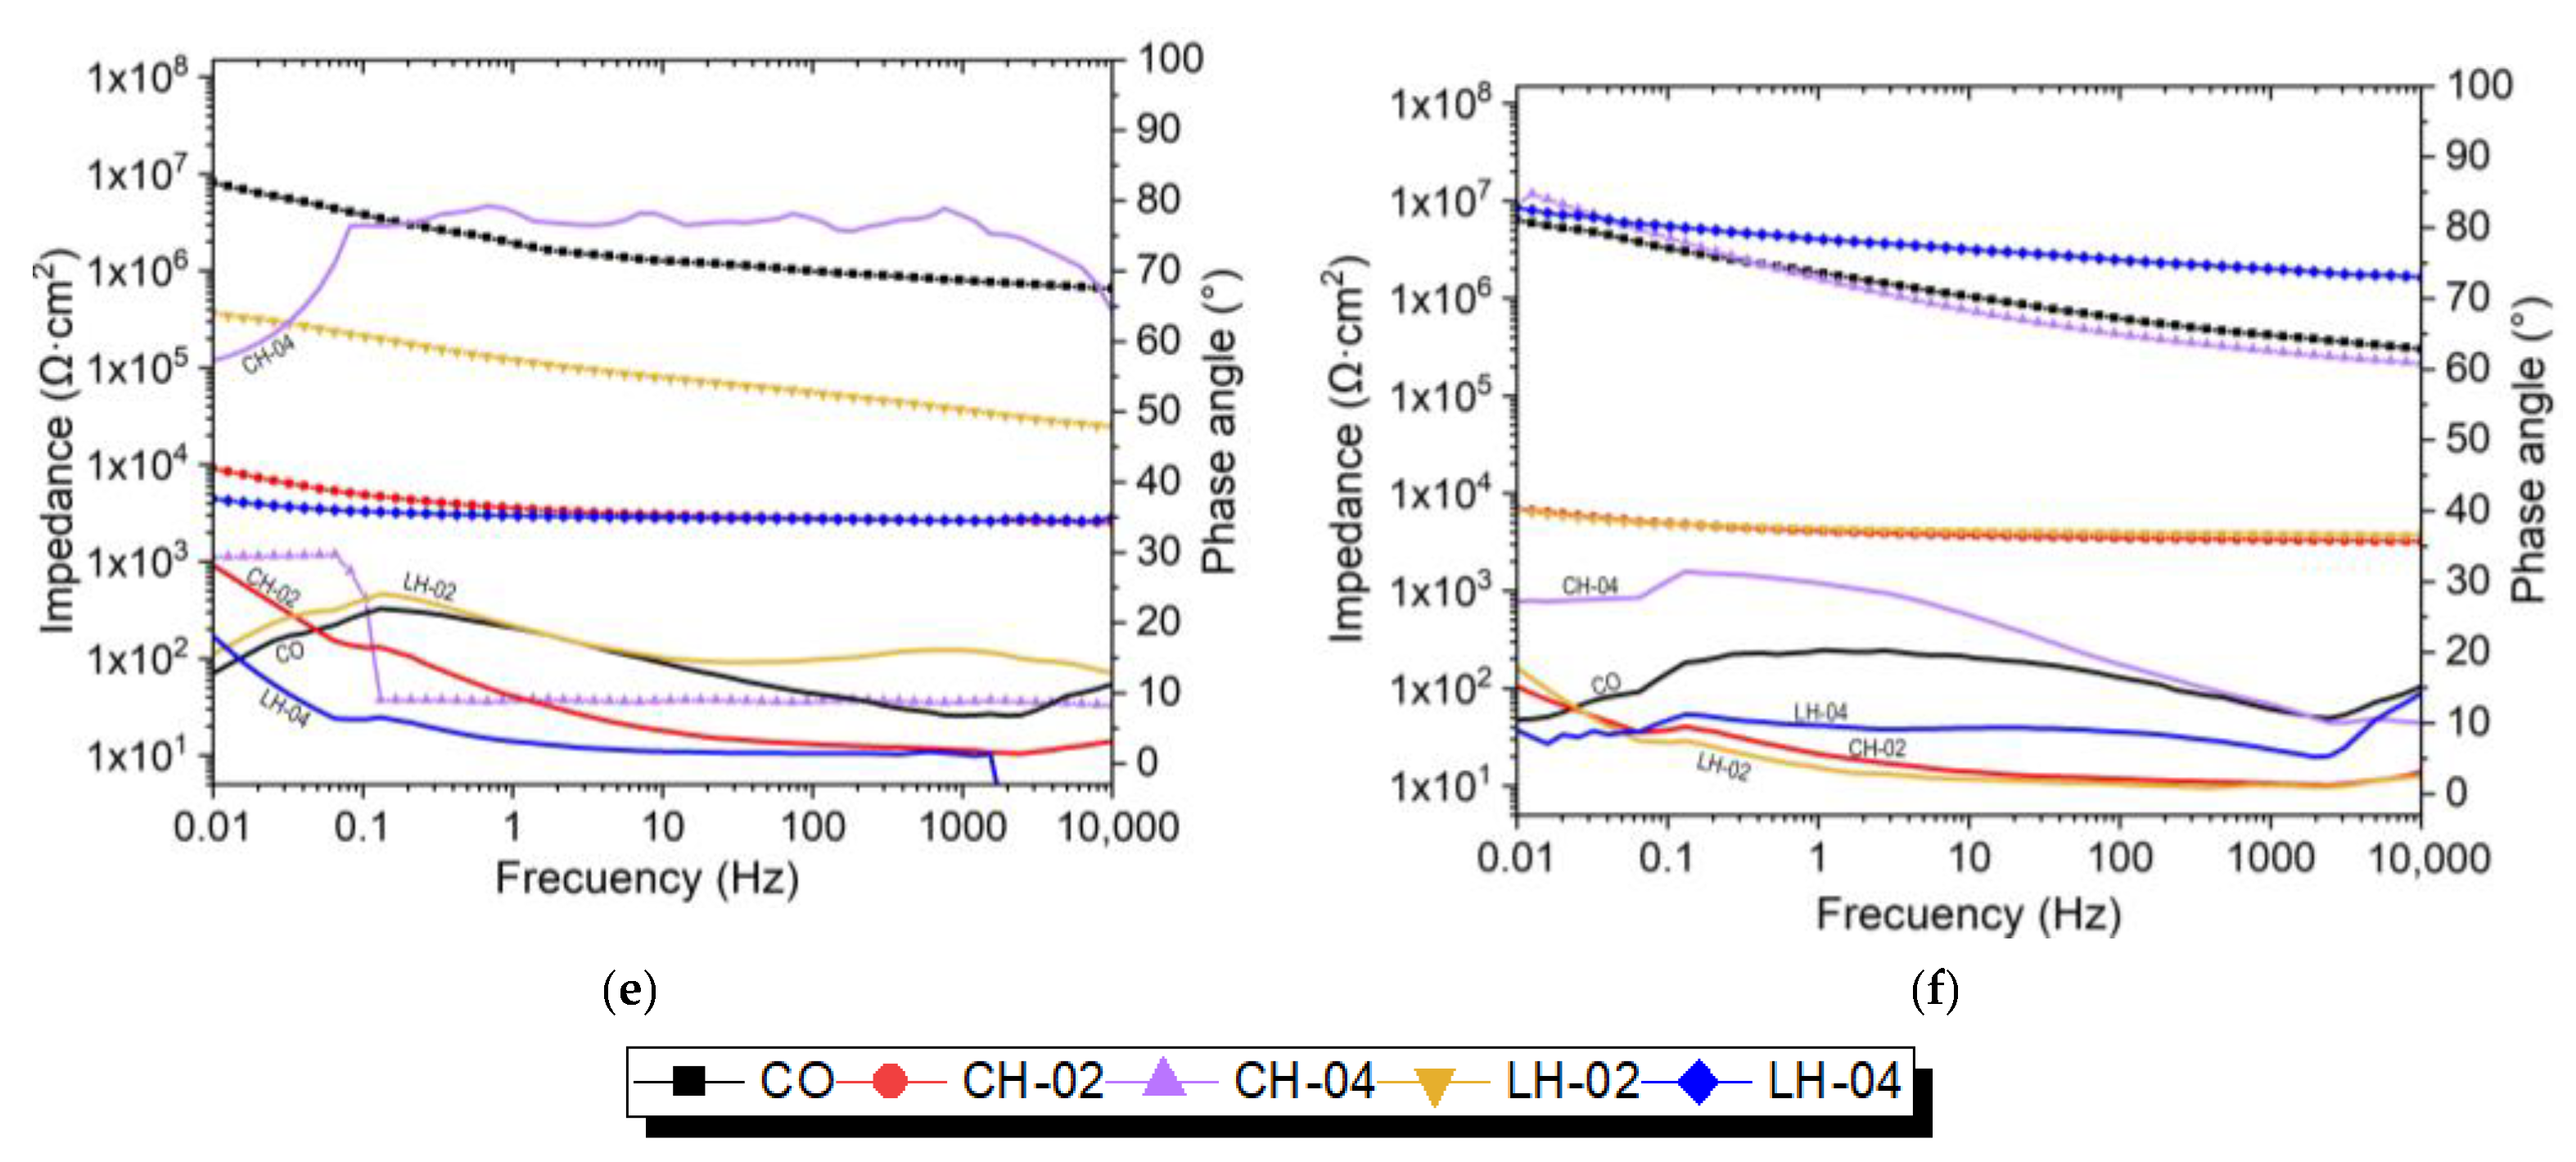
- In the low-frequency EIS technique, all samples were observed to be diffusion-controlled due to Cl− at the steel/concrete interface.
6. Recommendations
Author Contributions
Funding
Data Availability Statement
Acknowledgments
Conflicts of Interest
References
- Tittarelli, F.; Moriconi, G. The effect of silane-based hydrophobic admixture on corrosion of reinforcing steel in concrete. Cem. Concr. Res. 2008, 38, 1354–1357. [Google Scholar] [CrossRef]
- Mi, T.; Wang, J.J.; McCague, C.; Bai, Y. Application of Raman Spectroscopy in the study of the corrosion of steel reinforcement in concrete: A critical review. Cem. Concr. Compos. 2023, 143, 105231. [Google Scholar] [CrossRef]
- Gartner, N.; Kosec, T.; Legat, A. Monitoring the corrosion of steel in concrete exposed to a marine environment. Materials 2020, 13, 407. [Google Scholar] [CrossRef] [PubMed]
- Cai, R.; Han, T.; Liao, W.; Huang, J.; Li, D.; Kumar, A.; Ma, H. Prediction of surface chloride concentration of marine concrete using ensemble machine learning. Cem. Concr. Res. 2020, 136, 106164. [Google Scholar] [CrossRef]
- Obot, I.B.; Onyeachu, I.B.; Zeino, A.; Umoren, S.A. Electrochemical noise (EN) technique: Review of recent practical applications to corrosion electrochemistry research. J. Adhes. Sci. Technol. 2019, 33, 1453–1496. [Google Scholar] [CrossRef]
- Li, P.; Wang, X.; Su, M.; Zou, X.; Duan, L.; Zhang, H. Characteristics of plastic pollution in the environment: A review. Bull. Environ. Contam. Toxicol. 2021, 107, 577–584. [Google Scholar] [CrossRef] [PubMed]
- Frías, A.C.; Lema, I.I.; García, A.G. La situación de los envases de plástico en México. Gac. Ecol. 2003, 69, 67–82. [Google Scholar]
- Bond, T.; Ferrandiz-Mas, V.; Felipe-Sotelo, M.; Van Sebille, E. The occurrence and degradation of aquatic plastic litter based on polymer physicochemical properties: A review. Crit. Rev. Environ. Sci. Technol. 2018, 48, 685–722. [Google Scholar] [CrossRef]
- Soleimani, Z.; Gharavi, S.; Soudi, M.; Moosavi-Nejad, Z. A survey of intact low-density polyethylene film biodegradation by terrestrial Actinobacterial species. Int. Microbiol. 2021, 24, 65–73. [Google Scholar] [CrossRef]
- Harper, C.A.; Petrie, E.M. Plastics Materials and Processes: A Concise Encyclopedia; John Wiley & Sons: Hoboken, NJ, USA, 2003. [Google Scholar]
- Karaagac, E.; Koch, T.; Archodoulaki, V.M. The effect of PP contamination in recycled high-density polyethylene (rPE-HD) from post-consumer bottle waste and their compatibilization with olefin block copolymer (OBC). Waste Manag. 2021, 119, 285–294. [Google Scholar] [CrossRef]
- Rahim, N.L.; Sallehuddin, S.; Ibrahim, N.M.; Che Amat, R.; Ab Jalil, M.F. Use of plastic waste (high density polyethylene) in concrete mixture as aggregate replacement. In Advanced Materials Research; Trans Tech Publications Ltd.: Wollerau, Switzerland, 2013; Volume 701, pp. 265–269. [Google Scholar] [CrossRef]
- Zhao, X.; You, F. Waste high-density polyethylene recycling process systems for mitigating plastic pollution through a sustainable design and synthesis paradigm. AIChE J. 2021, 67, e17127. [Google Scholar] [CrossRef]
- Hınıslıoğlu, S.; Ağar, E. Use of waste high density polyethylene as bitumen modifier in asphalt concrete mix. Mater. Lett. 2004, 58, 267–271. [Google Scholar] [CrossRef]
- Osorio Saraz, J.A.; Varón Aristizabal, F.; Herrera Mejía, J.A. Comportamiento mecánico del concreto reforzado con fibras de bagazo de caña de azúcar. Dyna 2007, 74, 69–79. [Google Scholar]
- Kosmatka, S.H.; Panarese, W.C.; Bringas, M.S. Diseño y Control de Mezclas de Concreto; Instituto Mexicano del Cemento y del Concreto: Mexico City, Mexico, 1992; ISBN 0-89312-233-5. [Google Scholar]
- Ede, A.N.; Agbede, J.O. Use of coconut husk fiber for improved compressive and flexural strength of con-crete. Int. J. Sci. Eng. Res. 2015, 6, 968–974. [Google Scholar]
- Almeshal, I.; Tayeh, B.A.; Alyousef, R.; Alabduljabbar, H.; Mohamed, A.M. Eco-friendly concrete containing recycled plastic as partial replacement for sand. J. Mater. Res. Technol. 2020, 9, 4631–4643. [Google Scholar] [CrossRef]
- Nibudey, R.N.; Nagarnaik, P.B.; Parbat, D.K.; Pande, A.M. Strength and fracture properties of post consumed waste plastic fiber reinforced concrete. Int. J. Civ. Struct. Environ. Infrastruct. Eng. Res. Dev. 2013, 3, 9–16. [Google Scholar]
- Prahallada, M.C.; Prakash, K.B. Strength and workability characteristics of waste plastic fibre reinforced concrete produced from recycled aggregates. Int. J. Eng. Res. 2011, 1, 1791–1802. [Google Scholar]
- Malagavelli, V.; Patura, N.R. Strength characteristics of concrete using solid waste an experimental investigation. Int. J. Earth Sci. Eng. 2011, 4, 937–940. [Google Scholar]
- Pešić, N.; Živanović, S.; Garcia, R.; Papastergiou, P. Mechanical properties of concrete reinforced with recycled HDPE plastic fibres. Constr. Build. Mater. 2016, 115, 362–370. [Google Scholar] [CrossRef]
- Hossain, K.M.A.; Hossain, M.A.; Manzur, T. Structural performance of fiber reinforced lightweight self-compacting concrete beams subjected to accelerated corrosion. J. Build. Eng. 2020, 30, 101291. [Google Scholar] [CrossRef]
- Vidaud, I.; Frómeta, Z.; Vidaud, E. Una aproximación a los concretos reforzados con fibras. Constr. Tecnol. Concreto 2015, 30, 31. [Google Scholar]
- Abeysinghe, S.; Gunasekara, C.; Bandara, C.; Nguyen, K.; Dissanayake, R.; Mendis, P. Engineering Performance of Concrete Incorporated with Recycled High-Density Polyethylene (HDPE)—A Systematic Review. Polymers 2021, 13, 1885. [Google Scholar] [CrossRef]
- ASTM C150/C150M-20; Standard Specification for Portland Cement. ASTM International: West Conshohocken, PA, USA, 2020. [CrossRef]
- ASTM C136/C136M-19; Standard Test Method for Sieve Analysis of Fine and Coarse Aggregates. ASTM International: West Conshohocken, PA, USA, 2020. [CrossRef]
- Patel, K.; Chikkali, S.H.; Sivaram, S. Ultrahigh molecular weight polyethylene: Catalysis, structure, properties, processing and applications. Prog. Polym. Sci. 2020, 109, 101290. [Google Scholar] [CrossRef]
- Tamrin; Nurdiana, J. The effect of recycled HDPE plastic additions on concrete performance. Recycling 2021, 6, 18. [Google Scholar] [CrossRef]
- ASTM D570-22; Standard Test Method for Water Absorption of Plastics. ASTM International: West Conshohocken, PA, USA, 2022. [CrossRef]
- Sathishkumar, T.P.; Navaneethakrishnan, P.; Shankar, S.; Rajasekar, R.; Rajini, N. Characterization of natural fiber and composites–A review. J. Reinf. Plast. Compos. 2013, 32, 1457–1476. [Google Scholar] [CrossRef]
- ASTM D792-20; Standard Test Methods for Density and Specific Gravity (Relative Density) of Plastics by Displacement. ASTM International: West Conshohocken, PA, USA, 2020.
- Awad, A.H.; El Gamasy, R.; Abd El Wahab, A.; Abdellatif, M.H. Mechanical and Physical Properties of PP and HDPE. Eng. Sci 2019, 4, 34–42. [Google Scholar] [CrossRef]
- Barahona, C.C.; Mera, J.; Martínez, D.; Rodríguez, J. Aprovechamiento de polipropileno y polietileno de alta densidad reciclados, reforzados con fibra vegetal, Tetera (Stromanthe Stromathoides). Rev. Polim. 2010, 11, 417–427. [Google Scholar]
- ASTM D638-22; Standard Test Method for Tensile Properties of Plastics. ASTM International: West Conshohocken, PA, USA, 2022. [CrossRef]
- Dhakal, H.N.; Zhang, Z.A.; Richardson, M.O. Effect of water absorption on the mechanical properties of hemp fibre reinforced unsaturated polyester composites. Compos. Sci. Technol. 2007, 67, 1674–1683. [Google Scholar] [CrossRef]
- Arrakhiz, F.Z.; El Achaby, M.; Kakou, A.C.; Vaudreuil, S.; Benmoussa, K.; Bouhfid, R.; Qaiss, A. Mechanical properties of high density polyethylene reinforced with chemically modified coir fibers: Impact of chemical treatments. Mater. Des. 2012, 37, 379–383. [Google Scholar] [CrossRef]
- Foulk, J.A.; Chao, W.Y.; Akin, D.E.; Dodd, R.B.; Layton, P.A. Enzyme-retted flax fiber and recycled polyethylene composites. J. Polym. Environ. 2004, 12, 165–171. [Google Scholar] [CrossRef]
- Colom, X.; Carrasco, F.; Pages, P.; Canavate, J. Effects of different treatments on the interface of HDPE/lignocellulosic fiber composites. Compos. Sci. Technol. 2003, 63, 161–169. [Google Scholar] [CrossRef]
- ASTM C143/C143M-20; Standard Test Method for Slump of Hydraulic-Cement Concrete. ASTM International: West Conshohocken, PA, USA, 2020. [CrossRef]
- ASTM C231/C231M-22; Standard Test Method for Air Content of Freshly Mixed Concrete by the Pressure Method. ASTM International: West Conshohocken, PA, USA, 2022. [CrossRef]
- ASTM C31/C31M19a; Standard Practice for Making and Curing Concrete Test Specimens in the Field. ASTM International: West Conshohocken, PA, USA, 2019. [CrossRef]
- ASTM C39/C39M-23; Standard Test Method for Compressive Strength of Cylindrical Concrete Specimens. ASTM International: West Conshohocken, PA, USA, 2023. [CrossRef]
- ASTM C78/C78M-22; Standard Test Method for Flexural Strength of Concrete (Using Simple Beam with Third-Point Loading). ASTM International: West Conshohocken, PA, USA, 2022. [CrossRef]
- ASTM C876-09; Standard Test Method for Corrosion Potentials of Uncoated Reinforcing Steel in Concrete. ASTM International: West Conshohocken, PA, USA, 2016. [CrossRef]
- Pfändler, P.; Keßler, S.; Huber, M.; Angst, U. Spatial variability of half-cell potential data from a reinforced concrete structure—A geostatistical analysis. Struct. Infrastruct. Eng. 2022, 1–16. [Google Scholar] [CrossRef]
- Dineshkumar, R.; Harikaran, C.; Veerapandi, P. Corrosion Assessment in Reinforced Concrete Elements using Half-Cell Potentiometer—A Review. Measurement 2020, 9, 12. [Google Scholar]
- Adriman, R.; Ibrahim, I.B.M.; Huzni, S.; Fonna, S.; Ariffin, A.K. Improving half-cell potential survey through computational inverse analysis for quantitative corrosion profiling. Case Stud. Constr. Mater. 2022, 16, e00854. [Google Scholar] [CrossRef]
- Jamali, S.S.; Mills, D.J. A critical review of electrochemical noise measurement as a tool for evaluation of organic coatings. Prog. Org. Coat. 2016, 95, 26–37. [Google Scholar] [CrossRef]
- Tamayo, J.M.; Chavarín, J.U. La Técnica de Ruido Electroquímico para el estudio de la Corrosión; Instituto de Investigaciones Eléctricas: Cuernavaca, Mexico, 2002. [Google Scholar]
- Cottis, R.A. Interpretation of electrochemical noise data. Corrosion 2001, 57, 265–285. [Google Scholar] [CrossRef]
- Sánchez, A.; Sanjurjo, M.; Bouzada, F.; Urrejola, S. Análisis estadístico de los registros de ruido electroquímico obtenidos en la corrosión del aluminio. Rev. Metal. 2005, 41, 330–339. [Google Scholar] [CrossRef]
- Arellano-Pérez, J.H.; Escobar-Jiménez, R.F.; Ramos-Negrón, O.J.; Lucio-García, M.A.; Gómez-Aguilar, J.F.; Uruchurtu-Chavarín, J. The Use of a Time-Frequency Transform for the Analysis of Electrochemical Noise for Corrosion Estimation. Math. Probl. Eng. 2022, 2022, 4333607. [Google Scholar] [CrossRef]
- Sanchez-Amaya, J.M.; Osuna, R.M.; Bethencourt, M.; Botana, F.J. Monitoring the degradation of a high solids epoxy coating by means of EIS and EN. Prog. Org. Coat. 2007, 60, 248–254. [Google Scholar] [CrossRef]
- Stern, M.; Geary, A.L. Electrochemical polarization: I. A theoretical analysis of the shape of polarization curves. J. Electrochem. Soc. 1957, 104, 56. [Google Scholar] [CrossRef]
- Estupiñán-López, F.H.; Almeraya-Calderón, F.; Bautista Margulis, G.R.; Baltazar Zamora, M.A.; Martínez-Villafañe, A.; Uruchurtu, C.J.; Gaona-Tiburcio, C. Transient analysis of electrochemical noise for 316 and duplex 2205 stainless steels under pitting corrosion. Int. J. Electrochem. Sci. 2011, 6, 1785–1796. [Google Scholar] [CrossRef]
- Faritov, A.T.; Rozhdestvenskii, Y.G.; Yamshchikova, S.A.; Minnikhanova, E.R.; Tyusenkov, A.S. Improvement of the linear polarization resistance method for testing steel corrosion inhibitors. Russ. Metall. (Met.) 2016, 2016, 1035–1041. [Google Scholar] [CrossRef]
- ASTM G59-97; Standard Test Method for Conducting Potentiodynamic Polarization Resistance Measurements. ASTM International: West Conshohocken, PA, USA, 2020. [CrossRef]
- Brown, D.W.; Connolly, R.J.; Darr, D.R.; Laskowski, B. Linear Polarization Resistance Sensor Using the Structure as a Working Electrode. In Proceedings of the PHM Society European Conference, Nantes, France, 8–10 July 2014; 2. [Google Scholar]
- Da, B.; Yu, H.; Ma, H.; Wu, Z. Reinforcement corrosion research based on the linear polarization resistance method for coral aggregate seawater concrete in a marine environment. Anti-Corros. Methods Mater. 2018, 65, 458–470. [Google Scholar] [CrossRef]
- Baweja, D.; Roper, H.; Sirivivatnanon, V. Improved electrochemical determinations of chloride-induced steel corrosion in concrete. Mater. J. 2003, 100, 228–238. [Google Scholar]
- Andrade, C.; Alonso, C. Corrosion rate monitoring in the laboratory and on-site. Constr. Build. Mater. 1996, 10, 315–328. [Google Scholar] [CrossRef]
- Flores-Nicolás, A.; Flores-Nicolás, M.; Uruchurtu-Chavarín, J. Corrosion effect on reinforced concrete with the addition of graphite powder and its evaluation on physical-electrochemical properties. Rev. ALCONPAT 2021, 11, 18–33. [Google Scholar] [CrossRef]
- Ribeiro, D.V.; Abrantes, J.C.C. Application of electrochemical impedance spectroscopy (EIS) to monitor the corrosion of reinforced concrete: A new approach. Constr. Build. Mater. 2016, 111, 98–104. [Google Scholar] [CrossRef]
- Sobhani, J.; Najimi, M. Electrochemical impedance behavior and transport properties of silica fume contained concrete. Constr. Build. Mater. 2013, 47, 910–918. [Google Scholar] [CrossRef]
- Solís-Carcaño, R.Ó.M.E.L.; Moreno, E.I. Análisis de la porosidad del concreto con agregado calizo. Rev. Fac. Ing. UCV 2006, 21, 57–68. [Google Scholar]
- Nicolás, A.F. Evaluación en la Corrosión y Protección del Acero de Refuerzo Embebidas de Concreto en Presencia de Grafito y su Instituto de Investigación en Ciencias Básicas y Aplicadas Aplicadas Efecto en las Propiedades Mecánicaselectroquímicas. 2021. Available online: http://riaa.uaem.mx/xmlui/handle/20.500.12055/1554 (accessed on 16 December 2023).
- Al-Hadithi, A.I.; Hilal, N.N. The possibility of enhancing some properties of self-compacting concrete by adding waste plastic fibers. J. Build. Eng. 2016, 8, 20–28. [Google Scholar] [CrossRef]
- Yodsudjai, W.; Pattarakittam, T. Factors influencing half-cell potential measurement and its relationship with corrosion level. Measurement 2017, 104, 159–168. [Google Scholar] [CrossRef]
- Li, Z.; Homborg, A.; Gonzalez-Garcia, Y.; Kosari, A.; Visser, P.; Mol, A. Evaluation of the formation and protectiveness of a lithium-based conversion layer using electrochemical noise. Electrochim. Acta 2022, 426, 140733. [Google Scholar] [CrossRef]
- Lock, A.U. Velocidad de corrosión de aceros nacionales AISI 1010 en ácido sulfúrico como medio agresivo. Rev. Quim. 1991, 5, 21–38. [Google Scholar]
- Almashakbeh, Y.; Saleh, E.; Al-Akhras, N.M. Evaluation of Half-Cell Potential Measurements for Reinforced Concrete Corrosion. Coatings 2022, 12, 975. [Google Scholar] [CrossRef]
- Darmawan, M.S. Pitting corrosion model for reinforced concrete structures in a chloride environment. Mag. Concr. Res. 2010, 62, 91–101. [Google Scholar] [CrossRef]
- Andrade, C. Propagation of reinforcement corrosion: Principles, testing and modelling. Mater. Struct. 2019, 52, 2. [Google Scholar] [CrossRef]
- Raczkiewicz, W. Use of polypropylene fibres to increase the resistance of reinforcement to chloride corrosion in concretes. Sci. Eng. Compos. Mater. 2021, 28, 555–567. [Google Scholar] [CrossRef]
- François, R. A discussion on the order of magnitude of corrosion current density in reinforcements of concrete structures and its link with cross-section loss of reinforcement. RILEM Tech. Lett. 2021, 6, 158–168. [Google Scholar] [CrossRef]
- Daniyal, M.; Akhtar, S. Corrosion assessment and control techniques for reinforced concrete structures: A review. J. Build. Pathol. Rehabil. 2020, 5, 1–20. [Google Scholar] [CrossRef]
- Song, G. Equivalent circuit model for AC electrochemical impedance spectroscopy of concrete. Cem. Concr. Res. 2000, 30, 1723–1730. [Google Scholar] [CrossRef]
- Herrera Hernández, H.; González Díaz, F.; Fajardo San Miguel, G.D.J.; Velázquez Altamirano, J.C.; González Morán, C.O.; Morales Hernández, J. Electrochemical impedance spectroscopy as a practical tool for monitoring the carbonation process on reinforced concrete structures. Arab. J. Sci. Eng. 2019, 44, 10087–10103. [Google Scholar] [CrossRef]
- Zhao, W.; Zhao, J.; Zhang, S.; Yang, J. Application of Electrochemical Impedance Spectroscopy to Evaluate the Corrosion Behavior of 2304 Duplex Stainless Steel Reinforced Rebar in Concrete Exposed in Chloride-Rich Environment. Int. J. Electrochem. Sci. 2019, 14, 8039–8047. [Google Scholar] [CrossRef]
- Park, J.; Jung, M. Evaluation of the corrosion behavior of reinforced concrete with an inhibitor by electrochemical impedance spectroscopy. Materials 2021, 14, 5508. [Google Scholar] [CrossRef] [PubMed]
- Fattah-Alhosseini, A.; Taheri Shoja, S.; Heydari Zebardast, B.; Mohamadian Samim, P. An electrochemical impedance spectroscopic study of the passive state on AISI 304 stainless steel. Int. J. Electrochem. 2011, 2011, 152143. [Google Scholar] [CrossRef]
- Cellat, K.; Tezcan, F.; Beyhan, B.; Kardaş, G.; Paksoy, H. A comparative study on corrosion behavior of rebar in concrete with fatty acid additive as phase change material. Constr. Build. Mater. 2017, 143, 490–500. [Google Scholar] [CrossRef]
- Bahij, S.; Omary, S.; Feugeas, F.; Faqiri, A. Fresh and hardened properties of concrete containing different forms of plastic waste–A review. Waste Manag. 2020, 113, 157–175. [Google Scholar] [CrossRef] [PubMed]
- Vadivel, T.S.; Doddurani, M. An experimental study on mechanical properties of waste plastic fiber reinforced concrete. Int. J. Emerg. Trends Eng. Dev. 2013, 3, 395–401. [Google Scholar]
- Abu-Saleem, M.; Zhuge, Y.; Hassanli, R.; Ellis, M.; Rahman, M.; Levett, P. Evaluation of concrete performance with different types of recycled plastic waste for kerb application. Constr. Build. Mater. 2021, 293, 123477. [Google Scholar] [CrossRef]
- Fallah, S.; Nematzadeh, M. Mechanical properties and durability of high-strength concrete containing macro-polymeric and polypropylene fibers with nano-silica and silica fume. Constr. Build. Mater. 2017, 132, 170–187. [Google Scholar] [CrossRef]
- Chen, B.; Liu, J. Contribution of hybrid fibers on the properties of the high-strength lightweight concrete having good workability. Cem. Concr. Res. 2005, 35, 913–917. [Google Scholar] [CrossRef]
- Hossain, F.Z.; Shahjalal, M.; Islam, K.; Tiznobaik, M.; Alam, M.S. Mechanical properties of recycled aggregate concrete containing crumb rubber and polypropylene fiber. Constr. Build. Mater. 2019, 225, 983–996. [Google Scholar] [CrossRef]
- Özcan, F.; Koç, M.E. Influence of ground pumice on compressive strength and air content of both non-air and air entrained concrete in fresh and hardened state. Constr. Build. Mater. 2018, 187, 382–393. [Google Scholar] [CrossRef]
- Kakooei, S.; Akil, H.M.; Jamshidi, M.; Rouhi, J. The effects of polypropylene fibers on the properties of reinforced concrete structures. Constr. Build. Mater. 2012, 27, 73–77. [Google Scholar] [CrossRef]
- Yaakob, M.Y.; Kamarudin, M.H.; Salit, M.S.; Pieter, H.H.I.; Badarulzaman, N.A.; Sohaimi, R.M. A review on different forms and types of waste plastic used in concrete structure for improvement of mechanical properties. J. Adv. Res. Appl. Mech. 2016, 28, 9–30. [Google Scholar]
- Anandan, S.; Alsubih, M. Mechanical strength characterization of plastic fiber reinforced cement concrete composites. Appl. Sci. 2021, 11, 852. [Google Scholar] [CrossRef]
- Richardson, A.E. Compressive strength of concrete with polypropylene fibre additions. Struct. Surv. 2006, 24, 138–153. [Google Scholar] [CrossRef]
- Sharma, R.; Bansal, P.P. Use of different forms of waste plastic in concrete—A review. J. Clean. Prod. 2016, 112, 473–482. [Google Scholar] [CrossRef]
- Ahmad, J.; Majdi, A.; BabekerElhag, A.; Deifalla, A.F.; Soomro, M.; Isleem, H.F.; Qaidi, S. A step towards sustainable concrete with substitution of plastic waste in concrete: Overview on mechanical, durability and microstructure analysis. Crystals 2022, 12, 944. [Google Scholar] [CrossRef]
- Bhogayata, A.C.; Arora, N.K. Fresh and strength properties of concrete reinforced with metalized plastic waste fibers. Constr. Build. Mater. 2017, 146, 455–463. [Google Scholar] [CrossRef]
- Awad, H.K. Influence of Cooling Methods on the Behavior of Reactive Powder Concrete Exposed to Fire Flame Effect. Fibers 2020, 8, 19. [Google Scholar] [CrossRef]
- Alqahtani, F.K.; Ghataora, G.; Khan, M.I.; Dirar, S. Novel lightweight concrete containing manufactured plastic aggregate. Constr. Build. Mater. 2017, 148, 386–397. [Google Scholar] [CrossRef]
- Mohammed, A.M.; Hammadi, A.A. Effect of adding the plastic waste as fibers on mechanical properties of concrete. J. Eng. Sustain. Dev. 2018, 22, 86–95. [Google Scholar] [CrossRef]
- Raupach, M. Models for the propagation phase of reinforcement corrosion–an overview. Mater. Corros. 2006, 57, 605–613. [Google Scholar] [CrossRef]
- Kakooei, S.; Akil, H.M.; Dolati, A.; Rouhi, J. The corrosion investigation of rebar embedded in the fibers reinforced concrete. Constr. Build. Mater. 2012, 35, 564–570. [Google Scholar] [CrossRef]
- Sappakittipakorn, M.; Banthia, N. Corrosion of rebar and role of fiber reinforced concrete. J. Test. Eval. 2012, 40, 127–136. [Google Scholar] [CrossRef]
- Song, H.W.; Saraswathy, V. Corrosion monitoring of reinforced concrete structures-A. Int. J. Electrochem. Sci 2007, 2, 1–28. [Google Scholar] [CrossRef]
- Fan, L.; Shi, X. Techniques of corrosion monitoring of steel rebar in reinforced concrete structures: A review. Struct. Health Monit. 2022, 21, 1879–1905. [Google Scholar] [CrossRef]
- Zhao, B.; Li, J.H.; Hu, R.G.; Du, R.G.; Lin, C.J. Study on the corrosion behavior of reinforcing steel in cement mortar by electrochemical noise measurements. Electrochim. Acta 2007, 52, 3976–3984. [Google Scholar] [CrossRef]
- Wang, C.Y.; Shih, C.C.; Hong, S.C.; Hwang, W.C. Rehabilitation of cracked and corroded reinforced concrete beams with fiber-reinforced plastic patches. J. Compos. Constr. 2004, 8, 219–228. [Google Scholar] [CrossRef]
- Dhouibi, L.; Triki, E.; Raharinaivo, A. The application of electrochemical impedance spectroscopy to determine the long-term effectiveness of corrosion inhibitors for steel in concrete. Cem. Concr. Compos. 2002, 24, 35–43. [Google Scholar] [CrossRef]
- Kim, J.K.; Kee, S.H.; Futalan, C.M.; Yee, J.J. Corrosion monitoring of reinforced steel embedded in cement mortar under wet-and-dry cycles by electrochemical impedance spectroscopy. Sensors 2019, 20, 199. [Google Scholar] [CrossRef] [PubMed]
- Shi, W.; Dong, Z.H.; Kong, D.J.; Guo, X.P. Application of wire beam electrode technique to investigate initiation and propagation of rebar corrosion. Cem. Concr. Res. 2013, 48, 25–33. [Google Scholar] [CrossRef]


| Fiber | Absorption (%) | Density (g/cm3) | Reference |
|---|---|---|---|
| HDPE | --- | 0.926 | [37] |
| HDPE | --- | 0.952 | [33] |
| HDPE | --- | 0.952 | [22] |
| HDPE | 0.255 | 0.955 | This study |
| Properties | Units | HDPE |
|---|---|---|
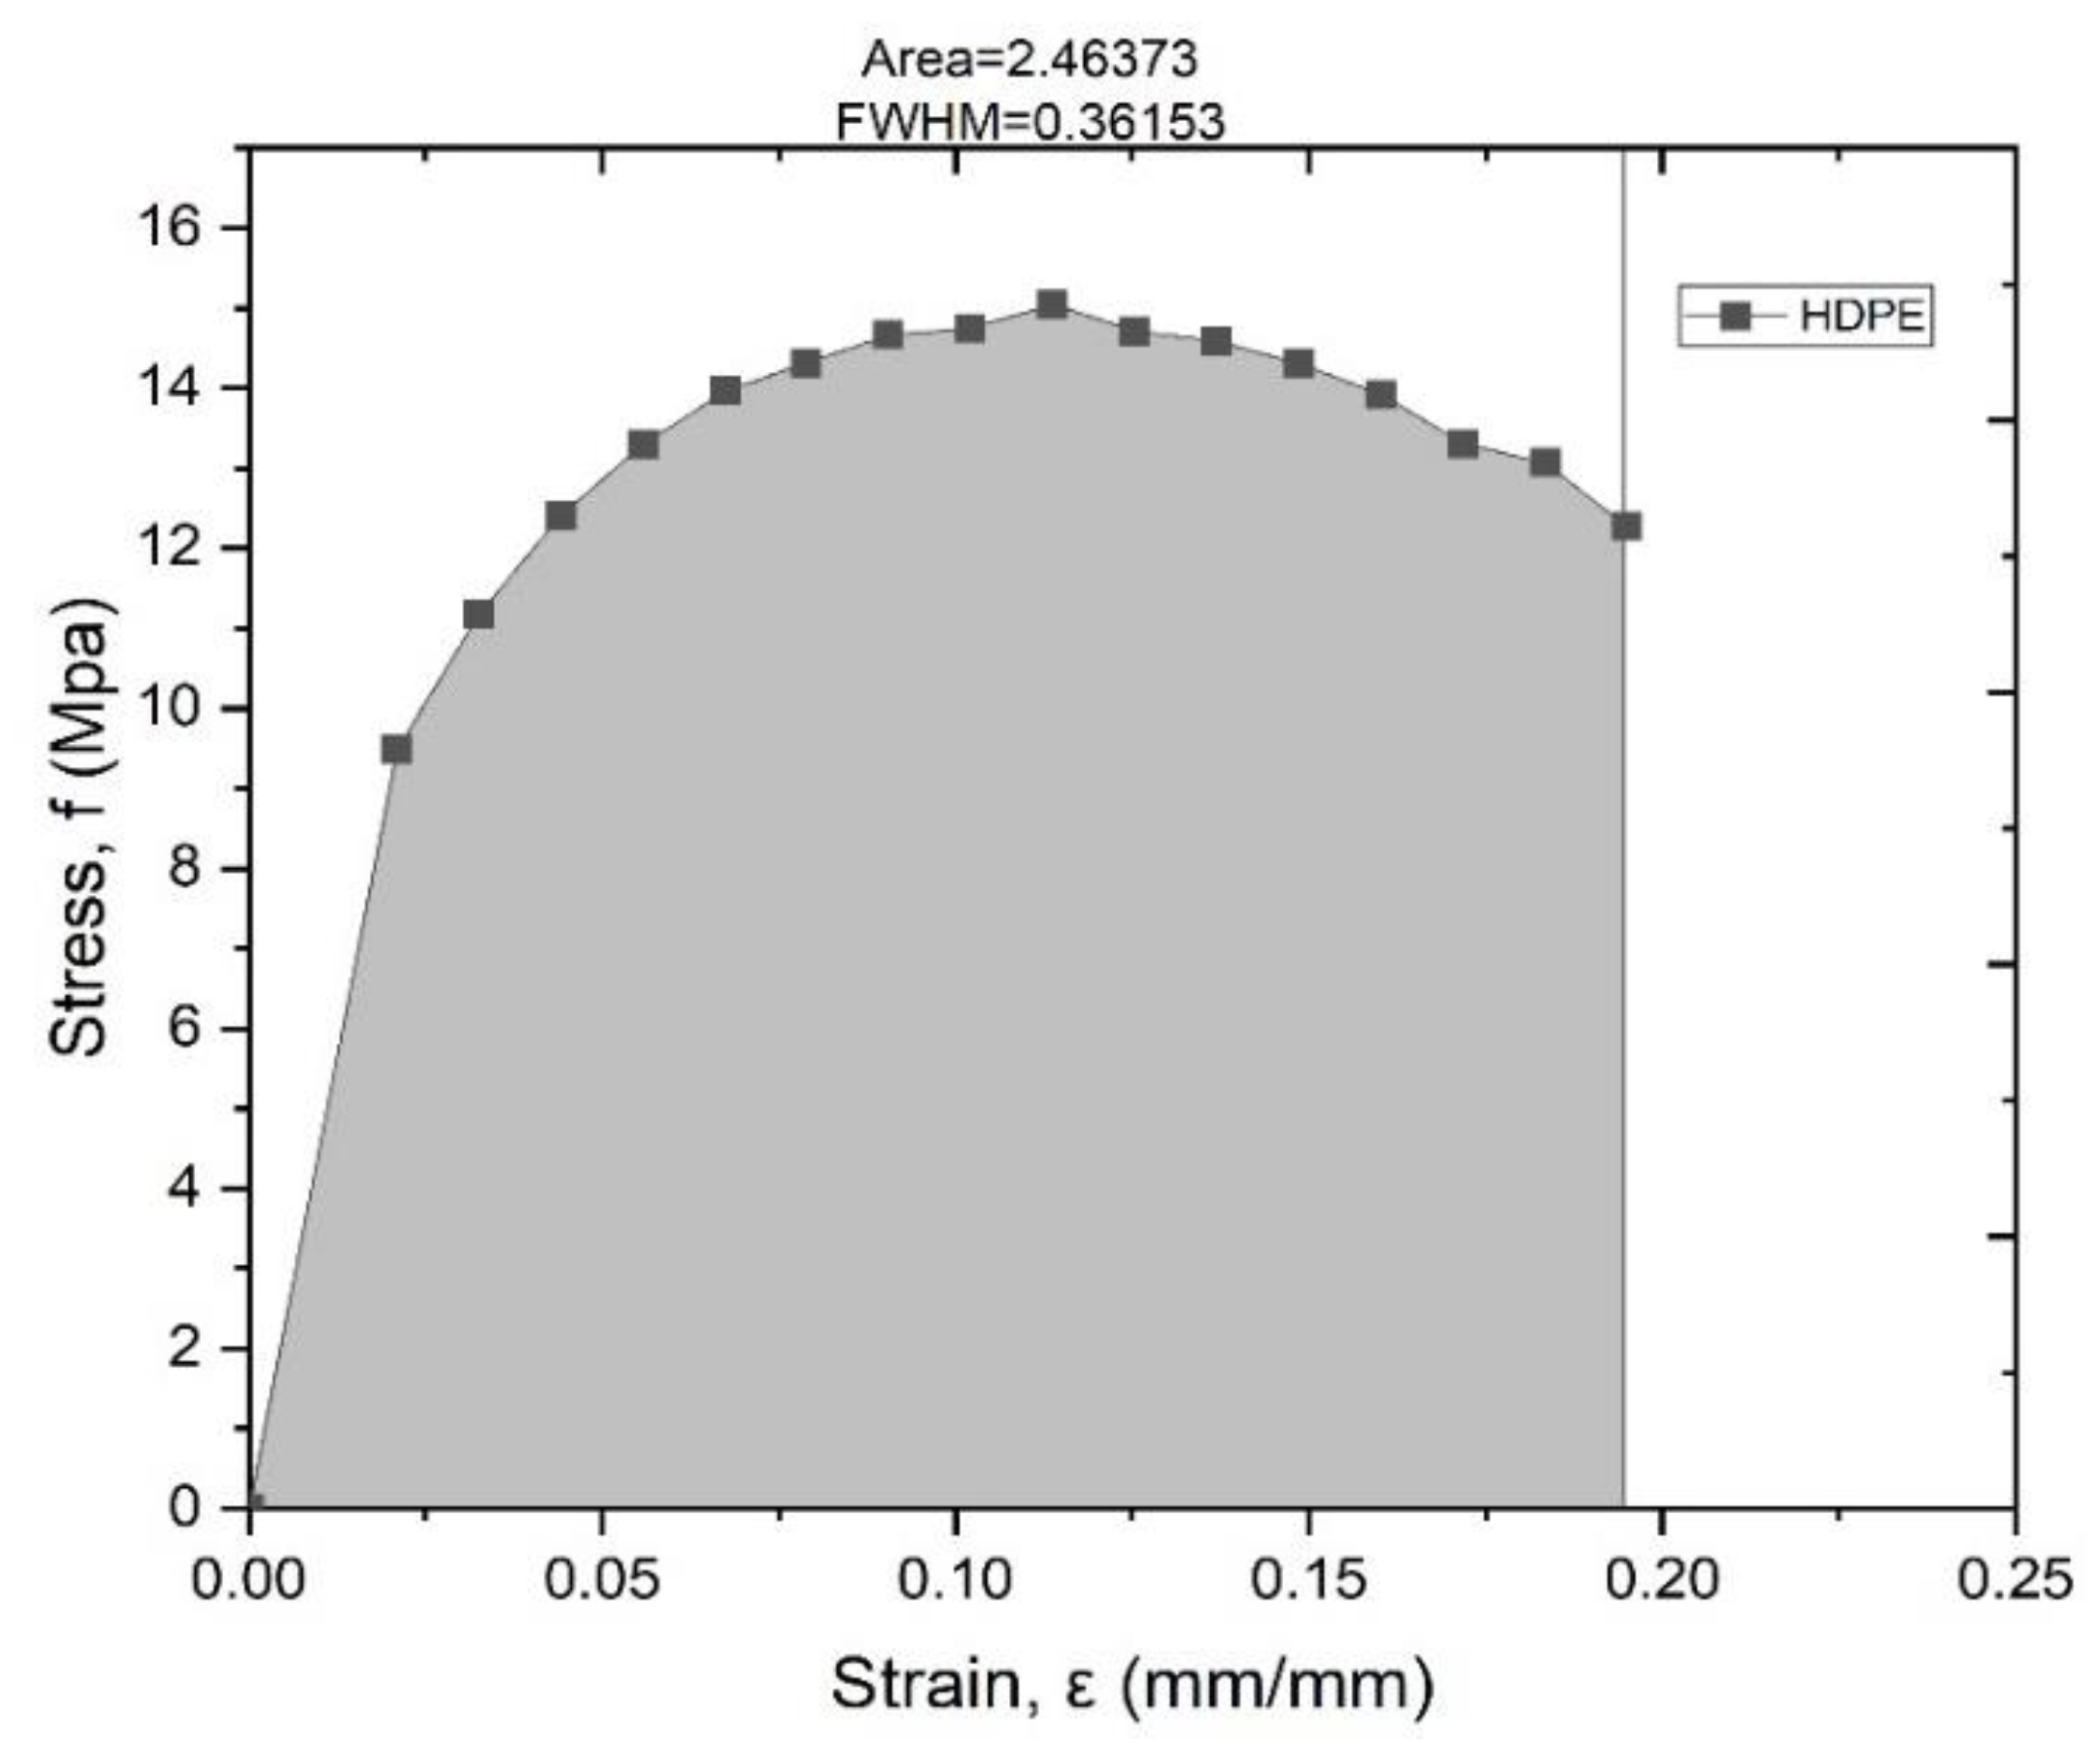
| Tensile strength | MPa | 15.05 |
| Elasticity modulus | MPa | 463 |
| Toughness | N.mm | 2.46 |
| Material | kg/m3 | Fiber 0.2% | Fiber 0.4% |
|---|---|---|---|
| Cement | 366.07 | 366.07 | 366.07 |
| Water w/c = 0.54 | 197.65 | 197.65 | 197.65 |
| Gravel | 1047.65 | 1047.65 | 1047.65 |
| Sand | 650.63 | 649.33 | 648.03 |
| HDPE fiber | 0 | 1.30 | 2.60 |
| Material | Percent Fibers (%) | Dimension (mm) | Nomenclature |
|---|---|---|---|
| Cement | - | - | CO |
| 0.2 | 30 | LH-02 | |
| 0.2 | 10 | CH-02 | |
| 0.4 | 30 | LH-04 | |
| 0.4 | 10 | CH-04 |
| Reference Electrode (mV) | Corrosion Probability | |
|---|---|---|
| Cu/CuSO4 | Ag/AgCl | |
| >−200 | >−150 | Probability of corrosion 10% |
| −200 to −350 | −150 to −300 | Uncertain |
| <−350 | <−300 | Corrosion probability over 90% |
| Location Index | Type of Corrosion |
|---|---|
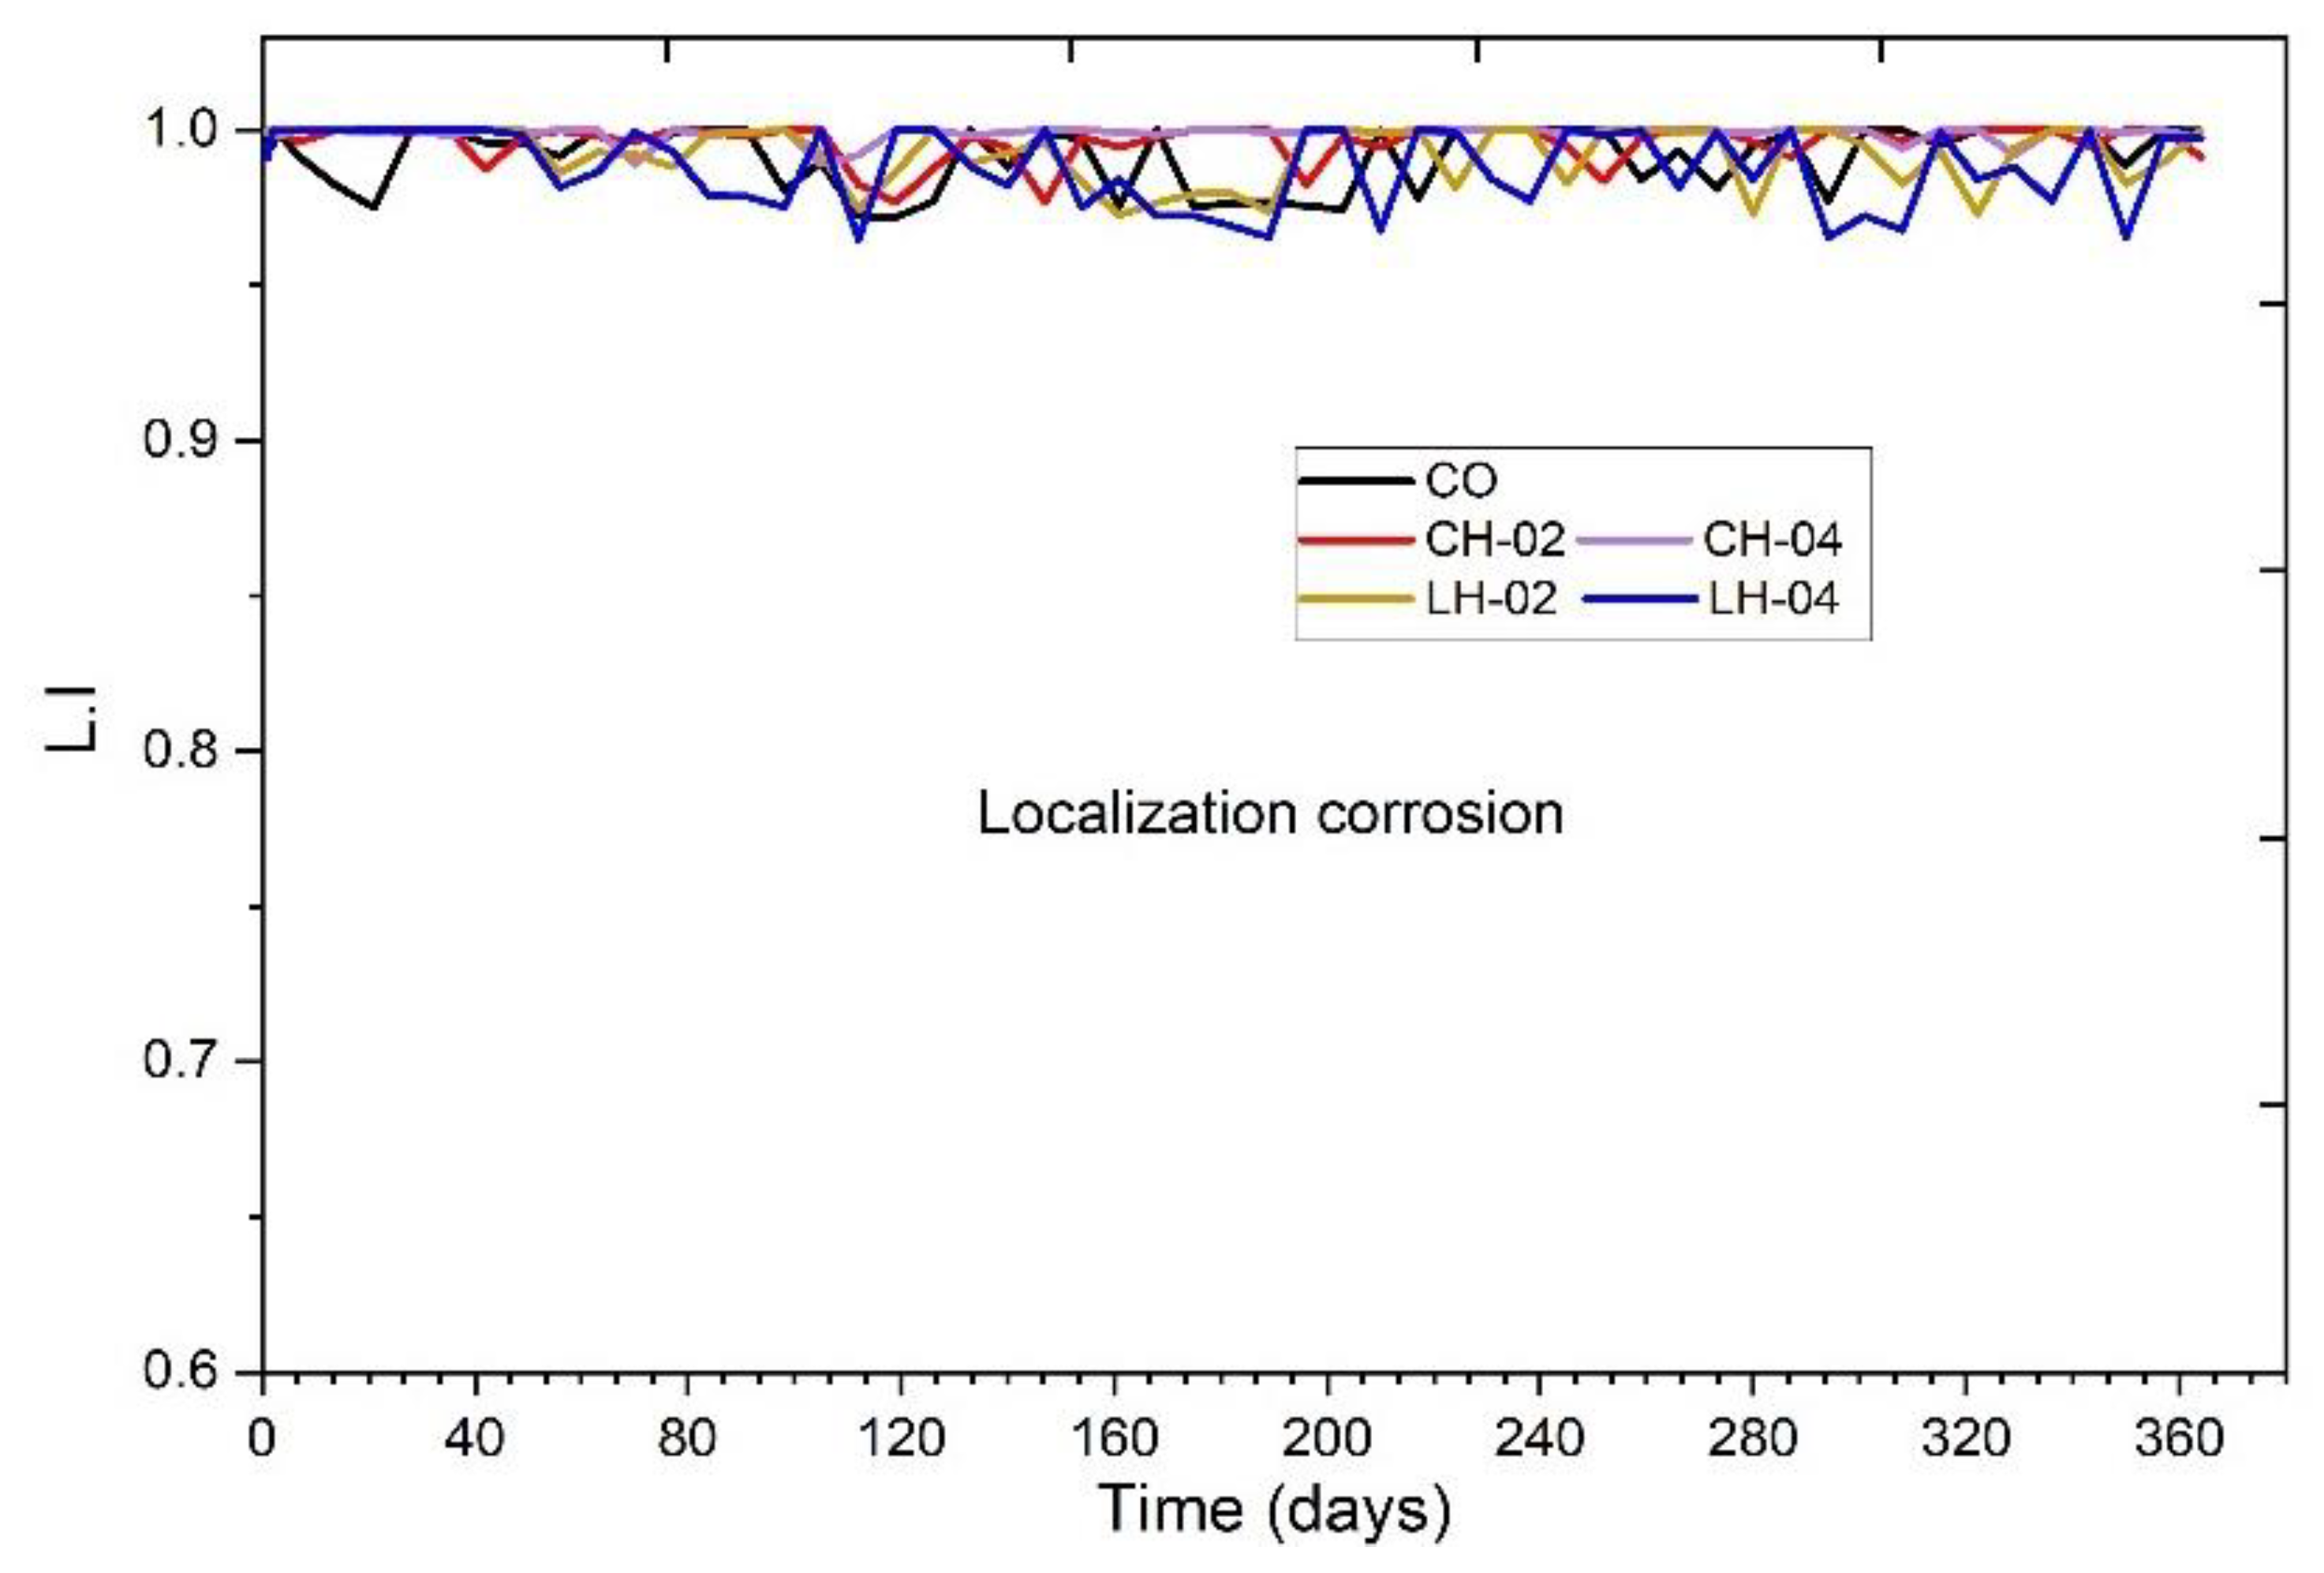
| 0.001–0.01 | Generalized |
| 0.01–0.1 | Mixed |
| 0.1–1 | Localized |
| >1 | Start of pitting |
| Concrete | Slump (mm) | Air (%) |
|---|---|---|
| CO | 140 | 2.1 |
| CH-02 | 110 | 1.4 |
| CH-04 | 90 | 1.5 |
| LH-02 | 110 | 1.8 |
| LH-04 | 100 | 2.3 |
Disclaimer/Publisher’s Note: The statements, opinions and data contained in all publications are solely those of the individual author(s) and contributor(s) and not of MDPI and/or the editor(s). MDPI and/or the editor(s) disclaim responsibility for any injury to people or property resulting from any ideas, methods, instructions or products referred to in the content. |
© 2024 by the authors. Licensee MDPI, Basel, Switzerland. This article is an open access article distributed under the terms and conditions of the Creative Commons Attribution (CC BY) license (https://creativecommons.org/licenses/by/4.0/).
Share and Cite
Flores Nicolás, A.; Menchaca Campos, E.C.; Flores Nicolás, M.; Martínez González, J.J.; González Noriega, O.A.; Uruchurtu Chavarín, J. Influence of Recycled High-Density Polyethylene Fibers on the Mechanical and Electrochemical Properties of Reinforced Concrete. Fibers 2024, 12, 24. https://doi.org/10.3390/fib12030024
Flores Nicolás A, Menchaca Campos EC, Flores Nicolás M, Martínez González JJ, González Noriega OA, Uruchurtu Chavarín J. Influence of Recycled High-Density Polyethylene Fibers on the Mechanical and Electrochemical Properties of Reinforced Concrete. Fibers. 2024; 12(3):24. https://doi.org/10.3390/fib12030024
Chicago/Turabian StyleFlores Nicolás, Alejandro, Elsa C. Menchaca Campos, Mario Flores Nicolás, José J. Martínez González, Omar A. González Noriega, and Jorge Uruchurtu Chavarín. 2024. "Influence of Recycled High-Density Polyethylene Fibers on the Mechanical and Electrochemical Properties of Reinforced Concrete" Fibers 12, no. 3: 24. https://doi.org/10.3390/fib12030024