Article

Flexural Properties of Thin-Walled Specimens with Square Hollow Sections 3D Printed from ABS Reinforced with Aramid Fibers

Faculty of Mechatronics and Mechanical Engineering, Kielce University of Technology, 25-314 Kielce, Poland
*
Author to whom correspondence should be addressed.
Fibers 2023, 11(9), 77; https://doi.org/10.3390/fib11090077
Submission received: 25 July 2023 / Revised: 7 September 2023 / Accepted: 14 September 2023 / Published: 17 September 2023
(This article belongs to the Special Issue Fracture Behavior of Fiber-Reinforced Building Materials)

Abstract

:
This article studies the flexural behavior of thin-walled specimens with square hollow sections fabricated using fused deposition modeling (FDM). The specimens were 3D printed from an ABS filament reinforced with aramid fibers. Four wall thicknesses were analyzed. The strength data were collected during three-point flexural tests. There are visible, clear differences in the flexural properties between the X- or Y-oriented specimens and those printed in the Z direction, and they vary up to 70%. It was also found that the flexural strength was dependent on the G-codes controlling the print head’s motion, path, and position. For specimens with a thickness up to 1.4 mm, the infill pattern was linear, whereas 1.8 mm and 2 mm specimens needed a stitch, which had some negative effects on the strength properties.

1. Introduction

Since its invention, aramid fiber (AF), also known as Kevlar, has been investigated and used extensively because of its interesting properties and availability in various grades. It has long been employed as an ingredient to improve the mechanical properties of various materials. One of the studies on AF [1] shows that the material can be used in dentistry. The experiments involved adding Kevlar 29 to polymethyl methacrylate (PMMA) to improve its strength properties. It is important to note that a small amount of aramid fiber is needed to considerably modify the tensile strength of the polymer. An addition of 1% of AF by weight increased the tensile strength of bone cement or PMMA from 30.8 MPa to 36.1 MPa. When 7% of Kevlar by weight was used, the tensile strength of PMMA improved by 32%, and its fracture toughness was 74% higher.
The material structure, analyzed through means of transmission electron microscopy, is discussed, for example, in [2]. The experiments were performed for twelve aramid fibers differing in overall molecular orientation and diameter (ranging from 10.2 μm to 19.1 μm). The mechanical properties of the fibers, determined using conventional mechanical tests, were found to be largely dependent on the fiber structure. Aramid fibers themselves can also be modified. For instance, the research described in [3] consisted of using epoxypropyltrimethoxysilane to react with the reactive groups on the surface of AF, loading the modified fiber with silver ionic glass beads, and employing the melt-mixing technology to produce polyethylene composites. The AF-reinforced material had 141% higher tensile strength and a long-lasting safe contact antibacterial function, which made it possible to prevent the growth of E. coli.
Over the recent years, polymers have been modified not only by adding aramid fibers but hybrid modifications are also possible with carbon fibers (CFs) and/or basalt fibers [4,5,6,7]. One of the aims is to reduce the unfavorable anisotropic phenomena [8]. The study presented in [4], for example, compares the tensile and flexural strengths of pure polypropylene with those of polypropylene matrix composites reinforced with glass, carbon, or aramid fibers. The mechanical properties of the composites were dependent on the number of fibers added. A special procedure was used to determine the optimal percentages of fibers introduced. Interesting observations are made in [5]; this article is concerned with the development of a p-aramid/carbon-fiber-reinforced polymer (CF/AFRP) composite to be used in safety helmets. The specimens were made via compression molding. Their mechanical properties, including impact strength, tensile strength, and flexural strength, were reported to be much higher than those of regular ABS and CF or AF-reinforced polymer composites. The results of the study are important because ABS, also available in the form of filaments, is a common material used to create models using fused deposition modeling (FDM), also known as fused filament fabrication (FFF). AF can also be combined with CF to reinforce epoxy/poly(vinyl butyral) composites [6]. As expected, the fiber-reinforced material had better mechanical properties than the unmodified matrix material. Another article providing important findings in the area of materials science deals with hybrid modifications of polylactic acid (PLA) with aramid and basalt fibers via injection molding [7]. The experiments showed that the mechanical performance of modified PLA was better than that of pure PLA, and the material would now be suitable for certain applications.
Many studies have been devoted to the properties of additively manufactured AF-reinforced polymers [9,10,11,12,13,14]. One of them [9] focused on polyethylene terephthalate glycol (PETG) modified with CF and AF, which was obtained using FDM/FFF followed by annealing. Three different annealing temperatures (90 °C, 110 °C, and 130 °C) and three different exposure times (30 min, 240 min, and 480 min) were considered. The best mechanical properties were registered when the thermal post-process was performed at the highest temperature and the longest exposure time. An improvement in the mechanical properties of PETG after modification with AF [10,14] suggests a wider application of materials fabricated with FDM/FFF. The use of fiber-reinforced polymer filaments, however, requires selecting the right printing parameters. The properties, especially the mechanical properties, of AF-modified PLA are definitely superior to those of regular PLA, which extends the range of its application [11]. Better print quality and a wider industrial application of elements printed from filaments containing fibers, e.g., AF, can also be achieved by modernizing the FDM/FFF technology, e.g., using a dual extruder configuration [12]. In practice, AF-reinforced polymer can be used to 3D print protective armor, including stab vests [13]. The gear consists of scale-like elements attached to one another, each with a thickness of 3 mm and a diameter of 50 mm.
Thin-walled structures produced by 3D printing can be used to create models undergoing topology optimization (TO) [15] for the purpose of reducing mass while retaining high strength. Recent advancements in the area of additive manufacturing include integrating 3D-printed structures into textiles [16], which requires strong adhesion between the coating and the substrate. Some of the latest publications on this subject are concerned with 3D-printed features that need to withstand torsion, for example, threads [17]. Threads are difficult to design and fabricate by additive manufacturing; they can be treated as thin-walled features protruding from solid parts. Similar torsional strength problems can be observed in cellular honeycomb structures [18]. In the case of thin-walled objects, it can be difficult to measure surface roughness, waviness, or form errors [19] using contact or optical measuring instruments. The results of bending tests of models produced by 3D printing in the FDM/FFF technology have been presented in several research papers [20,21,22], where the authors focused their attention on samples with a standard thickness of over 3 mm, usually with full filling. Moreover, papers [20,21] present the results of bending tests for materials based on composites and paper [22] for PEEK material. These works, however, do not address the issue of generating G-codes because this problem arises, as shown in this article, only in the case of thin-walled models.
In the case of testing thin-walled models, exemplary tests are presented in articles [23,24,25]. Also in these works, the analysis of the problems of generating G-codes in terms of strength was not presented. Papers [24,25] present interesting examples of filling models with a cellular structure but without a deeper analysis of the technological process taking into account the method of forming the filling (thin walls).
Problems related to the use of AF to develop composites, including those fabricated via 3D printing, are also discussed in this article. The research focused on three-point flexural tests of thin-walled square hollow sections made of AF-reinforced ABS using FDM. Results of the authors’ earlier studies on thin-walled elements fabricated with 3D printing were taken into account [26,27,28,29]. The aim of the investigations was to analyze how the wall thickness and print orientation affected the flexural behavior of hollow structural elements printed from ABS reinforced with aramid fiber. Due to the growing use of 3D printing in advanced thin-walled structures, the research results presented in the article have great practical applications. The analysis of the filament distribution paths generated in G-codes reveals many differences affecting the quality of the thin-walled models produced, which is undoubtedly a novelty in the presented article. In addition, due to the fact that the differences in the nature of material distribution for thin-walled models represent a significant volume of the thin-walled sample, they are clearly visible, which cannot be seen in the case of solid samples. The FDM/FFF technology was chosen for the research due to the very large development of the chemistry of materials and the possibility of independently creating new ones using the necessary commercial equipment available for purchase. In addition, the FDM/FFF technology allows for 3D printing of large-size models with dimensions of over 1 m3, which means that the research results can be used in commercial applications, which is not allowed by many technologies limited by the small working chambers of 3D printers.

2. Materials and Methods

2.1. Method

The experimental procedure was divided into four stages:
-
Printing specimens in the form of thin-walled square hollow sections using the FDM technology;
-
Measuring their dimensions;
-
Determining their mechanical properties by performing static flexural tests;
-
Examining their structure using scanning electron microscopy (SEM).

2.2. Materials

The material used for the specimens was an ABS-based composite filament with the addition of aramid fibers, commercially available as Spectrum ABS Kevlar. The percentage of the aramid fiber was small, approximately 5% by volume. The key properties of the material are provided in Table 1.

2.3. Fabrication of the Specimens

The dimensions of the specimens designed as thin-walled square hollow sections using 3D CAD software are given in Figure 1. The specimens varied in wall thickness; four thicknesses were analyzed: 1, 1.4, 1.8, and 2 mm. The outer dimensions of the square hollow sections were 10 × 10 mm. The inner dimensions changed, depending on the wall thickness.
The orientations of the specimens on the build platform of a Zortrax M200 printer are shown in Figure 2.
The printing was performed under the following conditions:
Layer height: 0.19 mm;
Extrusion temperature: 265 °C;
Platform temperature: 105 °C;
Speed: 36 mm/s;
Full infill density;
Raft on.
The printing process was simulated in Zortrax Z-SUITE. Figure 3 shows the infill patterns. The elements with a thickness of 1 mm or 1.4 mm were filled rectilinearly; those with greater dimensions contained a stitch, which may have affected their mechanical properties.

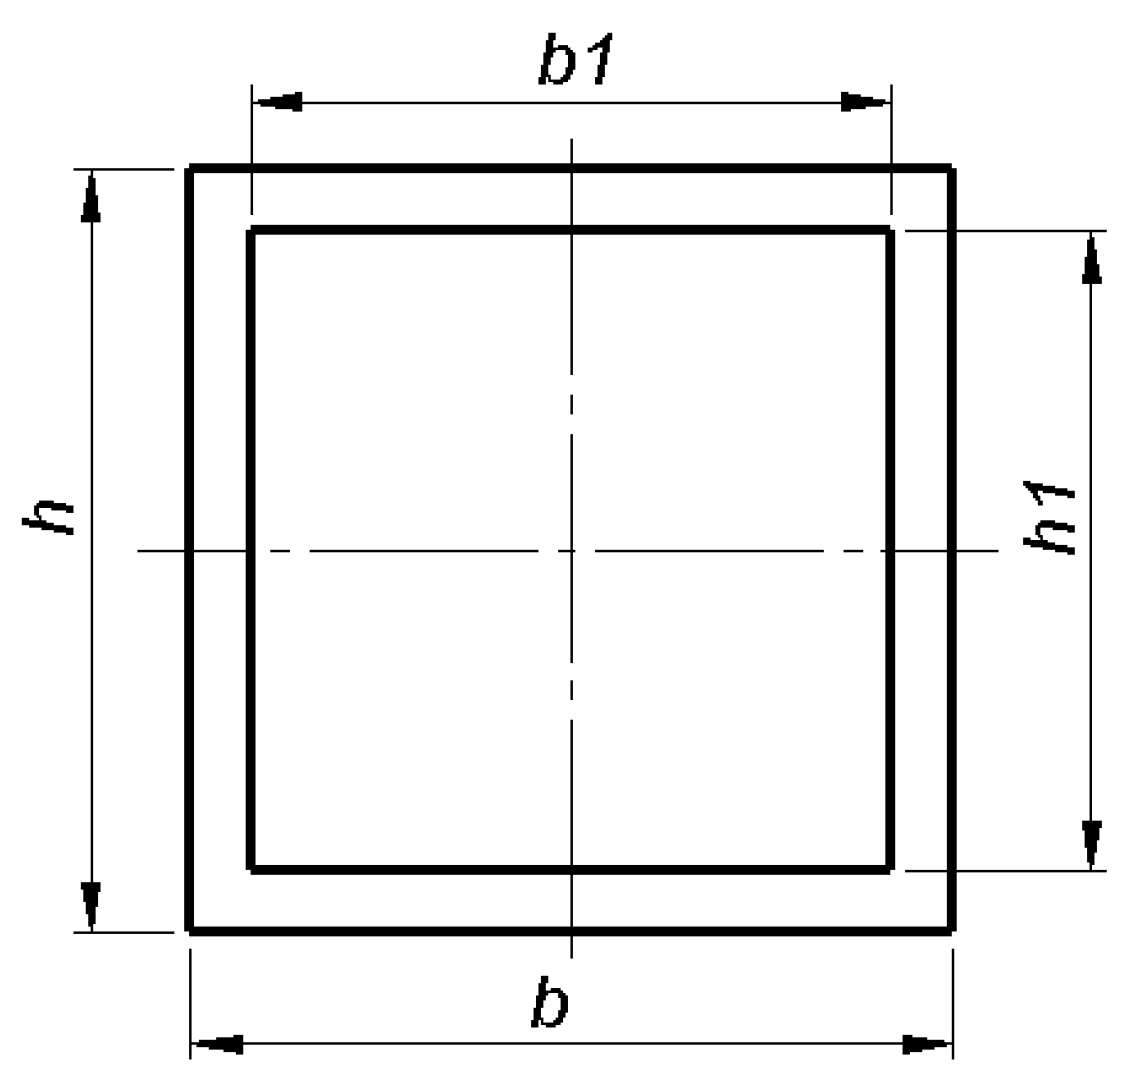
2.4. Dimensional Measurement

The actual dimensions of the 3D-printed specimens differed slightly from the nominal dimensions, i.e., those of the CAD models. The cross-sectional dimensions were determined with an accuracy of 0.01 mm by means of electronic calipers. The specimen cross-section is shown in Figure 4, while the measurement results are provided in Table 2.

2.5. Specimen Identification

Each specimen was given an identification code. The first letter X, Y, or Z stood for the orientation on the build platform. That was followed by the nominal wall thickness. The last number represented the number in a measurement series. Five specimens per series were tested. For example, the symbol Y-1.8-2 stands for the second specimen in a measurement series with a wall thickness of 1.8 mm printed in the Y orientation. Figure 5 shows some identified specimens prepared for the tests.

2.6. Static Flexural Tests

The static three-point flexural test was conducted at a speed of 5 mm/min using an Inspekt mini 3 kN universal testing machine (Hegewald & Peschke MPT GmbH, Nossen, Germany). Figure 6 shows a specimen under three-point bending load.
The flexural strength was calculated from the following Formula (1):
σ B = M W ,
where M is the bending moment exerted by the maximum bending load Fm, and W is the shape factor for a thin-walled square hollow section (Figure 4), calculated as Formula (2):
W = b h 3 b 1 h 1 3 6 h
The flexural strength of each specimen was calculated from the measurement data using the LabMaster software installed on the universal testing machine. The input information was the cross-sectional dimensions and the test results.

2.7. SEM Microscopy

A JEOL JSM-7100F scanning electron microscope (SEM, JEOL, Tokyo, Japan) was used to study the fractured specimens. The analysis was performed at magnifications ranging from 20 to 50,000. The specimens were sputter-coated with gold prior to the observations.

3. Results and Discussion

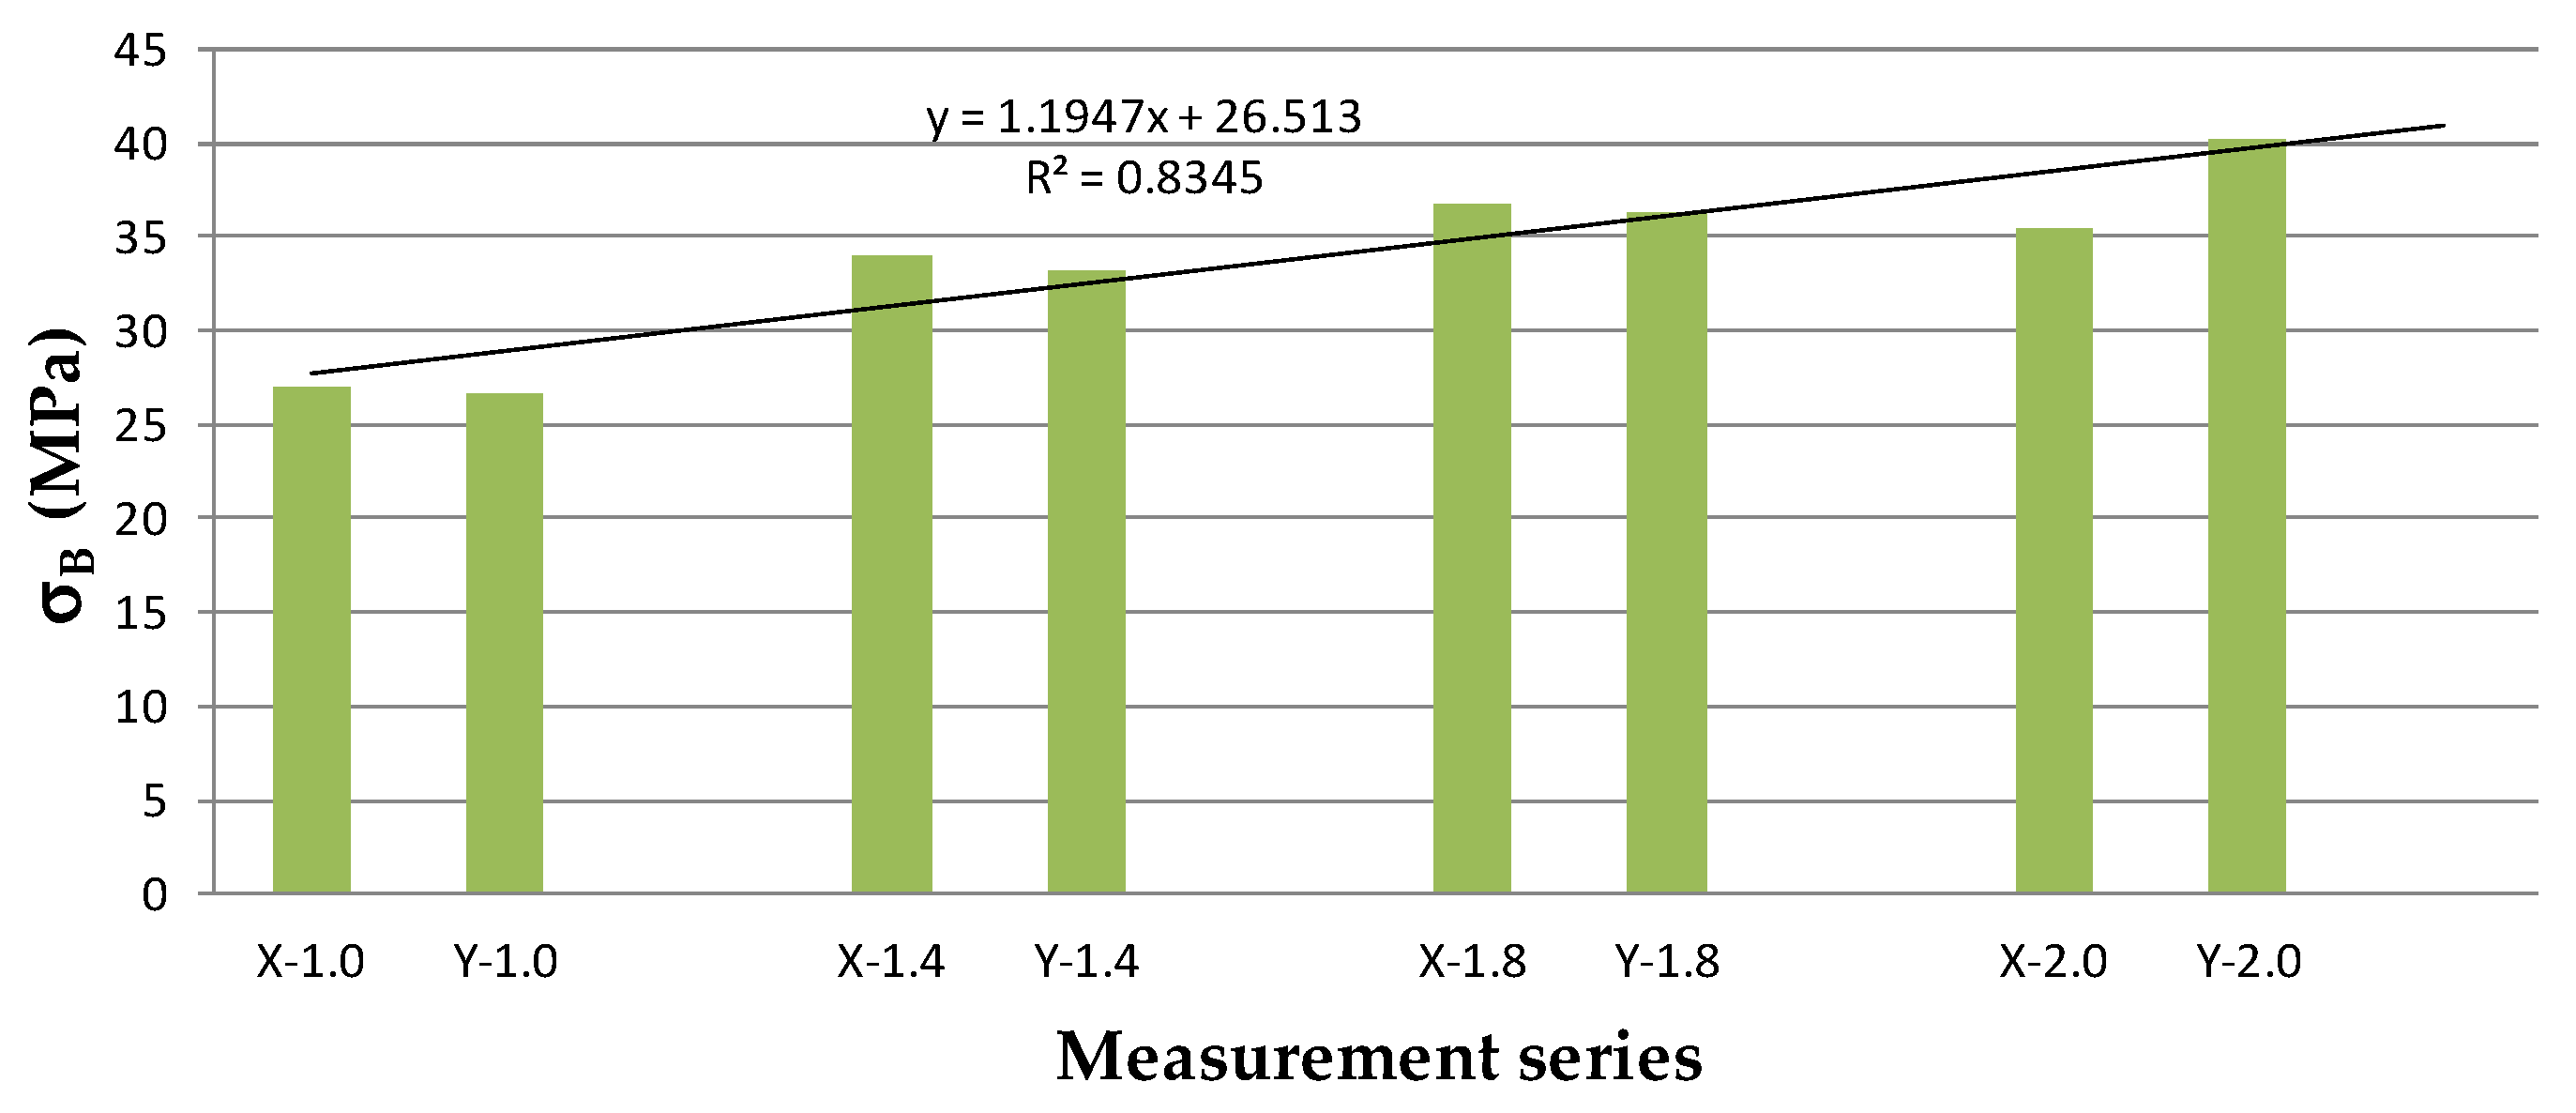
3.1. Static Flexural Tests

The results of the three-point flexural tests were plotted as graphs (Figure 7, Figure 8, Figure 9 and Figure 10).
As can be seen from the plots in Figure 7, Figure 8, Figure 9 and Figure 10, the bending of the specimens built in the X and Y directions was different from that observed for the Z-oriented sections. These differences can be explained by the occurrence of much greater adhesion forces between the filament layers in the Z direction than in the XY direction. The curves indicate a clear plastic deformation (beam deflection about 16–20 mm) for the specimens printed in the X and Y directions. The plastic deformation (beam deflection) obtained for the vertically built (Z-oriented) specimens was much lower, ranging between 6 mm and 9.5 mm. The differences are likely to be due to the inherent feature of the FDM/FFF technology, i.e., the build orientation. Another observation is that for the specimens with the smallest wall thickness (1 mm), there was a large scatter of results concerning the bending load. In analyzing Figure 7 (1 mm specimens), it can be seen that the average value of the maximum bending force is only 32.9 N, and it is on average 57% lower than the average value for the X and Y directions, which is 76 N. A similar characteristic is present for Figure 8, Figure 9 and Figure 10, where the values for the Z direction are smaller: 36%—specimens 1.4 mm and 63%—specimens 1.8 mm and 2 mm. For specimens at 1 and 1.4 mm thickness, the average force drop is therefore 46.5%, and for specimens at 1.8 and 2 mm, it is 63%. It seems that such characteristics may be affected by the various types of filling, where for both thicker samples it was a stitch, and in the case of thinner-linear.
In the case of a few types of 3D printers, it is possible to independently modify the G-code, which in the case of thin-walled specimens could have a positive effect and may have a large industrial meaning. In the case of the 3D printer used—Zortrax, this was not possible. At the same time, comparing the results of the presented research with the previously conducted own work of [28], it can be stated that the software of many 3D printers have some kind of digital gaps. In reference [28], it was noticed that for certain thicknesses of thin-walled samples, there is also no filling or it is in the form of a stitch. The lack of filling occurred despite CAD samples being designed as full. Such a situation resulted in the formation of an empty space inside the thin-walled specimens (making them hollow), i.e., delamination, which negatively affected the mechanical properties of the analyzed samples manufactured with the FDM technology and PLA-based material with the addition of bronze.
The consequence of such conclusions is a suggestion regarding the implementation by manufacturers of 3D printers and software in the FDM technology of an additional module for generating G-codes in the case of 3D printing of thin-walled models.
Figure 7, Figure 8, Figure 9 and Figure 10 include closeups of single specimens simulated in Zortrax Z-SUITE. It can be seen that the specimens with a thickness of 1 mm or 1.4 mm have linear build paths, whereas in thicker specimens (1.8 mm and 2 mm), a stitch is visible to connect the central layers. This way of model building results from the G-codes controlling the print head’s motion, path, and position. The stitch in thin-walled models is clearly the shortcomings of the FDM process. This type of filling generates a much more complex state of stress during bending. At the same time, there is a much greater share of adhesion forces and a smaller share of cohesion between individual distributed fibers (paths) of the filament. For models without a stitch, the situation of the forces is the opposite, which can be explained by the greater strength of the samples without a stitch. This is seen in the example of specimens printed in the direction of the Z axis, where the bending strength is definitely lower compared to models made in the X and Y axes. It seems that by changing the G-codes, we are able to change the method of path formation and, consequently, to modify the mechanical properties of a model.
The flexural strength determined for the specimens in the different measurement series is presented in Table 3, calculated based on equations 1 and 2.
Figure 11 depicts the relationships between the wall thickness and the flexural strength of the specimens printed in the X and Y directions. The flexural strength of the Z-oriented sections was lower and as such was not considered. The data suggest that structural elements, including those in the form of thin-walled square hollow sections, should not be printed in the Z direction.
From the data in Table 3 and Figure 11, it is clear that the flexural strength of the specimens was dependent on the wall thickness. It can be seen that when the wall thickness was 1 mm, the flexural strength reached 60% of that registered for the reference solid specimens with a wall thickness of 2 mm. The linear trend suggests that the differences in strength decrease with increasing thickness (1.4 mm and 1.8 mm). Engineering practice concerning the design of thin-walled orthoses, for instance, shows that the wall thickness is generally 2 mm. If there is a need for topology optimization, this could be achieved by reducing the wall thickness. Such modifications, however, may result in material failure, caused by the changes in its flexural strength. The findings are of importance when specimens are exposed to considerable bending loads and a higher factor of safety is required.

3.2. SEM Microscopy

The results of the microscopic examinations are displayed in Figure 12 and Figure 13.
The SEM images in Figure 12a,b reveal the irregular layered structure of the matrix and reinforcement materials when looked at from the side. Figure 12c shows a closeup of the composite in the fracture region with visible single aramid fibers. In this case, a small percentage of the material (approximately 5% by volume) was used. In Figure 13b,c, the aramid fibers visible have no clear orientation.

4. Conclusions

The conclusions formulated on the basis of the flexural tests and microscopic analysis are as follows.
The addition of aramid fibers did not compensate for the undesirable anisotropic phenomena. The difference in strength between the elements printed in the X or Y direction and those built in the Z direction ranged from 60 to 70%, one has plastic and the other has a brittle nature. These differences can be explained by the occurrence of much greater adhesion forces between the filament layers in the Z direction than in the XY direction. That might have been due to the small amount of fibers present in the whole volume of the composite material. No clear difference was observed between the X- and Y-oriented specimens though. Their flexural strength graphs were similar.
The printing of the thin-walled specimens in the form of square hollow sections did not require any support material, which was an advantage.
For the specimens with a thickness of 1 mm or 1.4 mm, the infill pattern was linear. Thicker specimens (1.8 mm and 2 mm) needed a stitch, which had some negative effects on the strength. Further research is required to study the problem in more detail.
It is not recommended to 3D print square hollow sections in the Z direction (vertically oriented on the build platform).

Author Contributions

Conceptualization, J.B., M.M. and T.K.; methodology, J.B. and T.K.; software, J.B. and M.M.; validation, J.B. and T.K.; formal analysis, J.B. and T.K.; investigation, J.B., M.M. and T.K.; resources, T.K.; data curation, J.B., M.M. and T.K.; writing—original draft preparation, J.B., M.M. and T.K.; writing—review and editing, J.B. and T.K.; visualization, J.B.; supervision, T.K.; project administration, T.K.; funding acquisition, J.B. and T.K. All authors have read and agreed to the published version of the manuscript.

Funding

This research received no external funding.

Data Availability Statement

Not applicable.

Acknowledgments

The authors would like to thank the Laser Processing Research Centre of the Kielce University of Technology and the Polish Academy of Sciences for the microscopic images as well as the valuable comments.

Conflicts of Interest

The authors declare no conflict of interest.

References

  1. Wright, T.M.; Trent, P.S. Mechanical-Properties of aramid fiber-reinforced acrylic bone cement. J. Mater. Sci. 1979, 14, 503–505. [Google Scholar] [CrossRef]
  2. Young, R.J.; Lu, D.; Day, R.J.; Knoff, W.F.; Davis, H.A. Relationship between structure and mechanical-properties for aramid fibers. J. Mater. Sci. 1992, 27, 5431–5440. [Google Scholar] [CrossRef]
  3. Liu, W.; Wu, X.; Li, Y.; Liu, S.; Lv, Y.; Zhang, C. Fabrication of silver ions aramid fibers and polyethylene composites with excellent antibacterial and mechanical properties. e-Polymers 2022, 22, 917–928. [Google Scholar] [CrossRef]
  4. Ari, A.; Bayram, A.; Karahan, M.; Karagöz, S. Comparison of the mechanical properties of chopped glass, carbon, and aramid fiber reinforced polypropylene. Polym. Polym. Compos. 2022, 30, 096739112210985. [Google Scholar] [CrossRef]
  5. Kim, S.; Lee, J.; Roh, C.; Eun, J.; Kang, C. Evaluation of carbon fiber and p-aramid composite for industrial helmet using simple cross-ply for protecting human heads. Mech. Mater. 2019, 139, 103203. [Google Scholar] [CrossRef]
  6. Çakir, M.; Akin, E.; Renda, G. Mechanical properties of carbon-aramid hybrid fiber-reinforced epoxy/poly(vinyl butyral) composites. Polym. Compos. 2023, 44, 4826–4841. [Google Scholar] [CrossRef]
  7. Mazur, K.; Siwy, Z.S.; Adamczyk, A.; Kuciel, S. Synergistic effect of aramid and basalt fibers on mechanical, thermal and dynamic properties of polylactide hybrid composites. Ind. Crops Prod. 2023, 198, 116630. [Google Scholar] [CrossRef]
  8. Bochnia, J.; Blasiak, S. Anisotrophy of mechanical properties of a material which is shaped incrementally using Polyjet technology. In Engineering Mechanics 2016; Zolotarev, I., Radolf, V., Eds.; Acad Sci Czech Republic, Inst Thermomechanics: Prague, Czech Republic, 2016; pp. 74–77. [Google Scholar]
  9. Valvez, S.; Silva, A.P.; Reis, P.N.B.; Berto, F. Annealing effect on mechanical properties of 3D printed composites. In Proceedings of the 4th International Conference on Structural Integrity (ICSI 2021), Funchal, Portugal, 30 August–2 September 2021; Moreira, P., Tavares, P., Eds.; Elsevier Science BV: Amsterdam, The Netherlands, 2022; Volme 37, pp. 738–745. [Google Scholar]
  10. Rijckaert, S.; Daelemans, L.; Cardon, L.; Boone, M.; Van Paepegem, W.; De Clerck, K. Continuous Fiber-Reinforced Aramid/PETG 3D-Printed Composites with High Fiber Loading through Fused Filament Fabrication. Polymers 2022, 14, 298. [Google Scholar] [CrossRef]
  11. Rimkus, A.; Farh, M.M.; Gribniak, V. Continuously Reinforced Polymeric Composite for Additive Manufacturing—Development and Efficiency Analysis. Polymers 2022, 14, 3471. [Google Scholar] [CrossRef]
  12. Bin Naveed, A.; Butt, S.I.; Mubashar, A.; Chaudhry, F.N.; ul Qadir, N.; Faping, Z. Design and verification of enhanced CFRTPCs fabrication technique using fused deposition modeling. J. Thermoplast. Compos. Mater. 2022, 35, 1957–1980. [Google Scholar] [CrossRef]
  13. Sitotaw, D.B.; Ahrendt, D.; Kyosev, Y.; Kabish, A.K. Investigation of Stab Protection Properties of Aramid Fibre-Reinforced 3D Printed Elements. FIBRES Text. East. Eur. 2021, 29, 66–72. [Google Scholar] [CrossRef]
  14. Valvez, S.; Silva, A.P.; Reis, P.N.B. Optimization of Printing Parameters to Maximize the Mechanical Properties of 3D-Printed PETG-Based Parts. Polymers 2022, 14, 2564. [Google Scholar] [CrossRef]
  15. Mesicek, J.; Jancar, L.; Ma, Q.-P.; Hajnys, J.; Tanski, T.; Krpec, P.; Pagac, M. Comprehensive View of Topological Optimization Scooter Frame Design and Manufacturing. Symmetry 2021, 13, 1201. [Google Scholar] [CrossRef]
  16. Meyer, P.; Döpke, C.; Ehrmann, A. Improving adhesion of three-dimensional printed objects on textile fabrics by polymer coating. J. Eng. Fiber. Fabr. 2019, 14, 155892501989525. [Google Scholar] [CrossRef]
  17. Dziubek, T.; Budzik, G.; Kawalec, A.; Debski, M.; Turek, P.; Oleksy, M.; Paszkiewicz, A.; Polinski, P.; Kochmanski, L.; Kleibicki, M.; et al. Strength of threaded connections additively produced from polymeric materials. Polimery 2022, 67, 261–270. [Google Scholar] [CrossRef]
  18. Sarzyński, B.; Kluczyński, J.; Łuszczek, J.; Grzelak, K.; Szachogłuchowicz, I.; Torzewski, J.; Śnieżek, L. Process Parameter Investigation and Torsional Strength Analysis of the Additively Manufactured 3D Structures Made of 20MnCr5 Steel. Materials 2023, 16, 1877. [Google Scholar] [CrossRef] [PubMed]
  19. Swiderski, J.; Makiela, W.; Dobrowolski, T.; Stepien, K.; Zuperl, U. The study of the roundness and cylindricity deviations of parts produced with the use of the additive manufacturing. Int. J. Adv. Manuf. Technol. 2022, 121, 7427–7437. [Google Scholar] [CrossRef] [PubMed]
  20. Wan, A.; Hamid, W.L.H.; Iannucci, L.; Robinson, P. Flexural behaviour of 3D-printed carbon fibre composites: Experimental and virtual tests—Application to composite adaptive structure. Compos. Part C Open Access 2023, 10, 100344. [Google Scholar] [CrossRef]
  21. Hou, Z.; Liu, P.; Tian, X.; Zhu, W.; Wang, C.; He, J.; Lan, H.; Li, D. Hybrid effect of 3D-printed coaxial continuous hybrid fibre-reinforced composites. Thin-Walled Struct. 2023, 188, 110820. [Google Scholar] [CrossRef]
  22. Rendas, P.; Figueiredo, L.; Geraldo, M.; Vidal, C.; Soares, B.A. Improvement of tensile and flexural properties of 3D printed PEEK through the increase of interfacial adhesion. J. Manuf. Process. 2023, 93, 260–274. [Google Scholar] [CrossRef]
  23. Senthilrajan, S.; Venkateshwaran, N.; Naresh, K.; Velmurugan, R.; Gupta, N.K. Effects of jute fiber length and weight percentage on quasi-static flexural and dynamic mechanical properties of jute/polyester composites for thin-walled structure applications. Thin-Walled Struct. 2022, 179, 109719. [Google Scholar] [CrossRef]
  24. Luo, G.; Chai, C.; Chen, Y.; Li, L.; Xue, P. Investigations on the quasi-static/dynamic mechanical properties of 3D printed random honeycombs under in-plane compression. Thin-Walled Struct. 2023, 190, 110931. [Google Scholar] [CrossRef]
  25. Sindinger, S.-L.; Marschall, D.; Kralovec, C.; Schagerl, M. Structural Response Prediction of Thin-Walled Additively Manufactured Parts Considering Orthotropy, Thickness Dependency and Scatter. Materials 2021, 14, 2463. [Google Scholar] [CrossRef] [PubMed]
  26. Bochnia, J.; Blasiak, M.; Kozior, T. Tensile Strength Analysis of Thin-Walled Polymer Glass Fiber Reinforced Samples Manufactured by 3D Printing Technology. Polymers 2020, 12, 2783. [Google Scholar] [CrossRef]
  27. Bochnia, J.; Blasiak, M.; Kozior, T. A Comparative Study of the Mechanical Properties of FDM 3D Prints Made of PLA and Carbon Fiber-Reinforced PLA for Thin-Walled Applications. Materials 2021, 14, 7062. [Google Scholar] [CrossRef]
  28. Bochnia, J.; Kozior, T.; Blasiak, M. The Mechanical Properties of Thin-Walled Specimens Printed from a Bronze-Filled PLA-Based Composite Filament Using Fused Deposition Modelling. Materials 2023, 16, 3241. [Google Scholar] [CrossRef]
  29. Bochnia, J.; Kozior, T.; Zyz, J. The Mechanical Properties of Direct Metal Laser Sintered Thin-Walled Maraging Steel (MS1) Elements. Materials 2023, 16, 4699. [Google Scholar] [CrossRef]
  30. ABS Kevlar, Spectrum Filaments, Technical Data Sheet. 2022. Available online: www.spectrumfilaments.com (accessed on 25 July 2023).
Figure 1. Specimen in the form of a square hollow section with variable wall thickness, equal: 1 mm, 1.4 mm, 1.8 mm, and 2 mm.
Fibers 11 00077 g001
Figure 2. Specimens printed in different orientations on the build platform.
Fibers 11 00077 g002
Figure 3. Simulation of the 3D printing of thin-walled sections (for a cross-section of 5 mm above the build platform), with red representing the infill direction (red line shows linear infill or stitch).
Fibers 11 00077 g003
Figure 4. Cross-sectional dimensions of a thin-walled square hollow section.
Fibers 11 00077 g004
Figure 5. Examples of identified specimens before the flexural tests.
Fibers 11 00077 g005
Figure 6. Specimen subjected to bending.
Fibers 11 00077 g006
Figure 7. Load vs. deflection graphs for the specimens with a nominal wall thickness of 1 mm (a) printed in the X and Y directions and (b) printed in the Z direction.
Fibers 11 00077 g007
Figure 8. Load vs. deflection graphs for the specimens with a nominal wall thickness of 1.4 mm (a) printed in the X and Y directions and (b) printed in the Z direction.
Fibers 11 00077 g008
Figure 9. Load vs. deflection graphs for the specimens with a nominal wall thickness of 1.8 mm (a) printed in the X and Y directions and (b) printed in the Z direction.
Fibers 11 00077 g009
Figure 10. Load vs. deflection graphs for the specimens with a nominal wall thickness of 2 mm (a) printed in the X and Y directions and (b) printed in the Z direction.
Fibers 11 00077 g010
Figure 11. Flexural strength versus wall thickness for the specimens printed in the X and Y directions.
Fibers 11 00077 g011
Figure 12. SEM images of the composite structure: (a) side view, magnification x50; (b) side view, magnification x100; and (c) fracture area with aramid fibers, magnification x500.
Fibers 11 00077 g012
Figure 13. Images of the material structure in the fracture region: (a) matrix magnified x50,000; (b) fiber-reinforced material magnified x50,000; and (c) fiber-reinforced material magnified x5000.
Fibers 11 00077 g013
Table 1. Selected properties of Spectrum ABS Kevlar [30].
PropertyValueStandard
Density1.05 g/cm3ISO 1183
Unnotched, injection molding14 kJ/m2ISO 179-1eU
Notched, injection molding6.1 kJ/m2ISO 179-1eA
Tensile elongation at yield *1.9%ISO 527
Tensile elongation at break *6.00%ISO 527
Tensile strength at yield *35 MPaISO 527
Tensile strength at break *30 MPaISO 527
Elastic modulus (speed—1 mm/min)2350 MPaISO 527
VICAT Softening point **95 °CISO 306
* Speed 5 mm/min; ** 50 N (heating rate 50 °C/h), injection molding.
Table 2. Dimensions of the specimens used in the flexural tests.
No.
X-1.0
b
(mm)
h
(mm)
b1
(mm)
h1
(mm)
No.
Y-1.0
b
(mm)
h
(mm)
b1
(mm)
h1
(mm)
No.
Z-1.0
b
(mm)
h
(mm)
b1
(mm)
h1
(mm)
110.3610.127.647.82110.3210.027.567.84110.3710.287.607.53
210.3610.017.367.78210.4210.187.607.94210.2510.307.417.50
310.3910.067.617.88310.3710.027.527.70310.2010.327.57.7.58
410.3110.007.517.80410.3610.087.667.68410.4110.217.537.60
510.3410.007.587.82510.3610.027.577.74510.2610.587.447.51
x ¯ 10.3510.047.547.82 x ¯ 10.3710.067.587.78 x ¯ 10.3010.347.517.54
SD0.030.050.110.04SD0.040.070.050.11SD0.090.140.090.04
No.
X-1.4
b
(mm)
h
(mm)
b1
(mm)
h1
(mm)
No.
Y-1.4
b
(mm)
h
(mm)
b1
(mm)
h1
(mm)
No.
Z-1.4
b
(mm)
h
(mm)
b1
(mm)
h1
(mm)
110.5810.077.056.62110.4810.086.517.05110.5110.616.426.52
210.5210.097.106.54210.6510.196.426.96210.5910.546.386.44
310.5410.057.116.52310.6310.056.456.91310.5210.566.446.55
410.5510.117.006.58410.6110.086.407.00410.5410.556.356.51
510.6010.117.056.55510.5410.116.416.76510.4810.536.356.38
x ¯ 10.5610.097.066.56 x ¯ 10.5810.106.446.93 x ¯ 10.5310.566.396.48
SD0.030.030.040.04SD0.070.050.040.11SD0.040.030.040.07
No.
X-1.8
b
(mm)
h
(mm)
b1
(mm)
h1
(mm)
No.
Y-1.8
b
(mm)
h
(mm)
b1
(mm)
h1
(mm)
No.
Z-1.8
b
(mm)
h
(mm)
b1
(mm)
h1
(mm)
110.629.836.206.68110.2510.035.966.34110.5510.415.855.70
210.479.986.036.18210.2310.015.866.43210.3610.256.005.92
310.479.996.046.37310.3010.025.786.40310.3210.255.996.01
410.4410.056.096.22410.3710.175.606.18410.2810.456.995.98
510.419.946.006.17510.4610.076.326.48510.3510.296.065.92
x ¯ 10.489.956.076.32 x ¯ 10.3210.065.906.36 x ¯ 10.3710.335.985.90
SD0.080.080.080.21SD0.090.070.270.12SD0.100.090.460.12
No.
X-2.0
b
(mm)
h
(mm)
b1
(mm)
h1
(mm)
No.
Y-2.0
b
(mm)
h
(mm)
b1
(mm)
h1
(mm)
No.
Z-2.0
b
(mm)
h
(mm)
b1
(mm)
h1
(mm)
110.5210.005.585.75110.5910.035.575.90110.4010.395.605.73
210.7310.285.675.65210.4310.075.725.83210.6010.575.535.63
310.5210.245.595.69310.3210.025.625.99310.4510.455.675.64
410.8810.305.845.72410.5510.075.515.89410.5210.525.635.68
510.5010.115.645.96510.5010.135.525.93510.3710.345.595.53
x ¯ 10.6310.185.665.75 x ¯ 10.4810.065.595.91 x ¯ 10.4710.455.605.64
SD0.170.130.110.12SD0.110.040.090.06SD0.090.090.050.07
Table 3. Mean flexural strength obtained in the particular measurement series.
Measurement Series SymbolW
(mm3)
σB
(MPa)
X-1.0114.0326.93
Y-1.0114.0326.65
Z-1.0131.659.99
X-1.4141.0533.97
Y-1.4144.5133.15
Z-1.4168.2718.12
X-1.8147.2636.79
Y-1.8148.9236.28
Z-1.8164.0712.05
X-2.0165.9935.50
Y-2.0144.5140.18
Z-2.0174.5412.35
Disclaimer/Publisher’s Note: The statements, opinions and data contained in all publications are solely those of the individual author(s) and contributor(s) and not of MDPI and/or the editor(s). MDPI and/or the editor(s) disclaim responsibility for any injury to people or property resulting from any ideas, methods, instructions or products referred to in the content.

