Article

Thin-Layer Fibre-Reinforced Concrete Sandwich Walls: Numerical Evaluation †

1
Faculty of Environment and Civil Engineering, Latvia University of Life Sciences and Technologies, Akademijas Street 19, LV-3001 Jelgava, Latvia
2
Būvfizika Ltd., LV-2164 Ādaži, Latvia
*
Author to whom correspondence should be addressed.
This paper is an extended version of our paper published in the 6th fib International Congress “Concrete Innovation for Sustainability”, Oslo, Norway, 12–16 June 2022, p. 1274—Paper “Numerical Evaluation of Thin-Layer Fibre Reinforced Concrete Sandwich Walls”: With Permission from the International Federation for Structural Concrete (fib).
Fibers 2023, 11(2), 19; https://doi.org/10.3390/fib11020019
Submission received: 3 January 2023 / Revised: 3 February 2023 / Accepted: 7 February 2023 / Published: 9 February 2023

Abstract

:
In this study, structural thin-layer sandwich walls (SWs) made of steel-fibre-reinforced concrete (SFRC) without conventional reinforcements were investigated. Other researchers have shown that SWs with thin wythes can be used as load bearing structures in low-rise buildings, thereby reducing the amount of concrete by 2–5 times if compared to conventional reinforced-concrete SWs. In most studies, relatively warm climatic regions are the focus, and thin-layer SWs with shear connectors to obtain a certain level of composite action are investigated. In almost no studies has sound insulation been evaluated. In this study, a numerical investigation of structural, thermal and sound insulation performances was carried out. The load-bearing capacities of composite and non-composite SWs are compared. Regions with the lowest five-day mean air temperature of −20 C were considered. The characteristics of the SW are compared to the requirements given in relevant European and Latvian standards. The minimum thermal insulation for family houses varies from 120 mm to 200 mm, depending on the material. To ensure sufficient sound insulation, the average thickness of the concrete wythes should be around 60 mm, preferably with a 15 mm difference between them. Structural analysis of the proposed wall panel was performed using non-linear finite element analysis software ATENA Science. The obtained load-bearing capacity exceeded the design loads of a single-story family house by around 100 times, regardless of the degree of composite action.

Graphical Abstract

1. Introduction

Affordable and energy-efficient housing is a direction the building industry should be headed in due to climate change and global poverty. Concrete, as a structural material, has its flaws but also potential for this topic. High CO 2 emissions of concrete production force a reduction in its use. On the other hand, its high durability, fire resistance and good thermal inertia are the properties needed to build housing with low maintenance costs and long lifetimes.
One of well-used structural systems is precast concrete sandwich walls (SWs). Conventional SWs consist mainly of three layers—two outer concrete wythes and insulation layer as the core. Usually, one of the wythes is designed as a load-bearing panel with a thickness of 150 mm or more, and the other serves as a non-bearing façade. Precast concrete sandwich walls are well described in the PCI report [1]. With walls of this type, energy-efficiency and durability can be achieved; however, they are not normally used in affordable housing [2]. There are several reasons for that: (1) the production is rather complex, (2) the load-bearing concrete layer is too thick for low-rise buildings, and (3) the overall costs are high [2].
As a solution, thin-layer load-bearing SWs have been suggested by numerous researchers [3,4,5]. Insulated panels with the 20–75 mm tick wythes and 40–160 mm thick insulation were proposed and evaluated by experimental testing [6,7,8,9,10,11,12,13,14,15,16,17,18]. Most studies propose the wythes to be reinforced with conventional metallic or non-metallic mesh or bars. However, fibres might be a good alternative that could simplify the manufacturing process.
Steel-fibre-reinforced concrete (SFRC) SWs were suggested by Barros et al. [19] and further studied by Lameiras et al. [15,20,21]. The walls were designed with thin outer SFRC layers, 30 mm to 60 mm thick, having no conventional reinforcement. The bearing capacity was ensured by composite behaviour of the cross-section obtained by stiff shear connectors. The presence of steel fibres ensured the necessary level of ductility, thereby eliminating brittle failure. Such walls are good for single-story buildings, e.g., family houses. Due to the comparatively small amount of concrete, the proposed solution can address some environmental and affordable housing issues mentioned above.
The optimal cross-section of an SW strongly depends on the region and environmental conditions where the particular building is located. These load-bearing SWs are not optimised and analysed for northern climatic regions. The increased width of the core thermal insulation layer can change the structural performance of the wall [14]. Three types of SW panels are usually distinguished, based on their mechanical behaviour: non-composite, composite and partially composite [22,23]. A higher level of composite action is suggested by other researchers if thin-layer SWs are considered [3,24]. On the other hand, higher composite action can lead to more pronounced bowing issues [25]. An evaluation is needed to understand whether a non-composite thin-layer SW can be used as a load bearing structure.
One of the main problems of thin structures under in-plane compression is buckling. If two thin wythes are set apart and connected with shear connectors, a composite cross-section can be obtained, and both wythes are considered as structural wythes. Thus, the slenderness of such a wall can be reduced and the critical buckling load is increased significantly. If non-composite connectors are used, only the loaded wythe is considered as the structural wythe [25]; therefore, a significantly smaller buckling load is expected. On the other hand, the structural wythe is laterally connected to the non-structural wythe, which can be considered as a string support. The effect of the adjacent non-structural wythe on the buckling load of the loaded wythe needs to be investigated. It is important for SW with shear connectors as well, because in reality, most of the SW panels designed as composites act as partial composites [22,23].
In addition to the structural evaluation, requirements for thermal and sound insulation need to be considered. Thermal properties have also been evaluated by other authors [3,9,26], but they depend on the climatic region. Apart from the thickness of the cross-section, they can also influence the detailing of the SWs with regard to inter wythe connectors, base footing and wall-slab connection that need to be evaluated.
Sound resistance, however, has hardly been addressed at all in the mentioned studies. As the aim of using thin-layer SWs is to minimise the thickness of the structure, requirements for the minimum sound insulation may also play a significant role. It is important to bring this aspect into a study, as it can influence not only the total thickness of the SWs, but the thickness of each SFRC layer.
The aim of this study was to evaluate whether thin-layer SFRC SWs are suitable for family houses in Latvia and other countries with similar environmental conditions. The evaluation was performed by means of numerical analysis of thermal, sound insulation, and structural performance using corresponding software: WUFI, FLIXO, INSUL and ATENA Science. The structural safety level was verified according to Eurocodes and Latvian National Annexes. A comparison of the load-bearing capacity between the composite and non-composite SW was carried out. The thermal performance and sound insulation were compared with relevant European, ISO, and Latvian Construction standards.

2. Materials and Methods

2.1. Thermal Analysis

The thermal analysis was performed for an external wall of a single-story family house in Latvia (Northern Europe). Two types of thermal insulation were considered: expended polystyrene (EPS) and polyurethane (PUR). The thickness of the insulation layer was calculated based on the optimal U value to be close to 0.2 W/(m 2 K). That resulted in two different thickness values: 200 mm for EPS and 120 mm for PUR. Material properties considered in the thermal analysis are given in Table 1. Equal thickness (60 mm) for both concrete layers was used. Thermal properties of the wall’s cross-section are given in Table 2.
Computer software was utilised to simulate the thermal performance. Moisture conditions were analysed by the programme WUFI Pro (Wärme Und Feuchte Instationär) [27]. One-dimensional hygrothermal calculations on the wall cross-section, taking into account built-in moisture, driving rain, solar radiation, long-wave radiation, capillary transport, and summer condensation were performed. The hygrothermal performance of the wall was determined under real climate conditions by using dynamic hygrothermal analysis according to standard EN 15026:2007 [28]. Thermal bridge values for the analysed building envelope were detected by performing a simulation with the software “Flixo” [29] that has veen validated according to European standards [30,31].
A correction value Ψ is used to evaluate linear-shaped thermal bridges. Such bridges are at the top and bottom of the wall. At the top, the bridge was caused due to the corner, reduction of thermal insulation and higher width at the bearing of the inner wythe (see Figure 1). The correction value is calculated as follows:
Ψ = Φ Δ T U i · b i ,
where Φ —heat flow (W/m); Δ T —difference between inside and outside temperatures; U i U-value of the wall or roof; b i —length between cut-off planes of the structure considered in calculation (m). Minimum values for the distances b i are given in the standard [30]. Although the limit for the Ψ value was set to be 0.2 according to the Latvian Building Regulations [32], it is assumed that a value below 0.1 is needed for a satisfactory result.
At the bottom of the wall, the thermal bridge was formed due to heat flow through the foundation. This area was evaluated by the surface temperature. It was assumed that the temperature difference between the surface of the wall and the air should be less than 4 degrees. If it were more than 12 degrees, condensation on the surface could occur. Three different arrangements of external insulations were considered: (1) no additional insulation, (2) vertical, and (3) horizontal insulation. Dimensions of the foundation and the arrangements of the insulation are given in Figure 2.
To evaluate the thermal performance, the following air temperatures were used: (1) interior temperature was 20 C, (2) exterior temperature was −10 C and (3) ground temperature at the top surface was 0 C.

2.2. Sound Insulation Analysis

Sound insulation for an external bedroom wall in a single-story family house without doors and windows was evaluated. The current analysis was limited to airborne noise, excluding impact noise, which usually is relevant for horizontal structures such as floor slabs. The SW cross-section composition and corresponding material properties were the same as in the thermal analysis given in Table 1 and Table 2. To evaluate the influence of the thickness of SFRC wythes, additional cross-section compositions were introduced. Three types of connections between outer layers were considered: (1) no connectors, (2) horizontal steel connectors with spacing of 400 × 400 mm and (3) 200 × 200 mm. The panels without connectors were calculated as a three-layer panel, in which the outer layers were connected to each other by the elastic core layer. All the wall types analysed in this study are given in Table 3.
The properties of the layers defined in the analysis were density, thickness, damping, modulus of elasticity or stiffness and flow resistivity. The flow resistivity for EPS and PUR was 20,000 kg/(s·m 2 ). Damping was assumed to be equal to 0.01, as suggested in cases where it is not known [33]. The modulus of elasticity for SFRC is 33.0 GPa. At low frequencies, the sound insulation of a wall can be affected by resonances of the stiffened plates formed by the connectors between the outer layers [33].
Sound insulation R w was estimated in INSUL [34]. The analysis was based mainly on mass law [35], according to which, the sound insulation effect Δ R of a wall increases by 6 dB if the mass of the wall or the frequency of the sound is doubled. The mass law is given in Equation (2):
Δ R = 20 log f m s 47.3 ,
where f—frequency (Hz); m s —area density of the panel material (kg/m 2 ); 47.3—numerical constant. In the case of double-layer panels, Δ R increases by 18 dB per octave if frequency is above the critical value f c . The critical value can be found by the following formula:
f c = 1 2 π 3.6 ρ 0 c 0 2 m d
where
m = 2 m 1 m 2 m 1 + m 2 ;
m i —mass of each panel (kg); ρ 0 —air density (kg/m 3 ); c 0 —air velocity (m/s); d—distance between panels (m). According to Equation (3), the critical frequency f c will be low for a material with high mass, and vice versa. In addition, transport noise correction is used according to Equation (4):
R t r , s , w = R w + C t r ( 100 3150 Hz ) ,
where R t r , s , w —sound insulation index; R w —sound reduction (dB); C t r ( 100 3150   Hz ) — correction for transport noise (dB). The limits of sound reduction were evaluated according to the Latvian Building Regulations [36,37]. There are maximum levels for allowable environment noise set by the Latvian Building Regulations, which are 50 to 65 dB, depending on the function of a particular area [37]. However, actual environmental noise levels can be higher, because not all of the historical areas are built according to these regulations. Another limiting value can be derived from the Regulation [36], which provides requirements for sound insulation from environmental noise of 55 to 78 dB. The required sound insulation of external walls R t r , s , w , including windows and doors corresponding to this range, is greater than 25 or 49 dB. In this study, however, due to the wide range of possible input parameters, the wall panels without any leaks for sound (windows, doors, holes for ventilation, and connections with other structures) were considered. Therefore, a reserve of approximately 3–5 dB has to be taken into account when comparing the results with the limiting values.

2.3. Structural Analysis and Design

Structural performance was evaluated for internal and external walls of a single-storey building. The height of the wall from foundation to roof slab was 3.5 m. The wall consisted of three layers. The two outer wythes were 60 mm thick SFRC. The middle layer was 150 mm thick thermal insulation. Composite behaviour of the cross-section of the wall was assumed, which was ensured by steel truss type connectors between the outer layers. In addition, non-composite behaviour of the wall was modelled by introducing horizontal wires to connect the wythes. It was assumed that these two types of connectors represented the upper and lower boundaries for the load-bearing capacity.
Two design situations were considered: (1) persistent and (2) transient. The transient situation refers to manufacturing, transporting and construction processes. In this analysis, the loading due to the lifting up from horizontal moulds was considered. See Figure 3 for visual representation of the applied loads.
The persistent situation refers to normal use of the wall, after the house is built. The main actions result from the loads of the roof slab, wind and temperature loads. Visualisation of the load combinations in a persistent situation is given in Figure 4.

Actions

Self-weight in a horizontal position (3.2 kN/m 2 ) and adhesion between the concrete surface and mould (1.0 kN/m 2 ) are considered in the transient design situation. An equally distributed load of 4.2 kN/m 2 in total is applied perpendicularly to the wall with dimensions of 3.5 m × 6.0 m. Four lifting points were introduced and positioned approx. 0.9 m from the top and bottom side and 1.5 m from other two sides of the wall.
In the persistent design situation, the following loads were considered: (1) wall’s self-weight in vertical position, (2) dead load of the roof slab, (3) snow load, (4) wind load and (5) temperature loads in both winter and summer. The design values of loads 2 to 4 are given in Table 4. Load safety factors were 1.5 and 1.35 for live and dead loads, respectively. It was assumed that the span of the roof slab can reach up to 6.0 m. Thus, the line load from the roof slab on the inner wall was 7.35 kN/m 2 × 6.0 m ≈ 45 kN/m, and on the external wall it was 22.5 kN/m.
Temperature loads were taken according to standard EN 1991-1-5 [38] and its Latvian National Annex [39]. Two extreme conditions, the lowest temperature in winter and the highest temperature in summer, were considered. The outdoor temperature taken is only likely to be exceeded once in 50 years. In winter time, the inner air temperature was taken as +25 C, and the outdoor temperature ranged from −31.5 C to −41.0 C. The temperature difference between the inner and outer wythes was calculated: 41.0 C + 25.0 C = 76.0 C. In summer time, the inner air temperature was taken as +20 C, but the outdoor temperature ranged from +33.1 C to +36.0 C. Temperature on the surface of the outer wythe was 36.0 C + 37.0 C = 73.0 C, for a dark-coloured one that was facing southwest. The temperature difference between the inner and outer wythes was 73.0 C−20.0 C = 53.0 C. One metre of the bottom of the wall was in the ground, where the temperatures according to the National Annex [39] are +7.0 C and −6.0 C in summer and winter, respectively.

2.4. Nonlinear FEM Analysis
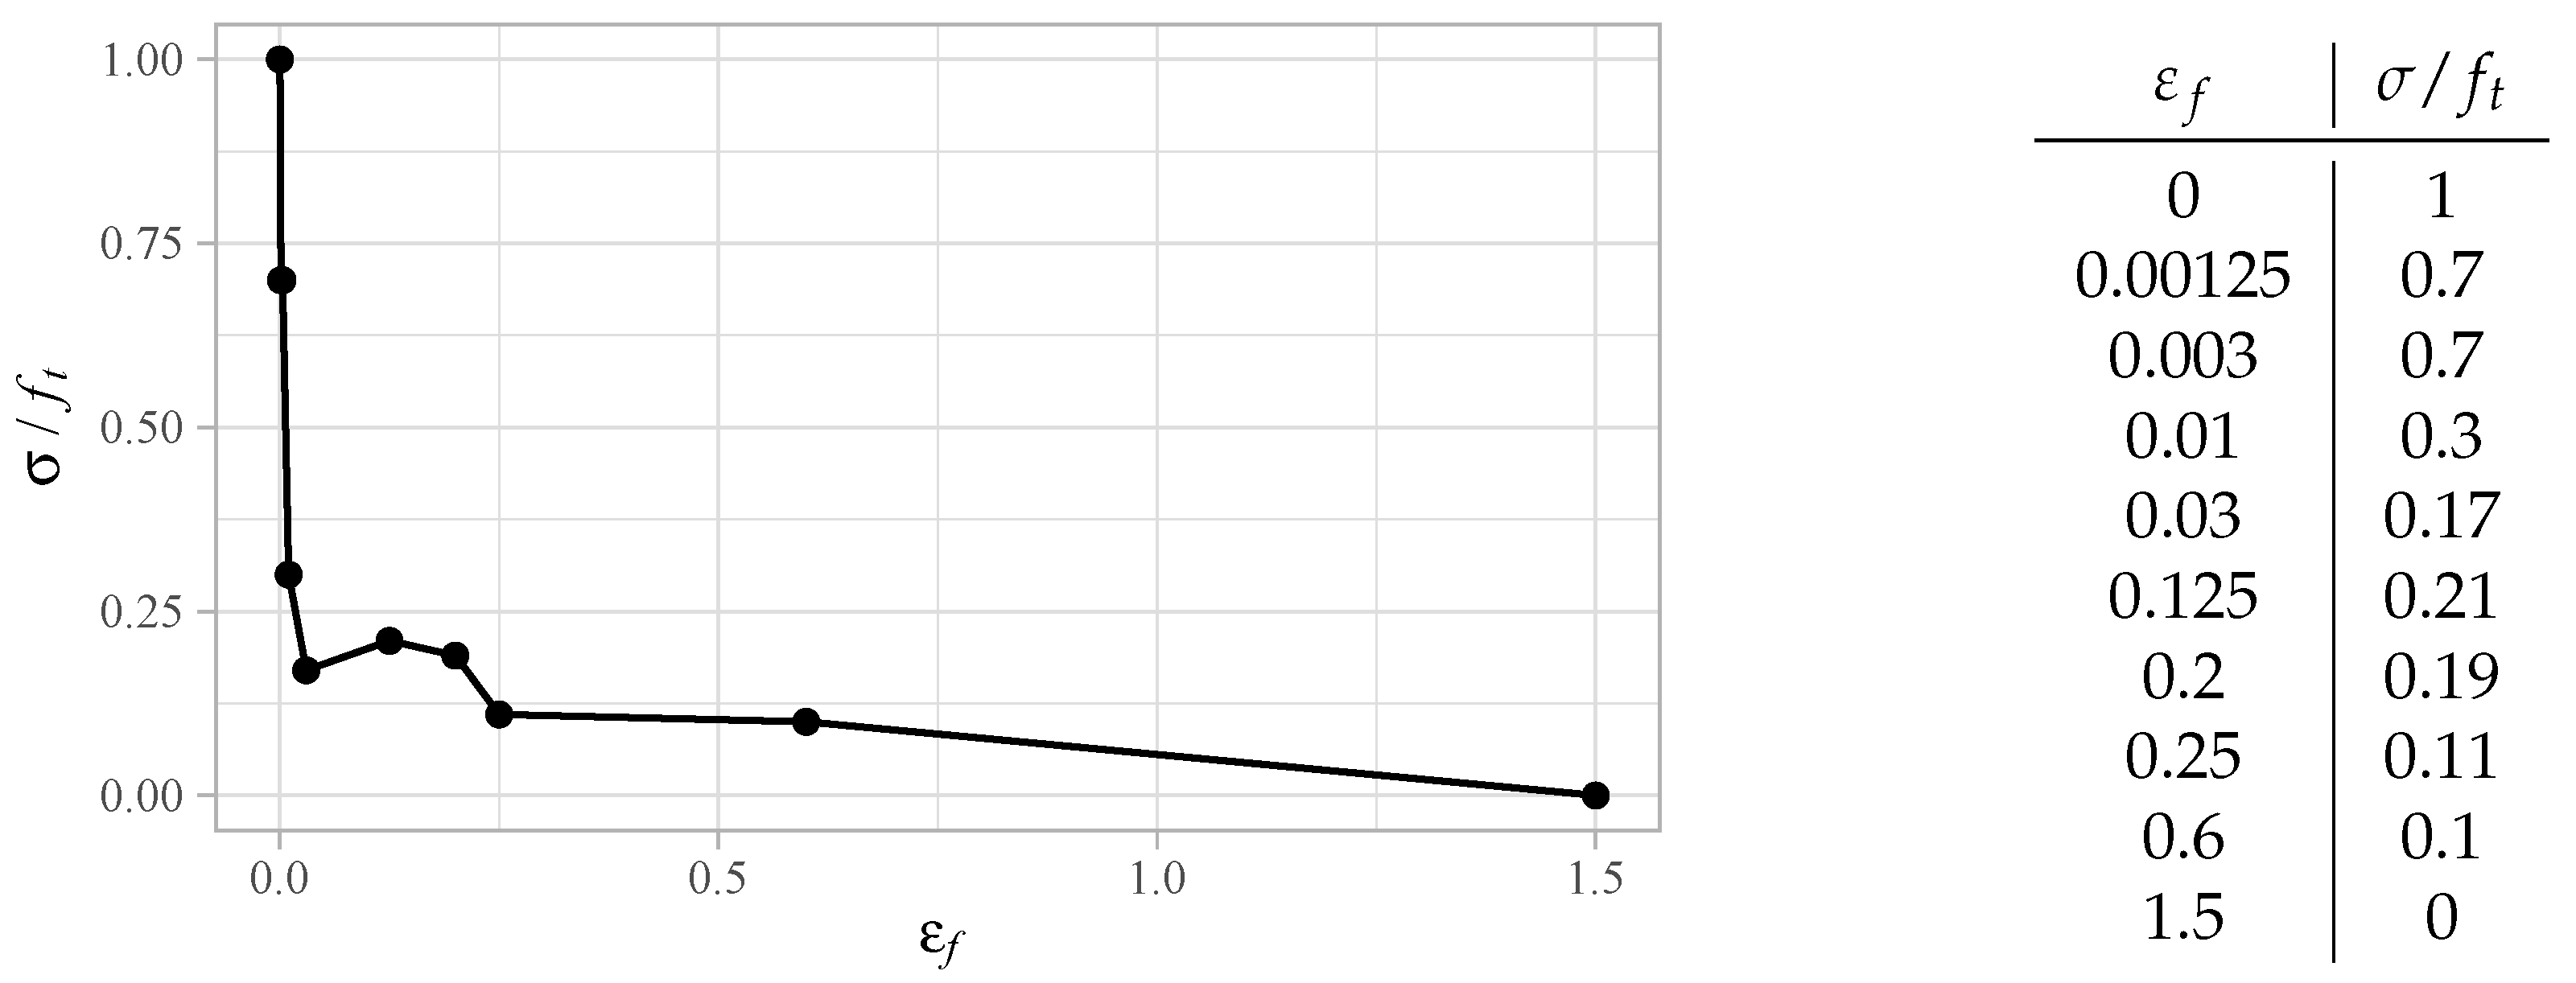
2.4.1. Materials

Nonlinear finite element analysis software, ATENA Science [40], was used. The wall was calculated as a 2D problem with the plane strain approximation. To model SFRC, a material with a user-defined tensile softening law was used (Cementitious2User). Default softening laws for shear stiffness and shear strength were used. Steel reinforcement was defined as a 1D reinforcement. The insulation layer was not included in the model. The tension function and its numerical values are given in Figure 5. The width of the wall was 1.0 m in the the persistent design situation, and the dimensions of the whole panel of 3.5 m × 6.0 m were used in the demoulding calculations.
In the analysis, material properties obtained from a real SFRC were borrowed. The mean compressive strength, f c m , was 67.0 MPa; the modulus of elasticity, E c m , was 30,300 MPa; and mean tensile strength back-calculated from F–CMOD flexure tests, f c t m , was 3.4 MPa, according to the formula given in fib Model Code 2010 [41]. The tension function given in Figure 5 was determined by inverse analysis using ATENA. In the analysis, the standard notched prisms tested according to EN 14651 [42] were modelled as a 2D problem and analysed to obtain theoretical F–CMOD curves. The material model for the residual tensile strength or the tension function was manually modified so that the theoretical results would fit the minimum experimental F–CMOD curve. The characteristic length during the inverse analysis and current analysis was set equal to the finite element size in the inverse analysis, which was 8.0 mm. Geometric non-linearity was used.

2.4.2. Mesh

Quadrilateral element type with sizes 15 mm × 15 mm and 4 integration points was used for the finite element mesh. Other sizes, 60, 30 and 10 mm, were evaluated as well. The 10 and 15 mm elements showed similar results, but calculations with the 15 mm mesh were considerably faster. The wall model with the applied mesh and materials is shown in Figure 6.

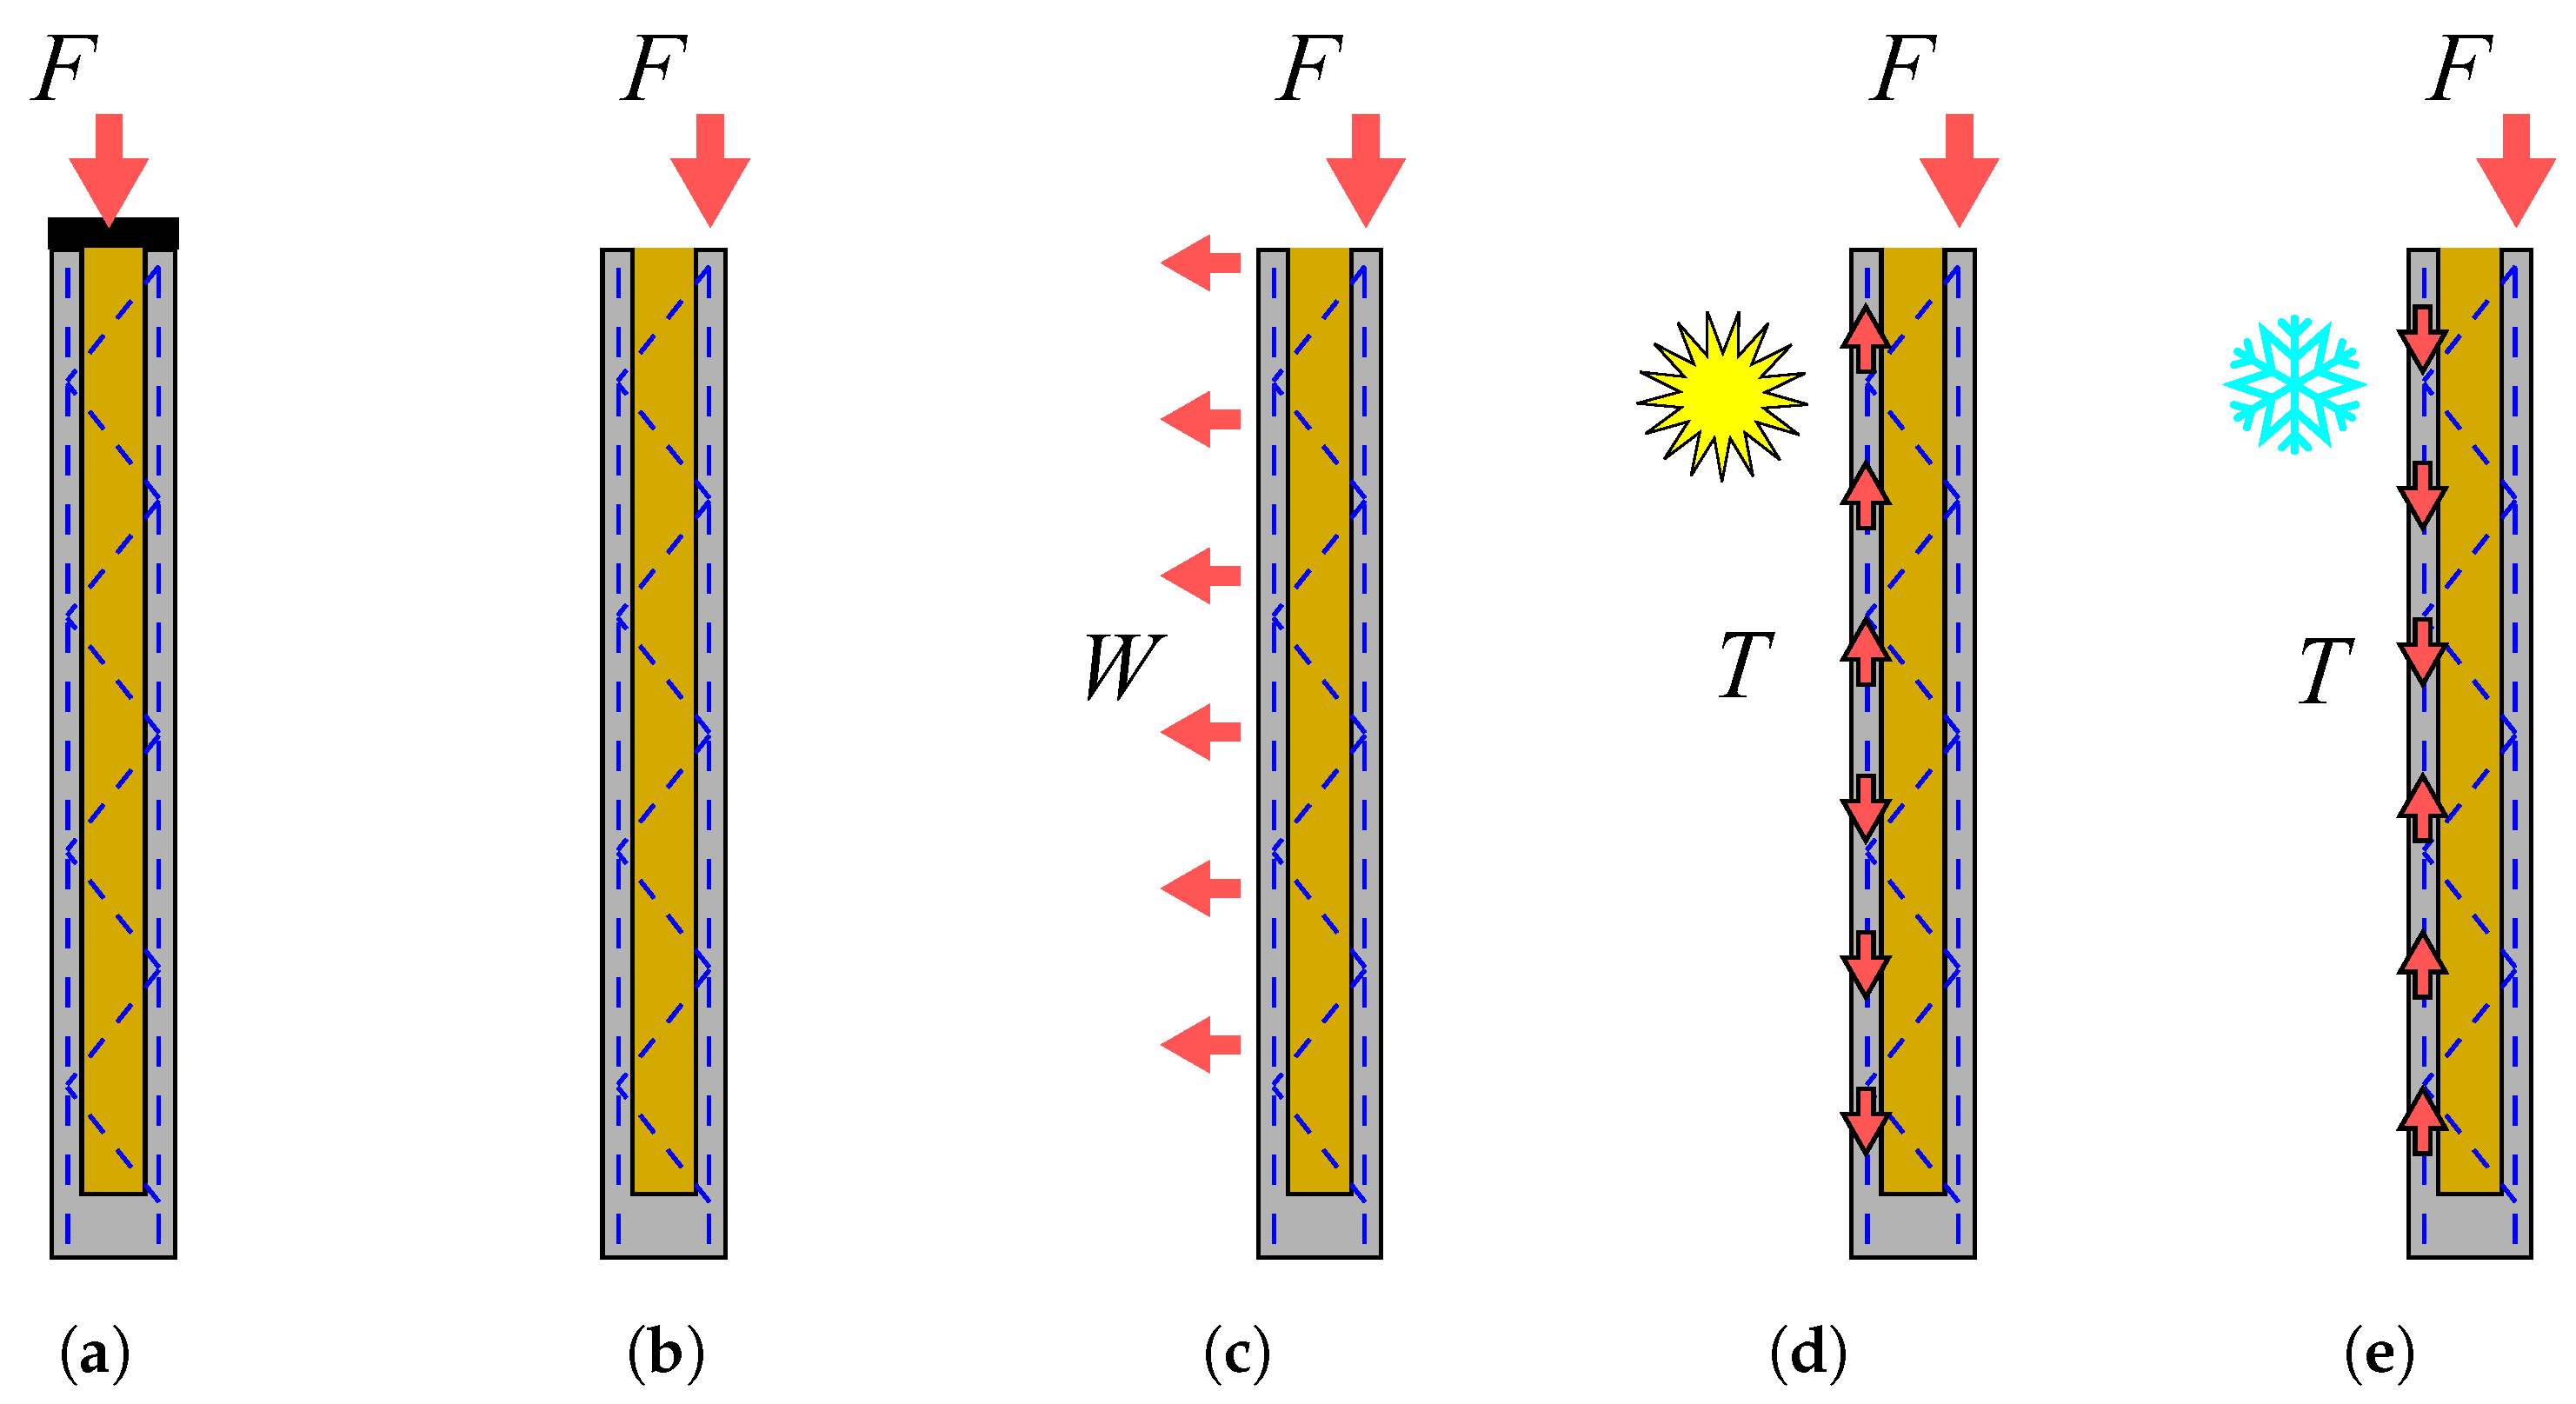
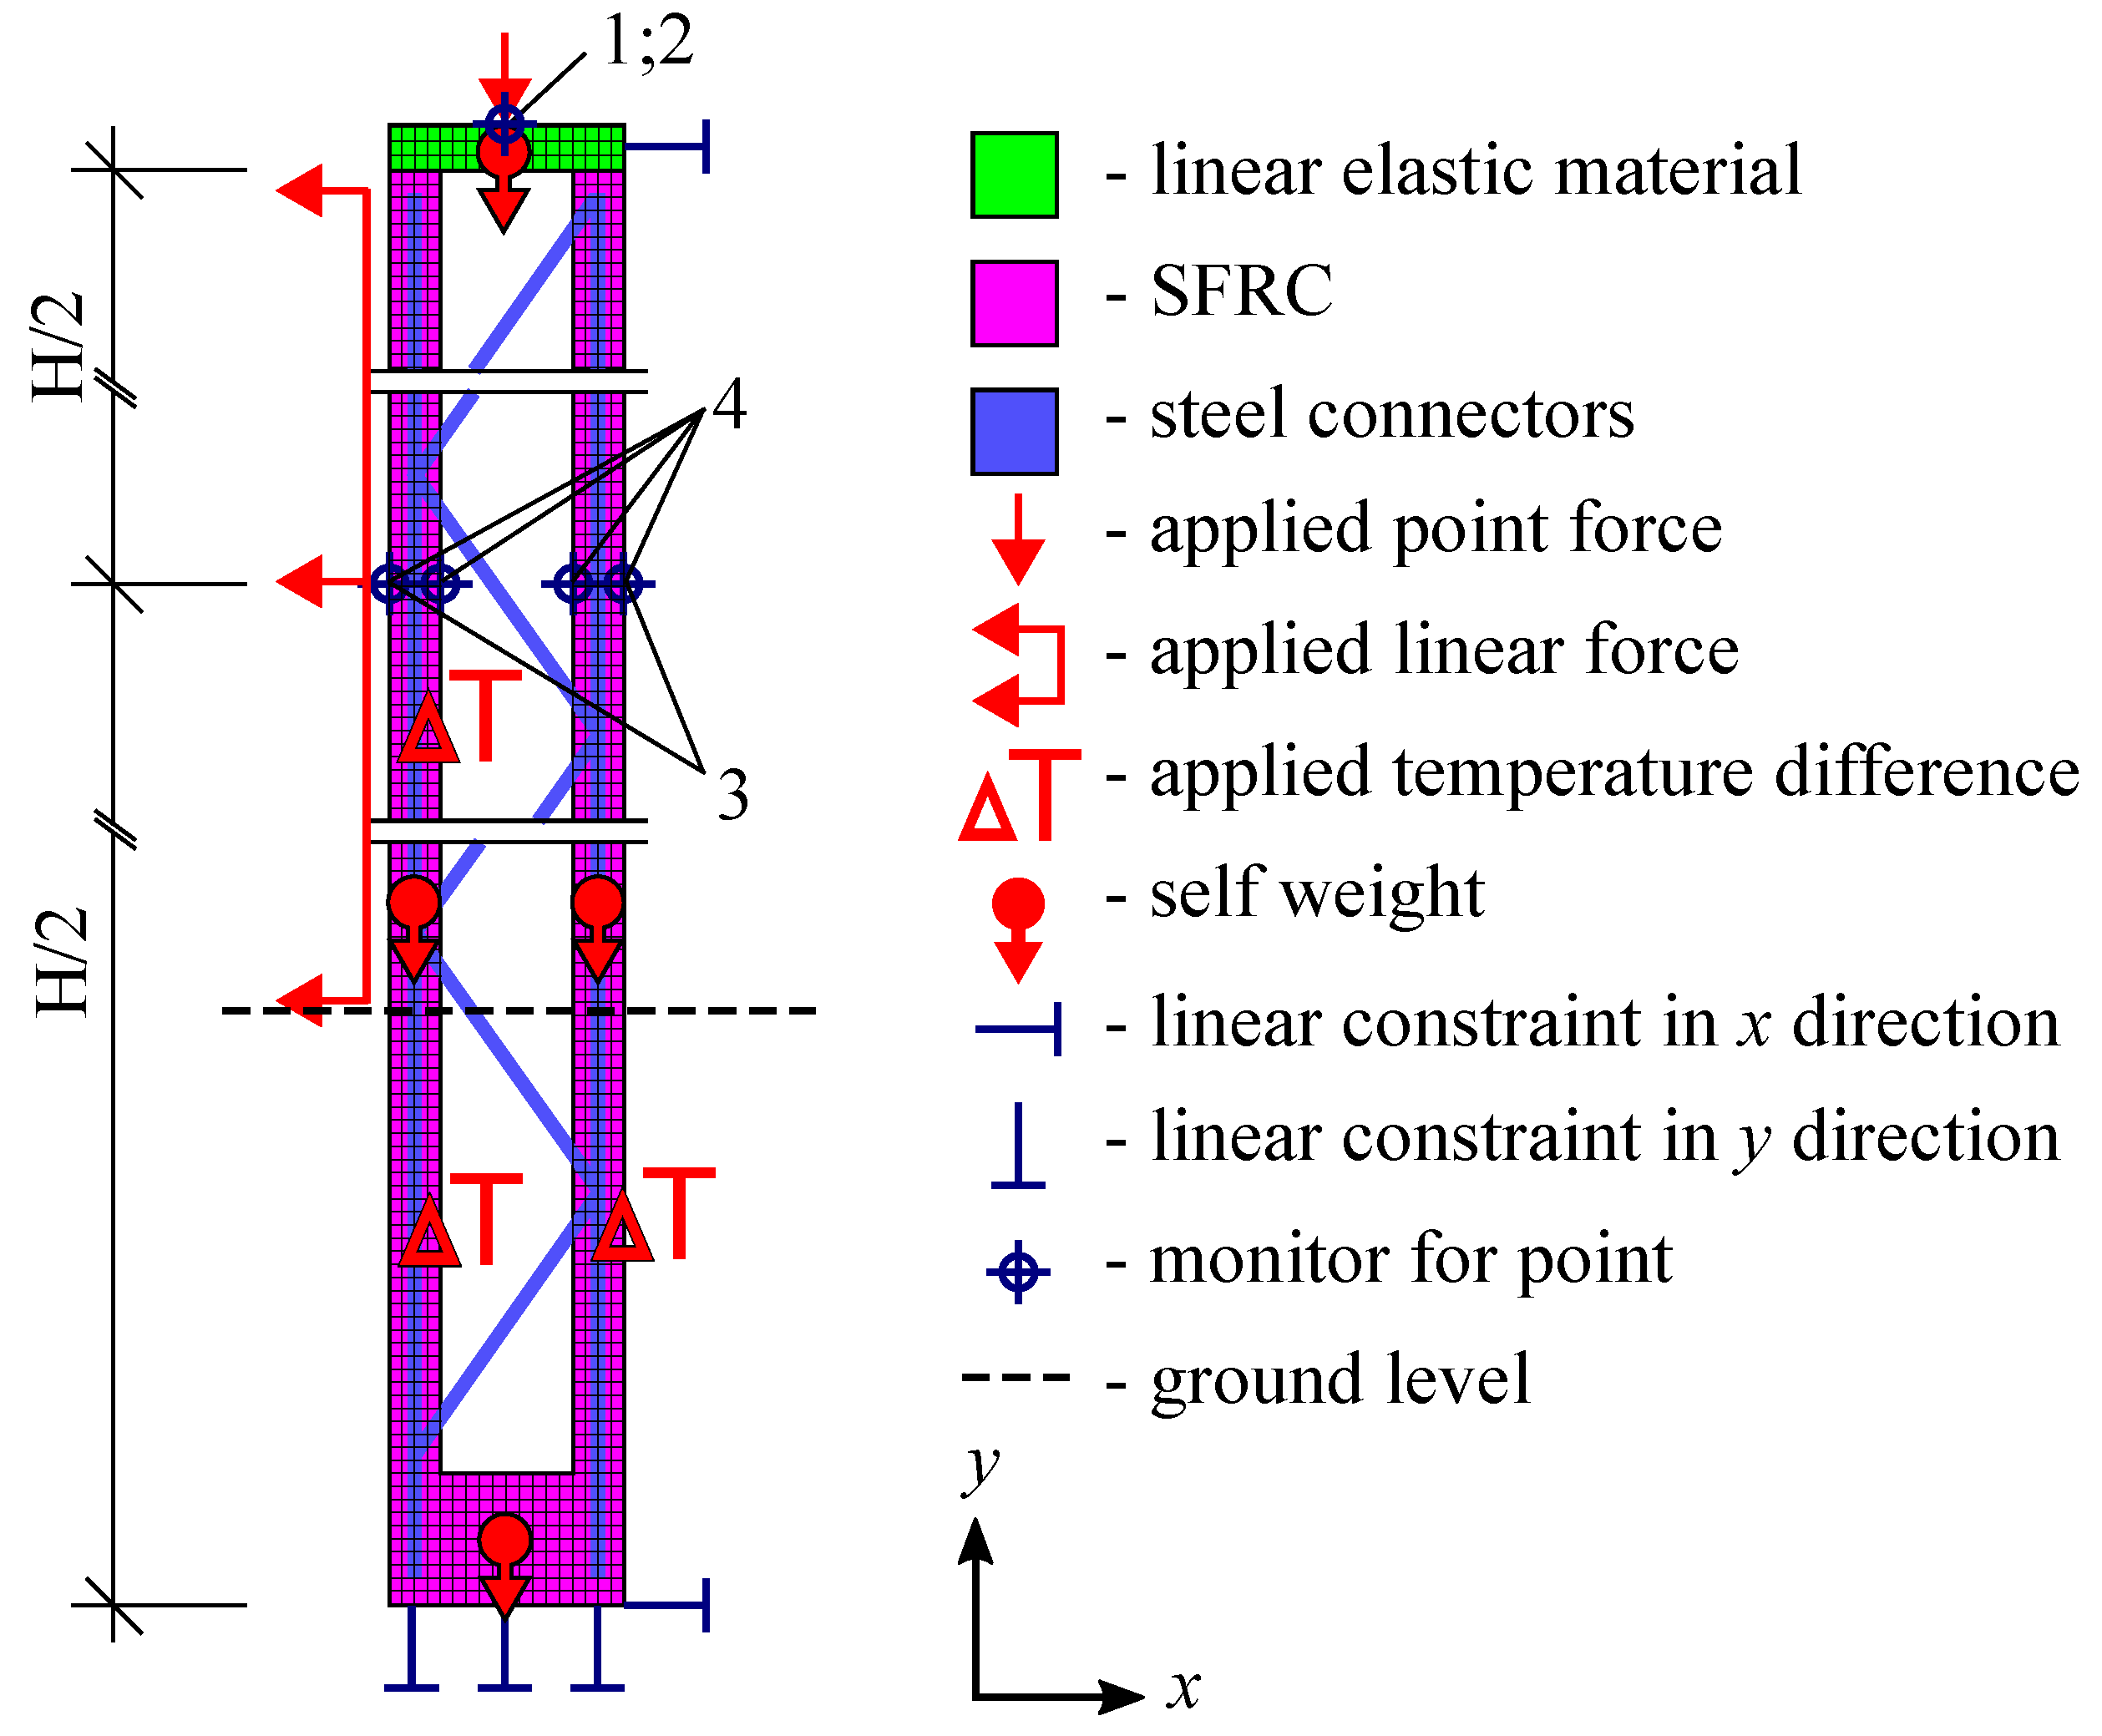
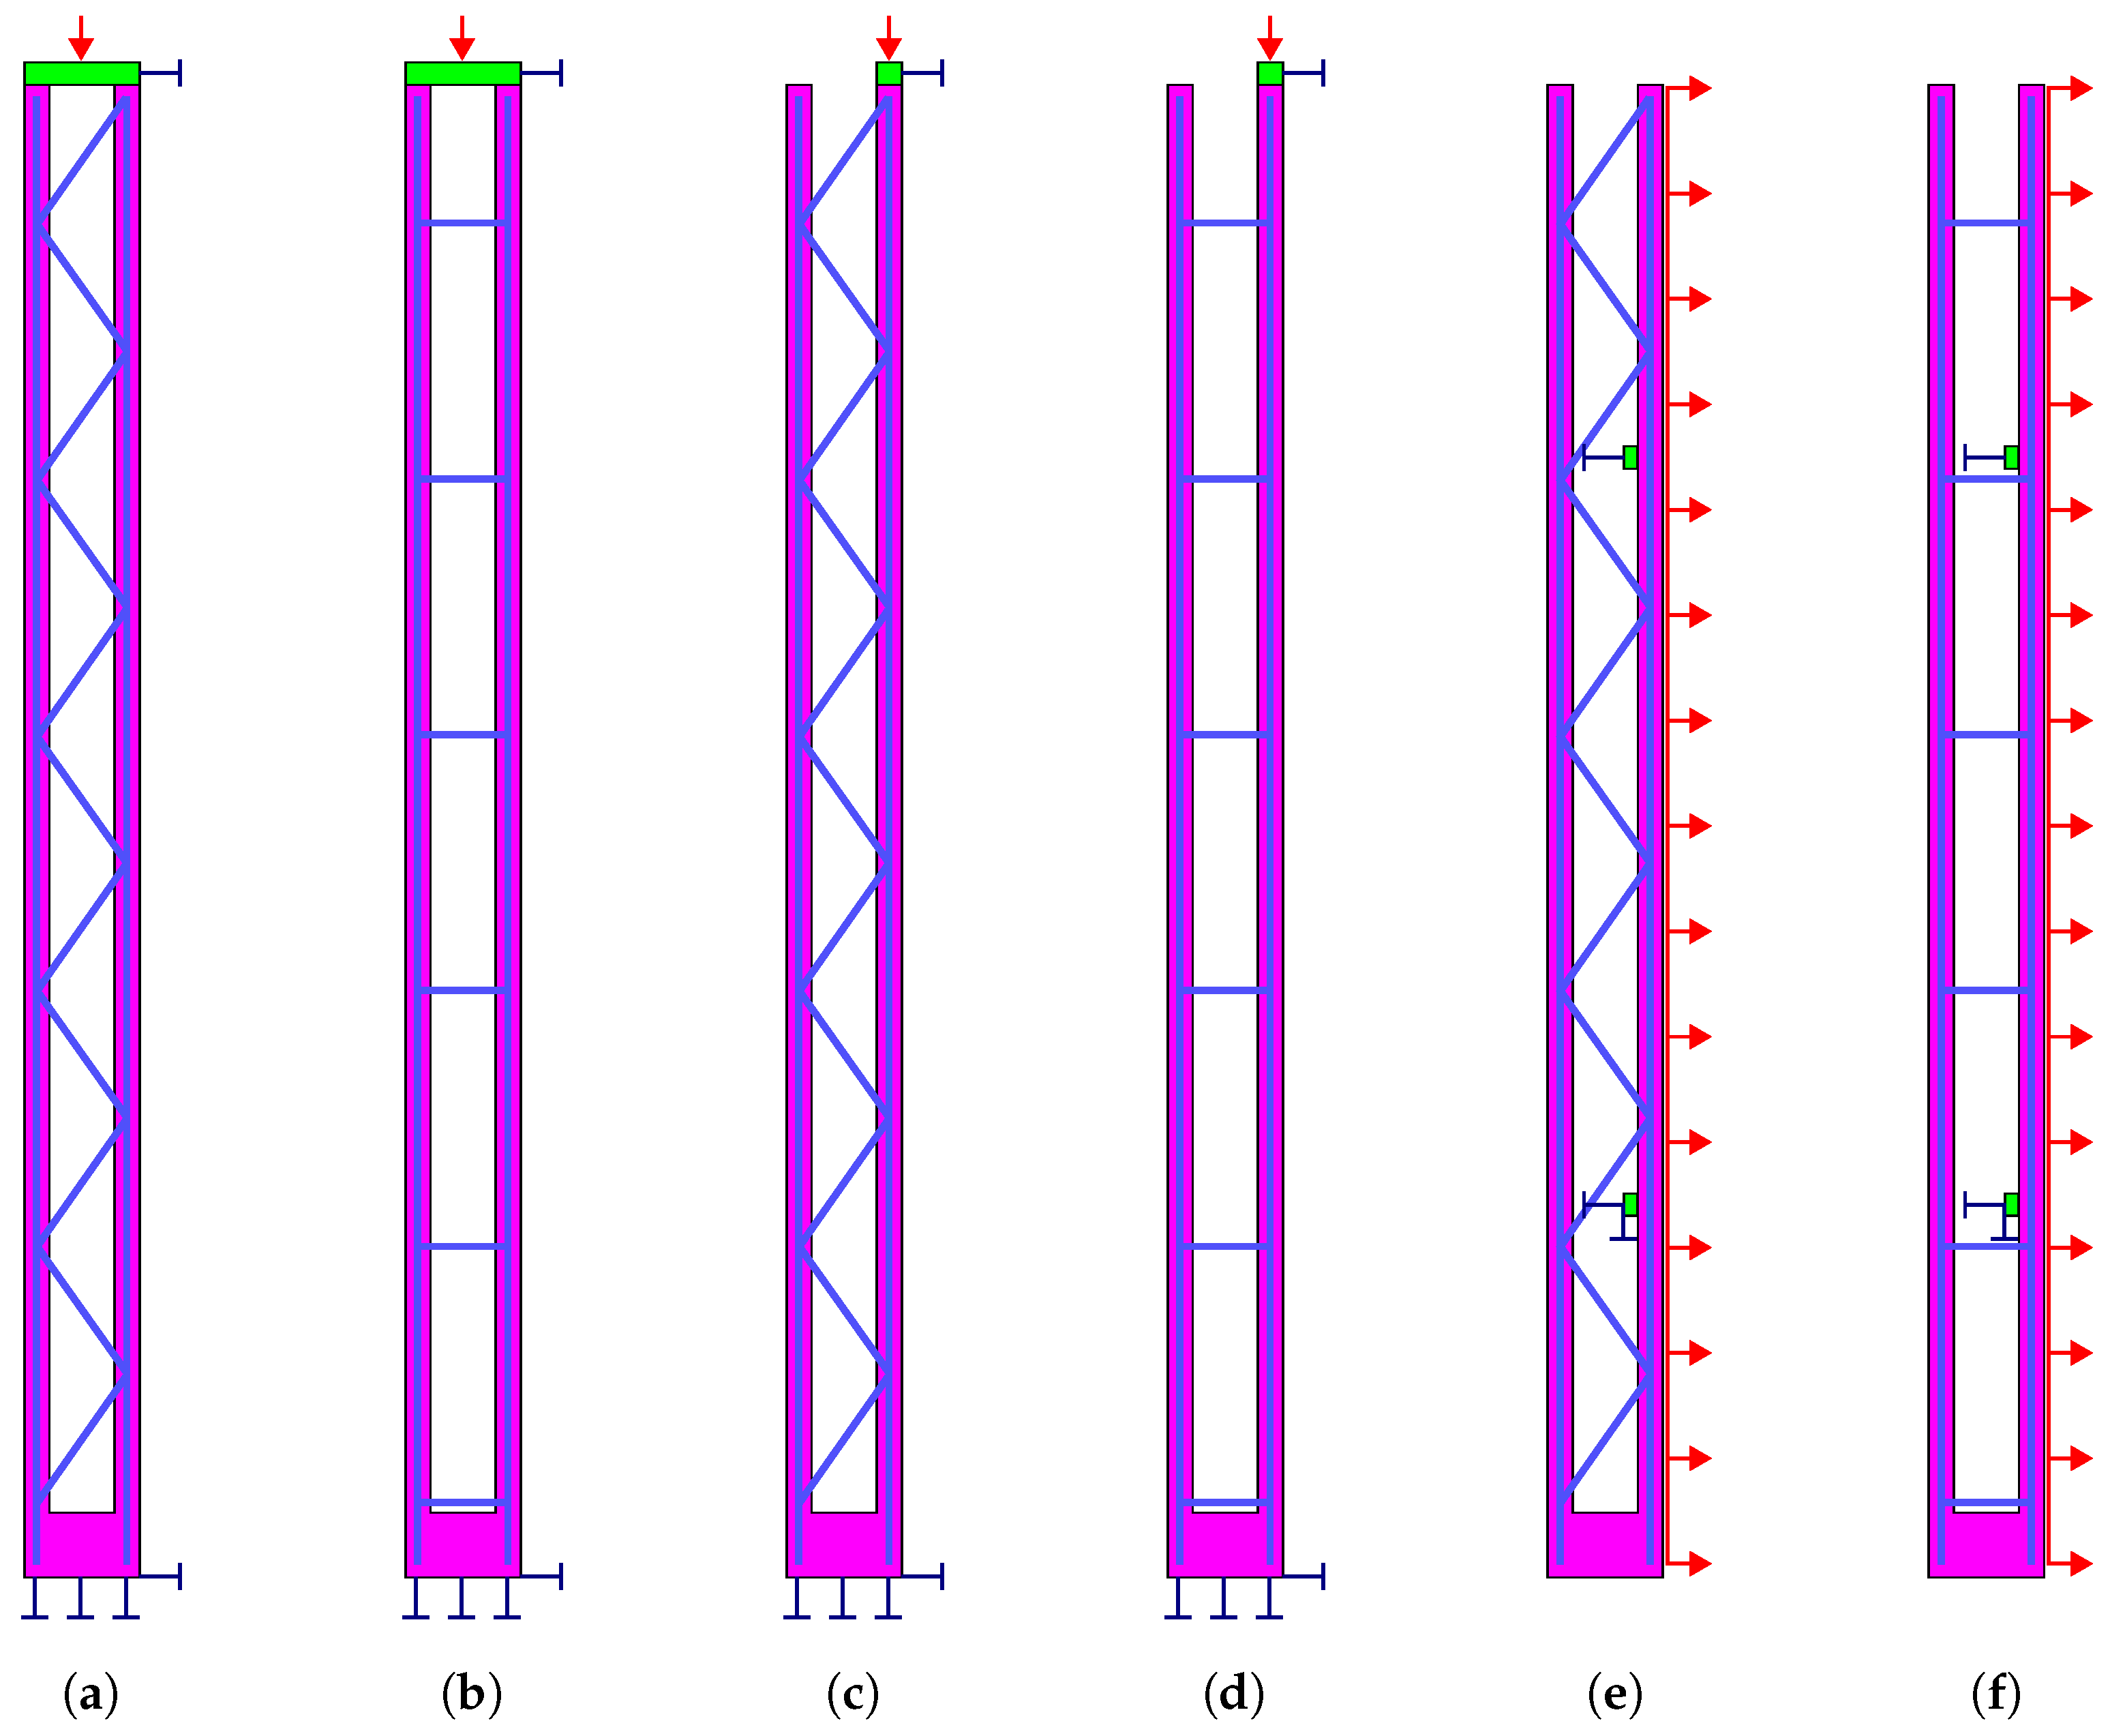
2.4.3. Boundary Conditions and Load Application

In a persistent design situation, the wall is oriented vertically and the motion is restricted by one vertical tie applied to the bottom line and two horizontal ties at both ends of the wall. Load is applied by means of point load or a uniformly distributed line load. The temperature load is applied by defining the temperature difference in the outer wythe of the wall. In the case of concentrated loads, a linear elastic element is introduced to transfer the point load to the wall structure. Fixed contact between the elastic element and the wall is defined. The applied loads, boundary conditions and the numerical models are given in Figure 6 and Figure 7.
The vertical point load was applied centrally with respect to the whole cross-section of the wall for an inner wall. For an exterior wall, two positions of the point load with respect to the inner wythe were analysed: (1) in the centre of the top side of the wythe and (2) one third from the inner side of the wythe. The position of the load represents rectangular and triangular stress distribution (respectively) at the top of the wythe caused by the roof slab.
The demoulding situation was modelled while assuming that lifting direction was along the x axis. Two translation constraints in x directions were introduced at both lifting points, and a constraint in y direction was added to one of the points. The loading was defined as linear line load applied to the outer line of the right wythe (see Figure 6 and Figure 7 for the orientations of the elements) in x direction. Both the constraints and the line load were applied to the same wythe because the lifting inserts should be anchored in the bottom layer, which was also subjected to the loading during the demoulding process.
In all the situations, the loading was applied sequentially by using separate loading intervals and gradually by setting the number of load steps. The defined intervals and steps for each design situation and load combination are given in Table 5. The first interval was used for boundary conditions (BC) and definition of monitoring points. Self-weight (SW) of the wall was applied in the second interval. Design load was applied in interval F following the self-weight. An additional interval was applied in which the design load was increased three times (3F). In the last interval (failure), load was increased until failure of the structure occurred. For wind and temperature loads, an additional interval (W or T, respectively) was included after the design load was applied in interval F and before the interval 3F.

3. Results

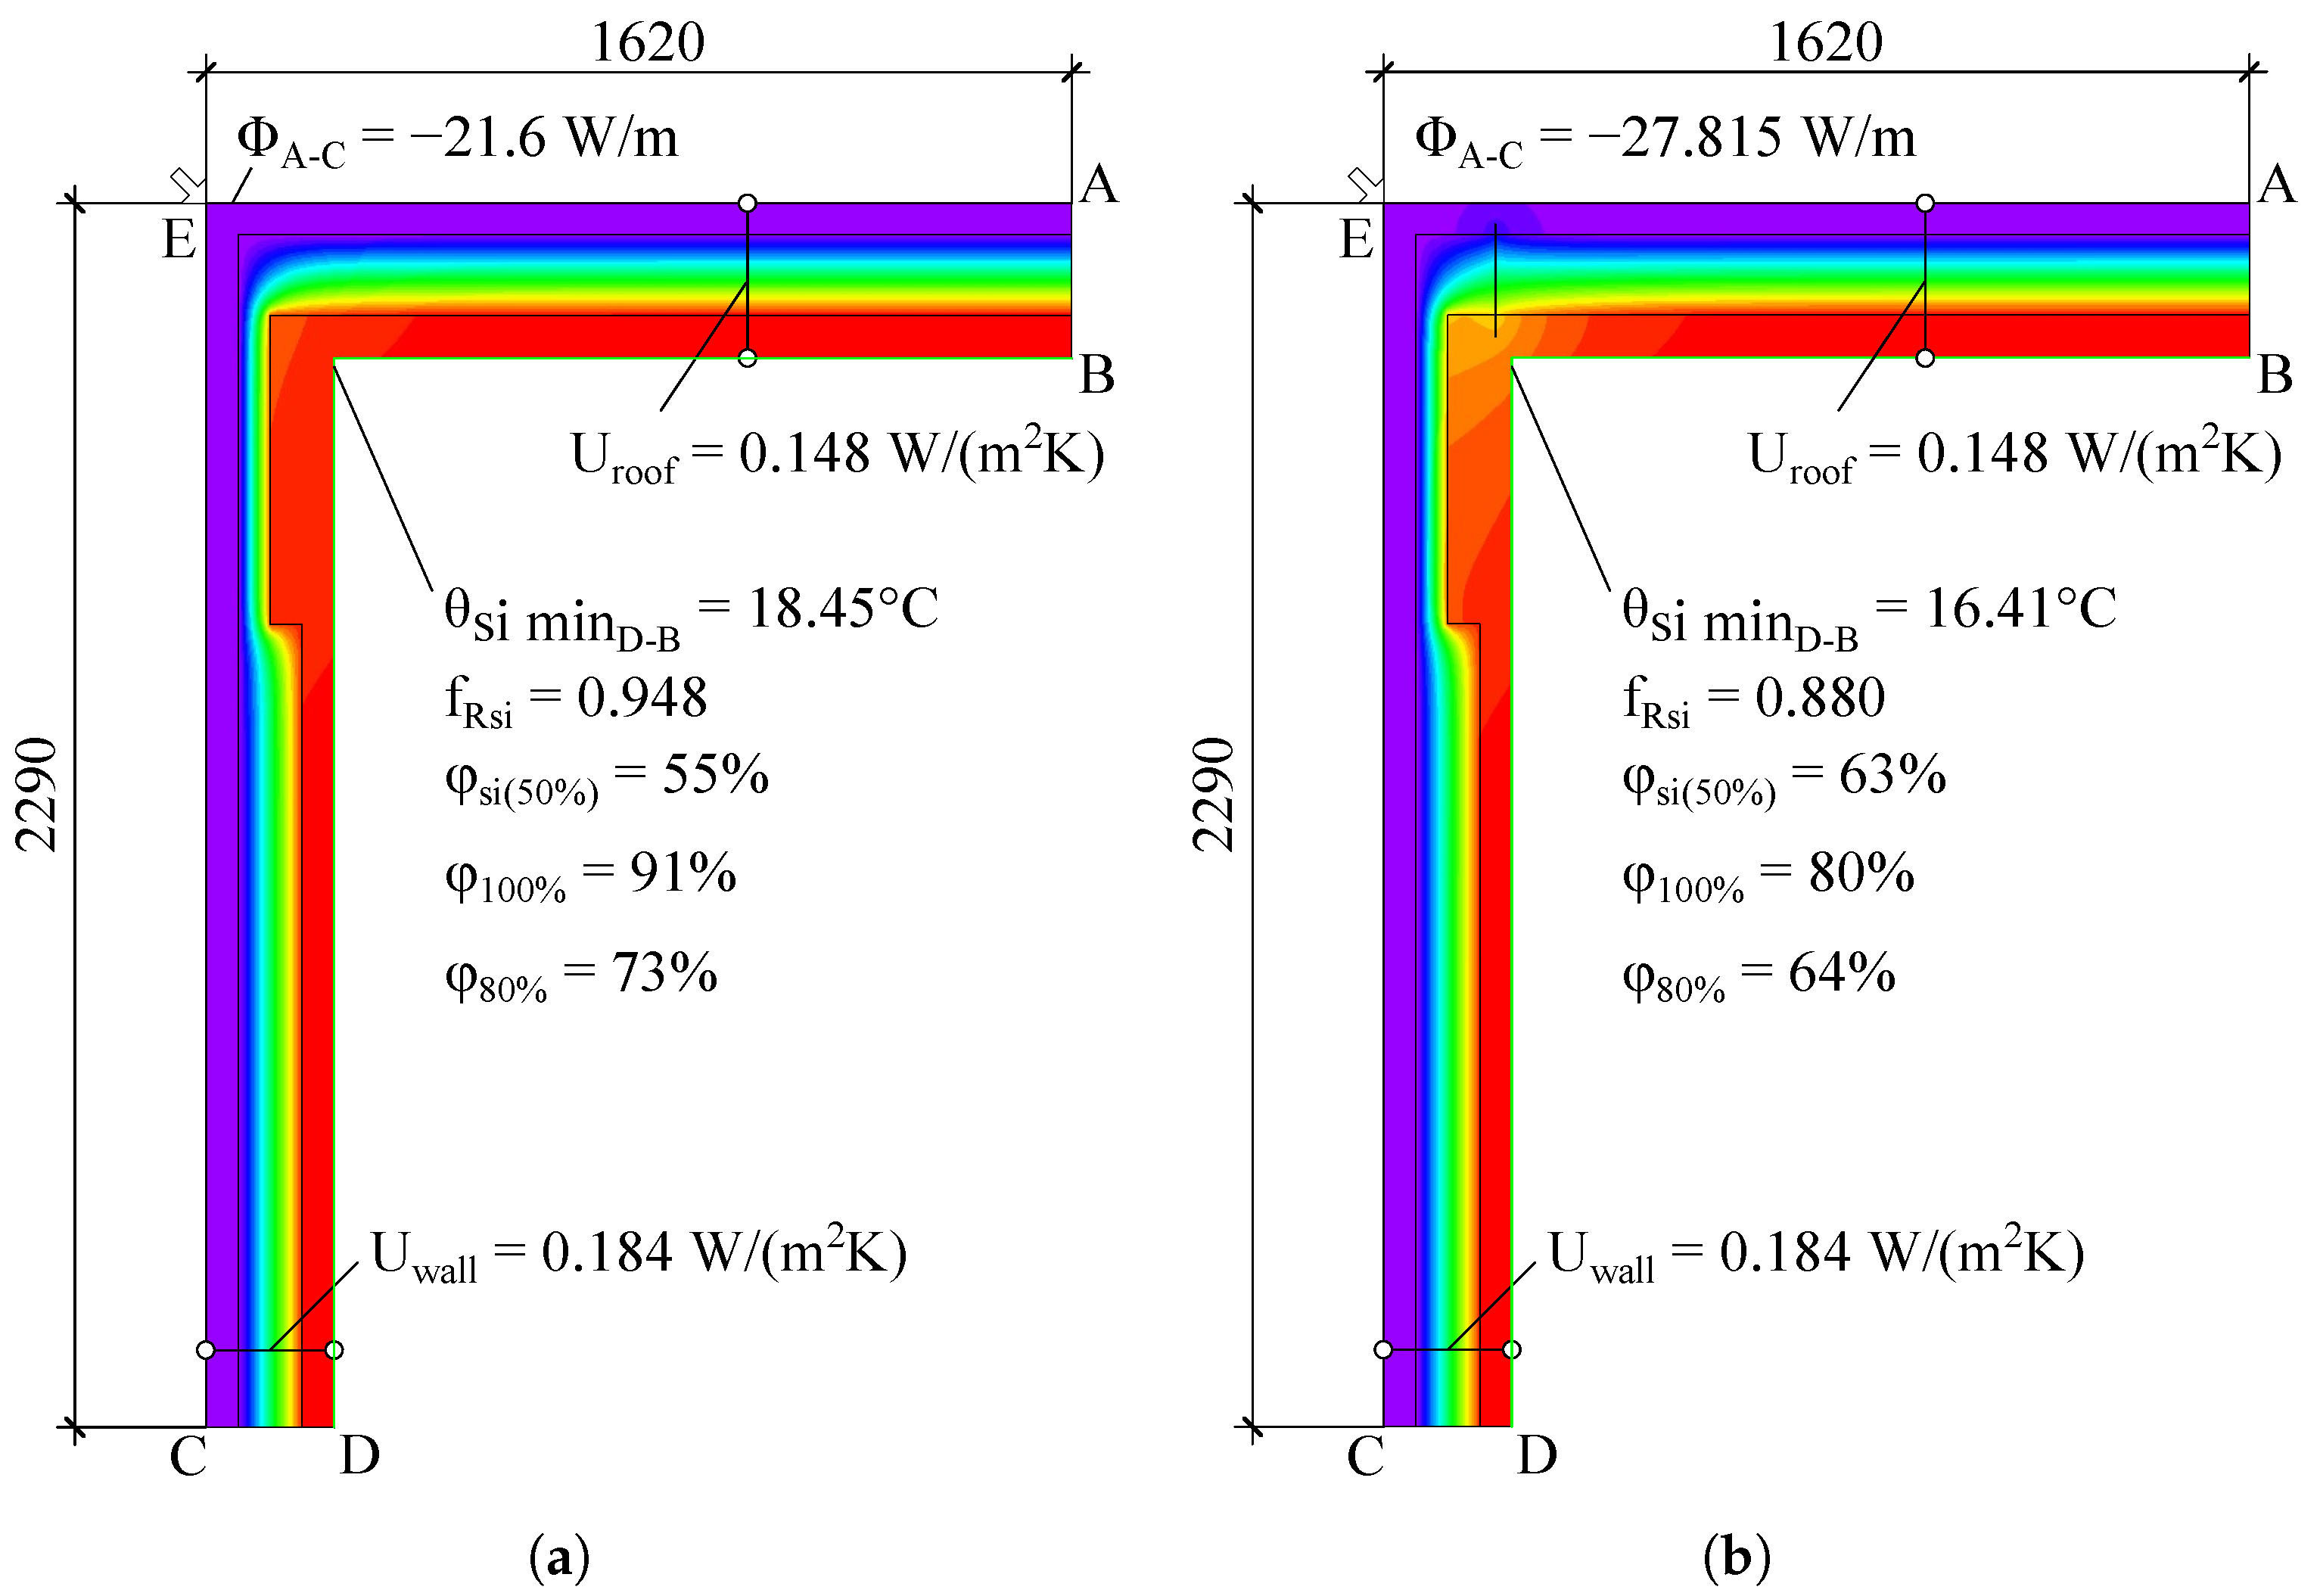
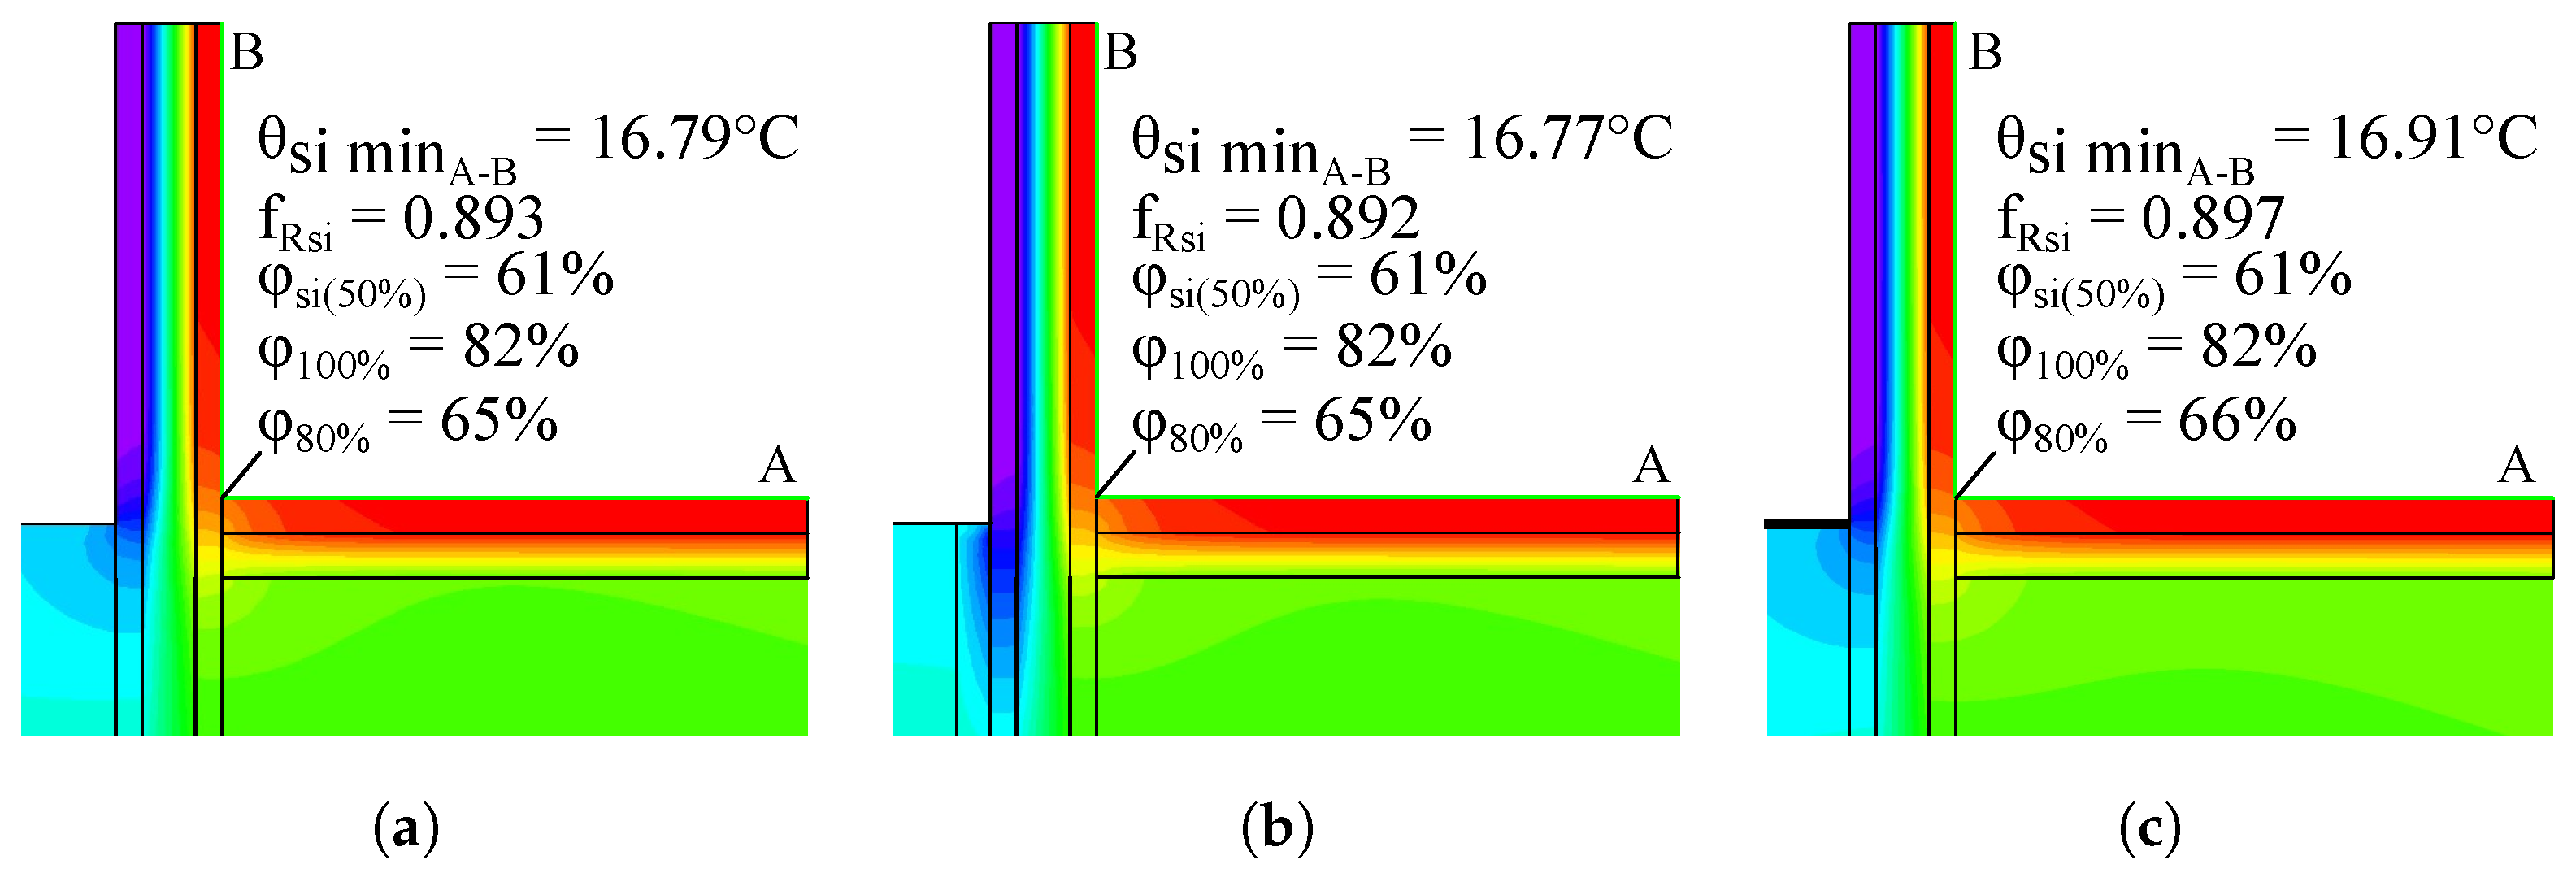
3.1. Thermal Performance

Thermal performance of the walls was evaluated by the temperature and heat flow at the upper and lower corners. In addition, the influence of steel connectors was considered. The top corner was modelled with reduced thickness of vertical insulation due to the increased width of the inner concrete wythe. Temperature distribution in the cross-section of the top corner with and without steel connector is shown in Figure 8. The surface temperature in the corner was 18.45 C if no metal insert was present. After adding a steel bar representing an anchorage reinforcement, the surface temperature dropped to 16.41 C. The correction value Ψ was calculated according to Equation (1):
Ψ = 21.6 30.0 0.148 · 1.62 0.184 · 2.29 = 0.059 W / ( mK ) ,
where Φ = 21.6 (W/m), U r o o f = 0.148 (W/(m 2 K)) and U w a l l = 0.184 (W/(m 2 K)). The lengths of the roof and wall considered in the analysis were 1.62 and 2.29 m, respectively. The value is satisfactory because it is lower than the assumed limit 0.1.
However, if steel connectors were used in the corner, the heat flow Φ was 27.815 (W/m), leading to the correction value of 0.266 (W/(mK)). This value is much higher than the liberal limit value of 0.2 defined by the Latvian Construction Standard [32]. It must be noted that this was a 2D analysis and the steel bar was acting like steel sheet with the same width (depth) as the wall itself. Although the actual influence of the steel bar could be smaller, it shows the possible risk of using steel connectors. For a more accurate evaluation, the wall should be modelled in 3D software.
As indicated in Figure 9, the calculated surface temperature at the bottom corner was almost the same in all the arrangements of the external insulation. It ranged from 16.77 to 16.91 C, which means that the temperature difference between the surface and the air in the room was 3.09–3.23 degrees. This is lower than the limiting 4 degrees, and thus, satisfactory. The results also reveal that there is no need for additional external insulation if the top of the foundation strip is as deep as 0.8 m from the ground surface.

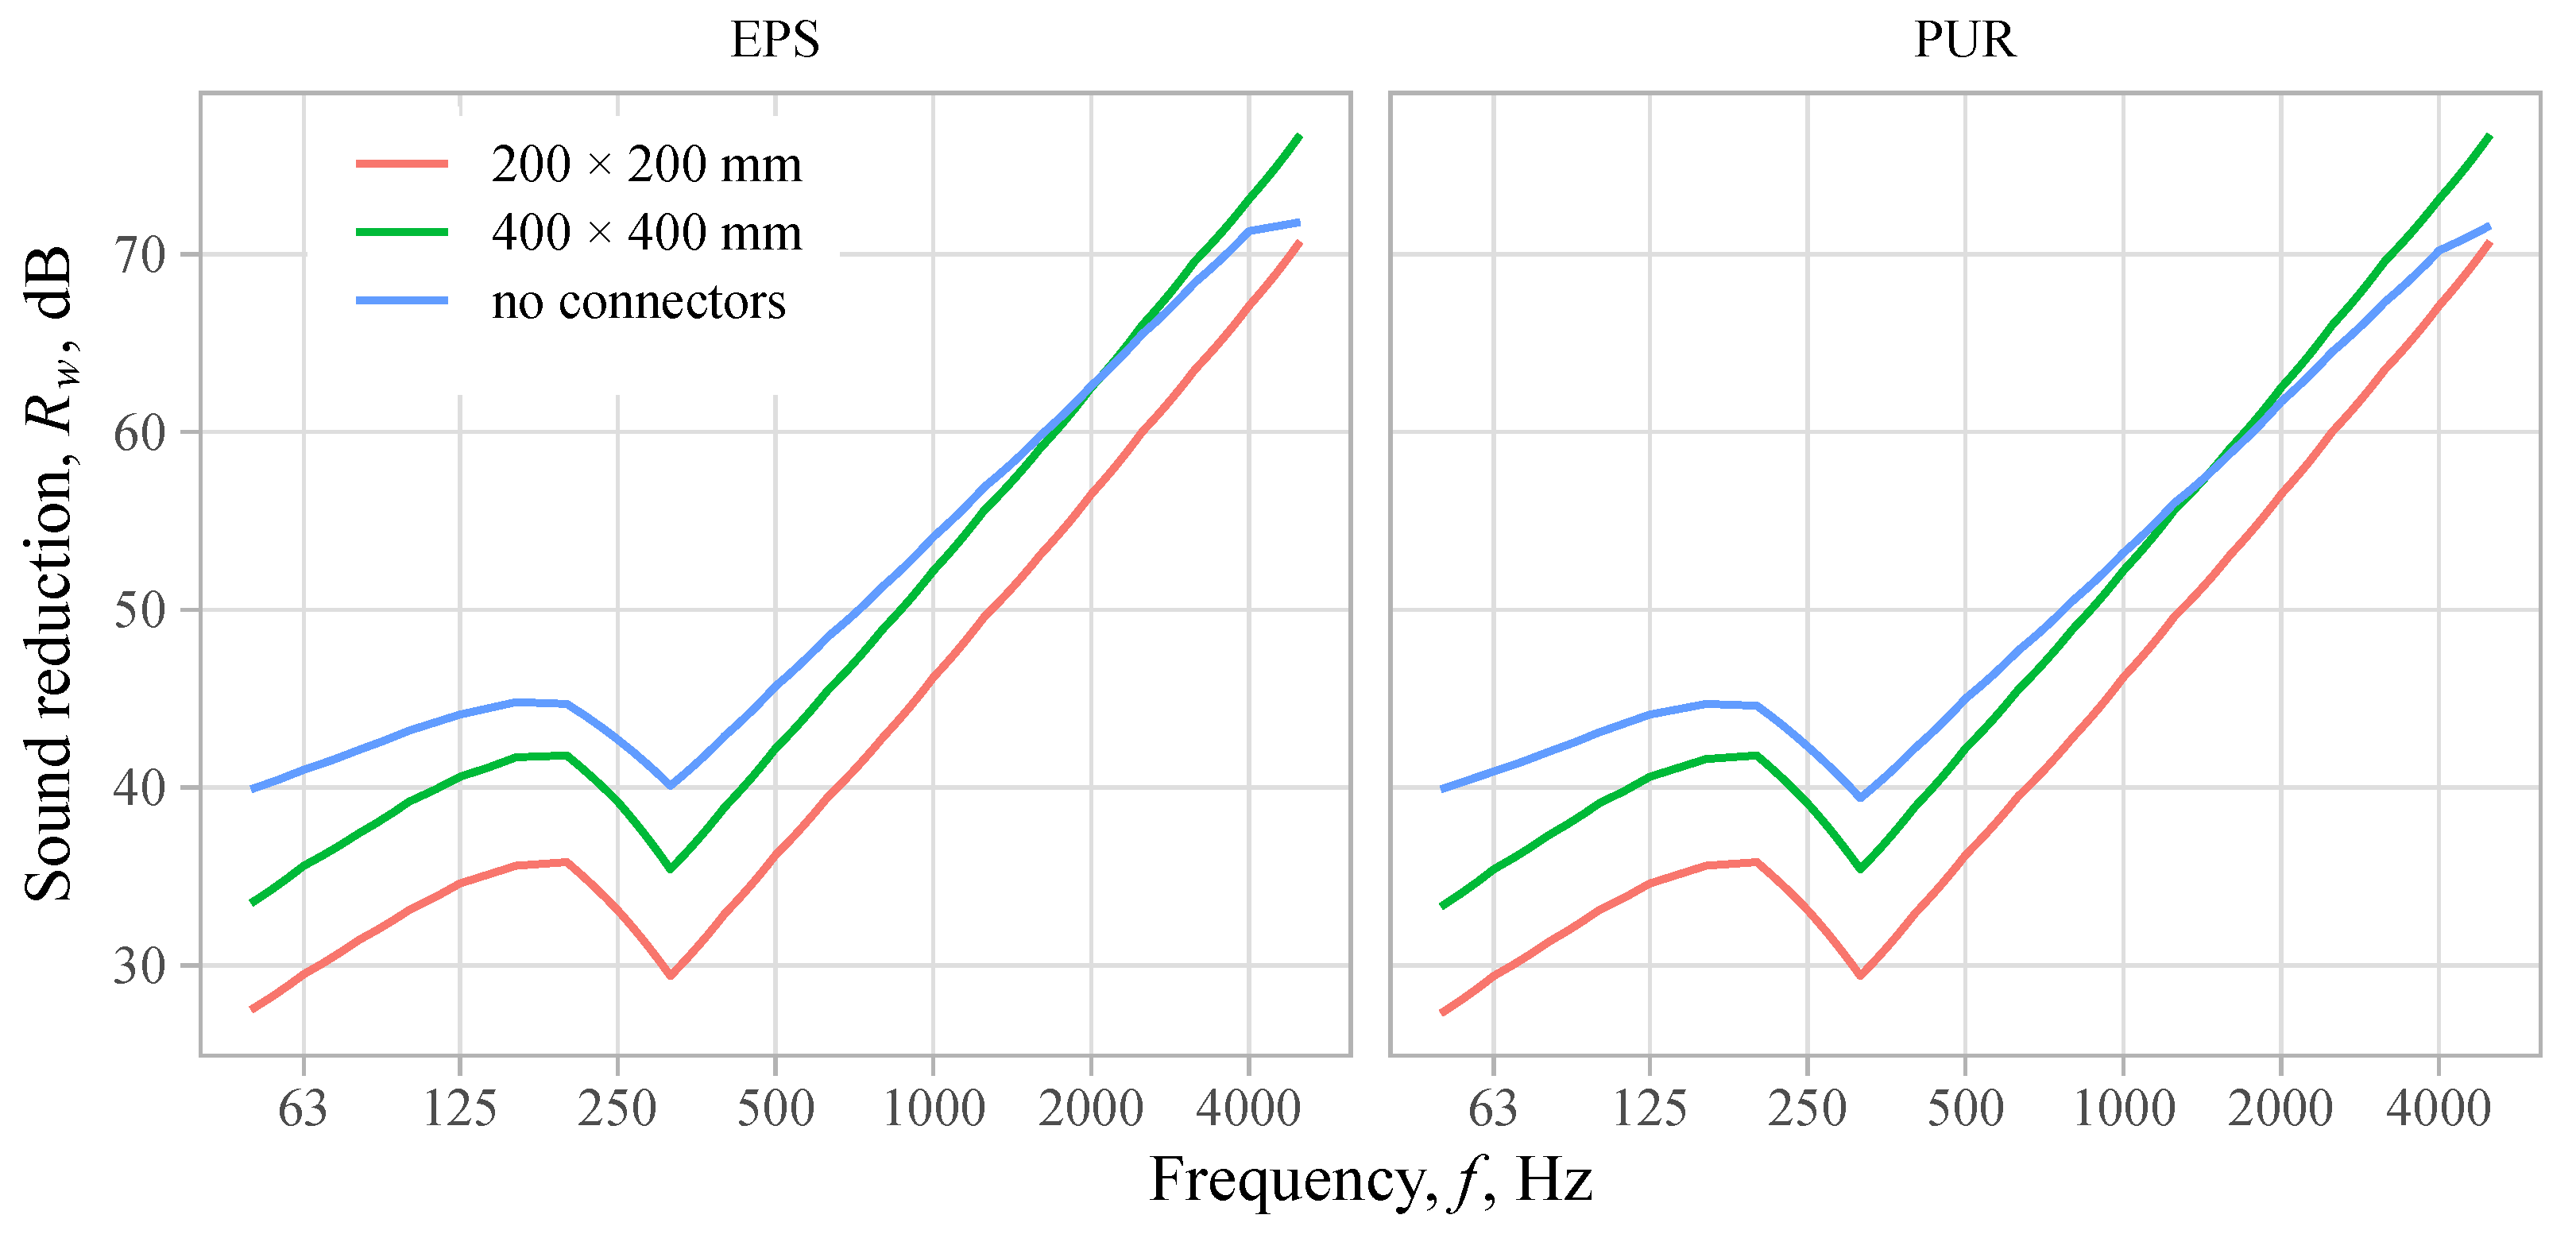
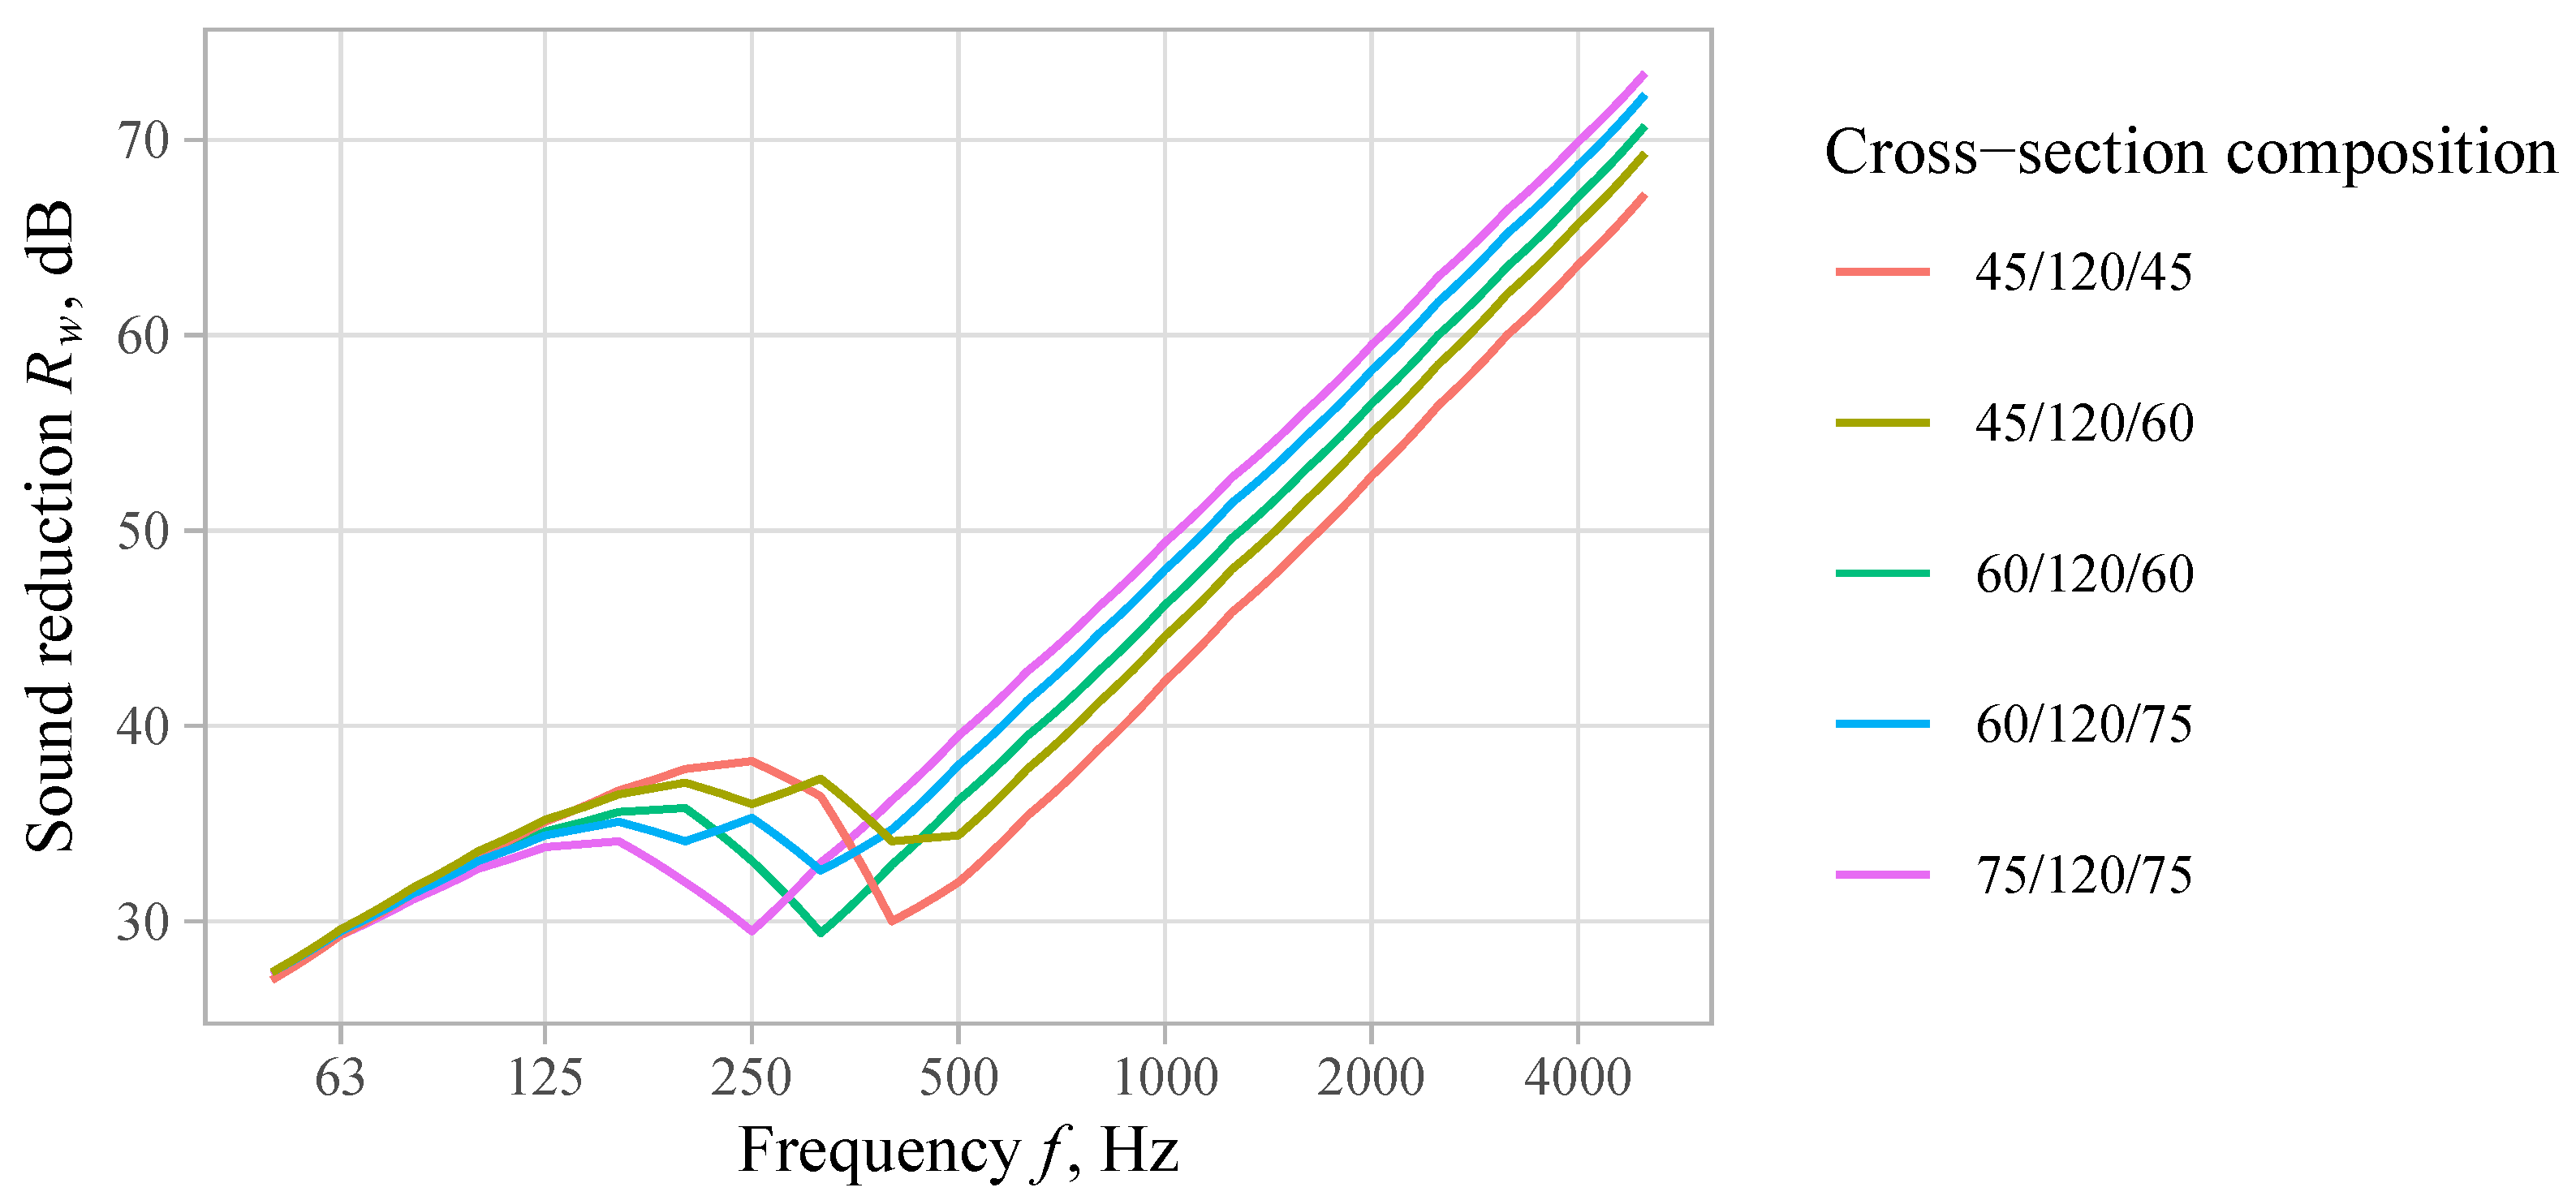
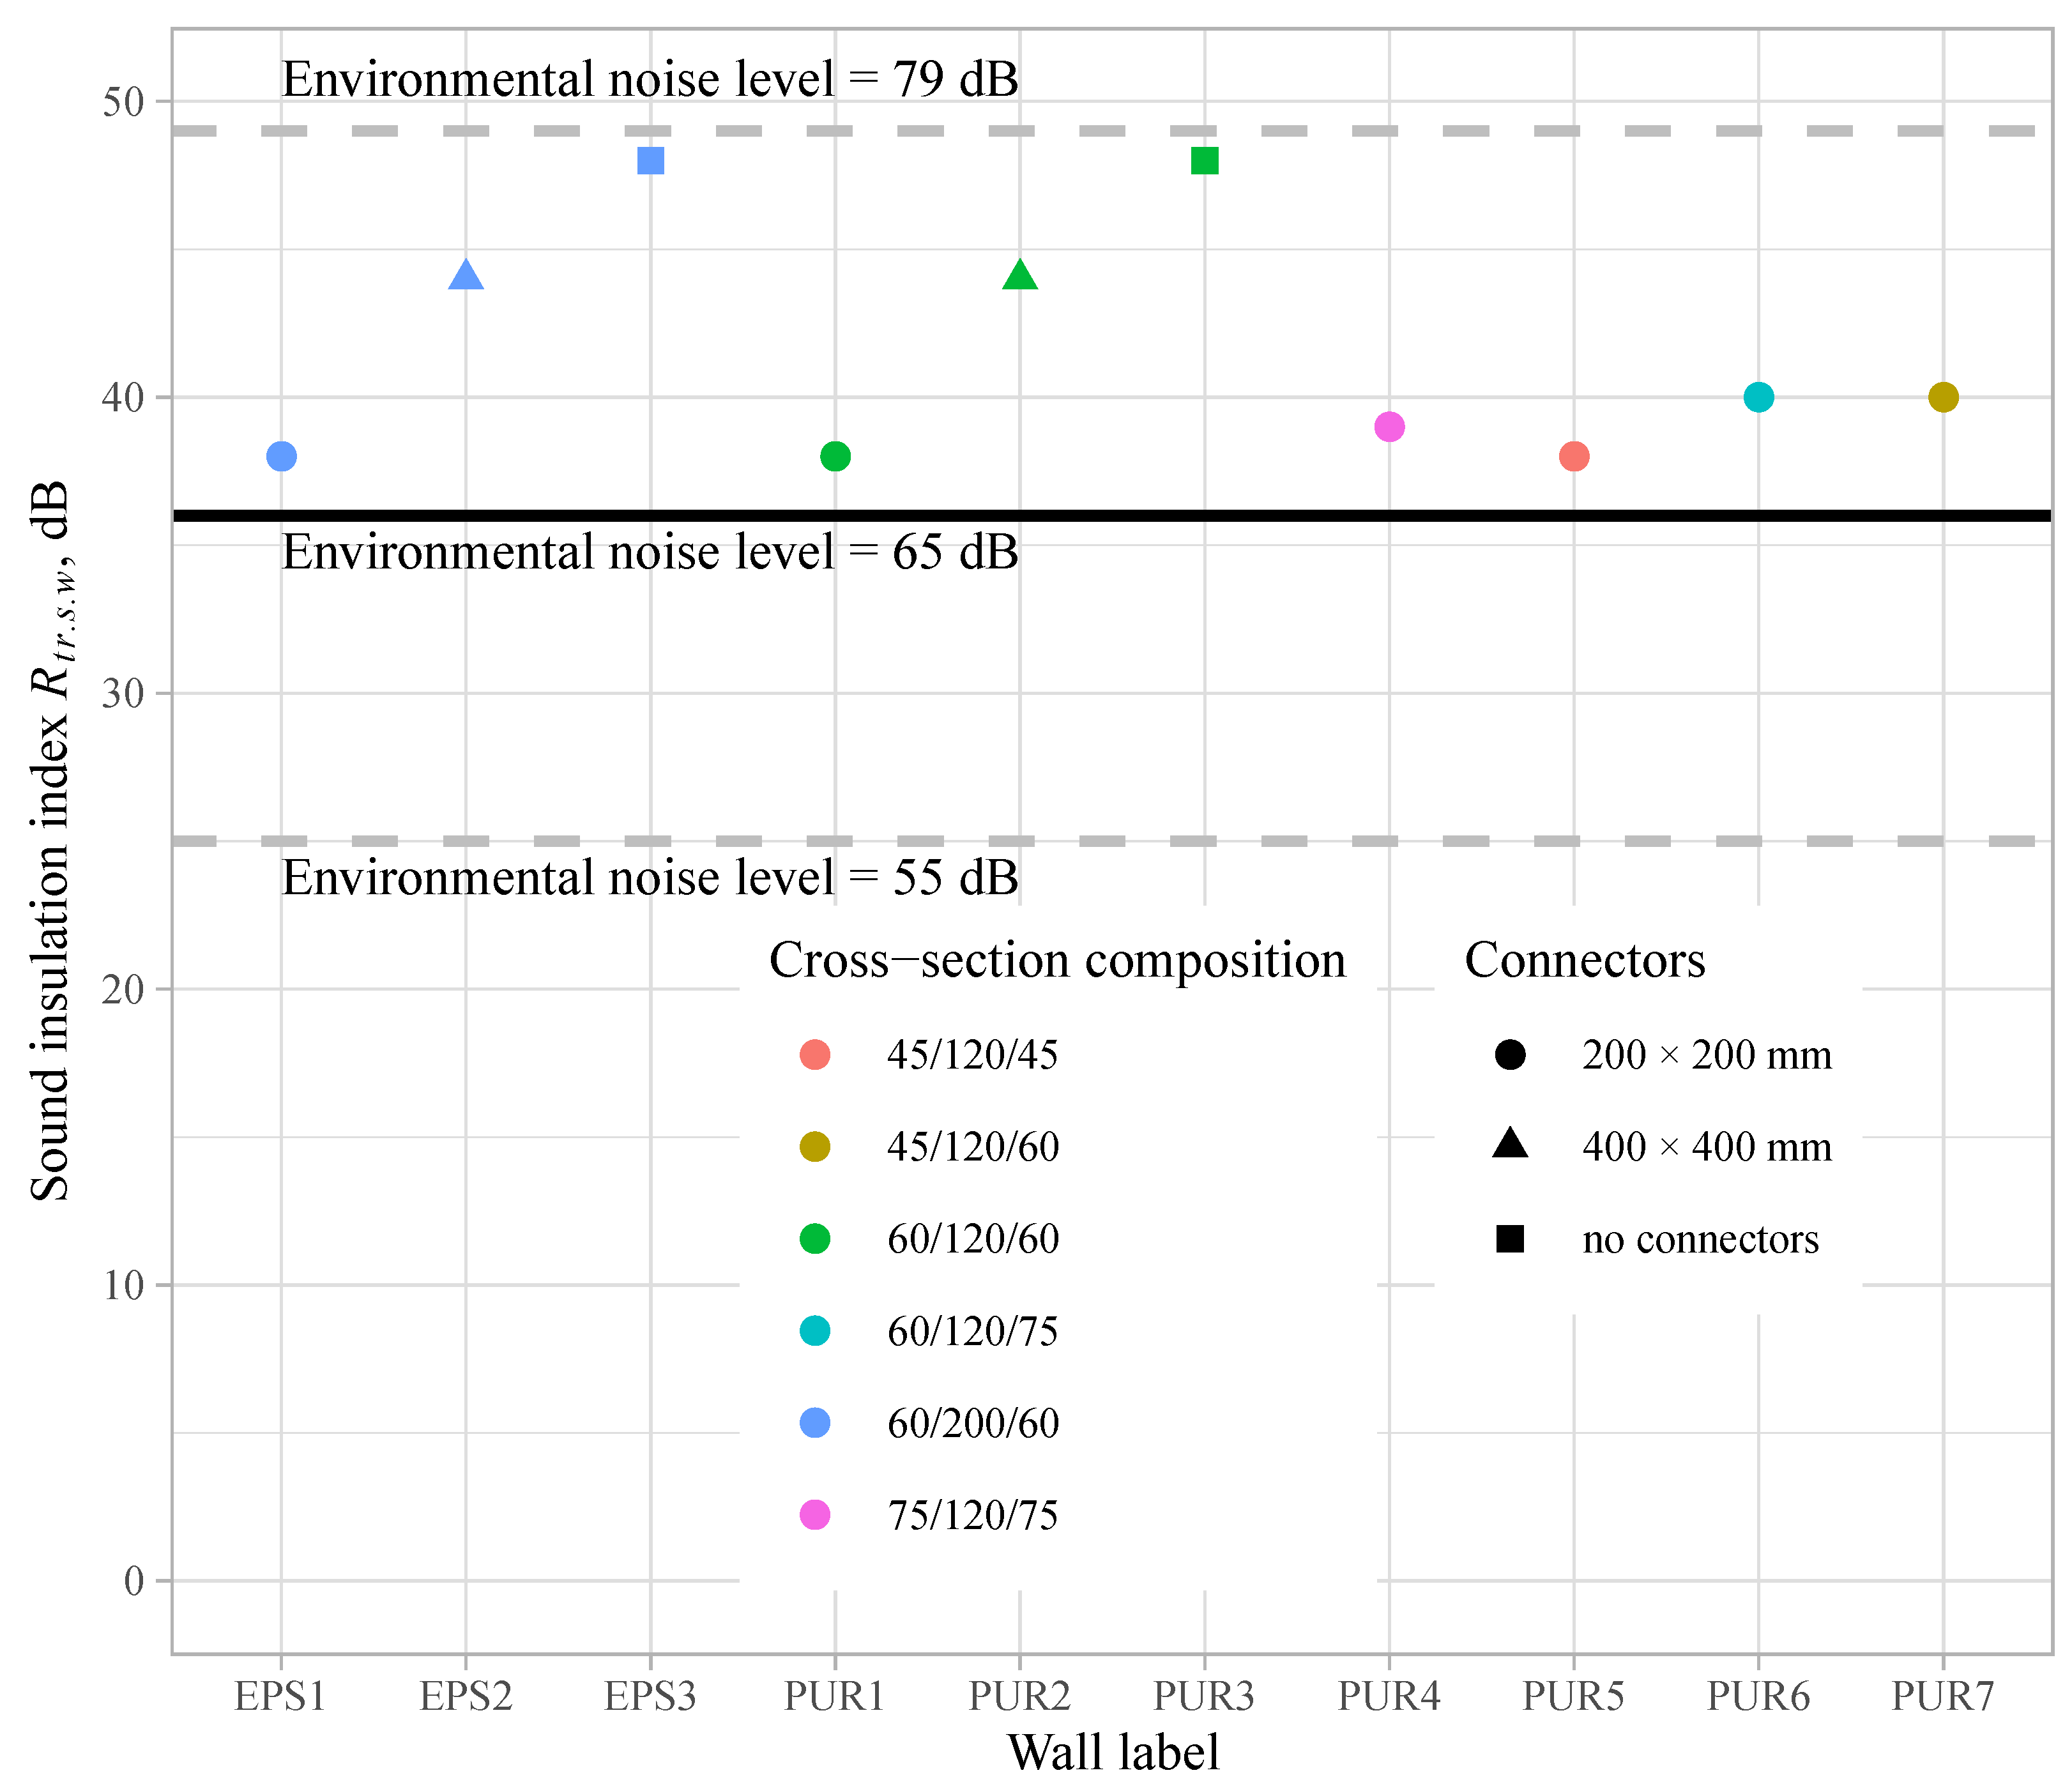
3.2. Sound Insulation Performance

The sound insulation performance of the SW can be described by a diagram relating sound reduction R w to frequency f given in Figure 10 and Figure 11. If 60 mm SFRC wythes were used, the lowest sound transmission losses were at the beginning and near 320 Hz, after which a steep linear increase can be observed. The curves were almost the same for walls with 200 mm EPS and 120 mm PUR. That means that low density materials such as EPS and PUR have little effect on sound insulation if airborne noise is considered. This corresponds well with the mass law given in Equation (2) described in Section 2.2 and experimental findings by other authors [43,44].
The results of the analysis reveal that the most influential factors are the presence and number of connectors between outer SFRC layers. If the wythes are connected, their sound-induced vibrations tend to be more synchronised. In this case, the addition of connectors with a spacing of 400 × 400 mm resulted in lower sound reduction, by about 4 dB, at low frequencies, but almost no difference near higher frequencies (∼2000 Hz). By increasing the density of the connectors to 200 × 200 mm, the sound reduction decreased by 6 dB over the whole range of the frequencies if compared to the SW with 400 × 400 mm connectors (see Figure 10).
Assuming the highest density of connectors (i.e., 200 × 200 mm spacing), additional analysis was performed to evaluate the effect of the thickness of SFRC wythes. As can be seen from the diagrams plotted in Figure 11, changing the thickness and consequently the mass of the wall changes the position of the “valleys” of the R w f curves. After decreasing the thickness of both wythes to 45 mm, the lowest point moved up to 400 Hz, which is closer to the centre of the everyday noise range. Increasing the thickness to 75 mm moves the “valley” down to 250 Hz, which is further from the centre. Although in this case, the sound reduction is smaller at lower frequencies, it is significantly higher (∼8 dB) in the frequencies above 400 Hz. Nevertheless, the best results can be obtained if the SFRC wythes have different thickness. In both cases, whether the thicknesses of one wythe is reduced or increased by 15 mm, the sound reduction in the “valley” increases by around 3 to 4 dB. In fact, the “valley” is replaced by two considerably smaller ones.
All the R w f curves were weighted, and the sound insulation indexes, R t r , s , w , calculated according to (4), are plotted together with the required minimum values in Figure 12. In all these cases, the obtained sound insulation index values are higher than 36 dB, which corresponds to the highest admissible environmental noise levels (65 dB) set by the Latvian Building Regulations [37]. However, the reserve was only 2 to 3 dB if a symmetric cross-section with dense spacing between connectors was used. If an asymmetric cross-section is introduced and the difference between the thickness of both wythes is 15 mm, the index is 4 dB higher than the required value. In this way, it is possible to improve the acoustic performance by reducing material consumption. If the actual environmental noise level is higher than 65 dB, other measures should be applied. Reduction of the amount of connectors seems to be one of the most effective approaches to be considered.

3.3. Structural Performance
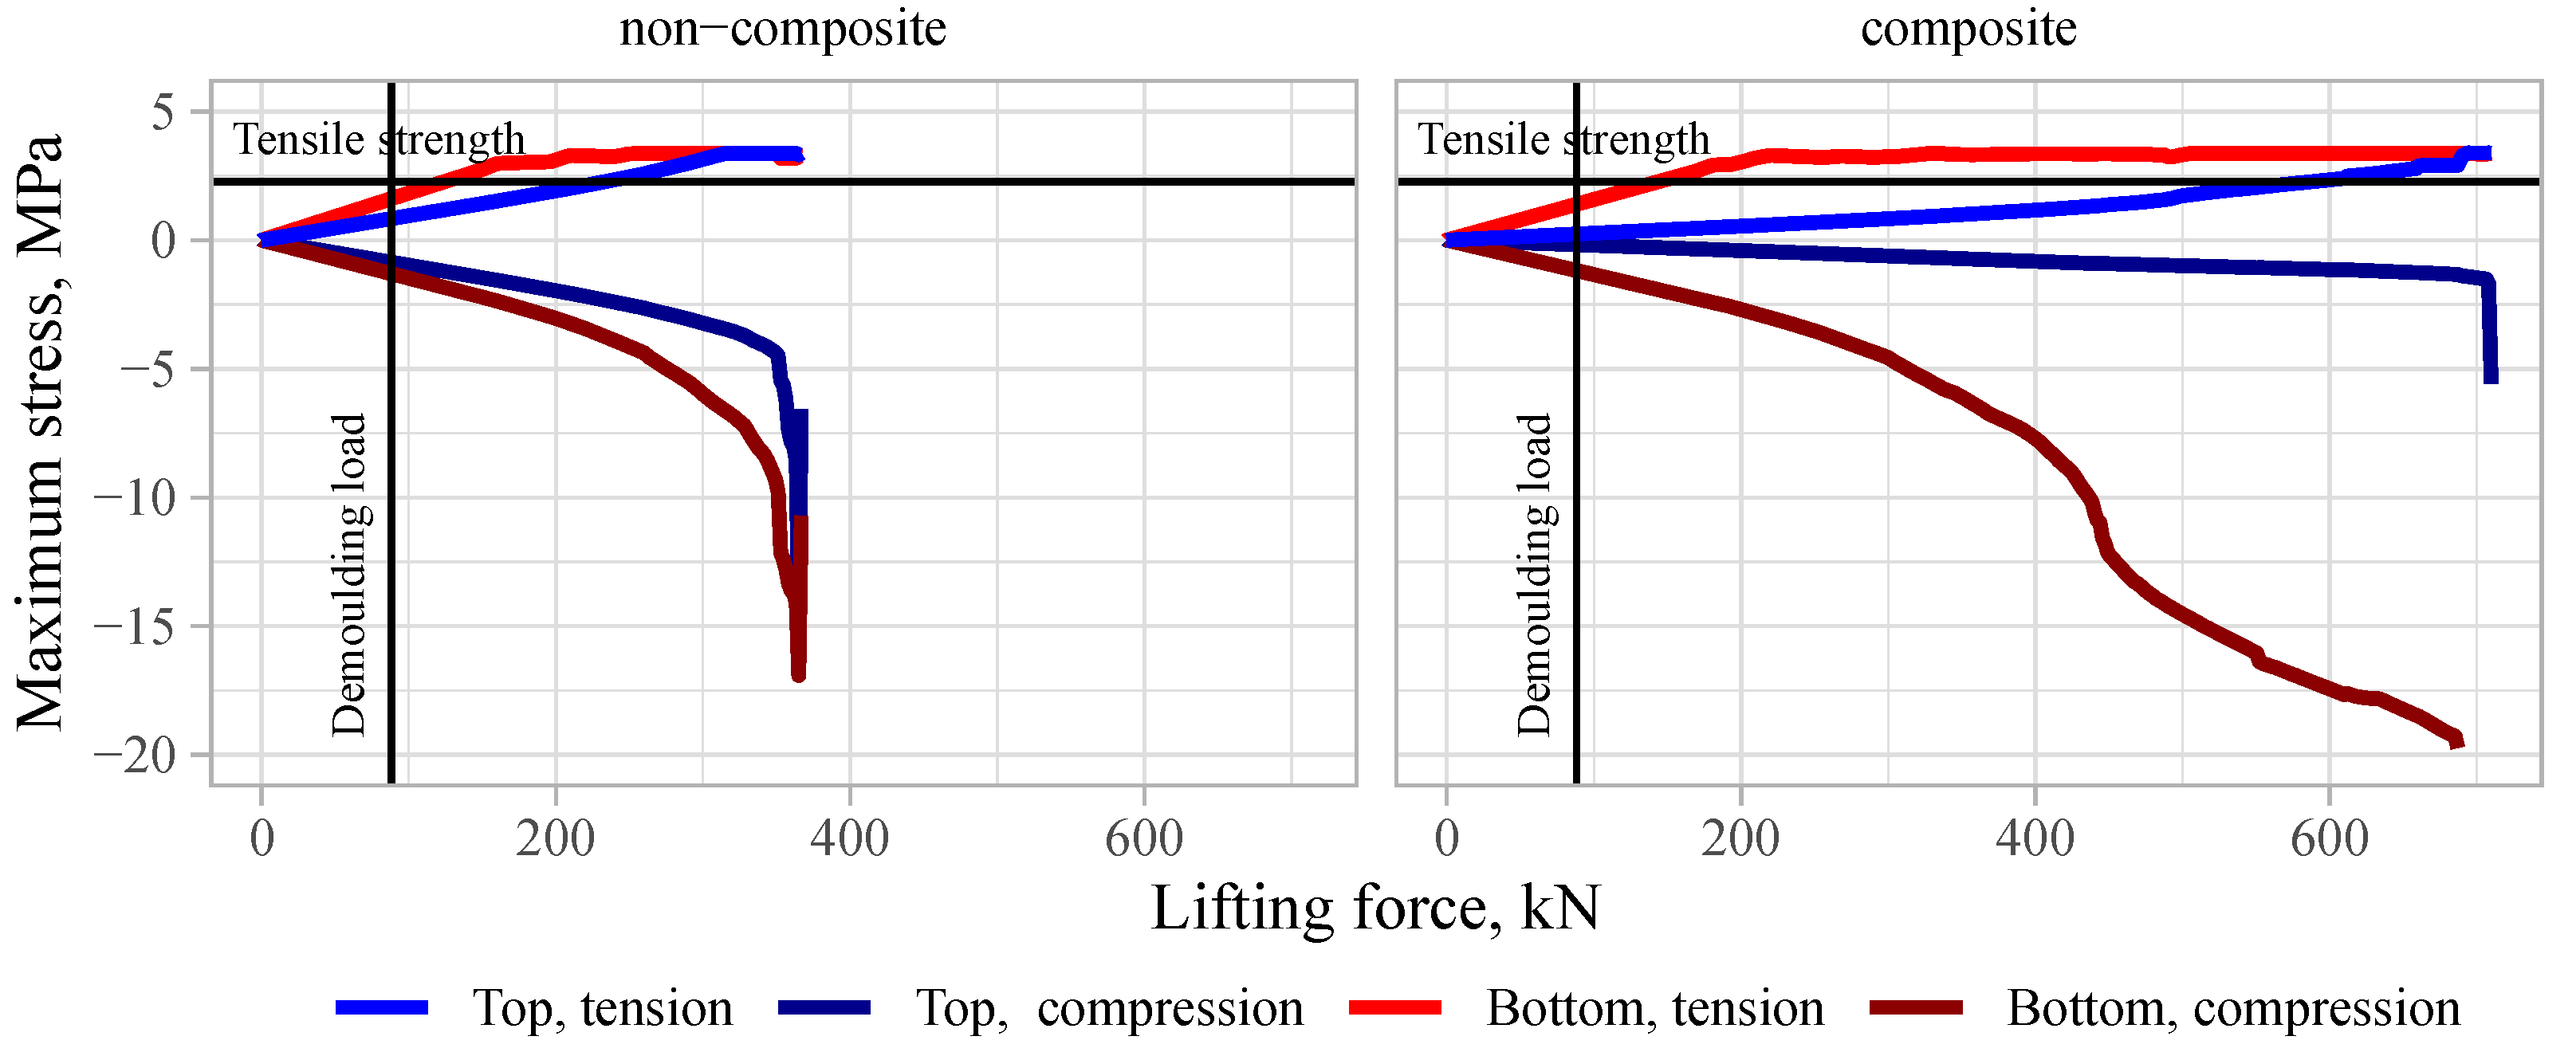
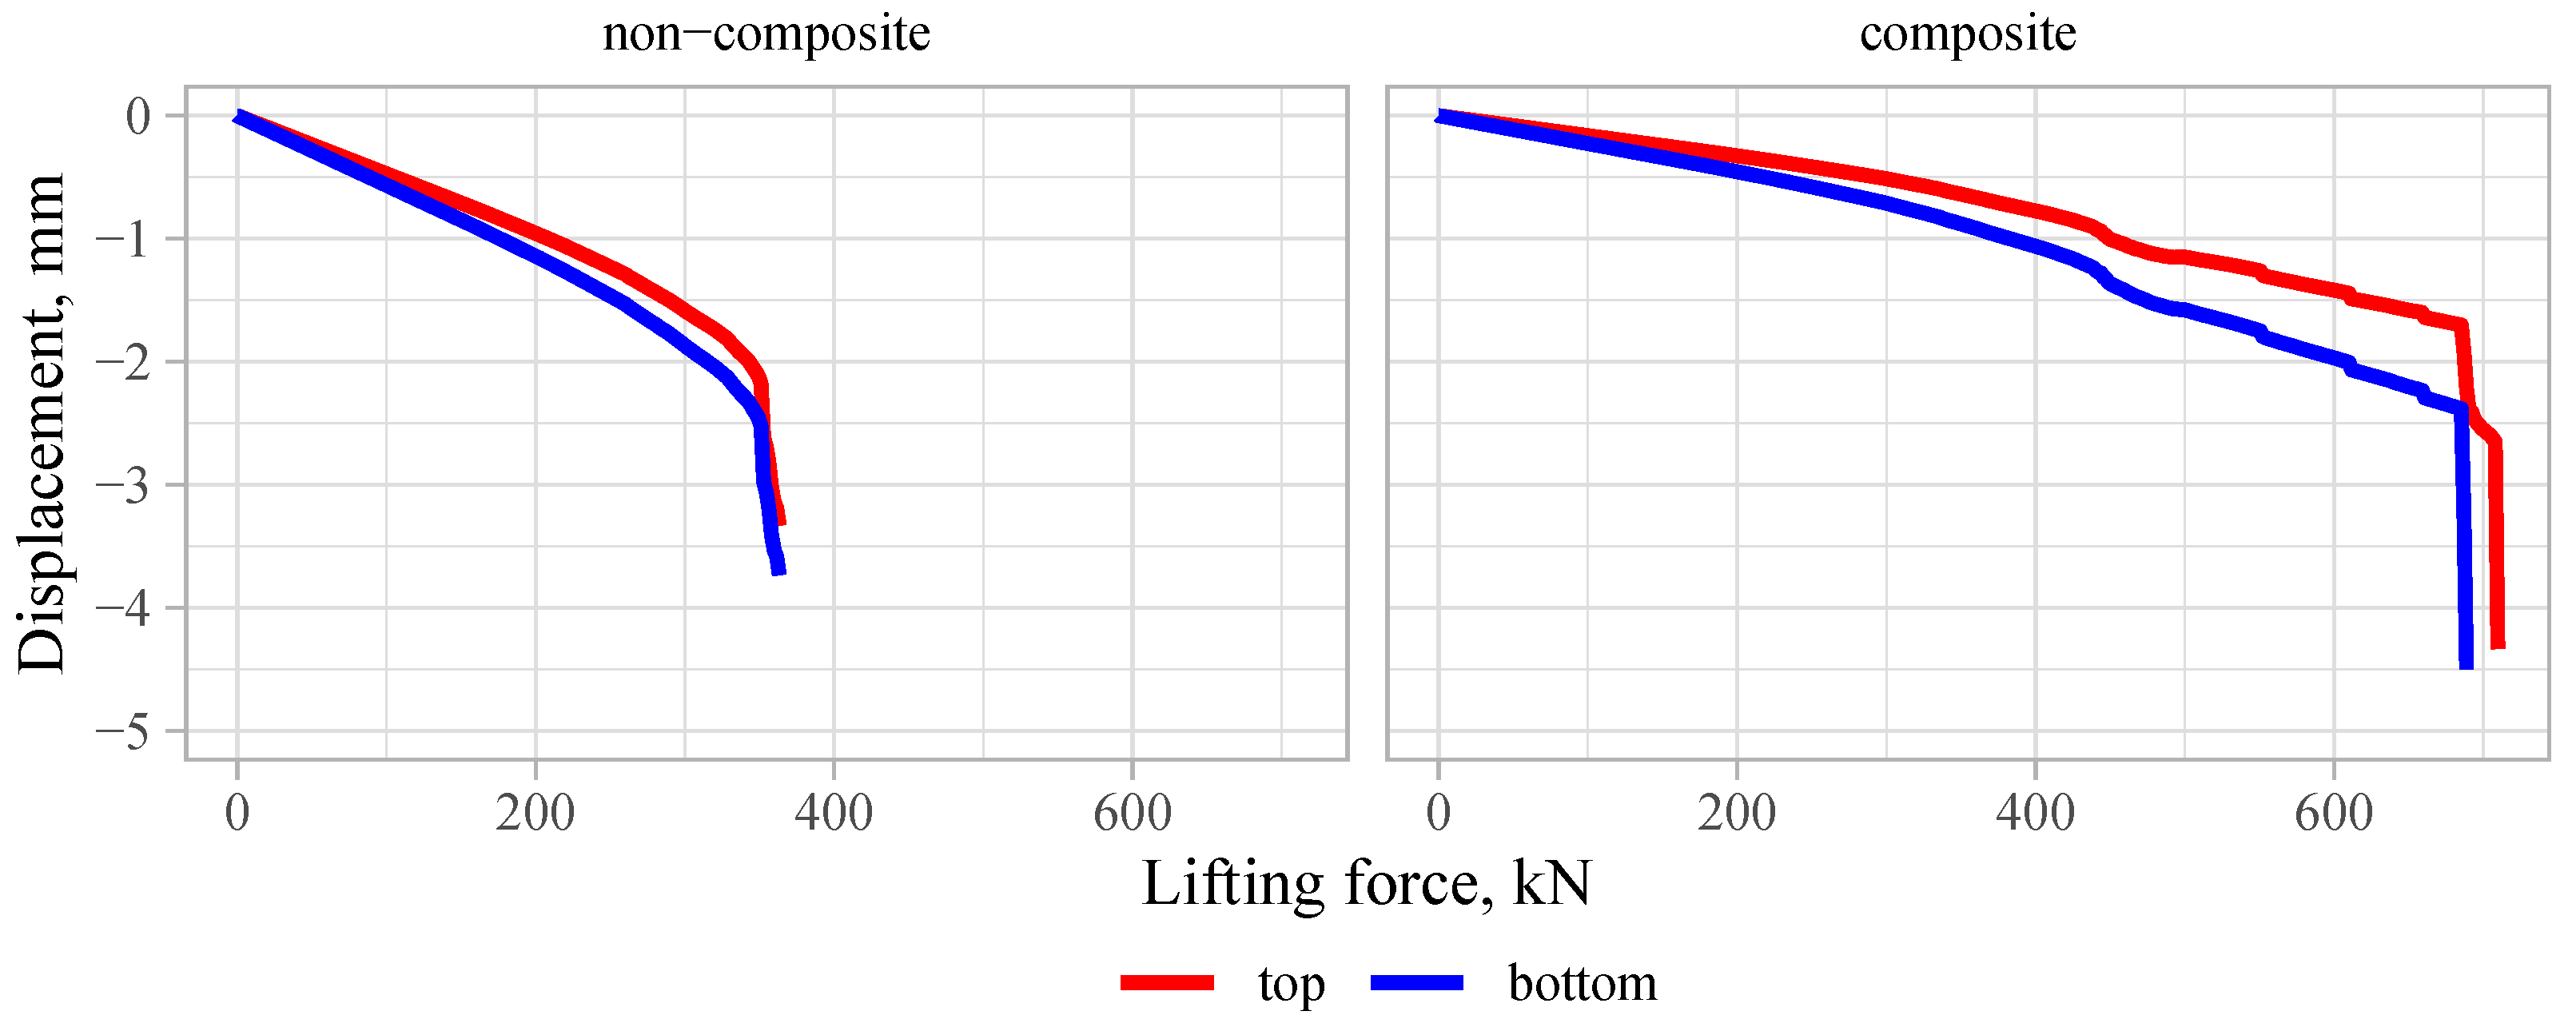
The structural performance of the wall was evaluated by (1) stresses and (2) deformations of the wythes and (3) maximum load-bearing capacity. The compression stresses must be lower than 67/1.5 = 44.5 MPa, and tensile stresses should be less than 3.4/1.5 = 2.26 MPa to prevent cracking. The load-bearing capacity should be sufficient to take the design loads.

3.3.1. Demoulding

At the moment of demoulding, maximum compressive stresses are 0.8–1.3 MPa for non-composite walls and 0.2–1.2 MPa for composite walls. The tensile stresses are 0.8–1.6 MPa for non-composite walls and 0.25–1.4 MPa for composite walls. Although the tensile stresses are lower than the strength, the demoulding is normally done while the concrete is premature. This increases the risk of cracking; therefore, horizontal demoulding should be avoided. The stresses in the top and bottom wythes plotted over the applied lifting load are given in Figure 13. The demoulding load is calculated by multiplying the distributed area load 4.2 kN/m 2 with the surface area of one side of the wall, i.e., 4.2 × 3.5 × 6.0 = 88.2 kN. As the lifting load cannot exceed the demoulding load, the lifting load in the figure should be considered as a pseudo lifting load.
Maximum deformations are very small (<1.0 mm) at the demoulding load. The deflection of the wall during the lifting process is shown in Figure 14. The maximum force needed for the wall to fail is around 360 kN for the non-composite and around 700 kN for composite walls, which are 4 and 8 times more than the applied load, respectively.

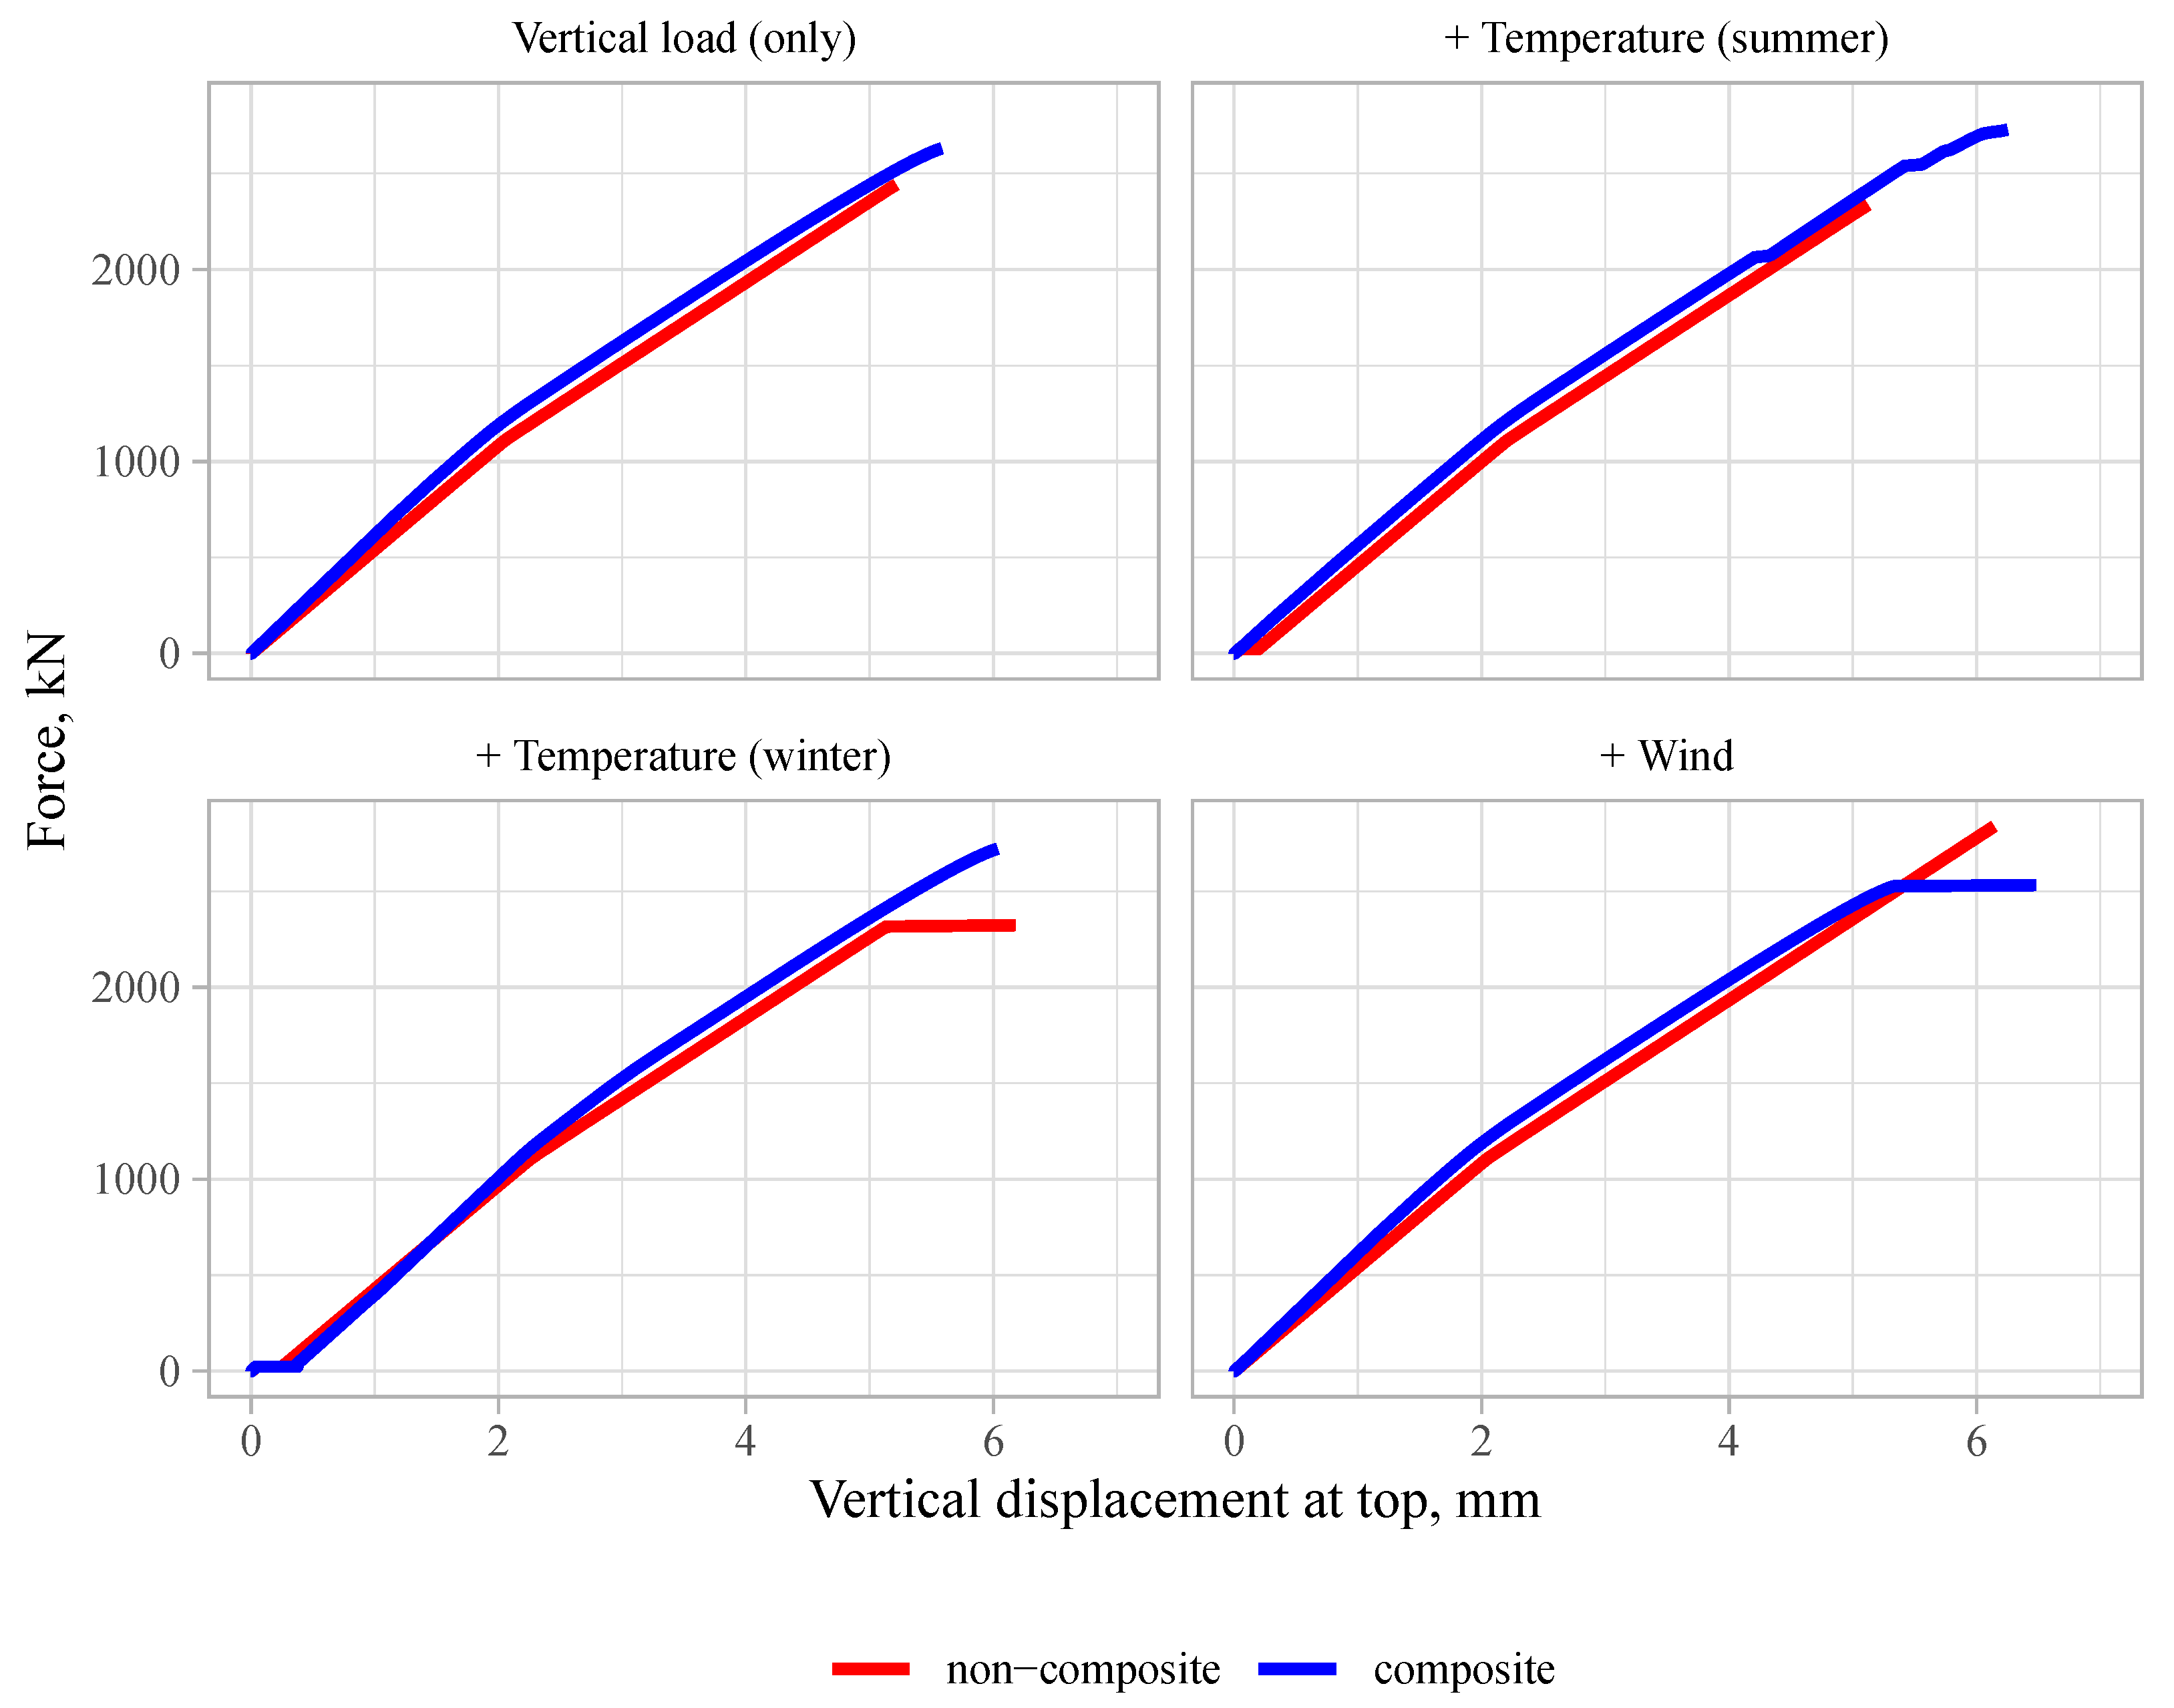
3.3.2. Persistent Design Situation

The load-bearing capacity of the external wall estimated by the non-linear FEM analysis was significantly higher than necessary in the design situations. The assessed vertical design load was approximately 23 kN/m, which can increase several times near large openings. Nevertheless, the numerical results show that the failure load can reach up to a value 100 times higher, i.e., 2200–3100 kN/m. These results are lower than the theoretical cross-section capacity in a centric load:
N R = f c m · A c = 67 × 60 × 1000 × 10 3 = 4020 kN / m ,
if one wythe is considered, and N R = 8040 kN/m if the cross-section of both SFRC layers are considered. The calculated load–displacement curves for exterior wall under different load combinations are given in Figure 15. It should be noted that the eccentricity of the applied point load at the top of the inner layer (see Section 2.4.3) has a minor influence on the failure of the wall and almost no influence on the behaviour of the wall at the level of the design load.
Although the estimated load-bearing capacity for an exterior wall was almost the same for composite and non-composite walls, different results were obtained in the case of an inner wall (see Figure 16). The composite wall failed at approximately 6000 kN/m, and the non-composite at 3300 kN/m. Despite that in both cases, the whole cross-section area was loaded symmetrically, the non-composite section showed an almost twice smaller load-bearing capacity, which is close to the cross-sectional capacity of a single wythe.
If stresses of an external wall are analysed, a distinction between non-composite and composite wall types can be noticed. The stresses plotted over the applied force are shown in Figure 17 and Figure 18. In the case of non-composite walls, stresses in the outer wythe were close to zero and do not change much. All the stresses were taken by the loaded inner wythe. Although the overall behaviour was similar in both cases, higher stress levels developed in composite walls due to temperature loads. The tensile stresses on the inner surfaces of the wythes reached up to 3.1 MPa, which exceeded the tensile strength. Note that the cracks are not visible because they were on the inner surfaces. Moreover, the load-bearing capacity was not influenced.
Different lateral deformations of two adjacent walls can cause visual defects. Wind and temperature loads are short-term loads, which are not considered in deflection analysis. Long term deformations could be caused by the reaction of roof slabs. If two adjacent wall panels are loaded by slabs with significantly distinct spans, it could result in a notable difference in lateral deformations. The largest lateral displacement showed up in the case of composite cross-section due to the temperature loads. However, the displacement was close to 2.0 mm, which is a very small value for construction sites. In all other cases, the displacements were smaller than 0.5 mm. The vertical force versus lateral displacement of the wythes are plotted in Figure 19 and Figure 20.

4. Discussion

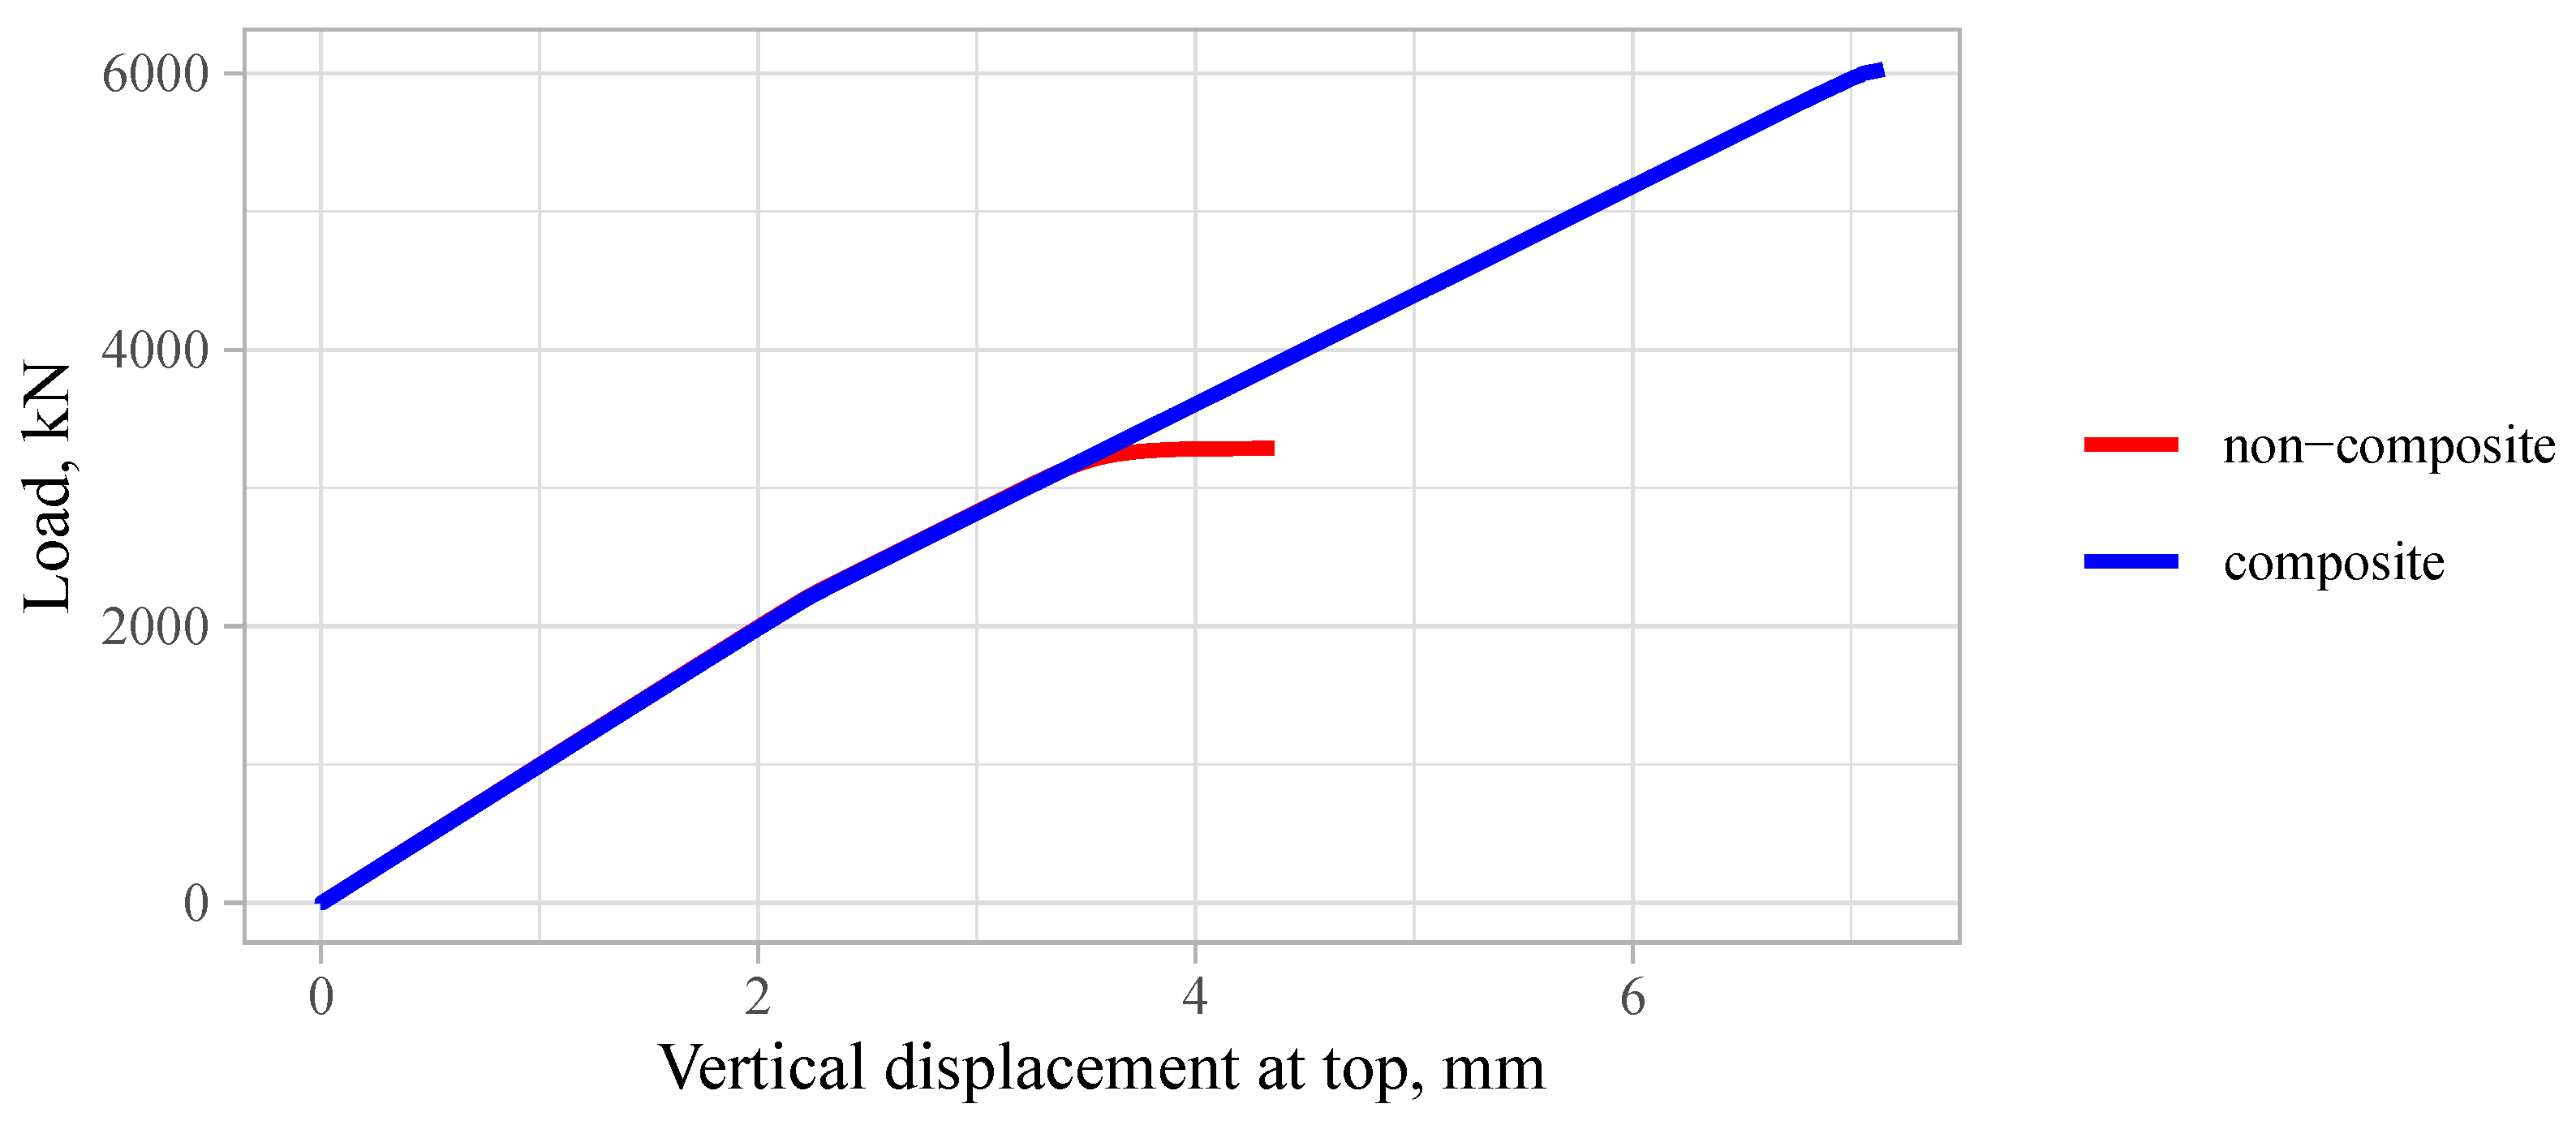
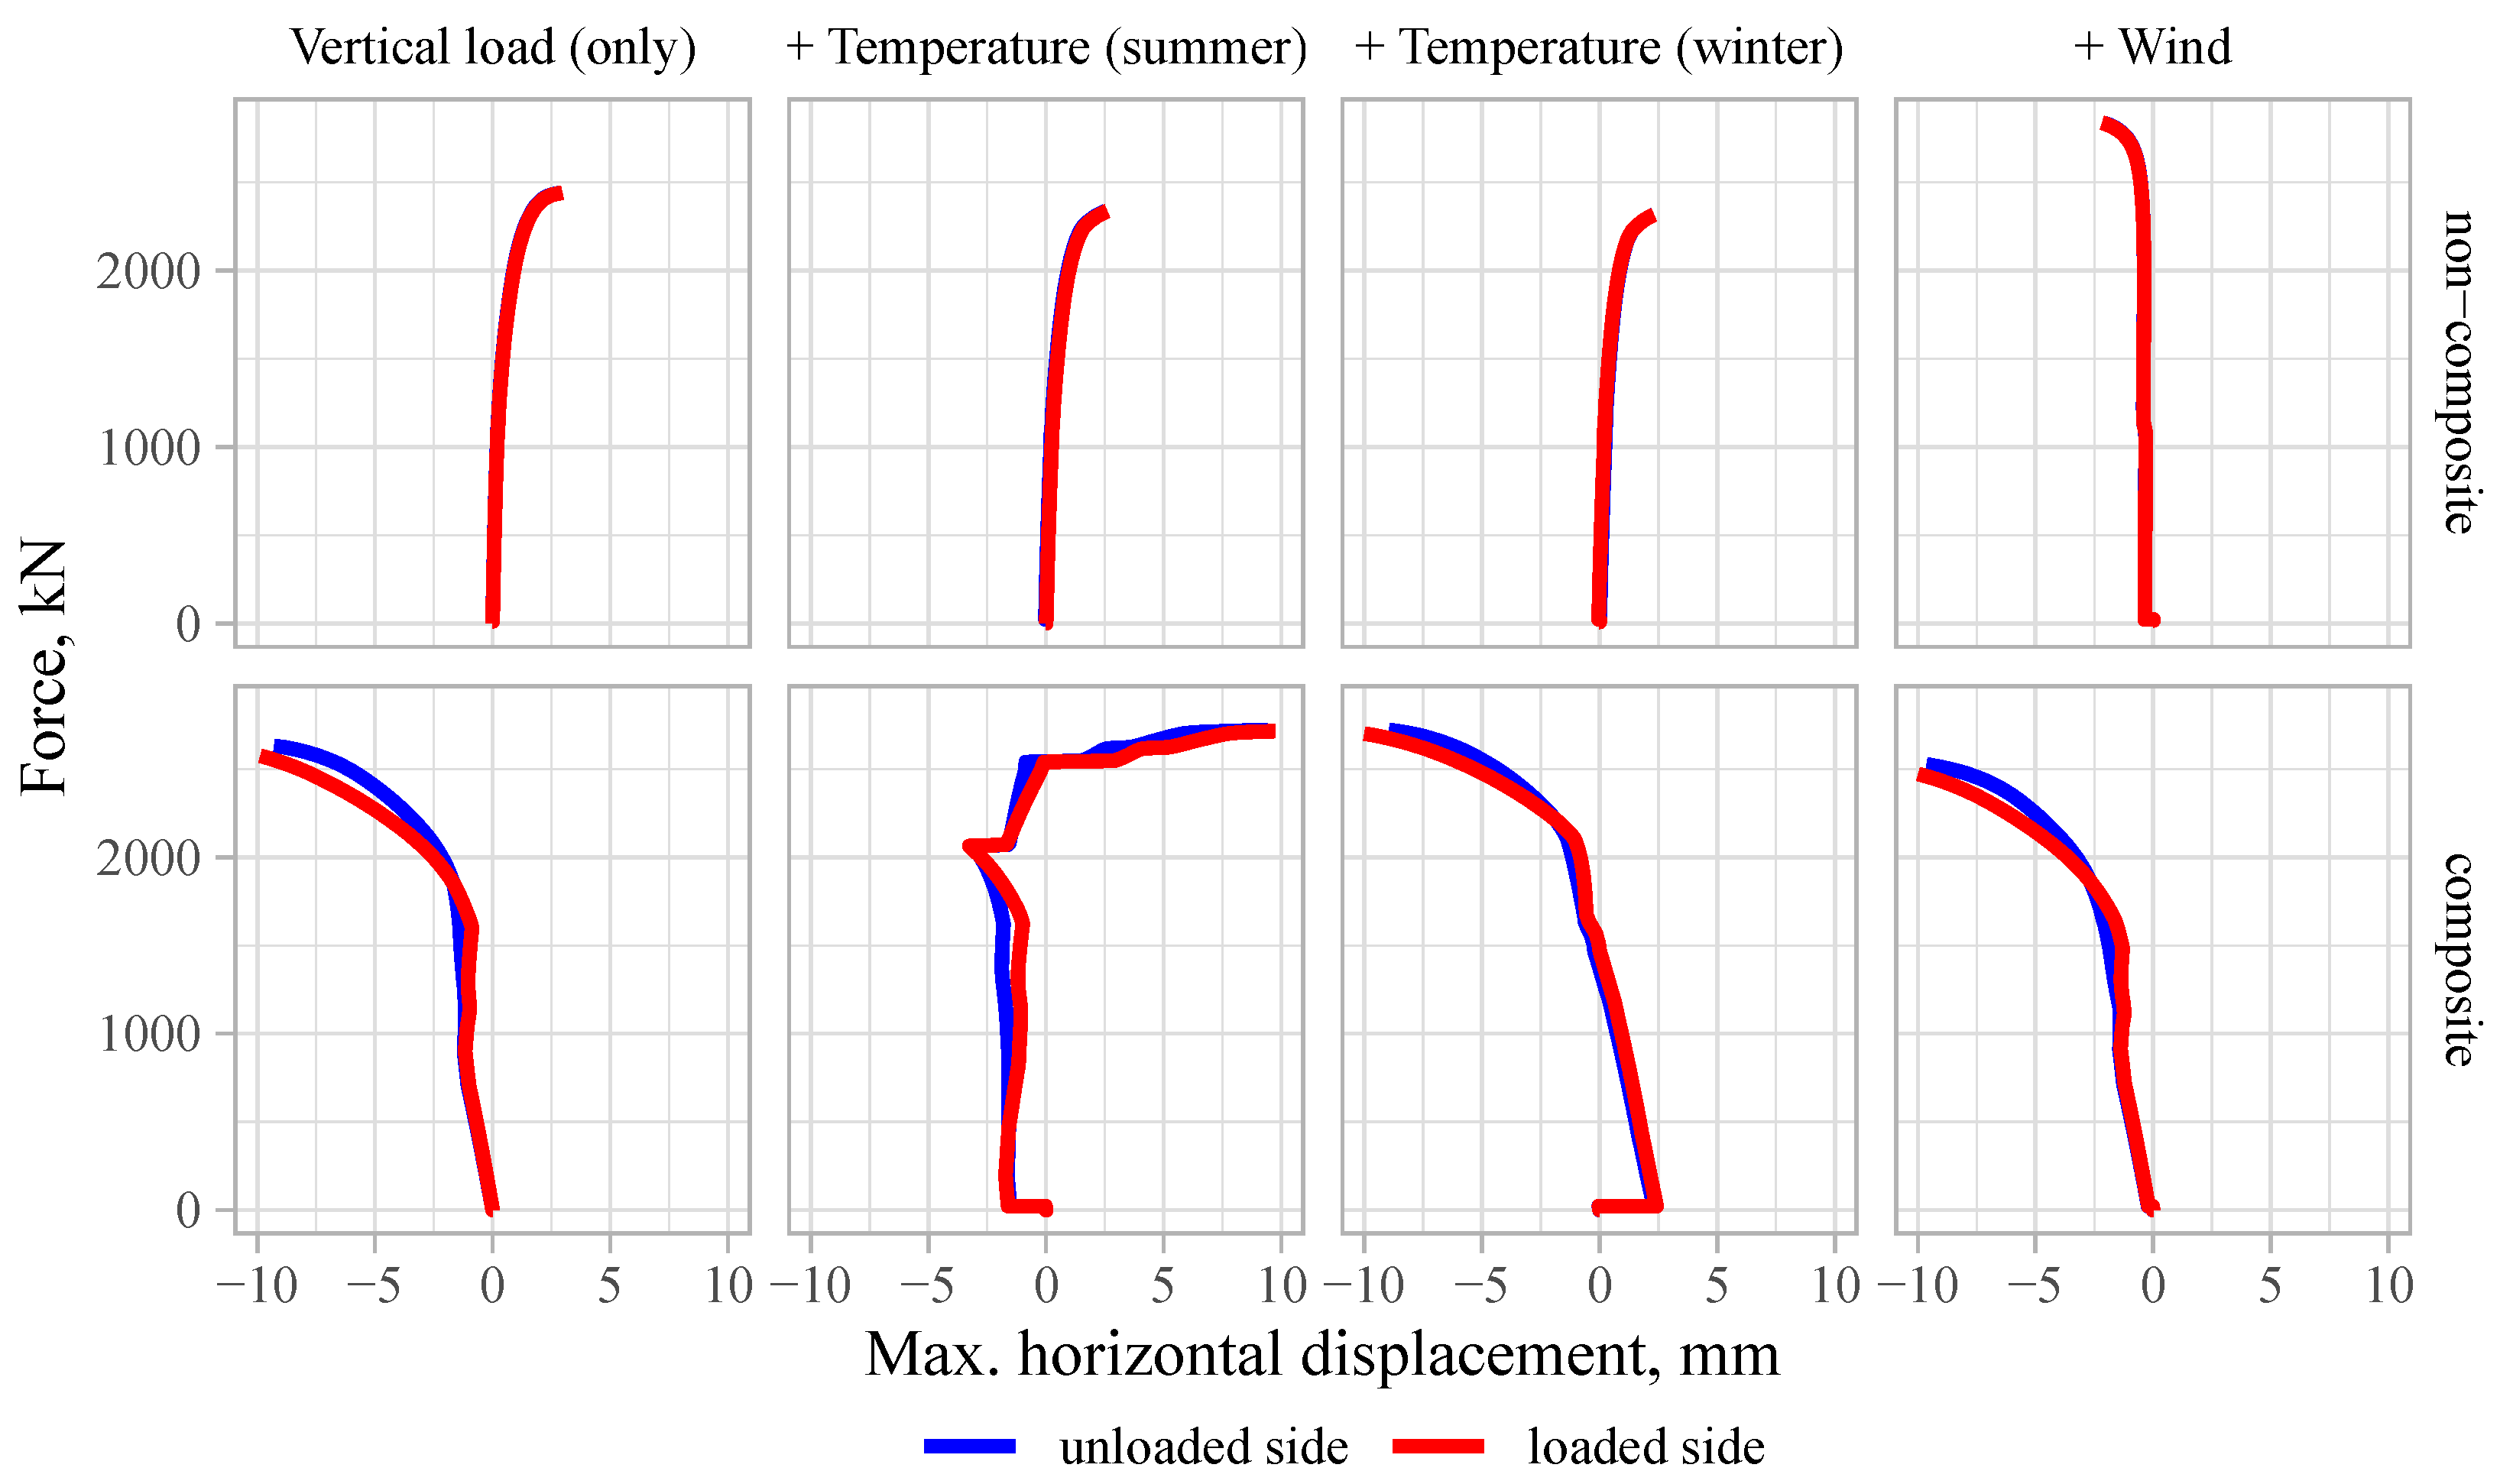
4.1. Load-Bearing Capacity

In the current analysis of the wall with height of 3.5 m, the simulated load-bearing capacity reached 55–77% of the cross-section capacity, N R , calculated according to Equation (5). This is similar to the results of thin-layer reinforced concrete sandwich panels subjected to eccentric compression obtained by Alchaar and Abed [45]. In their case, failure occurred at 70%. Experimental tests and numerical simulations of sprayed in situ reinforced concrete sandwich panels with 50 mm wide wythes that were 1.1 and 3.0 m in height were carried out by Serpilli et al. [6], attaining 55% and 64%, respectively, of the cross-section capacity under centric loading. In the tests conducted by Gara et al. [14], rather slender sandwich panels without shear connectors were loaded (height 3.0 m, wythe thickness 35 mm). The obtained load-bearing capacity was only around 20–40% of the cross-section capacity. The results depend on the eccentricity of the load and the thickness of the insulation layer.

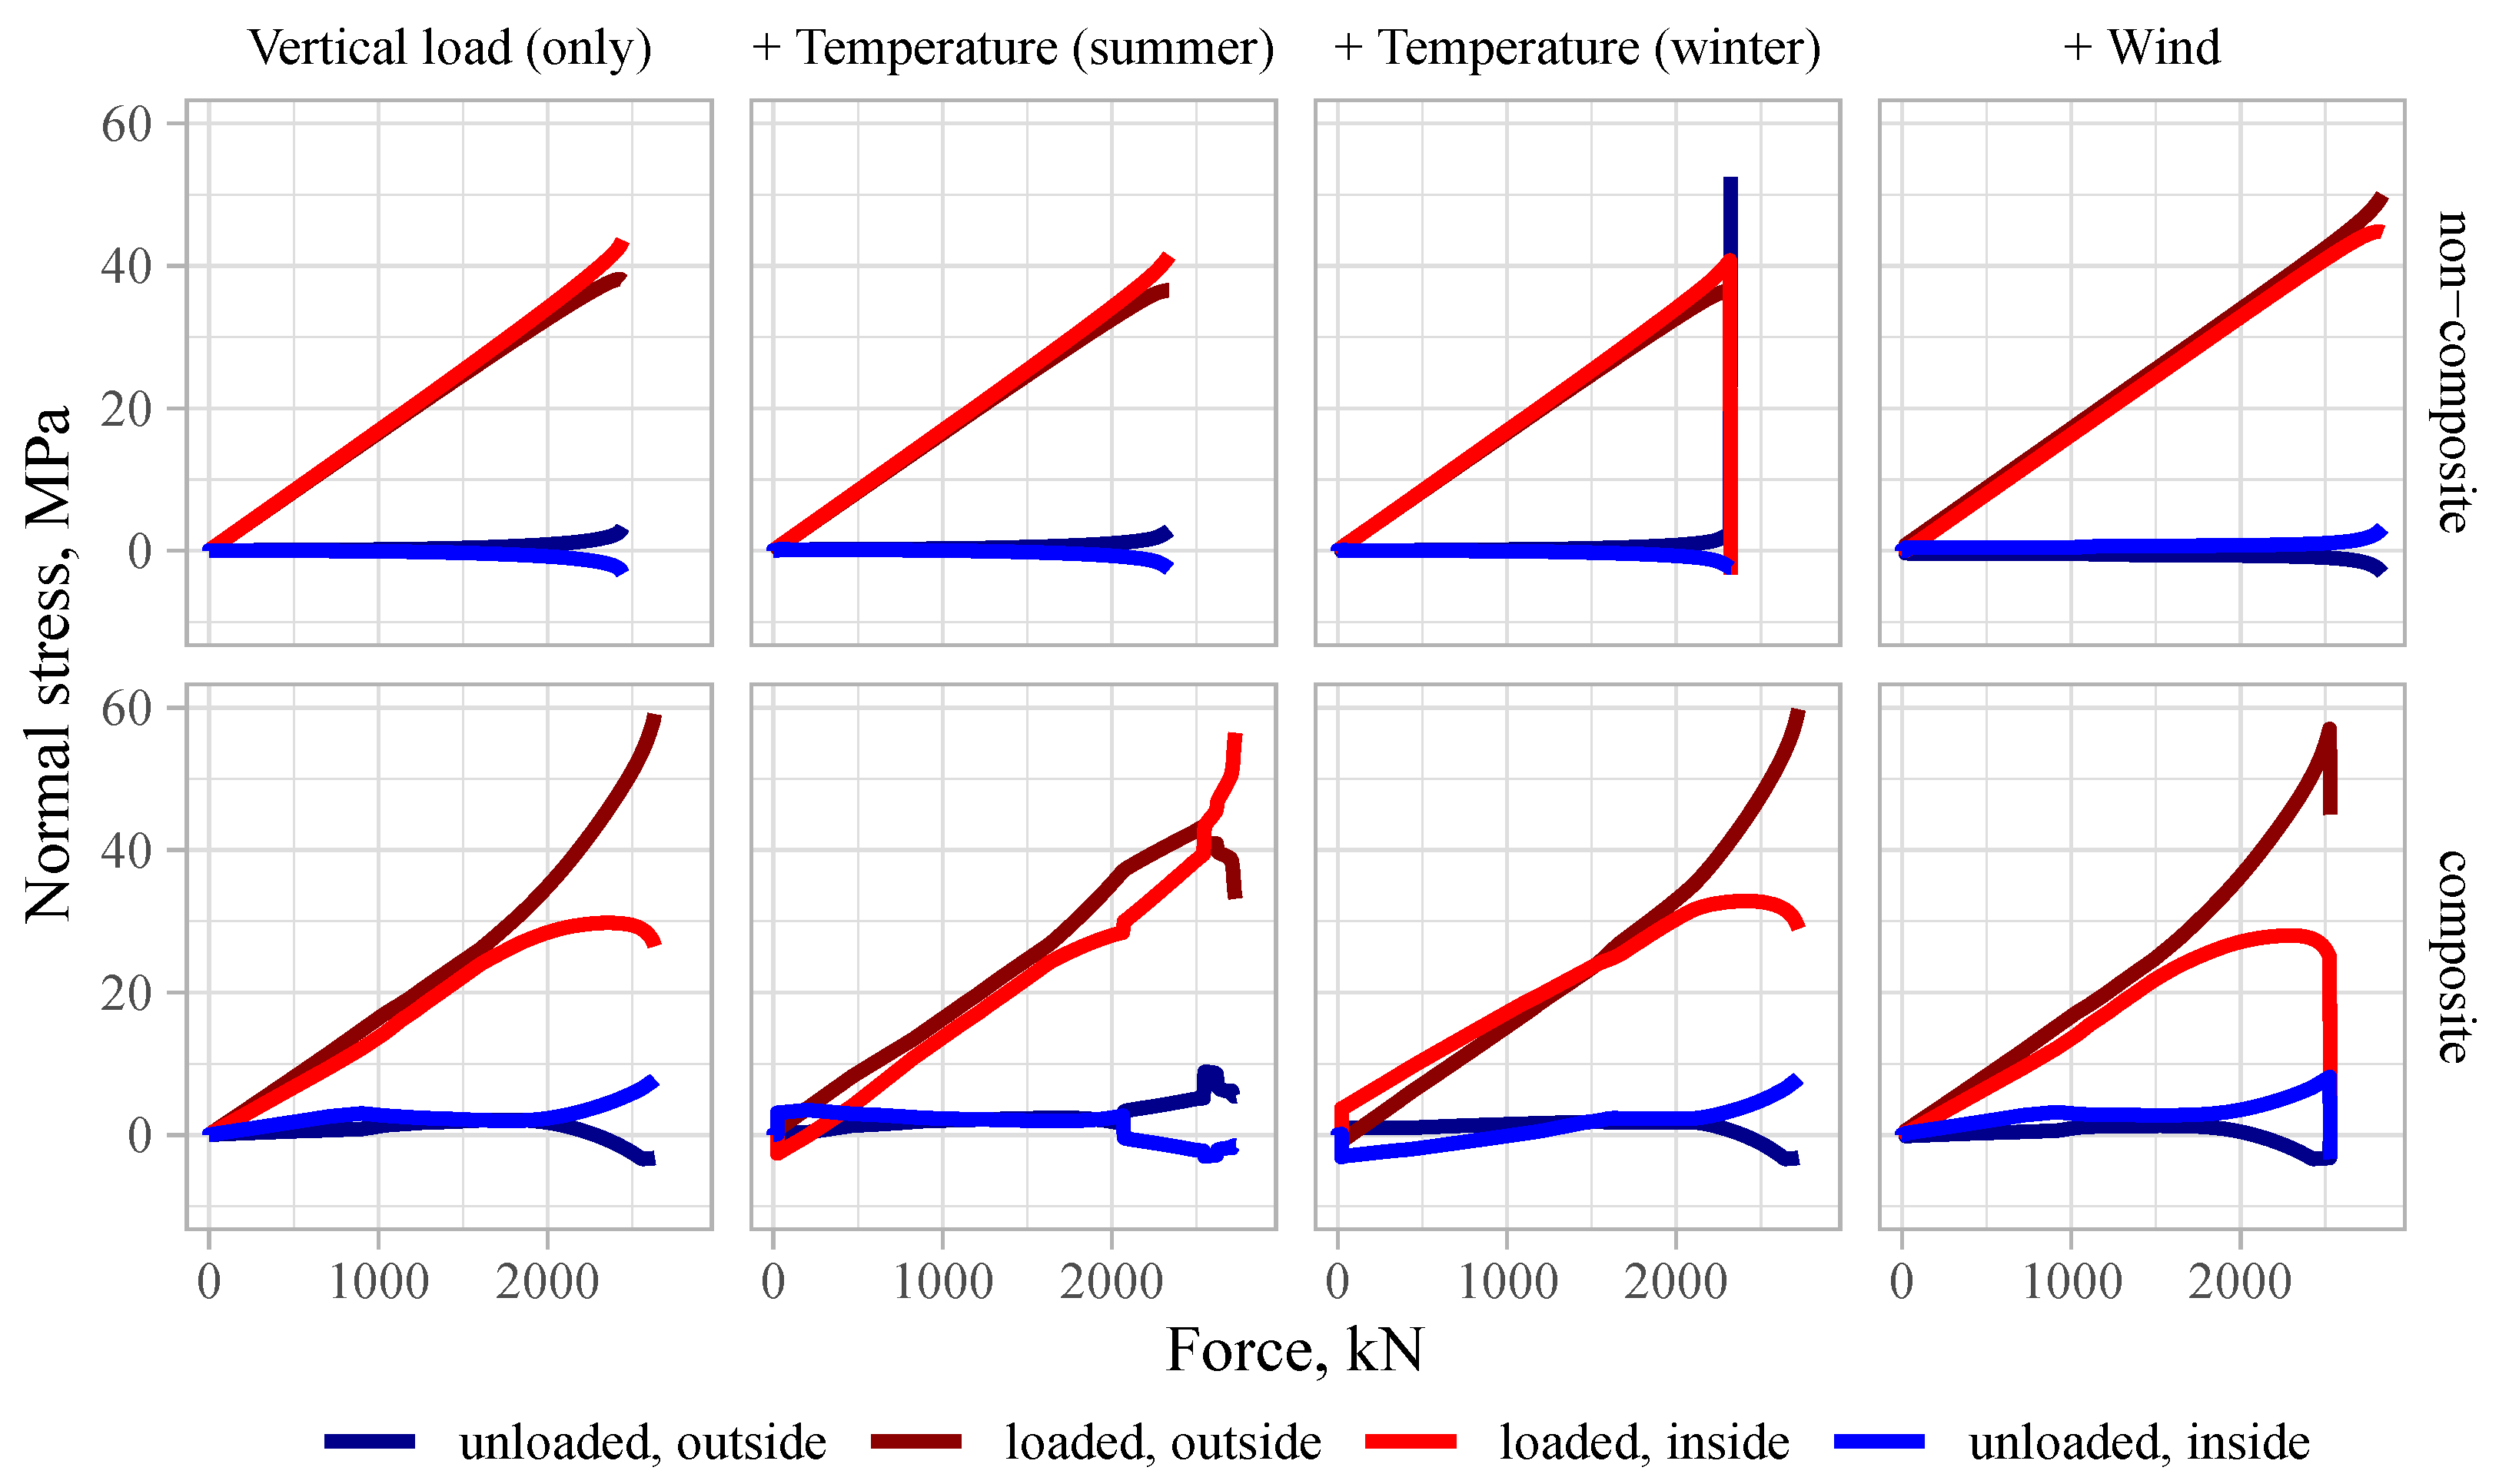
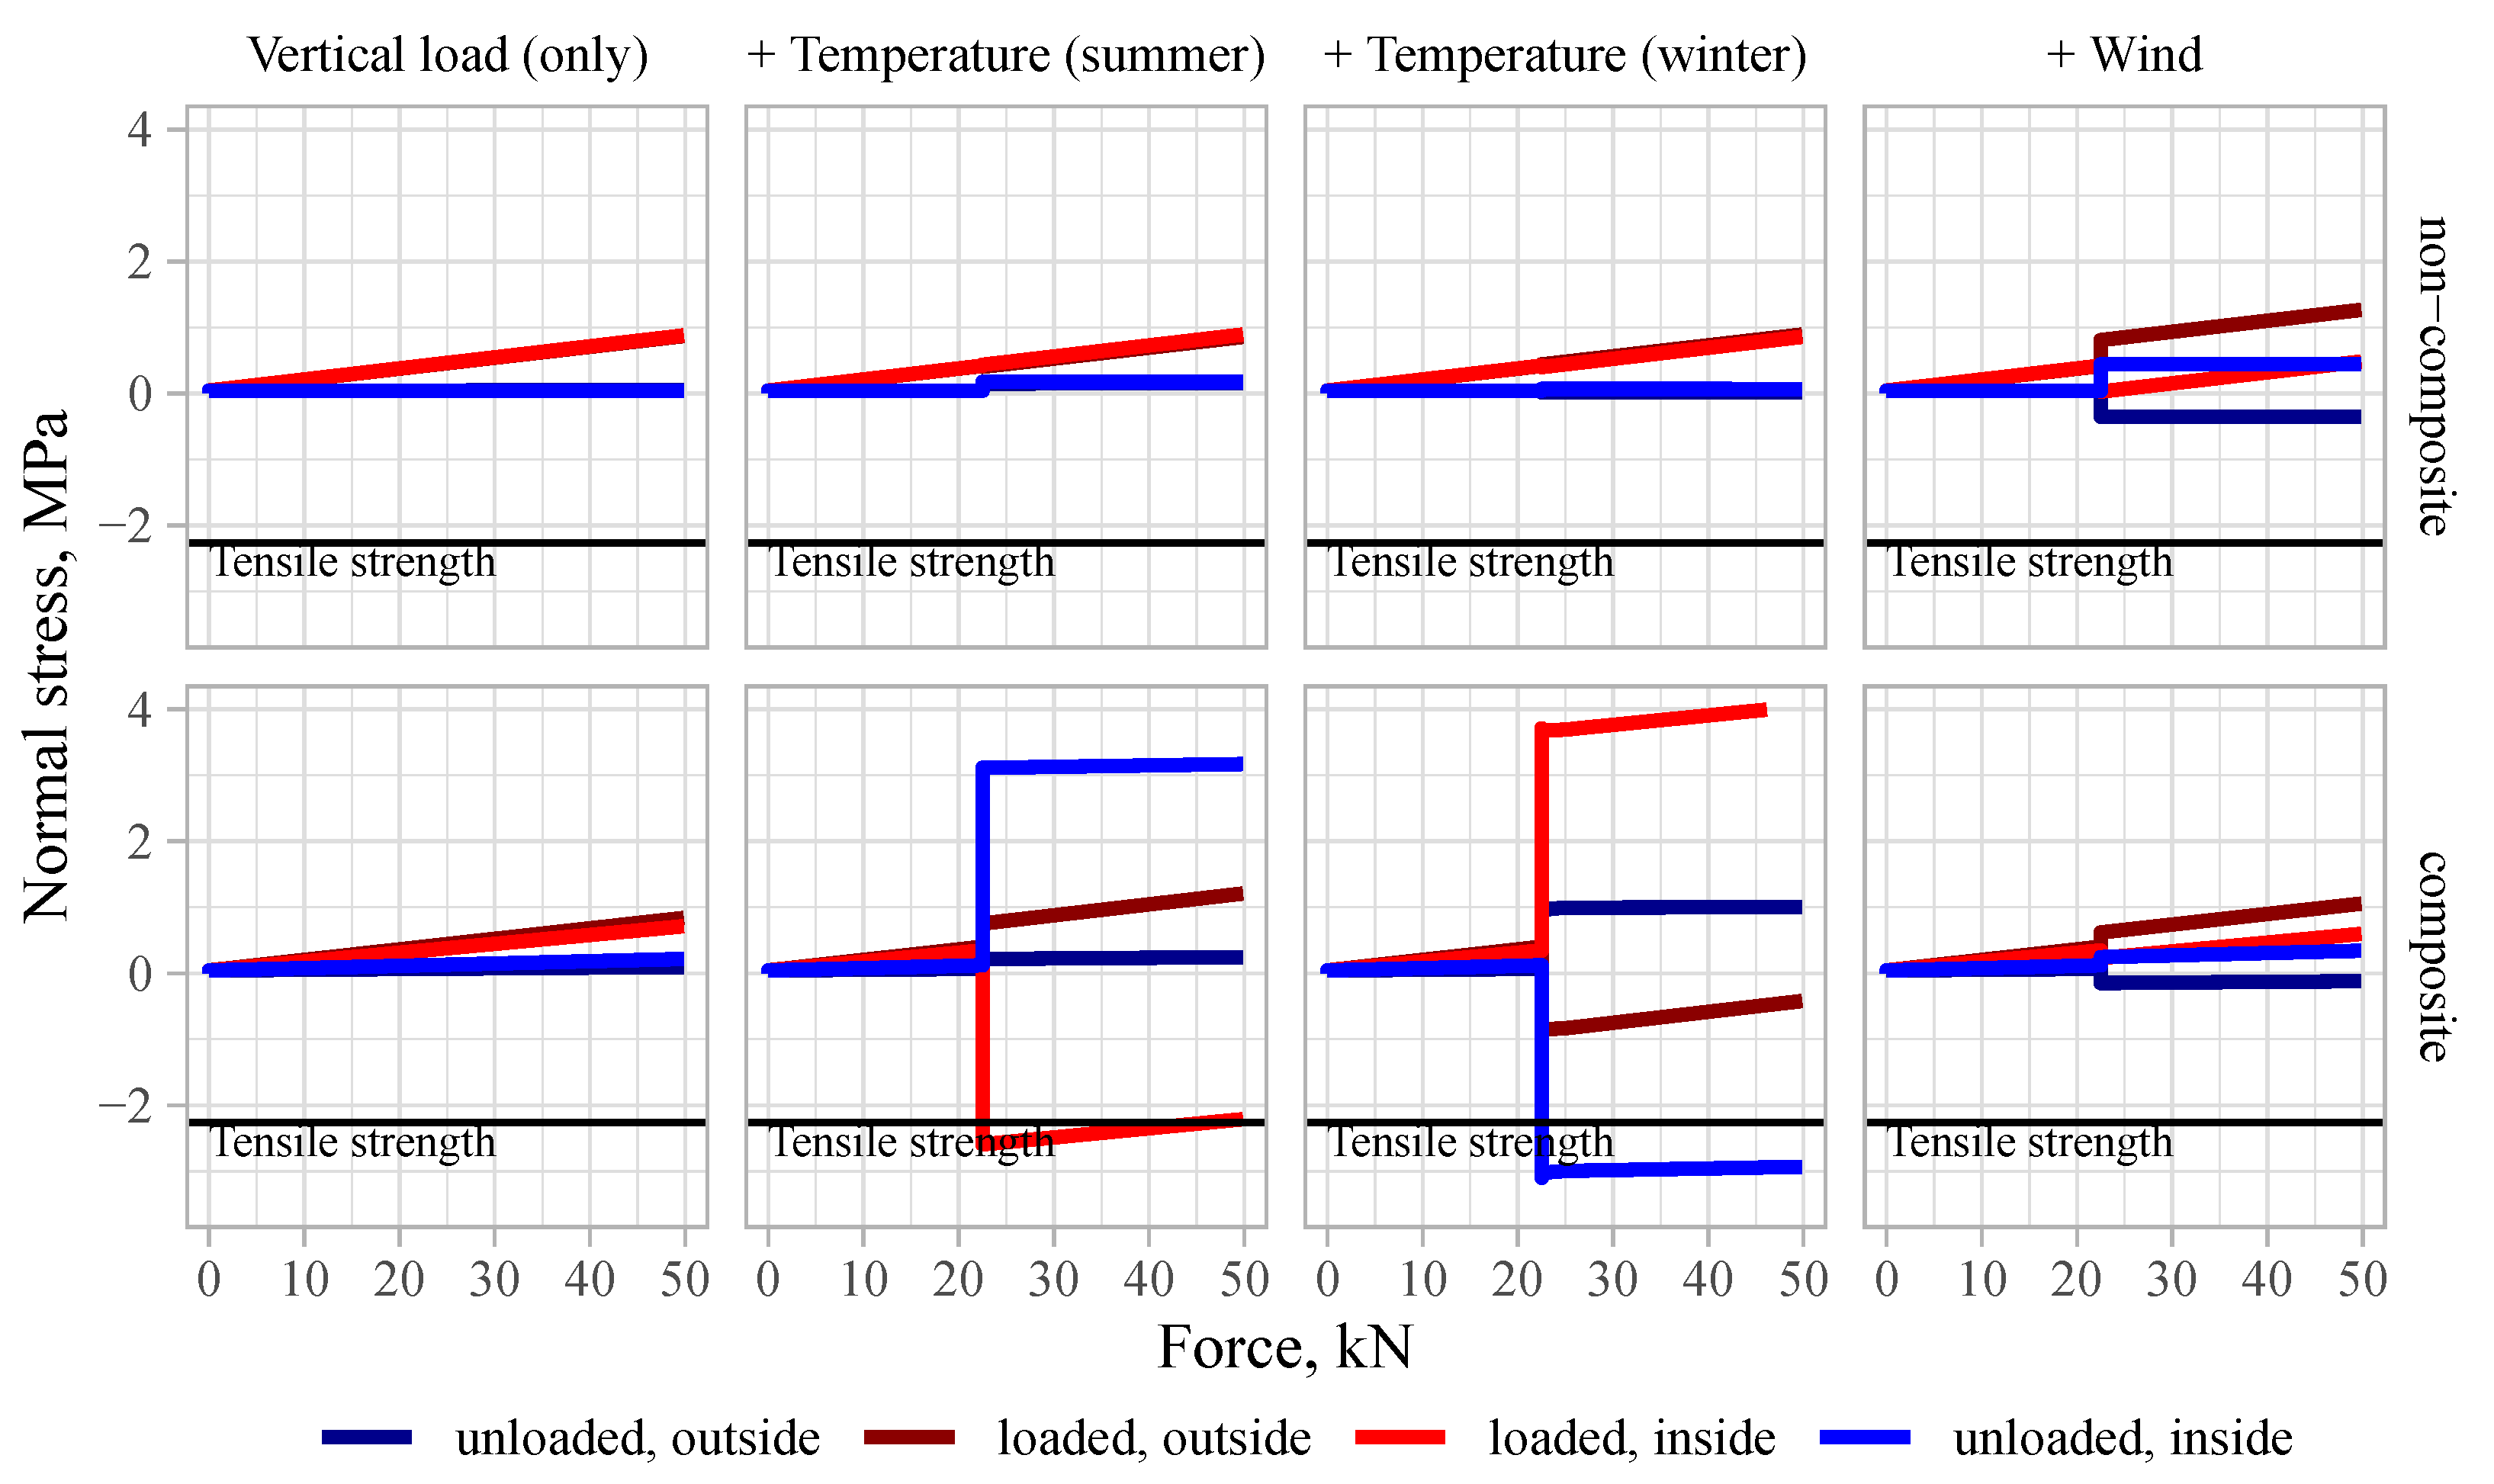
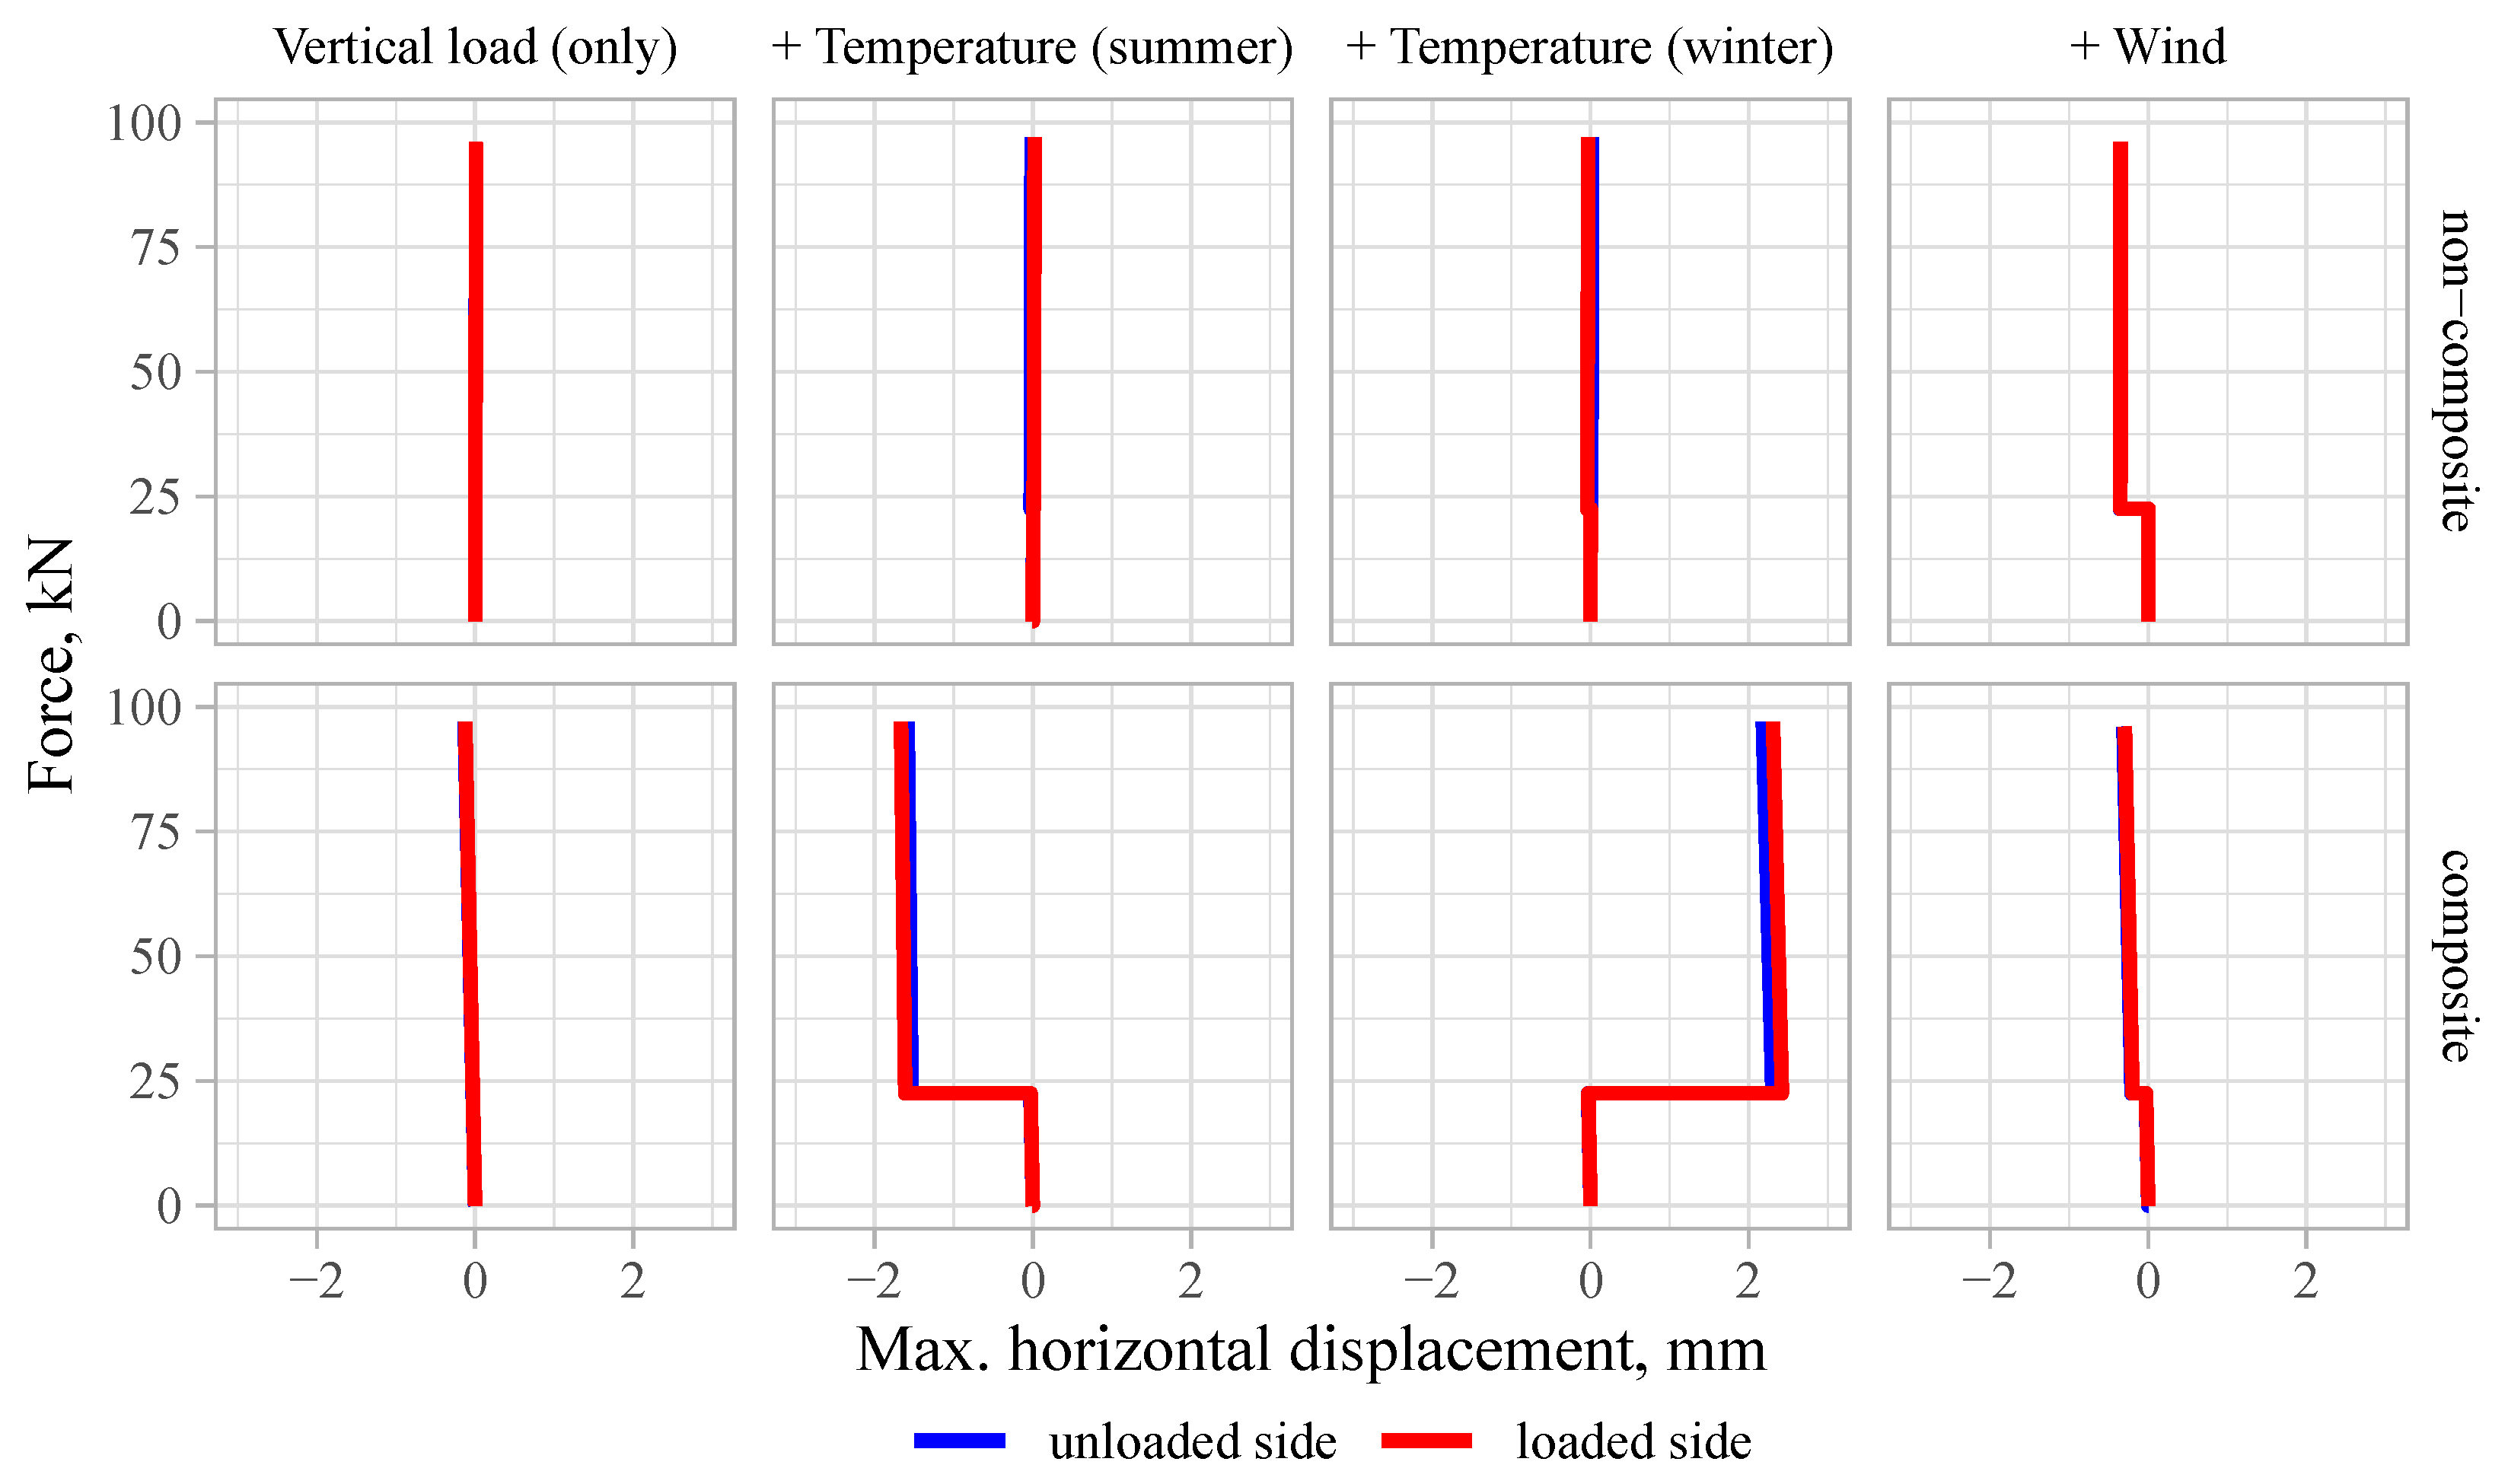
4.2. Composite Action

Composite action is one of the characteristics of SWs that is evaluated by most relevant studies. In the case of structural SWs with thin wythes, mostly partial composite action is obtained [9,15,23]. The degree of composite action strongly depends on the stiffness and number of shear connectors [7,8,11,23].
Composite action between two outer layers is important if long panels with thin wythes are loaded with lateral loads, e.g., wind. The composite action can also increase load-bearing capacity under compression [6]. However, if temperature loads are considered, the composite action is unfavourable. The current numerical analysis shows that the loading conditions of single story buildings do not require maximum capacity of the panel either in compression or in bending. In fact, the benefits gained from using non-composite sections, such as lower tensile stresses under temperature loads, simpler manufacturing, and increased sound reduction, seem to be more important in the case of low-rise buildings.
Even if the composite action is not achieved in bending, it is suggested here that the connection between outer layers of the SW prevents the loaded wythe from buckling under compression. The buckling load of a single wythe ( F c r ), if calculated according to Euler’s Formula (6), is very small:
F c r = π 2 E I l 2 = 9.87 × 30300 × 1000 × 60 2 12 · 3500 2 = 440 kN
If a fully composite cross-section is assumed, F c r = 32,300 kN. The nonlinear FEM analysis showed that the loaded wythe could take loads much higher than the buckling load of a single layer.
The loaded wythe is connected to the unloaded wythe through horizontal connectors, which can be considered as horizontal spring supports. As the unloaded wythe takes a very low level of compressive stresses, the buckling load is not reached in it; thus, it can act as a flexible support for the loaded wythe. Therefore, when the stability of the loaded wythe is evaluated, the effect of flexibility of the adjacent member should be included in the analysis [46].
The positive effect of the adjacent panel was also approved by experimental tests performed by other authors. For instance, in their investigation of SW panels made of 75 mm thick geopolymer concrete wythes, Kumar et al. [8] found that 3.5 m long walls failed due to crushing of the section. Only those slender specimens subjected to large load eccentricities had stability failure followed by the crushing of concrete.

4.3. Thermal and Sound Reduction Performance

To improve thermal performance, non-metallic connectors are suggested. A considerably lower U-value can be achieved this way [26]. Different shapes of fibre reinforced polymer (FRP) connectors have been suggested and studied [3,8,9,15,47,48]. However, some studies show that structural performance in a fire can decrease significantly if FRP connectors are used. Early buckling of the loaded wythe may occur due to progressive failure of the FRP connectors [24,49]. This reveals that fire design has a very important role in the analysis of thin-layer SW panels if non-metallic connectors are considered.
A number of studies have been carried out with the aim of reducing the overall thickness of SW panels, which would result in space, weight and material savings and reduced environmental impact. Two main aspects are considered in these studies—thermal and structural performance [4]. The current study reveals that requirements for sound insulation can be the main limiting factor if the minimum thickness of a SW is being defined. Ignoring acoustic performance can result in misleading conclusions.

5. Conclusions

In this study, the performance of thin-layer steel-fibre-reinforced concrete (SFRC) sandwich walls (SWs) in northern climatic conditions and according to European and Latvian standards was analysed. The structural performance in cases of composite and non-composite SW was compared. The influences of the requirements for the thermal and sound insulation on the composition of the cross-section were evaluated. The following main conclusions from this study can be drawn:
  • Short fibres can substitute for conventional reinforcement mesh in SW panels and maintain a high load-bearing capacity, even with the increased distance between wythes resulting from the required thickness of thermal insulation.
  • In the case of a family house, the core layer of the exterior SW must be at least 120 or 200 mm if polyurethane (PUR) or expended polystyrene (EPS) is used, respectively.
  • The theoretical load-bearing capacity estimated by nonlinear finite element analysis exceeds the design loads significantly—by up to 100 times.
  • An SW with a non-composite cross-section exhibited the same load-bearing capacity as the ones with a composite cross-section, reaching 55–77% of the load-bearing capacity of the loaded wythe cross-section.
  • An SW with a fully composite cross-section can have unfavourable effects in cases of extreme temperature loads, in which high tensile stresses are developed.
  • The thermal bridge analysis showed that the temperature distributions at the top and bottom of the wall are satisfactory; however, use of steel connectors resulted in possible condensation of the surface of the SW.
  • The sound insulation properties of the analysed thin-layer SW satisfy the requirements set by the Latvian Building Regulations if maximum admissible environmental noise levels are not exceeded.
  • In cases of higher environmental noise levels, the requirements for sound insulation can lead to SWs needing thicker wythes. A positive effect can be achieved also by reducing the amount of connectors and using wythes with different thicknesses.
  • The thickness of the thermal insulation layer does not have any noticeable effect on the sound reduction of the SW due to its low density.
This study is part of an ongoing research project. In the next step, experimental investigation of structural and sound reduction performance will be carried out. One of the aspects that needs to be added to the further evaluation of thin-layer SW is fire resistance.

Author Contributions

Conceptualisation, U.S., K.K. and R.B.; methodology, U.S., K.K., A.V. and R.B.; validation, U.S., K.K., A.V. and R.B.; investigation, U.S., K.K., A.V. and R.B.; resources, U.S., K.K., A.V. and R.B.; data curation, U.S.; writing—original draft preparation, U.S., A.V. and R.B.; writing—review and editing, U.S.; visualisation, U.S., K.K. and A.V.; supervision, U.S.; project administration, U.S.; funding acquisition, U.S. All authors have read and agreed to the published version of the manuscript.

Funding

The research received funding from the European Regional Development Fund, Post-doctoral Research Support Program (project No.1.1.1.2/16/I/001) Research application “Efficiency of fibre reinforced cement composites in structural walls” (No. 1.1.1.2./VIAA/3/19/487).

Institutional Review Board Statement

Not applicable.

Informed Consent Statement

Not applicable.

Data Availability Statement

Publicly available datasets were analysed in this study. This data can be found: https://www.llu.lv/lv/projektu_resursi/6274 (accessed on 23 December 2022).

Conflicts of Interest

The funders had no role in the design of the study; in the collection, analyses or interpretation of data; in the writing of the manuscript; or in the decision to publish the results.

Abbreviations

The following abbreviations are used in this manuscript:
CMODCrack mouth opening distance
EPSExpended polystyrene
FRPFibre reinforced polymer
PURPolyurethane
SFRCSteel-fibre-reinforced concrete
SWSandwich wall

References

  1. Losch, E.D.; Hynes, P.W.; Andrews, R., Jr.; Browning, R.; Cardone, P.; Devalapura, R.; Donahey, R.; Freedman, S.; Gleich, H.A.; Goettsche, G.; et al. State of the art of precast/prestressed concrete sandwich wall panels. PCI J. 2011, 56, 131–176. [Google Scholar]
  2. Ordóñez, D.; Fernández, A.; Cladera, B. Prefabrication for Affordable Housing; Fib Bulletin No. 60; Fib: Lausanne, Switzerland, 2011; p. 123. [Google Scholar]
  3. Mugahed Amran, Y.; El-Zeadani, M.; Huei Lee, Y.; Yong Lee, Y.; Murali, G.; Feduik, R. Design innovation, efficiency and applications of structural insulated panels: A review. Structures 2020, 27, 1358–1379. [Google Scholar] [CrossRef]
  4. O’Hegarty, R.; Kinnane, O. Review of precast concrete sandwich panels and their innovations. Constr. Build. Mater. 2020, 233, 117145. [Google Scholar] [CrossRef]
  5. Tawil, H.; Tan, C.G.; Sulong, N.H.R.; Nazri, F.M.; Sherif, M.M.; El-Shafie, A. Mechanical and Thermal Properties of Composite Precast Concrete Sandwich Panels: A Review. Buildings 2022, 12, 1429. [Google Scholar] [CrossRef]
  6. Serpilli, M.; Clementi, F.; Lenci, S. An experimental and numerical study on the in-plane axial and shear behavior of sprayed in-situ concrete sandwich panels. Eng. Struct. 2021, 232, 111814. [Google Scholar] [CrossRef]
  7. Benayoune, A.; Samad, A.A.; Trikha, D.; Ali, A.A.; Ellinna, S. Flexural behaviour of pre-cast concrete sandwich composite panel – Experimental and theoretical investigations. Constr. Build. Mater. 2008, 22, 580–592. [Google Scholar] [CrossRef]
  8. Kumar, S.; Chen, B.; Xu, Y.; Dai, J.G. Axial-flexural behavior of FRP grid-reinforced geopolymer concrete sandwich wall panels enabled with FRP connectors. J. Build. Eng. 2022, 47, 103907. [Google Scholar] [CrossRef]
  9. O’Hegarty, R.; Kinnane, O.; Grimes, M.; Newell, J.; Clifford, M.; West, R. Development of thin precast concrete sandwich panels: Challenges and outcomes. Constr. Build. Mater. 2021, 267, 120981. [Google Scholar] [CrossRef]
  10. Mercedes, L.; Bernat-Maso, E.; Gil, L. Bending and compression performance of full-scale sandwich panels of hemp fabric reinforced cementitious matrix. Eng. Struct. 2023, 275, 115241. [Google Scholar] [CrossRef]
  11. Shin, D.H.; Kim, H.J. Composite effects of shear connectors used for lightweight-foamed-concrete sandwich wall panels. J. Build. Eng. 2020, 29, 101108. [Google Scholar] [CrossRef]
  12. Sylaj, V.; Fam, A. UHPC sandwich panels with GFRP shear connectors tested under combined bending and axial loads. Eng. Struct. 2021, 248, 113287. [Google Scholar] [CrossRef]
  13. O’Hegarty, R.; West, R.; Reilly, A.; Kinnane, O. Composite behaviour of fibre-reinforced concrete sandwich panels with FRP shear connectors. Eng. Struct. 2019, 198, 109475. [Google Scholar] [CrossRef]
  14. Gara, F.; Ragni, L.; Roia, D.; Dezi, L. Experimental tests and numerical modelling of wall sandwich panels. Eng. Struct. 2012, 37, 193–204. [Google Scholar] [CrossRef]
  15. Lameiras, R.; Barros, J.A.; Valente, I.B.; Poletti, E.; Azevedo, M.; Azenha, M. Seismic behaviour of precast sandwich wall panels of steel fibre reinforced concrete layers and fibre reinforced polymer connectors. Eng. Struct. 2021, 237, 112149. [Google Scholar] [CrossRef]
  16. Graziani, L.; Quagliarini, E.; D’Orazio, M.; Lenci, S.; Scalbi, A. A More Sustainable Way for Producing RC Sandwich Panels On-Site and in Developing Countries. Sustainability 2017, 9, 472. [Google Scholar] [CrossRef]
  17. Choi, I.; Kim, J.; Kim, H.R. Composite Behavior of Insulated Concrete Sandwich Wall Panels Subjected to Wind Pressure and Suction. Materials 2015, 8, 1264–1282. [Google Scholar] [CrossRef]
  18. Choi, I.; Kim, J.; Kim, H.R. Composite Behavior of a Novel Insulated Concrete Sandwich Wall Panel Reinforced with GFRP Shear Grids: Effects of Insulation Types. Materials 2015, 8, 899–913. [Google Scholar] [CrossRef]
  19. Barros, J.; Pereira, E.; Santos, S. Lightweight Panels of Steel Fiber-Reinforced Self-Compacting Concrete. J. Mater. Civ. Eng. 2007, 19, 295–304. [Google Scholar]
  20. Lameiras, R.; Barros, J.; Valente, I.B.; Azenha, M. Development of sandwich panels combining fibre reinforced concrete layers and fibre reinforced polymer connectors. Part I: Conception and pull-out tests. Compos. Struct. 2013, 105, 446–459. [Google Scholar] [CrossRef]
  21. Lameiras, R.M. Sandwich Structural Panels Comprising Thin-Walled SFRSCC and GFRP Connectors: From Material Features to Structural Behaviour. Ph.D. Thesis, Universidade do Minho, Guimeraes, Portugal, 2015. [Google Scholar]
  22. Thomas, D.; Gregory, L. Flexural Behavior of Composite Precast Concrete Sandwich Panels With Continuous Truss Connectors. PCI J. 1994, 39, 112–121. [Google Scholar]
  23. Tomlinson, D.G.; Teixeira, N. Behaviour of Partially Composite Precast Concrete Sandwich Panels under Flexural and Axial Loads. Ph.D. Thesis, Queen’s University, Kingston, ON, Canada, 2015. [Google Scholar]
  24. Chen, J.; Hamed, E.; Gilbert, R.I. Structural performance of concrete sandwich panels under fire. Fire Saf. J. 2021, 121, 103293. [Google Scholar] [CrossRef]
  25. PCI IH Committee. PCI Handbook Precast Prestressed Concrete, 6th ed.; PCI: Chicago, IL, USA, 2004. [Google Scholar]
  26. Woltman, G.; Noel, M.; Fam, A. Experimental and numerical investigations of thermal properties of insulated concrete sandwich panels with fiberglass shear connectors. Energy Build. 2017, 145, 22–31. [Google Scholar] [CrossRef]
  27. Künzel, H. WUFI Pro. 2022. Available online: https://wufi.de/en/software/what-is-wufi/ (accessed on 27 December 2022).
  28. EN 15026:2007; Hygrothermal Performance of Building Components and Building Elements—Assessment of Moisture Transfer by Numerical Simulation. CEN: Brussels, Belgium, 2007.
  29. Infomind Ltd. Flixo. 2022. Available online: https://www.flixo.com/ (accessed on 28 December 2022).
  30. EN ISO 10211:2017; Thermal Bridges in Building Construction—Heat Flows and Surface Temperatures—Detailed Calculations. CEN: Brussels, Belgium, 2017.
  31. EN ISO 10077-2:2017; Thermal Performance of Windows, Doors and Shutters—Calculation of Thermal Transmittance—Part 2: Numerical Method for Frames. CEN: Brussels, Belgium, 2017.
  32. LBN 002-19; Regulations Regarding the Latvian Construction Standard LBN 002-19, Thermotechnics of Building Envelopes. Regulation No. 280; Cabinet of Ministers: Riga, Latvia, 2019.
  33. Marshall Day Acoustics. Sound Insulation Prediction Program INSUL 9.0, User Manual. 2017. Available online: https://www.insul.co.nz/media/30049/Insul-Manual-2017-word-version.pdf (accessed on 30 December 2022).
  34. Marshall Day Acoustics. Sound Insulation Prediction Program INSUL 9.0. 2022. Available online: https://www.insul.co.nz/ (accessed on 30 December 2022).
  35. Long, M. Architectural Acoustics; Academic Press: Boston, MA, USA, 2006. [Google Scholar]
  36. LBN 016-15; Regulations Regarding the Latvian Construction Standard LBN 016-15, Building Acoustic. Latvian Construction Standard LBN 016-15. Cabinet of Ministers: Riga, Latvia, 2015.
  37. Regulations of the Cabinet of Ministers. Noise Assessment and Management Procedure; Regulation No. 16; Cabinet of Ministers: Riga, Latvia, 2014. [Google Scholar]
  38. Eurocode 1; Eurocode 1: Actions on Structures—Part 1-5: General Actions— Thermal Actions. European Standard LVS EN 579 1991-1-5. CEN: Brussels, Belgium, 2004.
  39. Eurocode 1/NA:2014; Eurocode 1: Actions on Structures—Part 1-5: General Actions—Thermal Actions—National Annex. Latvian Standard LVS EN 1991-1-5:2004/NA:2014. LVS: Riga, Latvia, 2014.
  40. Červenka, V.; Červenka, J. ATENA Science Software. 2022. Available online: www.cervenka.cz (accessed on 2 January 2023).
  41. Federation International du Beton. Fib Model Code for Concrete Structures 2010; Ernst & Sohn GmbH & Co., KG.: Berlin, Germany, 2013; ISBN 9783433030615. [Google Scholar]
  42. European Standard EN 14651:2005; Test Method for Metallic Fibre Concrete—Measuring the Flexural Tensile Strength (Limit of Proportionality (LOP), Residual). CEN: Brussels, Belgium, 2007.
  43. Miskinis, K.; Dikavicius, V.; Buska, A.; Banionis, K. Influence of EPS, mineral wool and plaster layers on sound and thermal insulation of a wall: A case study. Appl. Acoust. 2018, 137, 62–68. [Google Scholar] [CrossRef]
  44. Wang, J.; Du, B.; Huang, Y. Experimental study on airborne sound insulation performance of lightweight double leaf panels. Appl. Acoust. 2022, 197, 108907. [Google Scholar] [CrossRef]
  45. Alchaar, A.; Abed, F. Finite element analysis of a thin-shell concrete sandwich panel under eccentric loading. J. Build. Eng. 2020, 32, 101804. [Google Scholar] [CrossRef]
  46. Eurocode 2; Eurocode 2: Design of Concrete Structures—Part 1-1: General Rules and Rules for Buildings. European Standard EN 1992-1-1. CEN: Brussels, Belgium, 2004.
  47. Flansbjer, M.; Williams Portal, N.; Vennetti, D.; Mueller, U. Composite Behaviour of Textile Reinforced Reactive Powder Concrete Sandwich Façade Elements. Int. J. Concr. Struct. Mater. 2018, 12, 71. [Google Scholar] [CrossRef]
  48. Chen, D.; Li, K.; Yuan, Z.; Cheng, B.; Kang, X. Shear Behavior of FRP Connectors in Precast Sandwich Insulation Wall Panels. Buildings 2022, 12, 1095. [Google Scholar] [CrossRef]
  49. Haffke, M.; Pahn, M.; Thiele, C.; Grzesiak, S. Experimental Investigation of Concrete Sandwich Walls with Glass-Fiber-Composite Connectors Exposed to Fire and Mechanical Loading. Appl. Sci. 2022, 12, 3872. [Google Scholar] [CrossRef]
Figure 1. Details of the top of the wall: (a) without a connector and (b) with a connector between the wall and slab; 1—insulated wall panel, 2—insulated roof slab, 3—increased thickness of inner wythe, 4—steel connector.
Fibers 11 00019 g001
Figure 2. Dimensions of the foundation, temperatures and arrangements of external insulation considered in the present study: (a) no additional external insulation, (b) additional vertical insulation and (c) additional horizontal insulation.
Fibers 11 00019 g002
Figure 3. Load combinations in a transient design situation: (a) Wall in a horizontal position in isometric view. (b) View A and (c) view B of the wall. The downward arrows represent load induced due to adhesion and self-weight.
Fibers 11 00019 g003
Figure 4. Load combinations in persistent design situation: (a) centric vertical loading for internal walls; (b) eccentric vertical loading for external walls; (c) eccentric loading with wind suction load; (d) eccentric loading with temperature load in summer and (e) in winter.
Fibers 11 00019 g004
Figure 5. Tension function of SFRC and its numerical values used in the analysis.
Fibers 11 00019 g005
Figure 6. Finite element model used in nonlinear structural analysis: 1 and 2—monitoring points for vertical displacement and force reaction; 3—monitoring points for lateral displacements; 4—stresses and strains in y direction; H—total height of the wall.
Fibers 11 00019 g006
Figure 7. Models of sandwich walls (SWs) used in the structural analysis: (a) composite and (b) non-composite SWs under centric loading; (c) composite and (d) non-composite SW under eccentric loading; and (e) composite and (f) non-composite SW in demoulding stage; see legends in Figure 6.
Fibers 11 00019 g007
Figure 8. Temperature distribution in the top corner of the wall: (a) without steel connector, (b) with steel connector. Colour palette: from −10 C (violet) to 20 C (red).
Fibers 11 00019 g008
Figure 9. Temperature distribution in the wall and foundation in different arrangements of external insulation layer: (a) no external insulation, (b) additional vertical insulation and (c) additional horizontal insulation.
Fibers 11 00019 g009
Figure 10. Sound reduction in the case of an SW with different arrangements of connectors (spacings of 200 × 200 mm, 400 × 400 mm and no connectors) and different wall compositions: with EPS (thickness 200 mm) and PUR (thickness 120 mm).
Fibers 11 00019 g010
Figure 11. Sound reduction influenced by different thicknesses of SFRC wythes.
Fibers 11 00019 g011
Figure 12. Comparison of the sound insulation index and the required minimum values for each SW panel analysed in this study.
Fibers 11 00019 g012
Figure 13. Maximum stresses in top and bottom SFRC layers during the demoulding process.
Fibers 11 00019 g013
Figure 14. Theoretical deflection of the wall during demoulding related to the pseudo lifting force.
Fibers 11 00019 g014
Figure 15. Load–displacement behaviour of exterior walls until failure in different load combinations.
Fibers 11 00019 g015
Figure 16. Load–displacement behaviour of the inner wall until failure.
Fibers 11 00019 g016
Figure 17. Stress on the surface of the wythes at the middle of the wall height-wise in the case of external walls. The compressive stresses are plotted positively.
Fibers 11 00019 g017
Figure 18. Stress on the surfaces of the wythes half-way up the wall in the range of loads from 0 to 50 kN.
Fibers 11 00019 g018
Figure 19. Lateral displacement of the wythes under different load combinations.
Fibers 11 00019 g019
Figure 20. Lateral displacement of the wythes under different load combinations in the range of design loads.
Fibers 11 00019 g020
Table 1. Material properties used in thermal analysis.
PropertyUnitConcreteEPSPUR
Densitykg/m 3 24003040
Porositym 3 /m 3 0.180.950.95
Specific Heat Capacity (dry)J/(kg K)85015001500
Thermal Conductivity (dry, 10 C)W/(m K)2.20.040.025
Water Vapour Diffusion Resistance Factor-1805050
Moisture-dep. Thermal Cond. Supplement%/M.-%8--
Temp-dep. Thermal Cond. SupplementW/(m K 2 )0.00020.00020.0002
Table 2. Thermal properties of the wall’s cross-section.
Type 1Type 2
Compositionconcrete–EPS–concreteconcrete–PUR–concrete
Thickness (mm)60-200-6060-120-60
Total thickness (mm)320240
R-value (m 2 K/W)5.044.81
U-value (W/(m 2 K))0.1910.2
Table 3. Wall compositions used in sound insulation analysis.
LabelCross-Section CompositionInsulationConnector Spacing, mm
EPS160/200/60EPSno connectors
EPS260/200/60EPS400 × 400
EPS360/200/60EPS200 × 200
PUR160/120/60PURno connectors
PUR260/120/60PUR400 × 400
PUR360/120/60PUR200 × 200
PUR475/120/75PUR200 × 200
PUR545/120/45PUR200 × 200
PUR660/120/75PUR200 × 200
PUR745/120/60PUR200 × 200
Table 4. Design values of loads applied to the wall in a persistent design situation.
Load TypeLoad Design Value, kN/m 2
Dead load of roof slab5.85
Snow load1.50
Wind suction load1.00
Table 5. Loading intervals and steps used in the FEM analysis.
Loading SituationIntervals and Number of Steps
BCSWFWT3FFailure
Centric110200--2001000
Eccentric110200--2001000
Eccentric + wind11020020-2001000
Eccentric + temperature (winter)110200-302001000
Eccentric + temperature (summer)110200-302001000
Demoulding(vertical section)1-200--2001000
Demoulding(horizontal section)1-200--2001000
Disclaimer/Publisher’s Note: The statements, opinions and data contained in all publications are solely those of the individual author(s) and contributor(s) and not of MDPI and/or the editor(s). MDPI and/or the editor(s) disclaim responsibility for any injury to people or property resulting from any ideas, methods, instructions or products referred to in the content.

