Article

Experimental Investigation of the Structural Performance of Existing and RC or CFRP Jacket-Strengthened Prestressed Cylindrical Concrete Pipes (PCCP)—Part A

by
George Manos
1,*,
Konstantinos Katakalos
1,
Vassilios Soulis
2,
Lazaros Melidis
1 and
Vassilios Bardakis
3
1
Department of Civil Engineering, Aristotle University of Thessaloniki, 54124 Thessaloniki, Greece
2
Athens Water Supply and Sewerage Company, EYDAP SA, 11146 Athens, Greece
3
EBLECTON Consultant Company, 26504 Patra, Greece
*
Author to whom correspondence should be addressed.
Fibers 2022, 10(9), 71; https://doi.org/10.3390/fib10090071
Submission received: 7 July 2022 / Revised: 13 August 2022 / Accepted: 22 August 2022 / Published: 24 August 2022

Abstract

:
A popular water pipe system used in many countries is one formed by prestressed cylindrical concrete pipes (PCCPs) formed by identical precast moduli joined together in situ. This technology was and still is quite popular in many water supply systems internationally. This technology was mainly selected at the time due to its cost-based comparative advantage. However, over the years, numerous incidents of structural failures have been reported for this type of pipeline, causing, in some cases, serious disruption of the water supply. This study summarizes the results of an experimental investigation on ten (10) PCCP specimens taken from an existing water pipeline with the objective of investigating their bearing capacity under either three-edge bending or internal hydraulic pressure loads. Moreover, there is a need to check the capability of specific retrofitting/strengthening schemes to upgrade this bearing capacity and thus enhance the operational period. Provided that the prestressing wires are fully active according to design specifications, the original specimen performed satisfactorily for the set internal hydraulic pressure limit of 8.5 bar. Specimens retrofitted with either internal or external CFRP or RC jacketing performed satisfactorily for internal hydraulic pressure levels well above this 8.5 bar limit. A critical factor is, as expected, the loss of prestress.

1. Introduction

Water pipes made of concrete and wrapped with prestressed steel wires placed near the external face of their tubular cross-sections have been used for quite some time in many countries. The performance of such water pipes over time is of importance, as any type of structural failure results in the disruption of their functioning and the possible loss of significant quantities of water unless such water network failure can be confronted effectively without delays. PCCP pipelines have suffered serious failure incidents over years of operation around the world. In the USA, 435 devastating ruptures in PCCPs were reported in the period from 1955 to 2007 [1]. In Mexico, a burst failure of two buried segments of the Cutzamala pipeline occurred in 2001 [2]. In a Greek city, a PCCP pipeline breakage caused a serious interruption of the normal supply of water for more than 10 days in 2018. To this end, regular inspection and maintenance of the water pipe network are of great importance. The level of prestressing of steel wire wraps in the periphery of the water pipe (PCCP) is the most important structural parameter for the structural integrity of these types of pipes. Common causes of the deterioration of these steel wire wraps are the hydrogen embrittlement of prestressing steel wires [3], the delamination of mortar coating [4] and high chloride content in the soil surrounding the pipe [5]. Defects during construction can also lead to the structural damage of the PCCP, such as (a) poor quality of mortar coating that is left unrepaired [6]; (b) joints with inadequate restraints and/or joints exposed to the corrosive environment [7]; poor bedding and a high underground water level, which can lead to cantilever settlement; (c) poor quality of prestressing wire [8,9]; and (d) low-strength concrete and inadequate design issues, such as overpressure, pressure surge and settling due to inadequate foundation design [10]. One of the most serious consequences resulting from these deteriorating agents is the partial loss of prestressing or/and the rupture of the steel wire wraps, which can either be local or spread to an extended region. Within 50 years of installation, 1 rupture and 66 failures of another type occurred for every 50 miles of PCCP pipes installed in North America, as stated by Rahman, Smith, Mielke and Keil [11]. The rate of structural failures occurring in PCCP water pipes manufactured between 1971 and 1979 has recently shown a significant increase. This was attributed to the type IV wire that was used for prestressing during that period by a particular pipe manufacturer (the manufacturing process of the wire induced longitudinal cracks and made them particularly susceptible to hydrogen embrittlement) [11]. The bearing capacity of an existing PCCP pipeline was studied, and the levels of internal pressure that could cause structural failure was investigated. For this pipeline, the relevant hydraulic analysis showed that high-pressure levels are generated near syphons or from water surge effects that can subject this particular water pipe to pressure above its bearing capacity, estimated at approximately 5.65 bars [12]. When such a pipeline is partially buried or the layer of soil on its top is relatively shallow, it cannot mobilize the favourable confinement effect produced by the surrounding soil. Moreover, such pipelines can also be subjected to unfavourable foundation settlements. Due to all these issues, the design of such pipelines was revised [13] following research efforts by many researchers (see Zarghamee et al. [14,15,16]). The means to deal with such hazards are (a) inspection procedures, (b) immediate countermeasures to confine the structural damage and minimize spreading and (c) repair procedures of the damaged parts. This study presents the results of a laboratory investigation aiming to test the effectiveness of certain repair schemes designed to be applied to existing PCCP pipelines that inspection showed to be in need of repair/strengthening. Extensive inspection and subsequent investigation usually focus on the prestressing wires of a PCCP pipeline, which are susceptible to hydrogen embrittlement; this causes the sudden, brittle fracture of the prestressing wire wraps, even though they show limited signs of corrosion or elongation. For this reason, the effect of loss of prestress and/or the breaking of prestressing wires has been the subject of research [17]. Immediate countermeasures included specific interventions so that the aqueduct could operate safely at the required internal pressure. In the case being investigated, the operating pressure plus the surge pressure reached an amplitude below 5.65 bar. It was proposed that the actual internal pressure bearing capacity of the parts of the investigated PCCP pipeline be determined by testing, which is one of the objectives of the current study, together with an additional objective, that is, to design specific repair/strengthening schemes that are feasible and can easily be applied and to apply them to the same parts of this existing PCCP pipeline to also demonstrate by testing that they are capable of upgrading the bearing capacity of this pipeline to an acceptable level. To this end, past research initiated by the “Water Research Foundation” investigated the capabilities and requirements of the application of CFRP liners for the renewal or strengthening of distressed PCCPs. In this framework, Zarghamee, Engindeniz and Wang [18] studied the behaviour of defective PCCP by employing three-edge bearing or hydrostatic pressure tests. The defects were in the form of broken prestressing wires or cracked concrete, and they utilized retrofitting schemes employing CFRP jacketing. They investigated the various failure modes, which included the debonding of the CFRP jacket from the underlining concrete core due to the shear bond limit state, which has the additional implication that it does not prohibit leakage. Such limit states were studied in order to revise the relevant retrofitting design accordingly. Lee and Karbhari [19] employed one 2.44 m diameter PCCP retrofitted with a CFRP jacket and tested it under hydrostatic pressure. They simulated the loss of prestress by cutting prestressing wires over 25% of the pipe length (exact location not reported) without removing the outer core or the steel cylinder. For hydrostatic pressure equal to 2.0 MPa, water leakage was observed through the seals between the PCCP ends and the reinforced concrete end caps. At this pressure level, the CFRP jacket developed axial strains of the order of 25% of their ultimate strain capacity, thus demonstrating that the main failure mode was linked to the observed leakage and not to the axial strength of the CFRP jacket. The same authors (Lee and Karbhari [19]) also performed a three-edge bearing test on a 0.30 m long section of a 2.44 m diameter PCCP (ECP) with all prestressing wires removed. The three-edge bearing (3EB) test is a destructive test, which is adopted by many standards in order to evaluate the crack load and ultimate bearing load of a PCCP pipe (e.g., ASTM C-497 standard). Wong and Nehdi [20] published a review of the existing three-edge tests adopted by different standards on RCP (reinforced concrete pipes). Different codes provide different definitions of crack load and crack limit; however, a common definition is adopted for the ultimate carrying load. The same authors (Wong and Nehdi [20]) also published a review of the existing hydrostatic tests for reinforced concrete pipes adopted by different standards worldwide. A number of researchers have performed extensive experimental sequences by subjecting PCCP specimens of various dimensions to internal hydraulic pressure tests ([21,22,23,24,25]). Cheng et al. [21] tested PCCPs under water pressure with a design pressure of 1.12 MPa. Laboratory measurements exhibited a service limit of 1.6 times greater where concrete tensile cracking was observed and a maximum pressure almost double the design pressure accompanied by the steel cylinder failure. Following this, the effect of the prestress loss was examined [22]. Two pipe parts were loaded with a constant pressure equal to the working pressure. Prestressing wires were cut, and concrete cracks with a width of 2.2 mm were seen. Finally, the specimens were unloaded and reinforced with new external prestressed bars and loaded again. The width of the cracks was reduced to 0.1 mm. Zhai et al. [23] carried out tests on a full-scale pipe under internal water pressure. Three cross-sections were chosen to record their response: one as-built, one with manually broken wires and one with broken wires that was repaired with the external application of FRP sheets. The non-linear response of the damaged section was shown to occur at a pressure equal to 0.5 MPa; large deformations of the steel mantle occurred at a pressure of 0.9 MPa, followed by a pressure drop. No cracks were visible in the virgin or repaired section. Zhang et al. [25] tested PCCP specimens strengthened with external RC jackets under internal pressure, external load and combined load. All tested specimens satisfied the serviceability limits and exhibited ductile behaviour. In all cases, the non-linear response was initiated by concrete cracking at the outer face. Another important aspect of such investigations is the methodology of measuring the pipes and their component strains. Cheng et al. [21,22] and Xu et al. [26] applied novel sensing systems to record the deformation of PCCPs. These systems employed optical fibre sensing technology and distributed fibre optic sensors. In all of these tests, the performance of pipes with either fully functional prestressing wires or prestressing wires with defects was investigated.

2. Methodology—Description of Specimens

Laboratory catastrophic tests were carried out by subjecting a number of specimens to either 3EB or internal hydraulic pressure loading with the following main objectives: (a) to assess the bearing capacity of the existing pipeline and (b) to assess the degree of bearing capacity upgrade that can be achieved by three specific repair/strengthening schemes. For this purpose, ten (10) specimens of 1 m length were cut from 6 m long pipeline modules stored in situ near the actual pipeline. Thus, they were subjected to the same environmental conditions for the same period as the pipeline itself. The selected pieces did not have any visible structural defects. All tested specimens, together with all of the parts comprising the existing pipeline, were manufactured 50 years ago (1972) in accordance with AWWA C301-58 (Doanides [27]), as was the case for similar pipelines built in that period. Currently, the design and manufacturing of PCCP are carried out according to AWWA guidelines introduced in 1992 with the title “AWWA C304 Design of Prestressed Concrete Cylinder Pipe (AWWA C304)”. This framework underlines the need to quantify the bearing capacity of the existing pipeline and that of the pipeline after the application of three specific reinforcing schemes. This was conducted in order to make decisions on the structural upgrade of the parts of the pipeline in situ instead of replacing them with new parts. Two of the selected reinforcing schemes involved applying carbon fibre-reinforced polymer (CFRP) jackets, either internally or externally, to the pipe. The third reinforcing scheme consisted of applying an external reinforced concrete (RC) jacket instead. These three reinforcing schemes, together with the original pipeline with either fully active prestressing or with all prestressing wires removed, formed five (5) different types of specimens, which were investigated. This was carried out by subjecting each type to the following two different laboratory loading conditions, as was implemented in similar studies mentioned previously:
(a)
Three-edge bearing test (3EB) according to Government Gazette 253/Β/1984 [28] and the ASTM C-497 standard.
(b)
Internal hydraulic pressure with a gradually increasing amplitude up to an internal pressure limit unless a prior limit-state condition was reached. For this purpose, a special loading set-up was devised, aiming to apply internal hydraulic pressure up to the limit amplitude specified by the client. This internal pressure amplitude limit, approximately equal to 8.5 bar, represents pressure levels due to hydraulic gradient and water surge conditions, which leads to internal pressure requirements that are larger than the hydrostatic pressure amplitude under normal operating conditions (Government Gazette 253/Β/1984 [28]).
These two loading types combined with the previously mentioned five types of specimens resulted in the ten specimens listed in Table 1. These specimens were prepared in situ (Figure 1) according to specified technical details and were transported to the Laboratory of Strength of Materials and Structures of Aristotle University for testing.

Structural Details and Materials of Tested Specimen

Figure 2 depicts a typical cross-section of the original pipe with a fully active pre-stressed wall with a total thickness equal to 156 mm. From the internal face to the outside layer of the concrete core, where the prestressing wires are placed, the concrete thickness is equal to 141.5 mm (including the steel membrane). Within this concrete thickness, a thin steel cylindrical membrane is placed at a distance equal to 90 mm from the internal face of the pipe. The thickness of this membrane is equal to 1.5 mm, as measured in the laboratory. Steel coupons of this membrane were tested in axial tension. They were taken either from the pipe before any loading (virgin) or from four different locations of the specimen after it had been subjected to internal pressure in the laboratory. The obtained axial tensile stress–strain response is depicted in Figure 3. From the virgin coupon, the ultimate tensile stress was equal to 385.3 MPa, and the yield stress was equal to 296.7 MPa. The coupons taken from the membrane of the pipe specimen that was loaded by internal pressure demonstrated a lower capacity to deform than the virgin specimen. This indicates that the steel membrane at these locations exceeded the yield during testing. Moreover, the tensile behaviours exhibited by these four strained coupons were different from each other, which also indicates that despite the axisymmetric nature of the loading, the plastification of the steel membrane is not axisymmetric. At the outer face of the concrete core, 4 mm diameter wires were wrapped radially and stressed. Nine (9) coupons were sampled from these prestressing wires, which resulted in an average ultimate tensile stress equal to 1756 MPa and an assumed yield stress equal to 1400 MPa. These test results are shown in Figure 4 together with the assumed constitutive law for the prestressing steel, which was utilized in subsequent numerical simulations.
Samples were also taken from the concrete core of the tested PCCP pipes. They formed either cubic specimens (100 mm × 100 mm × 100 mm) for compression tests or prismatic specimens for three-point flexure of 50 mm nominal thickness, 60 mm nominal width and 130 mm nominal length. The obtained results are shown in Figure 5 together with the assumed compression stress–strain concrete constitutive law that was utilized in subsequent numerical simulations. The average compressive cubic stress found from these tests was equal to 61.11 MPa, whereas the tensile strength from flexure was found to be 5.38 MPa.
The CFRP strips used in the schemes were cut from sheets of 600 mm width. Therefore, one such strip was wrapped circumferentially around the pipe (either at the internal or external face) with an overlap of 400 mm at its ends. Each CFRP reinforcing jacket was formed by three layers of CFRP strips sequentially attached on top of each other. The actual thickness of each layer was equal to 0.167 mm (SikaWrap300C), thus forming a total CFRP thickness, together with the resin layers, equal to approximately 2.54 mm. Certain additional CFRP layers were placed along the longitudinal axis at the two edges of the tested pipe extensions in the form of brackets bridging the internal and external faces of the pipe in order to prohibit the debonding of the CFRP sheets at these locations. Coupons were cut from the CFRP sheets placed at the exterior of the PCCP of the tested pipes after being tested and were subjected to axial tension. The obtained stress–strain response from eleven (11) CFRP coupons is shown in Figure 6. The average tensile strength was found to be 3129 MPa, and Young’s modulus was equal to 250 GPa, corresponding to a maximum average tensile strain equal to 1.252%.
The sprayed RC jacket was constructed by first placing 18 mm diameter longitudinal reinforcing bars, spaced every 300 mm, just above the prestressing wires. Radial closed-ring reinforcing bars of 14 mm diameter, spaced at 95 mm intervals, were next placed in contact with the longitudinal reinforcement. Both the longitudinal and radial reinforcing bars were secured in place by 250 mm diameter spacers resting on the surface of the prestressing wraps. The special concrete mix was sprayed uniformly all around the periphery of the specimen, providing a new concrete layer with a thickness approximately equal to 50 mm. The quality of this layer of sprayed concrete is C40 with a compressive strength equal to 40 ΜPa. The reinforcing bars of this external sprayed concrete jacket were of B500C quality, with nominal yield stress equal to 500 MPa. The tensile behaviour of the radial 14 mm diameter reinforcing bars of this RC external jacket (shown in Figure 7) was found by testing coupons taken from these jackets following the internal pressure test of the relevant pipes. Table 2 lists all of the geometric details, together with the most important mechanical properties of all materials involved. Figure 8, Figure 9 and Figure 10 depict the cross-section details of the used alternative repair-strengthening schemes that were investigated in the framework of this study.

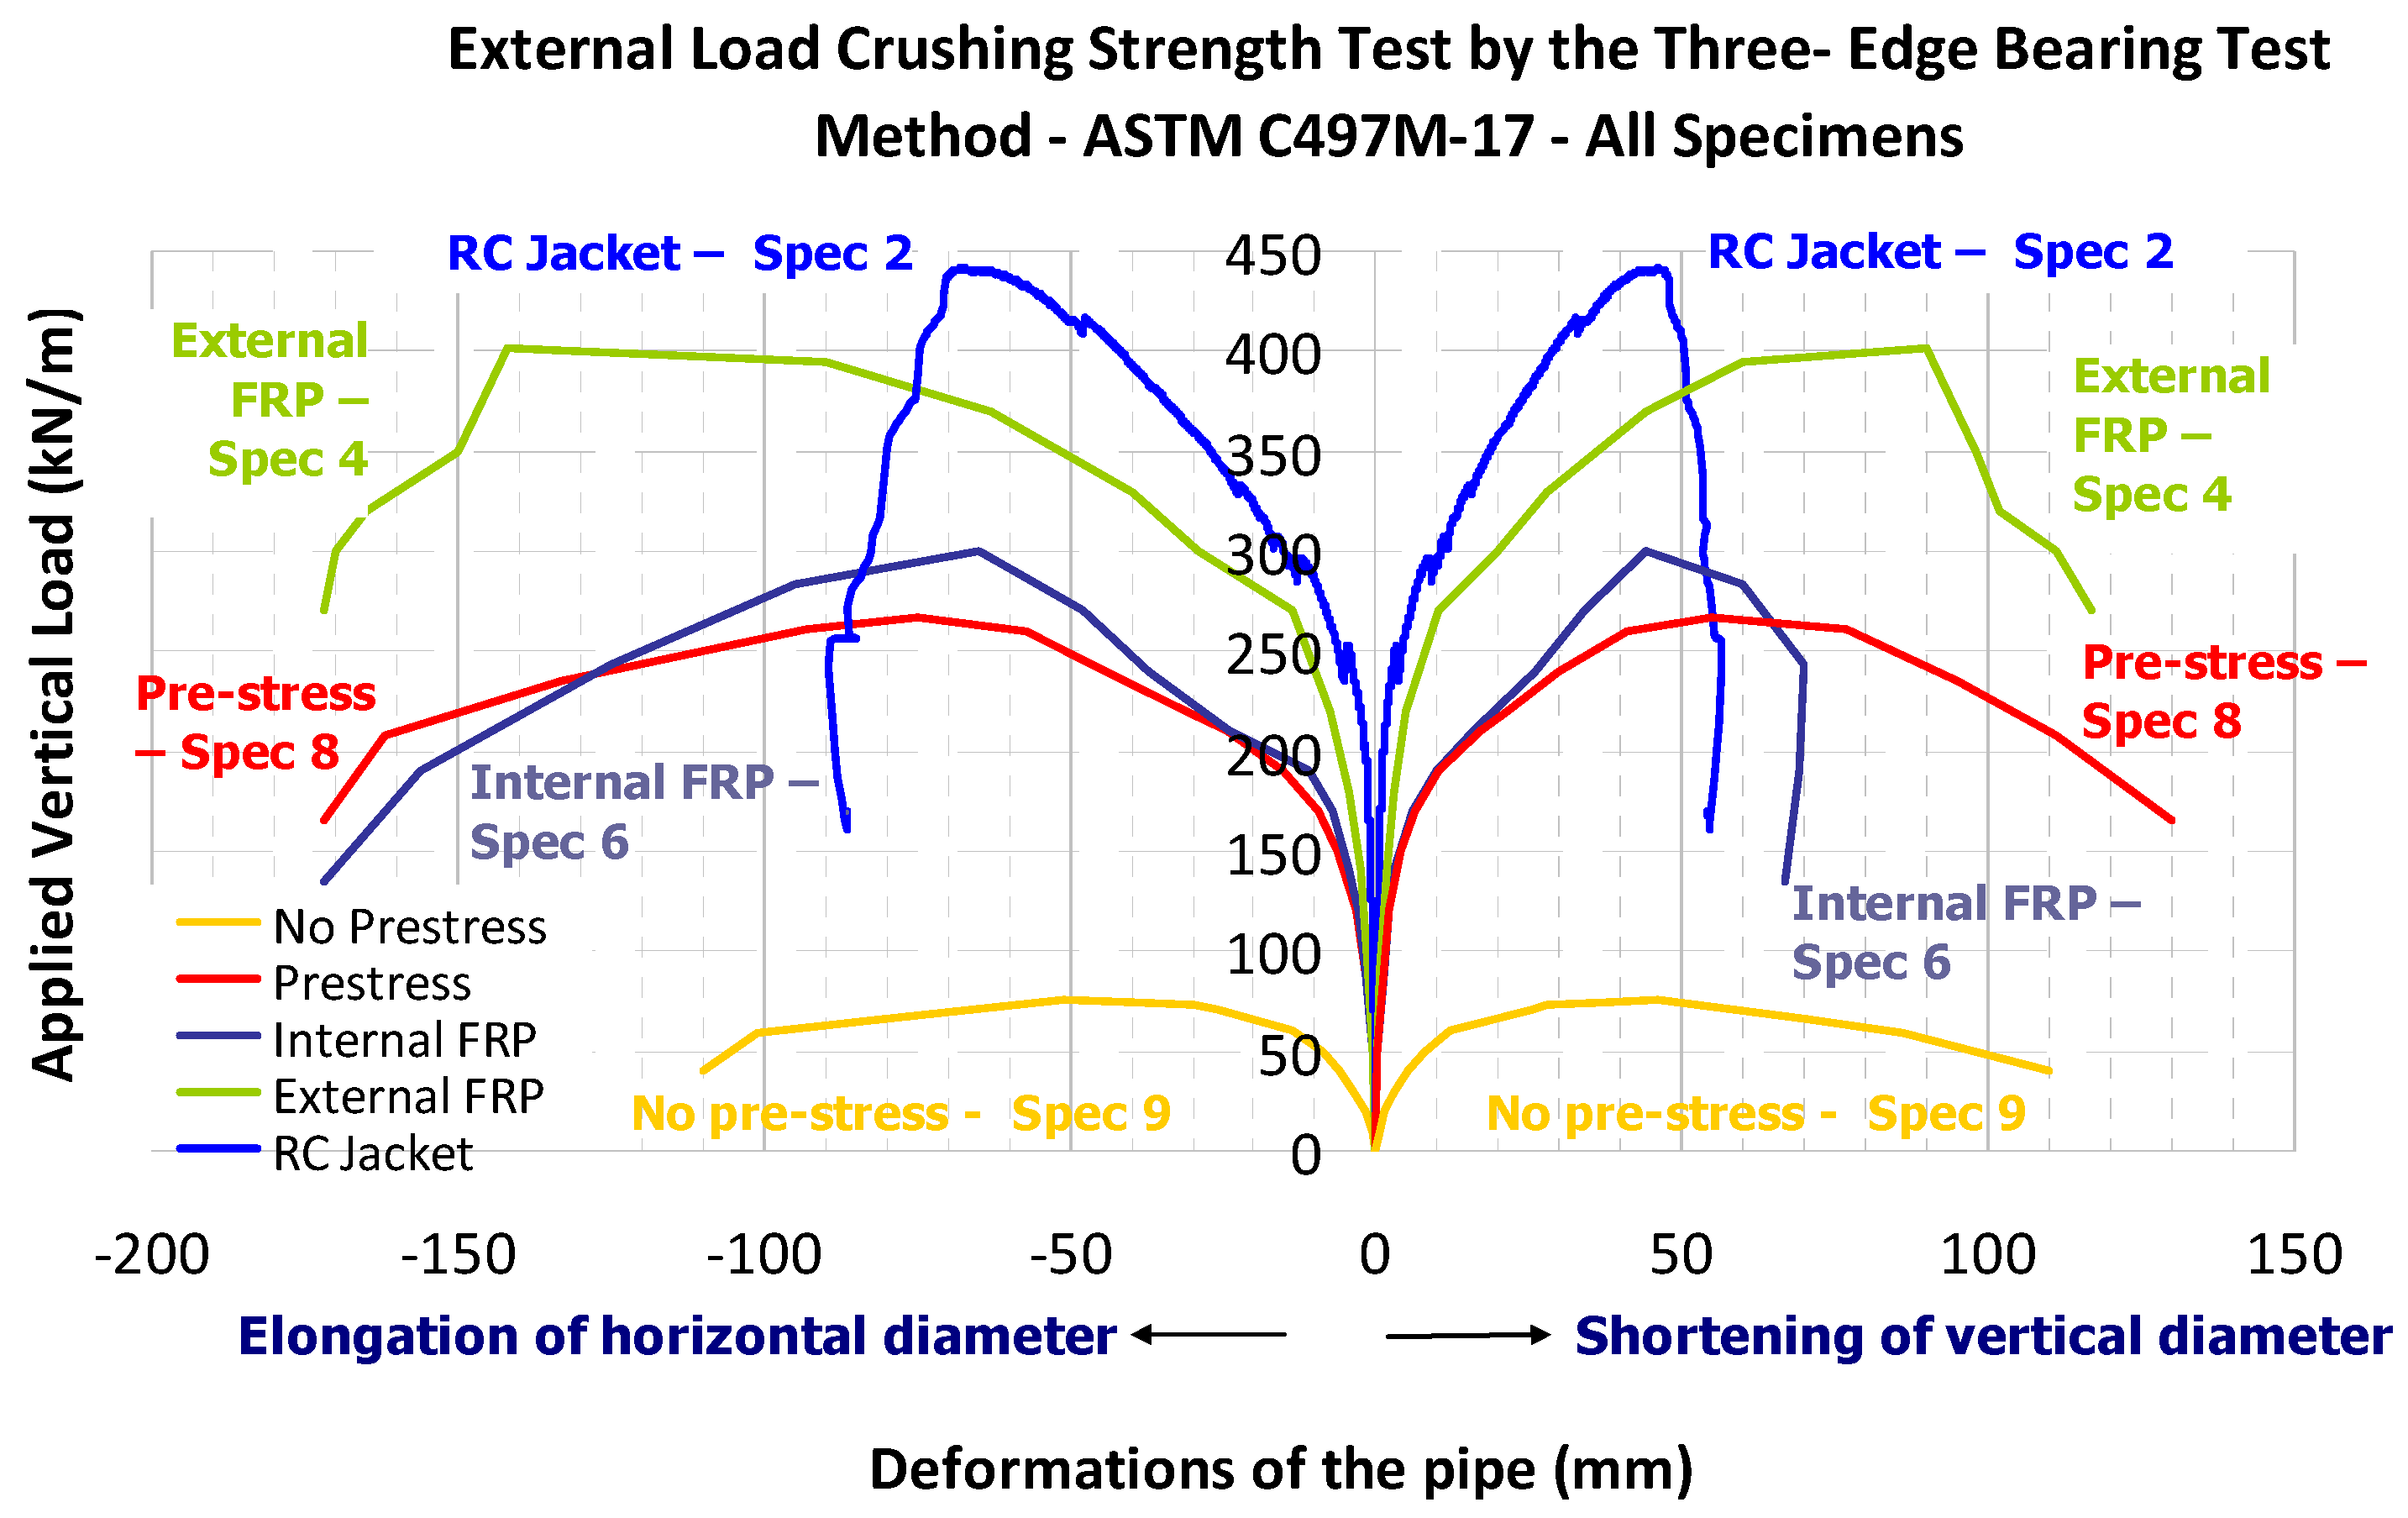
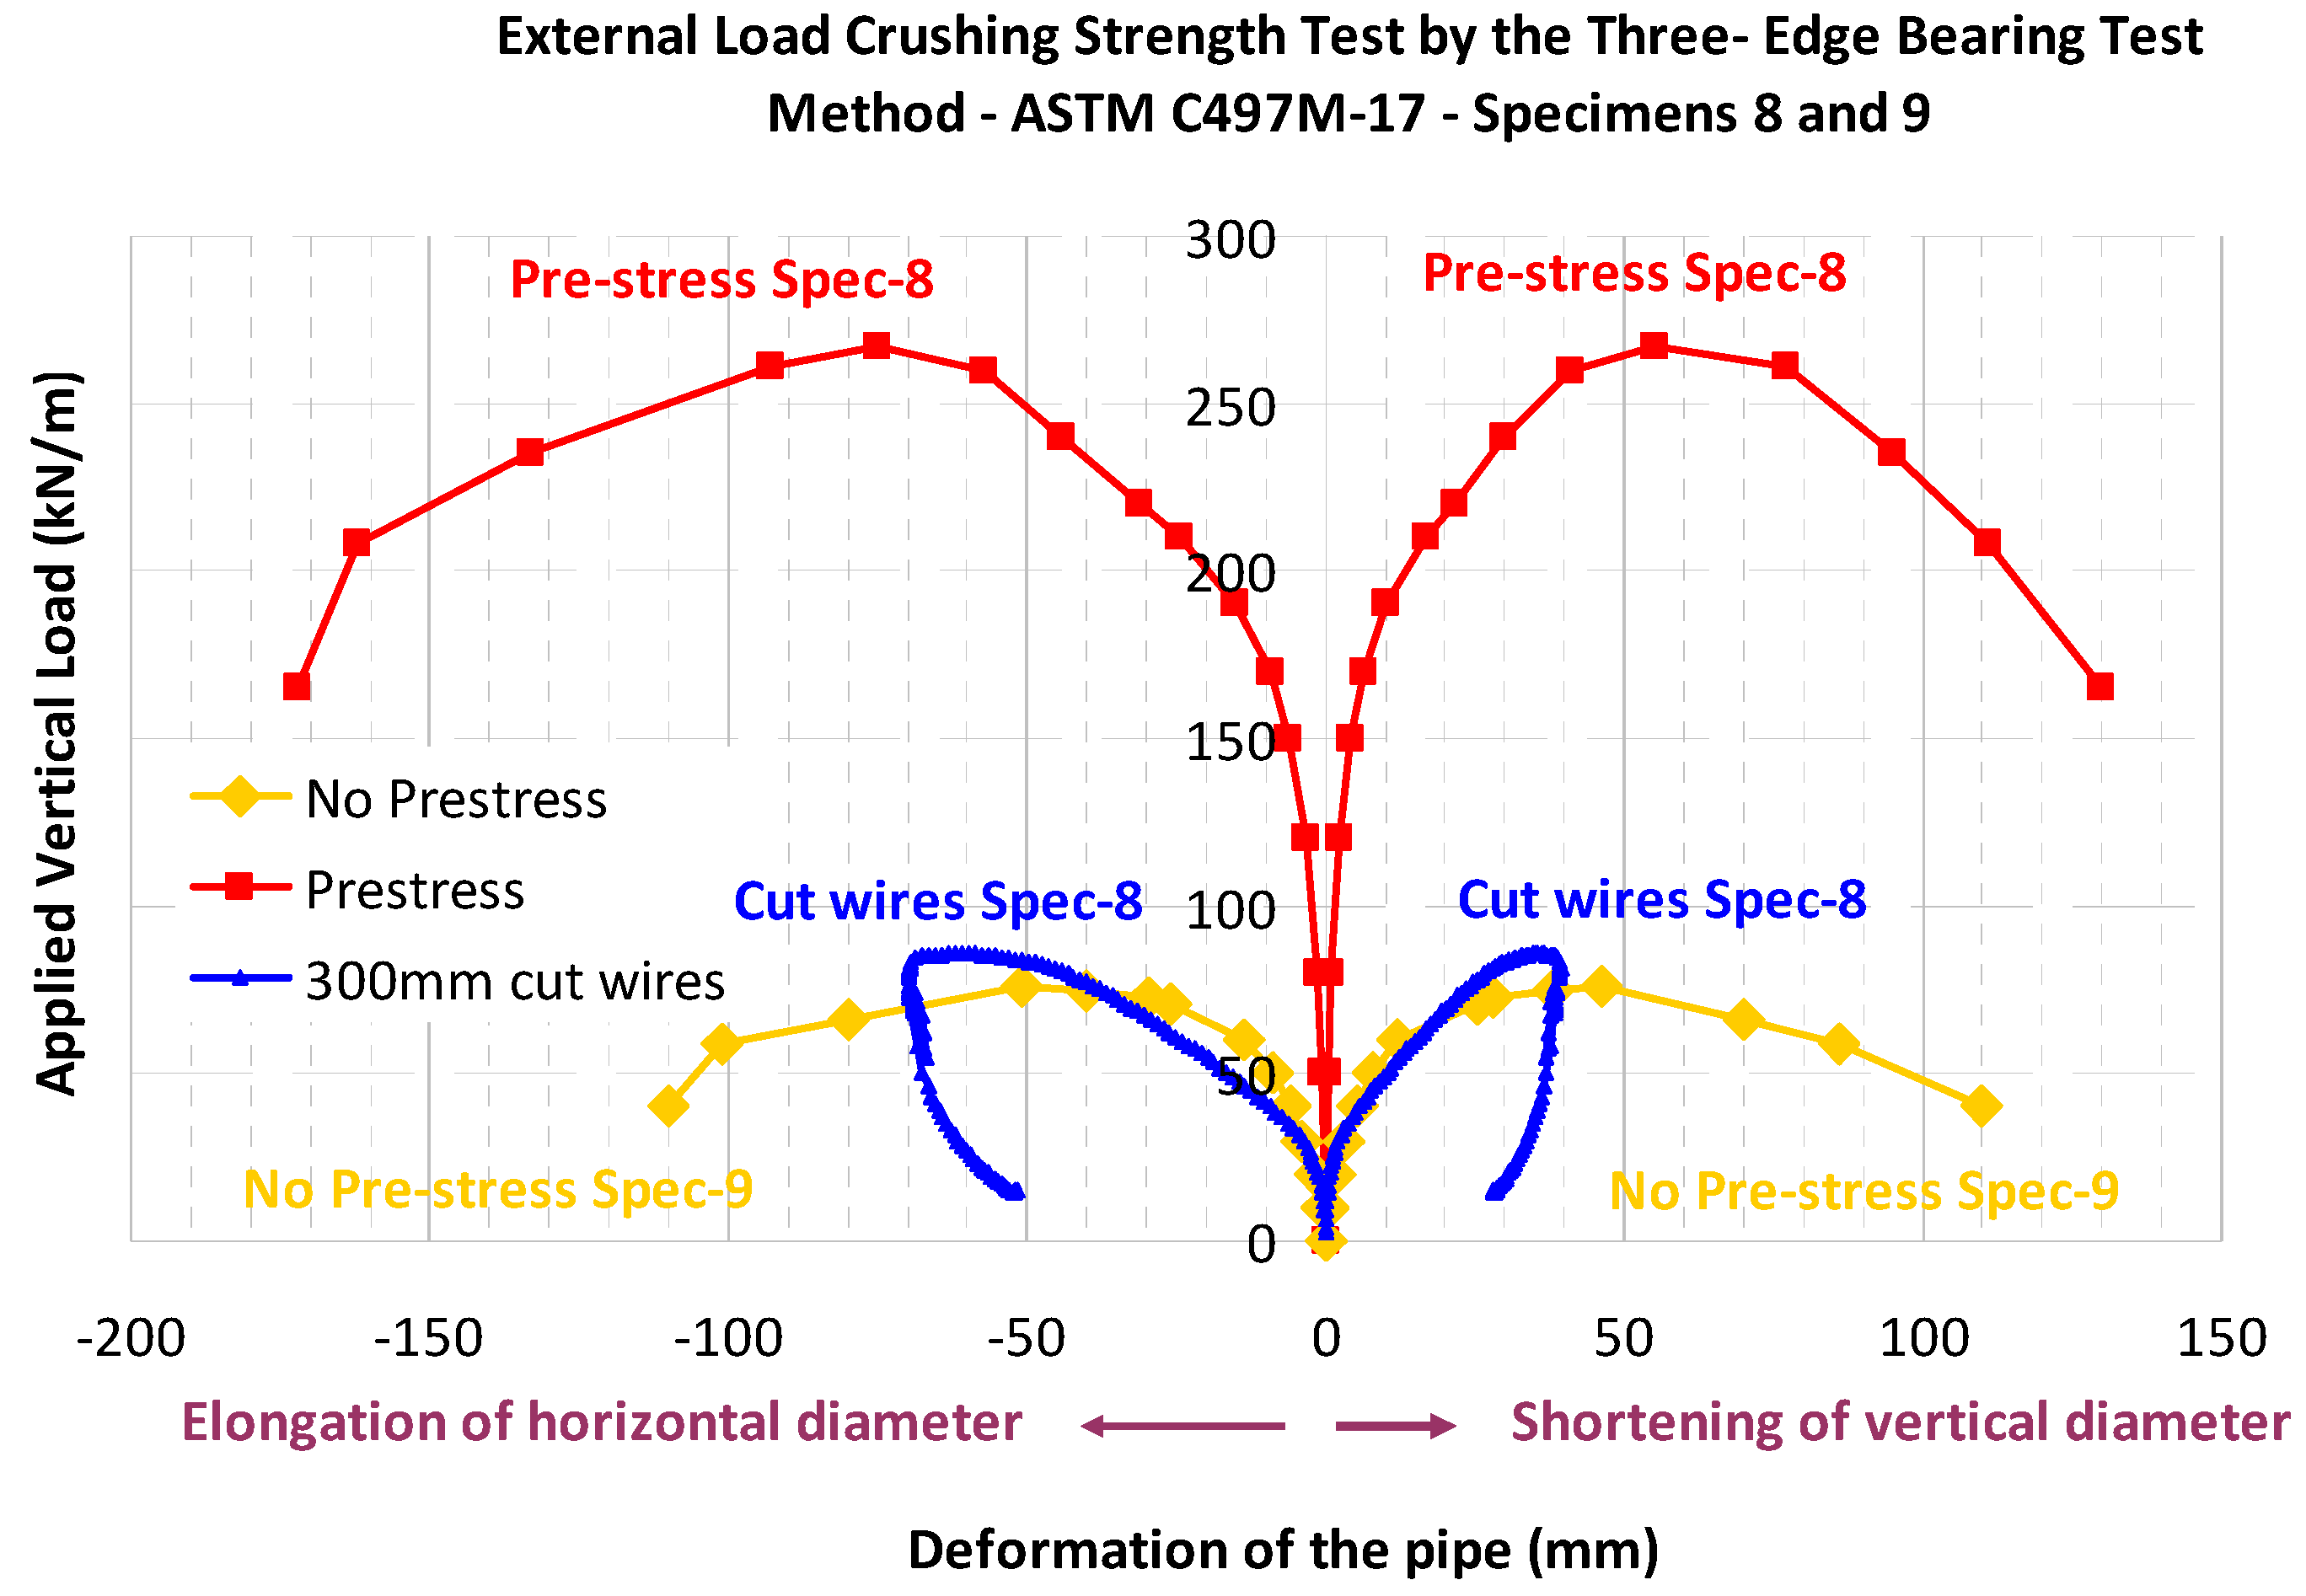
3. Three-Edge Bearing Test (3EB)—Results

The five (5) specimens listed in Table 1 were subjected to 3EB loading (Figure 11) according to the provisions of ASTM C497M-17 [28]. In Figure 12, the applied vertical load against the measured deformations of the pipe during the 3EB tests is summarized. The plotted deformations in this figure were the shortening of the vertical diameter (in line with the applied load) and the elongation of the horizontal diameter of the pipe. Table 3 lists the values of the vertical and horizontal deformations corresponding to the maximum recorded load for each specimen, together with the values of the vertical load that produced a 0.3 mm crack. The following are the main observations: (a) The removal of the prestressing wires resulted in a significant reduction in the bearing capacity of the pipe for this type of loading. (b) The internal FRP jacket did not result in any noticeable increase in the bearing capacity of the pipe for this 3EB loading. (c) On the contrary, the external jacket, either with CFRP or with RC layers, resulted in a significant increase in its bearing capacity for this 3EB loading. (d) The bearing capacity under 3EB loading of the tested specimen either with an external CFRP jacket or with an external RC jacket, when compared to the corresponding bearing capacity of the specimen with all the prestressing wires fully active, showed an increase of either 50% or 65%, respectively.

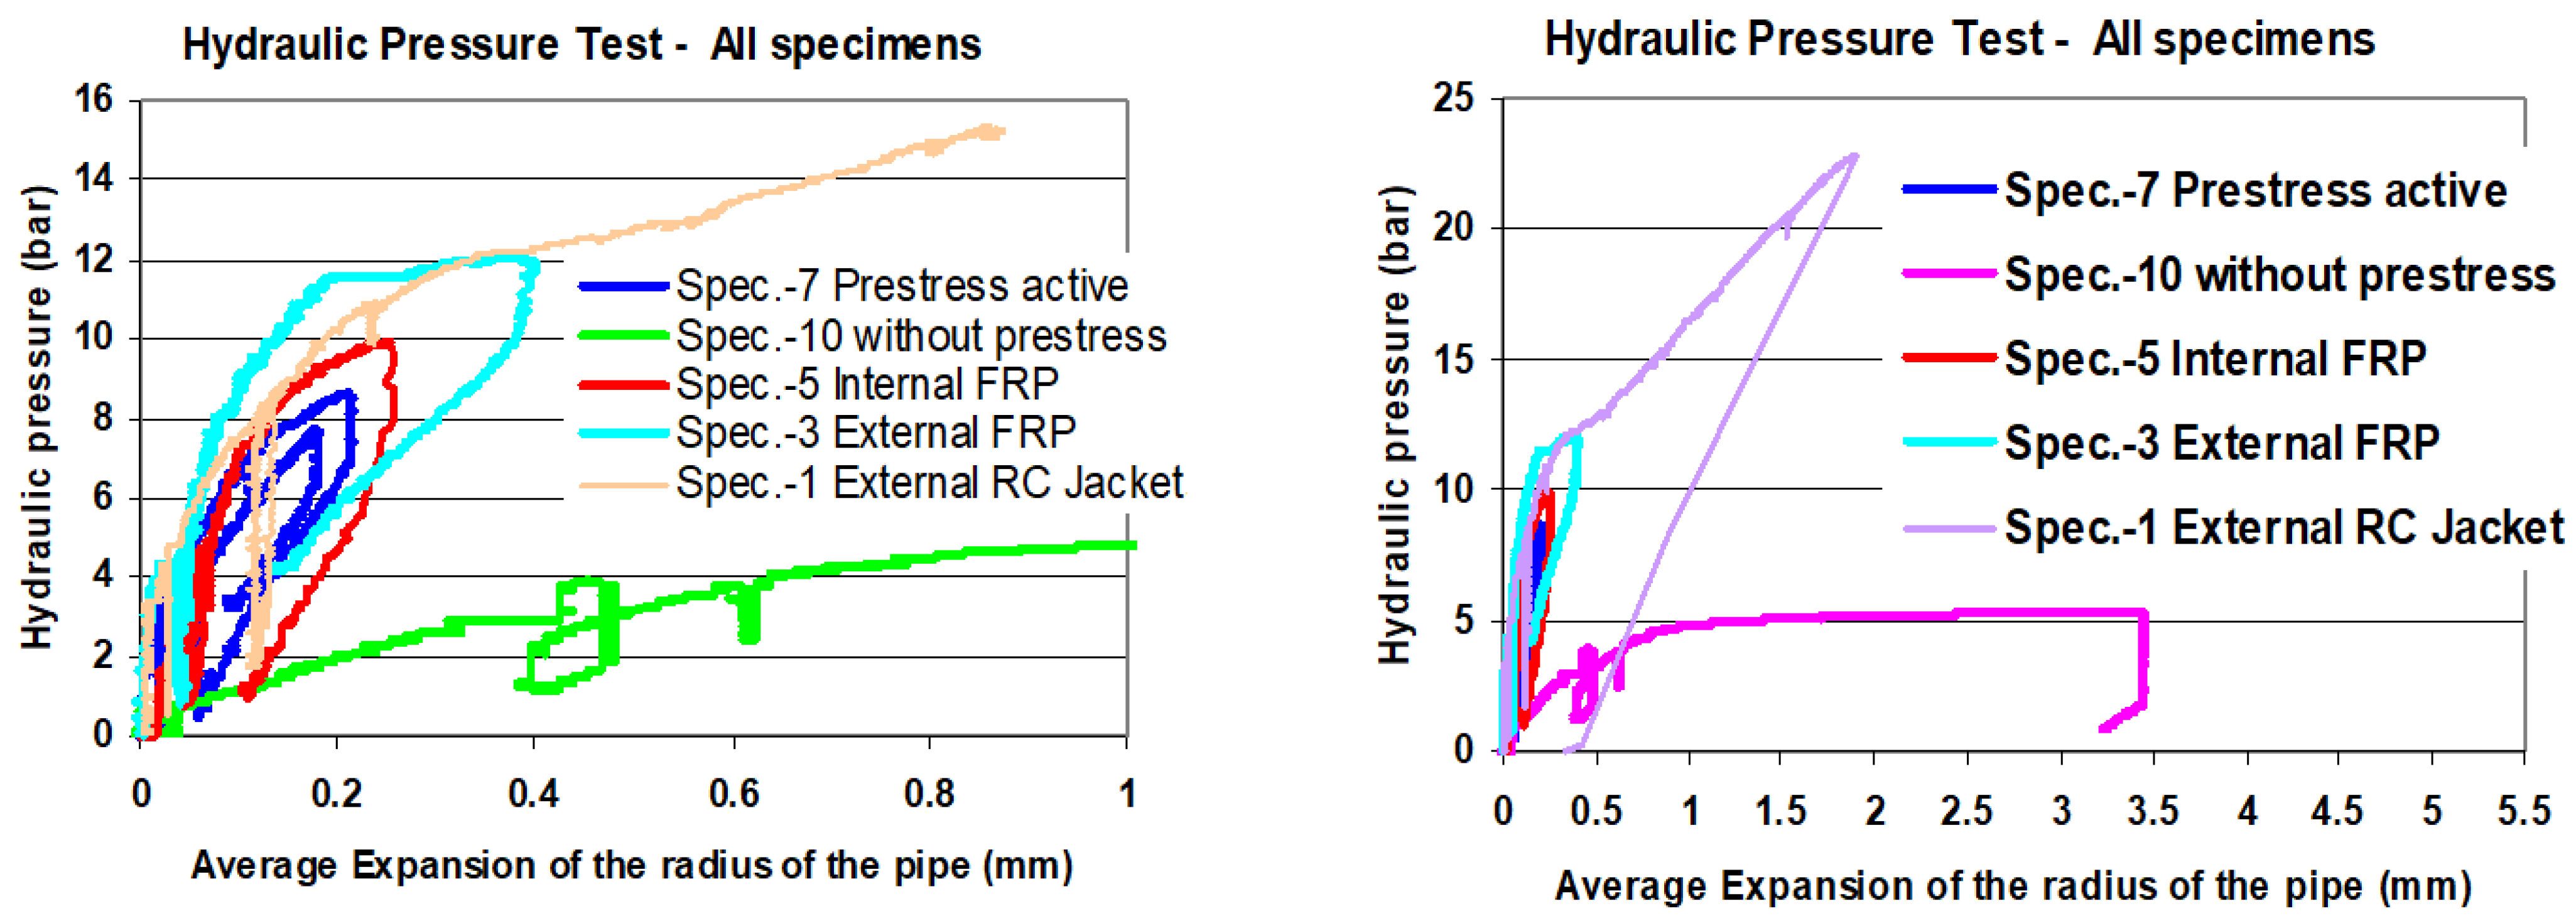
4. Internal Hydraulic Pressure Test

4.1. Description

The current study utilized internal hydraulic pressure in order to investigate the capacity of the existing pipe and also the effectiveness of various retrofitting techniques. The Greek Standard is based on the ASTM C497 [28] method, which focuses on the water tightness of the pipe under 70 kPa (0.7 bar) internal pressure for 10 min rather than quantifying the pipe’s bearing capacity limit state. Instead, the objective of the tests reported here was to apply internal hydraulic pressure with an amplitude much larger than 0.7 bar. The specified internal pressure amplitude limit, set equal to 8.5 bar, represents pressure levels due to hydraulic gradient and water surge conditions. To achieve this objective, a strong internal tubular cylinder was constructed with a low-shrinkage concrete mix, with a compressive strength of 25 MPa, and light longitudinal and radial reinforcement.
The external diameter of this cylinder was approximately 1680 mm, its height was the same as that of the specimens (1000 mm), and its average thickness was equal to 260 mm; it was designed to act as a loading reaction cylinder (Figure 13). Each pipe specimen was placed with its longitudinal axis vertical, placing this reaction cylinder inside its internal diameter, thus forming a system of twin tubular concentric vertical cylinders with a gap of 60 mm (Figure 13a–c). Two identical thick steel circular plates (25 mm thick flanges) formed the top and bottom sealing covers of the whole system (Figure 13a–c). These plates were stiffened with twelve (12) radial stiffeners, which were provided with the appropriate anchoring seats so that each could host two steel rods of 20 mm diameter (24 rods in total). Prior to applying the internal hydraulic pressure, all of these steel rods were lightly prestressed consecutively in a step-by-step controlled manner so that these covers would provide the necessary sealing of this loading system.
This internal reaction cylinder with top and bottom covers was designed to withstand, with minimal deformations, the desired upper internal pressure limit level so that each specimen reaches its pressure limit state. Prior to sealing these top and bottom covers, the surface of both the top and bottom rims of each specimen was levelled with strong mortar to ensure proper sealing. These top and bottom steel plates were provided with the necessary valves and high-pressure piping in order to introduce the desired hydraulic pressure in the internal gap between the specimen and the reaction cylinder and to facilitate the escape of any trapped air from this gap so that the applied hydraulic pressure was uniformly distributed on the internal surface of the tested specimen. The applied hydraulic pressure was monitored by a system of multiple pressure gauges. Pressure sensors were provided to measure the applied pressure at both the top and bottom piping near the corresponding valves and to record it with an automatic data acquisition system. Each part of this test rig was designed through a detailed numerical simulation in order to ensure that the stress and deformation levels of each part were kept below limits set for sealing and safety conditions. A critical parameter was the value of the internal gap between the specimen and the reaction cylinder. The placement of the specimen in this loading arrangement was possible when the minimum value of this gap was equal to 60 mm. This value was used in the design to determine the internal pressure forces on the top and bottom steel covers. Moreover, the required volume of filling water was also minimized. This sealing procedure introduced limited restraints at the ends of the tested specimens. The continuously increasing internal pressure displaced the top and bottom sealing steel plates outwards, thus minimizing any small initial restraint. The same loading arrangement was used for all tested specimens in order to compare their measured behaviour under identical boundary conditions. A very flexible but strong plastic membrane was placed within the internal gap to augment the sealing conditions and to ensure that the whole experimental process was free from any accidental fluid leakage, especially when the internal hydraulic pressure attained relatively high amplitudes. This plastic membrane was custom-made to fit exactly within the relevant gap and was temporarily attached to the upper and lower parts of the cylinder walls prior to sealing the steel cover. As can be seen in Figure 13a–c, the longitudinal axis of the pipe had a vertical orientation during testing instead of the horizontal orientation of the actual pipeline. This test does not take into account the effect of the weight of the pipe, the water volume or any soil volume for the cases of buried pipelines.

4.2. Instrumentation

Displacement transducers were placed at mid-length outside of each tested specimen at specific diametrically opposite locations (namely East, West, North and South) for two diameters perpendicular to each other in order to monitor the variation in the pipe’s horizontal radial expansion. These measurements were an obvious indication of the average deformation of the specimen during the internal pressure tests and could not be influenced by any local phenomena. At the same locations, strain gauges were attached in order to monitor the variation in the radial strain of certain parts of each specimen at these locations (see Figure 2, Figure 8, Figure 9 and Figure 10). In the literature, similar experimental studies have been published with more dense instrumentation than what was used here by employing strain gauges attached to various locations within the cross-section of the pipe specimen that was constructed for this purpose ([17,18,23,24,25,26,27]). In the present study, for a specimen without prestressed bars (Spec. 10), these strain gauges were attached to the steel membrane. For specimens in which the fully active prestressing wires were accessible (Spec. 7 (original pipe) and Spec. 5 (internal CFRP jacket)), these strain gauges were attached to the prestressing wires. For specimens with external jackets, the strain gauges were placed on either the surface of the FRP jacket (Spec. 3) or the radial reinforcing bars of the external RC jacket. Additional safety precautions were taken to minimize any accidental sudden leakage for relatively high hydraulic pressure values. To this end, a number of strain gauges were attached to the vertical steel rods connecting the top and bottom flanges in order to record any sudden overload of this sealing system. All of these signals were recorded together with the applied internal pressure by an automatic data acquisition system equipped with a visual monitor to facilitate the safe performance of this loading arrangement. The internal pressure loading followed a progressive increase in the internal pressure to a pre-set target level approximately equal to 8.5 bar. The internal hydraulic pressure was gradually increased until this set target value was reached, and it was maintained for approximately five (5) minutes, followed by unloading. The non-linear behaviour of the various components forming the pipe specimens is not expected to develop in a radially symmetric manner. Therefore, the displacement and strain responses only partially portray the actual non-linear behaviour of the tested specimens.

4.3. Obtained Results

The measured internal pressure behaviour of each of the five (5) tested specimens (Table 1) is presented in the following way. First, the variation in the average expansion of the pipe radius, measured at four locations, is plotted against the variation in the internal hydraulic pressure amplitude. Next, the variation in the radial strains recorded by the previously described strain gauges is also plotted against the variation in the internal hydraulic pressure amplitude, at the same time denoting the location where these strain gauges were attached. In Figure 14, the measured response of Spec. 10 (without prestress) is shown. Figure 14 (left) depicts the radial expansion versus internal pressure, whereas Figure 14 (right) depicts the radial strains recorded at the steel membrane. As already mentioned, the expansion of the radius of the pipe was measured at four diametrically opposite locations (namely, East, West, North and South). Because the prestressing wires and the layer of concrete between these prestressing wires and the internal steel membrane were removed, it was possible to attach strain gauges directly to the steel membrane at the same locations as the displacement transducers. As can be seen in Figure 14 (left), the slope of the curve corresponding to the variation in the radius expansion against the internal pressure changes when the internal pressure reaches 2.8 bar. When the internal pressure increases further, the expansion of the radius increases at a higher rate than before. This must be attributed to the cracking of the concrete, which means that for internal pressure values higher than 2.8 bar, the internal pressure is resisted solely by the steel membrane. When the internal pressure reaches approximately 4.0 bar, two unloading cycles are performed.
Permanent radial expansion was retained after unloading, which is attributed to the permanent cracking of the concrete. On the contrary, the strains measured at the steel membrane (Figure 14, right) during unloading reached their initial values, demonstrating that for this amplitude of internal pressure (4.0 bar), the steel membrane deformed in its elastic range, not yet reaching the yield point. However, when the internal pressure was increased beyond 4.0 bar, reaching an amplitude of approximately 5.0 bar, the steel membrane radial strains at two locations (West and South) increased in a non-linear manner, indicating that the steel membrane was yielding at least at these two locations. For internal pressure values higher than 5.0 bar and up to 5.2 bar, the radial expansion continued to increase at an even higher rate than before. Considerable permanent deformation and strain levels remain at unloading.
In Figure 15, the measured response of Spec. 7 is shown. For this specimen, all of the prestressing wires are fully active. Figure 15 (left) depicts the variation in the applied internal hydraulic pressure against the average expansion of the pipe radius. The variation in the prestressing wires’ radial strains measured at four locations (East, West, North and South), together with their averages, is plotted against the variation in the applied internal hydraulic pressure in Figure 15 (right). This variation is almost linear with no remaining strains at unloading, confirming that the prestressing wires perform within their elastic range up to the applied internal maximum pressure of approximately 8.5 bar. Due to safety precautions, no attempt was made to increase the internal pressure beyond this set limit value, because this specimen did not have any retrofitted line of defence like specimens Spec. 5, Spec. 3 and Spec. 1, which were tested next.
As can be seen in Figure 15 (left), at the end of the second loading–unloading cycle, having reached an internal pressure of approximately 8.5 bar, there is remaining expansion of the pipe radius, indicating a certain type of non-linear response. This must again be attributed to the micro-cracking of the internal concrete volume. The forming of these micro-cracks cannot be identified from this figure, except from the change in the slope of the variation in the internal pressure against the radial expansion on the loading path of the first loading cycle at approximately 3.5 bar. When prestressing is fully active, it introduces a compressive stress field on the concrete volume that, up to a certain pressure level, less than 8.5 bar, counteracts the tensile stresses resulting from the internal pressure, thus prohibiting the development of concrete cracking. On the contrary, when the prestressing wires become inactive, regardless of the cause, as in the case of Specimen 10, this limit is approximately 2.0 bar.
Figure 16 depicts the measured response during the internal hydraulic pressure testing of Specimen 5, which is a specimen with fully active prestress and is retrofitted with a radial three-layer CFRP jacket attached to its internal pipe surface. The applied internal pressure variation is plotted against the average radial expansion (Figure 16 left) or the radial strains developing on the prestressing wires (Figure 16 right). This measured response again confirms that at the maximum internal pressure, approximately 10.0 bar, the prestressing wires deform within their elastic range. At the end of the first loading–unloading cycle, having reached a maximum internal pressure of approximately 10.0 bar, there is a remaining permanent expansion of the radius of the pipe, which again is attributed to the micro-cracking of the internal concrete volume (Figure 16 left). The active prestress with the internal CFRP jacket controls this concrete micro-cracking for internal pressure values up to 8.0 bar.
Figure 17 shows the measured response recorded during the internal hydraulic pressure testing of Specimen 3, which is retrofitted with a three-layer CFRP jacket attached to its external pipe surface and with all prestressing wires fully active. The applied internal pressure variation is plotted against the average radial expansion (Figure 17 left) or radial strains measured at four locations of the external CFRP jacket (Figure 17 right). The variation in these CFRP strains against the internal pressure is almost linear up to an amplitude of 10.0 bar. Beyond this internal pressure amplitude, the CFRP at South and East locations becomes noticeably larger than before. Moreover, at the end of this loading–unloading cycle, having reached a maximum internal pressure amplitude of approximately 12.0 bar, there is remaining permanent expansion of the radius of the pipe, which is again attributed to the micro-cracking of the internal concrete volume.
Finally, Figure 18 shows the measured response recorded during the internal hydraulic pressure testing of Specimen 1, which is retrofitted with an external RC jacket and has, at the same time, all prestressing wires fully active. An initial change in slope can be seen in Figure 18 (left) for an internal pressure amplitude above approximately 6.0 bar. Moreover, permanent remaining radial expansion can also be seen for the unloading path, having reached an internal pressure amplitude of 8.0 bar. The radial expansion versus the internal pressure variation (Figure 18 left) changes its slope even further for an internal pressure amplitude higher than 11.0 bar. For pressure values larger than 11.0 bar up to almost 23 bar, the slope of the curve representing the variation in the radial expansion versus internal pressure remains almost constant. After unloading, there is considerable remaining permanent radial expansion. The same observations can be made for the variation in the radial strain versus the internal pressure response depicted in Figure 18 (right). These are the radial strains of the radial reinforcement of the RC jacket. As can be seen in Figure 18 (right), at the maximum applied internal pressure of 23.0 bar, the East radial reinforcing bar within the RC jacket is stressed beyond its yield point at the maximum applied internal pressure.

4.4. Summary Observations of Internal Hydraulic Pressure Tests

Table 4 lists the most significant parameters during the internal hydraulic pressure tests for all examined specimens, whereas Figure 19 compares the variation in the internal hydraulic pressure versus the expansion of the pipe radius for these five (5) specimens. Figure 19 (right) plots the same variation as that in Figure 19 (left) with a different scale for the abscissa axis in order to show details of the measured response of Specimens 1, 3, 5 and 7. As can be seen in both plots, the radial expansion response of Specimen 10 (having inactive prestressing wires) is much larger than that of Specimens 1, 3, 5 and 7 (all of which have active prestressing wires). Therefore, it can be concluded that fully active prestress is critical for the performance of the pipeline. As can be seen in Figure 19 (right), all specimens with fully active prestressing wires have a loading path whereby the radial expansion versus the internal pressure response is almost identical for internal pressure amplitudes up to approximately 8.0 bar. An internal pressure increase beyond this pressure amplitude unveils the effect of retrofitting the pipe with the three different jacketing schemes described. From the recorded response, it can be concluded that the prestressing wires reach their yield when the internal pressure increases beyond an amplitude of 12.0 bar. For all of these retrofitting schemes, cracking of the internal concrete volume is initiated at an internal pressure higher than 8.0 bar. These observations are also confirmed by the relevant values listed in Table 4.

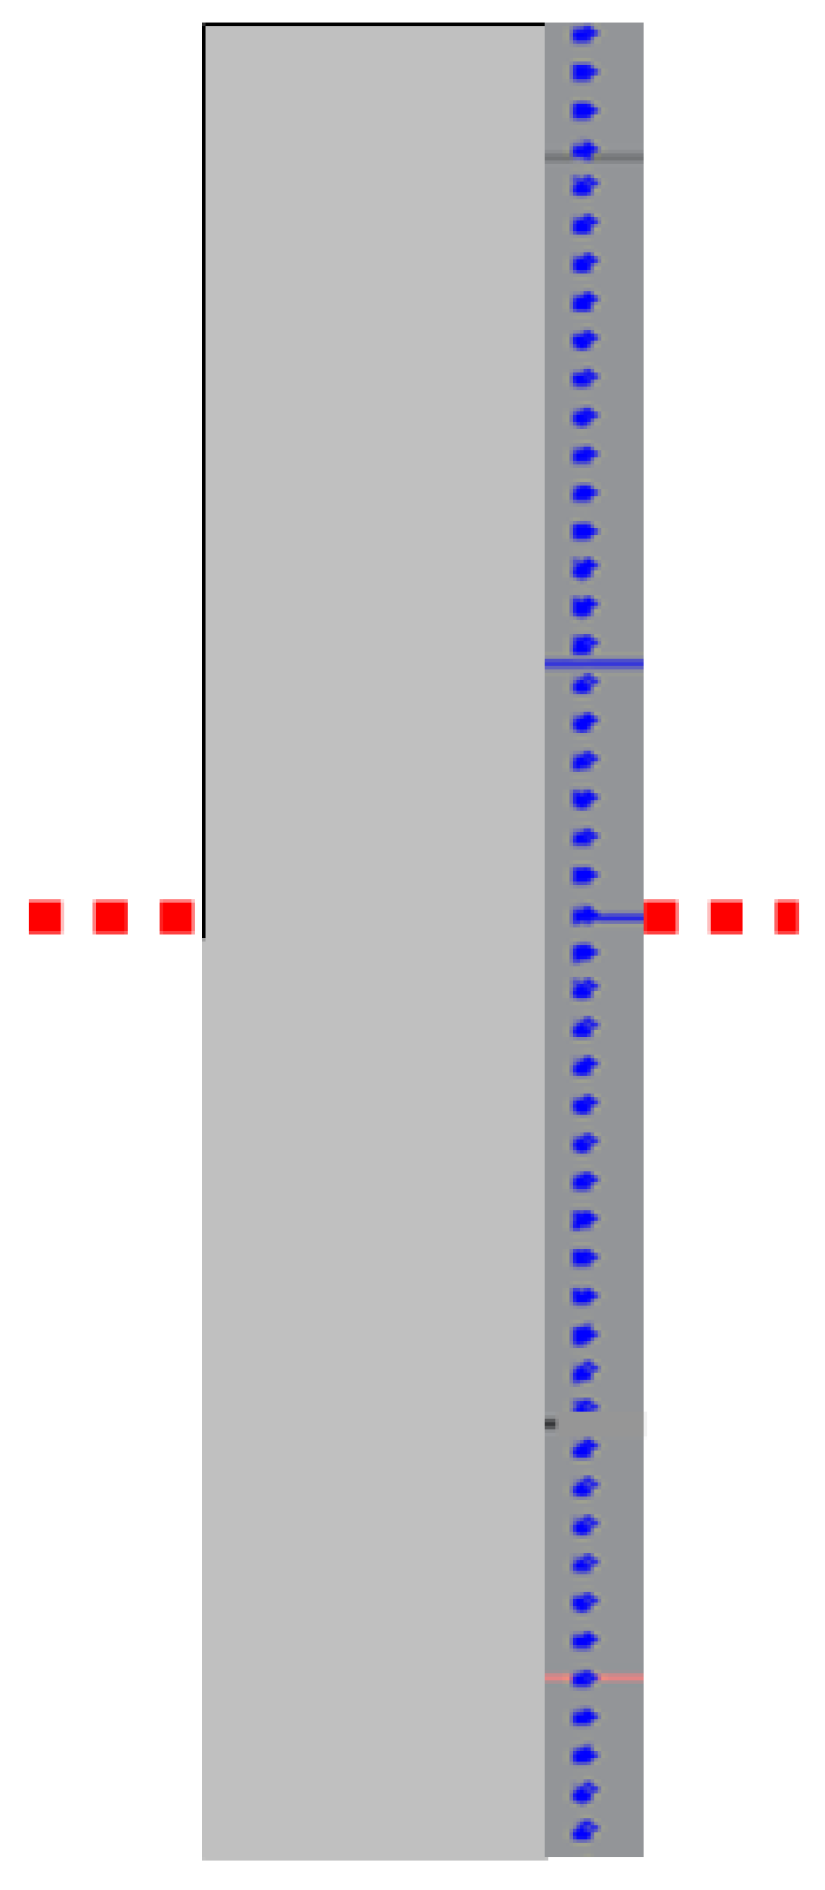
5. Laboratory Simulation of Defects in the Prestressing Wires

A typical cross-section of the pipe specimen is depicted in Figure 20. The red dotted line indicates the axis of symmetry at mid-length, whereas blue dots show the 4 mm diameter prestressing wires. The following procedure was adopted in order to perform a laboratory simulation of the defective condition of the prestressing wires (see also Figure 13a–c). As discussed in Section 4, the neutralization of the prestress resulted in a significant reduction in the ability of the pipe to withstand the internal hydraulic pressure. To simulate defective prestress, the following process was adopted after completing the loading–unloading cycles of the 3EB and internal hydraulic pressure tests described in Section 3 and Section 4, with all prestressing wires being fully effective for eight (8) specimens (see Table 1).
Initially, this simulated prestress defect process was performed by loading a pipe specimen during the 3EB testing presented in Section 3 (Figure 11 and Figure 12). For this purpose, Specimen 8 was selected, which had been previously subjected to 3EB loading with the prestress fully active. Despite this previous test, this specimen retained approximately 60% of its maximum load at the end of this 3EB test. The wires located at a length of 300 mm at the Eastern cross-section (16 wires) were cut as shown in Figure 21, placed evenly with respect to the axis of symmetry, indicated with the red dotted line. This cross-section was selected arbitrarily, representing a typical cross-section of the pipe specimen. The wire located at the axis of symmetry was left intact. Figure 22 depicts the obtained 3EB load–deformation response of Specimen 8 with 16 wires neutralized by cutting, as shown in Figure 21. In Figure 22, the corresponding responses of Specimen 8 before cutting the wires and that of Specimen 9 without any prestress are also shown. As can be seen, the cutting of these wires resulted in a reduction in the bearing capacity of the specimen with the described simulated prestress defect to the level that was obtained for the specimen without any prestress.
This process of simulating prestress defects in the laboratory was repeated for two more specimens after they were subjected to internal hydraulic pressure tests with all prestressing wires being fully active. Again, selected prestressing wires were partially neutralized by cutting them at their Eastern cross-section. This cross-section was selected arbitrarily, representing a typical cross-section of the pipe specimen.
Initially, four wires were cut, followed by an internal pressure loading–unloading cycle. Next, this was repeated by cutting 8 and then 20 prestressing wires. All wires were cut at the East cross-section of the pipe in a symmetric fashion ((2 and 2), (4 and 4) and (10 and 10)) with respect to the axis of symmetry shown in Figure 20, leaving the wire that was located exactly at this axis of symmetry, as well as all the rest of the wires, uncut. Apart from cutting these specific wires and introducing a complete wire cut of approximately 2 mm length made by an electric saw, these wires were left in place without trying to remove any part of them from the body of the pipe. This was considered to be an approximate approach to simulating defective prestress that can develop at such a pipeline in situ in the laboratory.
Specimen 7 and Specimen 5 were used to simulate defective prestress in the way described. The prestressing wires of these two specimens were easily accessible by locally removing the protective mortar cover. Care was taken not to disturb the instrumentation that was placed at this location during the wire-cutting process. The presence of the CFRP jacket (Specimen 3) or RC jacket (Specimen 1) did not allow such a wire-cutting process. The obtained measured response for Specimen 7 (original pipe) and Specimen 5 (pipe with internal CFRP jacket) is next presented and discussed. Figure 23a,b depict the measured response when subjecting Specimen 7 to internal pressure, first with all prestressing wires fully active and then during the process of cutting the specified wires sequentially, as previously described. Figure 23a shows the applied internal pressure loading–unloading cycles over time, where the described wire-cutting process is indicated. In the same figure, the measured radial expansion at the East and West cross-sections is also shown. Figure 23b again shows the applied cycles of internal pressure together with the radial strains measured at the East, West, North and South cross-sections.
The progressive cutting of the prestressing wires resulted in the enlargement of the radial expansion at the East and West cross-sections and the straining of the Eastern wire left at the axis of symmetry. The increase in the number of cut wires resulted, as expected, in larger values of the radial expansion and the straining of the wire for relatively small internal pressure amplitudes. This in turn can lead to a reduction in the internal pressure capacity of the pipe as a result of the prestress defect. Due to time and safety restrictions, this part of the test sequence was extended to a duration of 3500 s, not including the time required for cutting the wires.
Figure 24a,b depict the measured response when subjecting Specimen 5, with an internal CFRP jacket, to internal pressure when having all prestressing wires fully active and then applying the process of cutting the specified wires sequentially, as described before. The progressive cutting of the prestressing wires resulted in an enlargement of the average radial expansion and the straining of the wire left at the axis of symmetry. The increase in the number of cut wires resulted in larger radial expansion values and a considerable strain increase of the Eastern wire for relatively small internal pressure amplitudes. However, this time, the internal CFRP jacket kept the enlargement of the pipe deformation under control despite the progress of the simulated prestress defect. Consequently, the internal CFRP jacket can control the detrimental effect that a prestress defect can have on the internal pressure bearing capacity. Again, due to time and safety restrictions, the test sequence was extended to a duration of 3500 s, not including the time required for wire cutting. Therefore, the previously stated conclusion should be considered under these limited-time test conditions.

6. Summary Observations

The structural performance of three different strengthening schemes was investigated for prestressed concrete cylindrical pipe (PCCP) specimens utilizing two distinct laboratory loading conditions, namely, “three edge bearing” and “internal hydraulic pressure” loading. The observed performance was recorded in terms of applied load and resulting deformations for each specimen. The main objectives of this investigation were as follows: (a) to confirm that the tested specimens could be subjected to the set internal pressure amplitude without any apparent malfunction, (b) to be able to compare the load-bearing capacity of the various strengthening schemes with the original pipe prior to strengthening, (c) to be able to simulate prestressing wire defects and study the performance of specimens with such defects and (d) to obtain a set of data that could be used to validate relevant numerical simulations. The following are the main observations.
  • The 3EB bearing capacity of all strengthened specimens was larger than that of the original pipe. Due to the type of 3EB loading, strengthening with external jacketing with CFRP or RC resulted in a larger 3EB bearing capacity than was obtained with the internal CFRP jacket. It was also established that the simulated partial prestress defect or the full neutralization of the prestress resulted in a very significant reduction in the 3EB bearing capacity.
  • All strengthening schemes satisfied the set upper limit of internal hydraulic amplitude, approximately equal to 8.5 bar. Loading the specimens with an internal pressure amplitude higher than this upper limit was tried only for the strengthened specimens following certain safety precautions based on the non-linearity of the measured radial expansion as well as on the strains measured by strain gauges placed at pre-determined locations. Again, the external jacketing, either with the CFRP jacket or with the RC jacket, allowed the increase in the internal hydraulic pressure beyond the 8.5 bar limit, reaching 12 bar and 22 bar, respectively. However, because of the construction of these external jackets, the simulated prestress defect could not be applied.
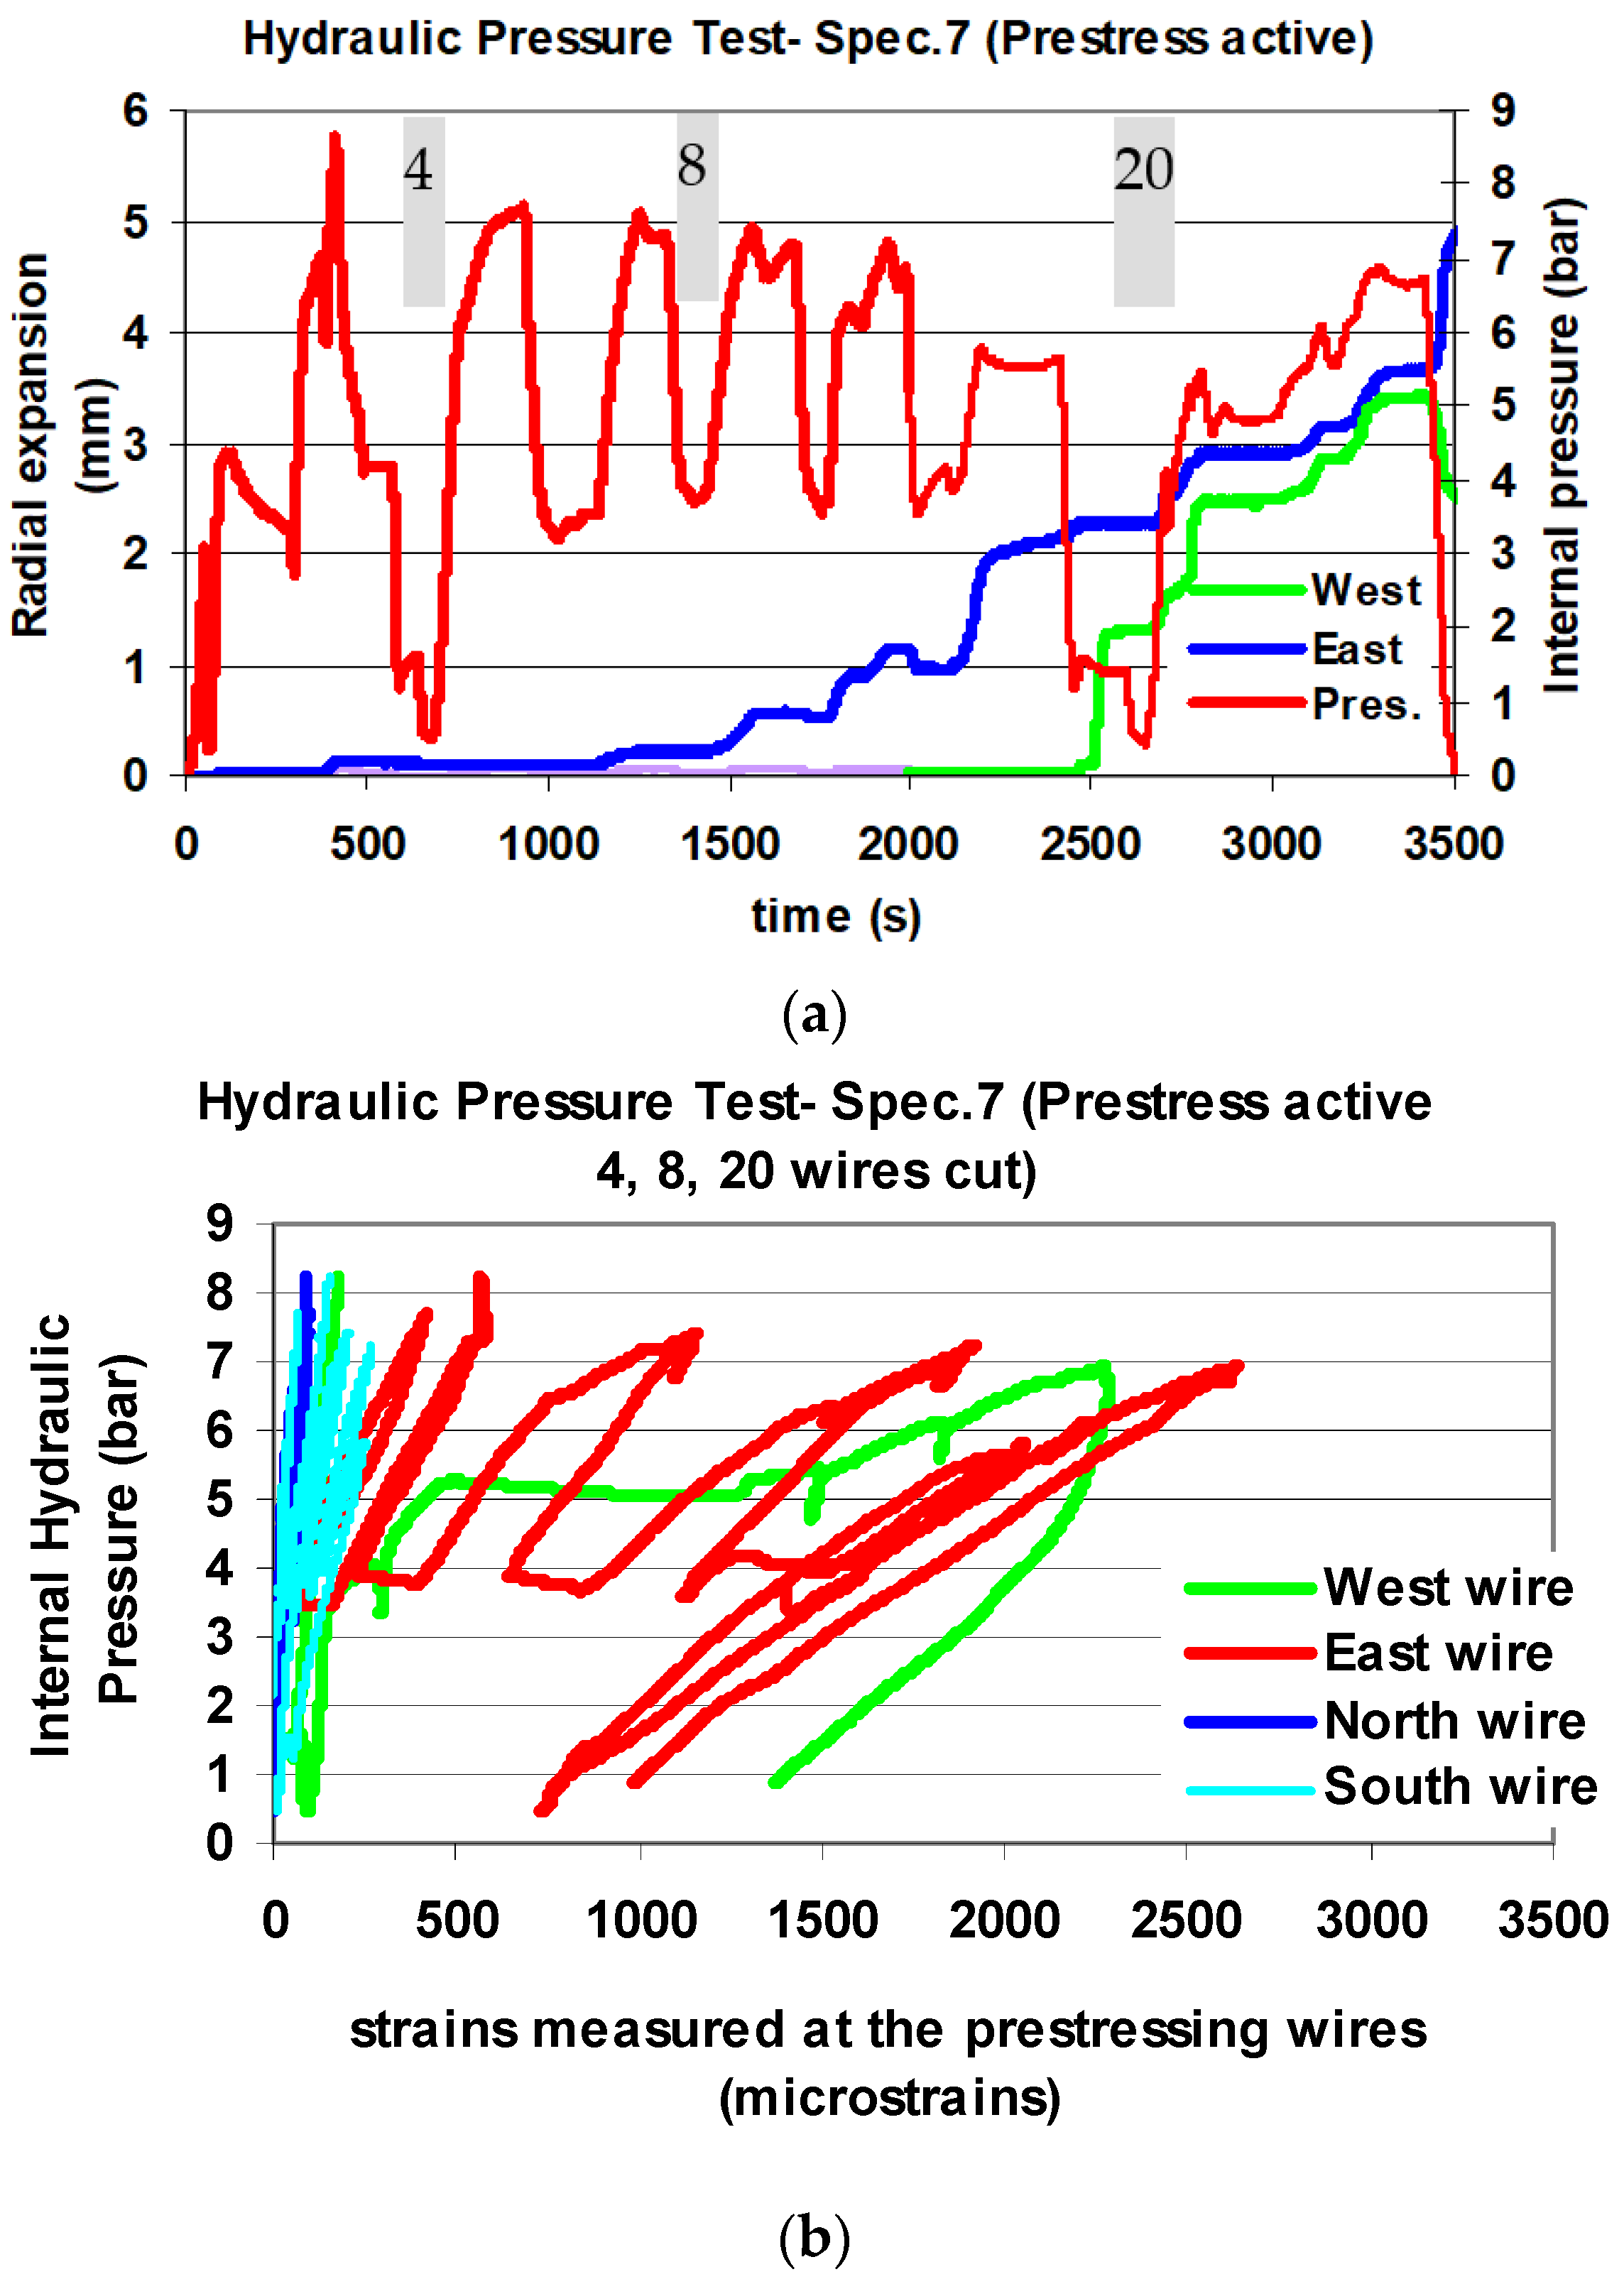
  • This simulated prestress defect was attempted for both the original pipe (Specimen 7) without any strengthening and for Specimen 5 strengthened with an internal FRP jacket. The simulated prestress defect was accomplished by sequentially cutting specific numbers (4, 8 and 20 prestressing wires) of specific prestressing wires, all at the same location (Eastern cross-section). For Specimen 7 (original pipe without strengthening), the radial expansion amplitude increased rapidly after eight prestressing wires were cut. When the number of cut wires reached 20, the measured radial expansion was equal to over 5 mm for an internal pressure amplitude equal to 6.7 bar, a pressure level considerably smaller than the set limit pressure of 8.5 bar. On the contrary, for Specimen 5 (with an internal CFRP jacket) with 20 prestressing wires cut, the radial expansion reached only 1.4 mm for an internal pressure amplitude equal to 10.0 bar, a pressure that is larger than the set pressure limit. The radial expansion remained smaller than 1.0 mm when the number of cut wires was equal to eight (8) or less, although the internal pressure amplitude was kept above 10 bar. Therefore, it can be concluded that the internal CFRP jacket can withstand the set pressure limit for a prestress defect corresponding to the one simulated in the laboratory. Damage patterns at the end of the test sequence are shown in Figure 25a–e.
  • Although the simulated prestress defect was tested for the strengthening scheme with an internal CFRP jacket, it could be argued that all three strengthening schemes could perform similarly and thus satisfy the set requirements of withstanding the set upper internal hydraulic pressure limit, even for a relatively minor prestressing defect. In any case, the extent and the degree of such a prestressing wire defect should be quantified by appropriate in situ techniques prior to applying any strengthening scheme to the pipeline in question. Moreover, the choice of the strengthening scheme should also use, apart from the bearing capacity values determined in the current investigation, additional criteria based on durability, cost and operational requirements of the water network that the pipeline in question belongs to.

7. Conclusions

Provided that the prestressing wires are fully active according to design specifications, the original specimen performed satisfactorily for the set internal hydraulic pressure limit of 8.5 bar.
Specimens retrofitted with jacketing performed satisfactorily for internal hydraulic pressure levels well above this 8.5 bar limit.
A critical factor is, as expected, the loss of prestress, which may occur for several reasons. When testing a specimen that intentionally had all prestressing wires removed, it was recorded that concrete cracking commenced at an internal hydraulic pressure just above 2.0 bar, and the steel membrane yielded at an internal hydraulic pressure just above the 4.5 bar level.
An effort was made to simulate a prestress defect by sequentially intentionally removing a number of prestressing wires in two specimens for which this was possible. This was carried out after these specimens were tested with all prestressing wires fully active. One such specimen represented the pipe in its original form, and the other represented the pipe retrofitted with an internal CFRP jacket. It was shown that such a simulated prestress defect noticeably reduced the internal hydraulic pressure capacity below the 8.5 bar limit for the original pipe without a jacket, whereas the presence of the internal CFRP jacket was somewhat instrumental in keeping the internal hydraulic pressure capacity above this 8.5 bar limit.
All used retrofitting schemes were shown to be satisfactory in upgrading the hydraulic internal bearing capacity. This study was limited to presenting the fundamentals of the structural performance of the studied retrofitting schemes and did not extend to examining issues of durability and construction costs, which can influence the final selection process for retrofitting such a water pipeline.
This study did not simulate the effect of the internal hydraulic pressure on amplifying concrete cracking after its initial formation. The presence of the internal plastic membrane could inhibit, up to a certain degree, this effect in all of the tested specimens except for Specimen 5, which already had an internal CFRP jacket.
Finally, it must be underlined that the current study did not examine any performance acceptance criteria that were based on the possibility of the initiation and spreading of leakage under the considered internal hydraulic pressure levels. Obviously, the amplitude of the radial expansion can be used for this purpose.

Author Contributions

Conceptualization, G.M., K.K. and V.S.; methodology, G.M., K.K. and V.S.; software, G.M., K.K. and L.M.; validation, G.M., K.K. and L.M.; formal analysis, G.M., K.K. and L.M.; investigation, G.M., K.K., V.S., L.M. and V.B.; resources, K.K., V.S. and V.B.; data curation, G.M., K.K. and L.M.; writing—original draft preparation G.M., K.K., V.S. and L.M.; writing—review and editing, G.M. and L.M.; visualization, G.M., K.K., L.M. and V.S.; supervision, G.M. and K.K.; project administration, K.K., V.S. and V.B.; funding acquisition, V.S. and V.B. All authors have read and agreed to the published version of the manuscript.

Funding

This research was partially funded by EBLEKTON Consulting Engineers.

Acknowledgments

The valuable technical support of the personnel of Athens Water Supply and Sewerage Company, especially the Director of Water Intake, Aggeliki Christoforou, and the Supervisor Engineer, George Antonakopoulos, is gratefully acknowledged. The excellent assistance of all personnel of the Laboratory of Strength of Materials and Structures of Aristotle University, especially V. Kourtidis and T. Koukouftopoulos, is also acknowledged.

Conflicts of Interest

The authors declare no conflict of interest.

References

  1. Romer, A.E.; Ellison, D.; Bell, G.E.C.; Clark, B. Failure of Prestressed: Concrete Cylinder Pipe; AWA Research Foundation: Washington, DC, USA, 2008. [Google Scholar]
  2. Roberto Gomez, R.; Muñoz, D.; Vera, R.; Escobar, J.A. Structural Model for Stress Evaluation of Pre-Stressed Concrete Pipes of the Cutzamal System; Pipeline Division Specialty Congress; ASCE: Reston, VA, USA, 2004. [Google Scholar] [CrossRef]
  3. Perrin, M.; Gaillet, L.; Tessier, C.; Idrissi, H. Hydrogen embrittlement of prestressing steel. Corros. Sci. 2010, 52, 1915–1926. [Google Scholar] [CrossRef]
  4. Price, R.E. The Investigation Cause and Prevention of PCCP Failures. J. AWWA 1990, 82, 663–681. [Google Scholar]
  5. Price, R.E.; Lewis, R.A.; Erlin, B. Effects of Environment on the Durability of Prestressed Concrete Cylinder Pipe, Pipelines in the Constructed Environment; ASCE: Reston, VA, USA, 1998; pp. 584–593. [Google Scholar]
  6. Walsh, T.L.; Hodge, D.S. Overcoming the Challenges of Replacing 20 km of Defective 1524 mm Diameter PCCP, Pipelines in the Constructed Environment; ASCE: Reston, VA, USA, 1998; pp. 602–611. [Google Scholar]
  7. Ojdrovic, R.P.; Zarghamee, M.S.; Hegar, J.R.; Westman, T. Condition Assessment of a PCCP Line Accessible from Outside Only, Pipelines 2001-Advances in Pipeline Engineering & Construction; (CD-ROM); Castronov, J., Ed.; ASCE: Reston, VA, USA, 2001. [Google Scholar]
  8. Knowles, W.L.C. Failure of Prestressed Concrete Embedded Cylinder Pipe, Design and Installation; Kienow, K., Ed.; ASCE: New York, NY, USA, 1990; pp. 434–441. [Google Scholar]
  9. Galleher, J.J.; Stift, M.T. Internal Inspection and Database Development of PCCP, Pipelines in the Constructed Environment; ASCE: Reston, VA, USA, 1998; pp. 721–730. [Google Scholar]
  10. Parks, R.R.; Drager, J.K.; Ojdrovic, R.P. Condition Assessment and Rehabilitation of the Windy Gap Pipeline—An Owner’s Perspective, Pipelines 2001-Advances in Pipeline Engineering & Construction; (CD-ROM); Castronov, J., Ed.; ASCE: Reston, VA, USA, 2001. [Google Scholar]
  11. Rahman, S.; Smith, G.; Mielke, R.; Keil, B. Rehabilitation of Large Diameter PCCP: Relining and Slip-Lining with Steel Pipe, Pipelines 2012: Innovations in Design, Construction, Operations, and Maintenance—Doing More with Less ©; ASCE: Reston, VA, USA, 2012. [Google Scholar]
  12. Johannes, S. Hydraulic Analysis in Constant Flow and Unstable Flow (Water Hammer) with Estimation of Strength Limits of the Walls of the Connecting Pipe Klidi—Dafnoula, Report to EYDAP S.A; Democritus University of Thrace Report: Xanthi, Greece, 2009. (In Greek) [Google Scholar]
  13. American Water Works Association. AWWA M11 Steel Pipe—A Guide for Design and Installing; AWWA: Denver, CO, USA, 2004. [Google Scholar]
  14. Zarghamee, M.S.; Fok, K.L. Analysis of prestressed concrete pipe under combined loads. J. Struct. Eng. 1990, 116, 2022–2039. [Google Scholar] [CrossRef]
  15. Zarghamee, M.S.; Heger, F.J.; Dana, W.R. Experimental evaluation of design methods for prestressed concrete pipe. J. Transp. Eng. 1988, 114, 635–655. [Google Scholar] [CrossRef]
  16. Zarghamee, M.S. Evaluation of Combined Load Tests of Prestressed Concrete Cylinder Pipe; Pipeline Design and Installation; ASCE: Reston, VA, USA, 1990. [Google Scholar]
  17. Zarghamee, M.S.; Ojdrovic, R.P. Risk assessment and repair priority of PCCP with broken wires. In Proceedings of the ASCE Pipeline Division Specialty Conference, San Diego, CA, USA, 15–18 July 2001; ASCE: Reston, VA, USA, 2001; pp. 1–8. [Google Scholar]
  18. Zarghamee, M.S.; Engindeniz, M.; Wang, N. Report CFRP Renewal of Prestressed Concrete Cylinder Pipe; Web Report #4352; Water Research Foundation: Denver, CO, USA, 2013; Available online: https://www.waterrf.org/system/files/resource/2019-07/INFR1SG09d-4352.pdf (accessed on 1 May 2022).
  19. Lee, D.C.; Karbhari, V.M. Rehabilitation of Large Diameter Prestressed Cylinder Concrete Pipe (PCCP) with FRP Composites—Experimental Investigation. Adv. Struct. Eng. 2005, 8, 31–44. [Google Scholar] [CrossRef]
  20. Wong, L.S.; Nehdi, M.L. Critical Analysis of International Precast Concrete Pipe Standards. Infrastructures 2018, 3, 18. [Google Scholar] [CrossRef]
  21. Cheng, B.; Dou, T.; Xia, S.; Zhao, L.; Yang, J.; Zhang, Q. Mechanical properties and loading response of pre-stressed concrete cylinder pipes under internal water pressure. Eng. Struct. 2020, 216, 110674. [Google Scholar] [CrossRef]
  22. Cheng, B.; Dou, T.; Xia, S.; Zhao, L.; Yang, J.; Zhang, Q. Experimental study on mechanical properties of pre-stressed concrete cylinder pipes (PCCPs) under external load. Int. J. Press. Vessel. Pip. 2021, 191, 104365. [Google Scholar] [CrossRef]
  23. Zhai, K.; Fang, H.; Guo, C.; Ni, P.; Wu, H.; Wang, F. Full-scale experiment and numerical simulation of prestressed concrete cylinder pipe with broken wires strengthened by prestressed CFRP. Tunn. Undergr. Space Technol. 2021, 115, 104021. [Google Scholar] [CrossRef]
  24. Zhao, L.; Dou, T.; Cheng, B.; Xia, S.; Yang, J.; Zhang, Q.; Li, M.; Li, X. Experimental Study on the Reinforcement of Pre-stressed Concrete Cylinder Pipes with External Prestressed Steel Strands. Appl. Sci. 2019, 9, 149. [Google Scholar] [CrossRef] [Green Version]
  25. Zhang, Y.; Yan, Z.G.; Zhu, H.H.; Woody, J. Experimental study on the structural behaviors of jacking pre-stressed concrete cylinder pipe. Tunn. Undergr. Space Technol. 2018, 73, 60–70. [Google Scholar] [CrossRef]
  26. Xu, Z.; Feng, X.; Zhong, S.; Wu, W. Surface Crack Detection in Prestressed Concrete Cylinder Pipes Using BOTDA Strain Sensors. Hindawi Math. Probl. Eng. 2017, 2017, 9259062. [Google Scholar] [CrossRef] [Green Version]
  27. Doanides, P.J. Reinforced and Prestressed Concrete Pipes for the Water Supply of Greater Teheran. Betonstein-Zeitung, 1965. [Google Scholar]
  28. Ministry of Public Works, Approval of Specification for Reinforced Concrete Pipes for Conveyance of Domestic Sewage, Industrial Waste and Stormwater. Greek Government Gazette. 253/Β/1984. 1984. Available online: http://www.et.gr/api/DownloadFeksApi/?fek_pdf=19840200253 (accessed on 21 August 2022). (In Greek).
Figure 1. The various types of tested pipe specimens. (a) Original pipe with fully active prestressing wires, (b) Original pipe. Prestressing wires re-moved, (c) Original pipe. Prestressing wires removed, (d) External RC Jacket, (e) Internal CFRP jacket and (f) External CFRP jacket.
Fibers 10 00071 g001
Figure 2. Cross-section of the original PCCP with fully active prestressing wires.
Fibers 10 00071 g002
Figure 3. Tensile behaviour of steel membrane coupons taken from tested pipe specimens.
Fibers 10 00071 g003
Figure 4. Tensile behaviour of prestressing wire specimens.
Fibers 10 00071 g004
Figure 5. Compressive behaviour of concrete core specimens taken from the tested PCCP pipes.
Fibers 10 00071 g005
Figure 6. Tensile behaviour of CFRP specimens taken from the tested PCCP pipes.
Fibers 10 00071 g006
Figure 7. Tensile behaviour of radial reinforcing bar specimens taken from the tested PCCP pipes with the RC jacket.
Fibers 10 00071 g007
Figure 8. Cross-section of the PCCP pipe with active prestressing wires and external RC jacket.
Fibers 10 00071 g008
Figure 9. Cross-section of the PCCP pipe with active prestressing wires and external CFRP layers.
Fibers 10 00071 g009
Figure 10. Cross-section of the PCCP pipe with active prestressing wires and internal CFRP layers.
Fibers 10 00071 g010
Figure 11. Experimental set-up for testing the PCCP pipe specimens under a three-edge bearing loading arrangement.
Fibers 10 00071 g011
Figure 12. Summary of the measured load–displacement response obtained during 3EB-ASTM:C497 M-17 testing.
Fibers 10 00071 g012
Figure 13. (a) A cross-section of the loading arrangement perpendicular to the longitudinal axis of the pipe showing: (1) the 260 mm thick reaction cylinder in the interior (red colour) with internal and external radii of 580 mm and 840 mm, respectively. (2) The pipe specimens at the exterior (grey colour) with a thickness ranging from 100 mm to 200 mm. The gap in between (white colour) is filled with water under pressure. The indicated external diameter of 1080 mm represents the maximum possible value of the pipe diameter when reinforced with the external RC jacket. (b) A cross-section c-c of the loading arrangement of (a). (c) Experimental set-up for testing the PCCP pipe specimens under an internal hydraulic pressure loading arrangement.
Fibers 10 00071 g013aFibers 10 00071 g013b
Figure 14. Measured response for Specimen 10 without prestressing: (Left) average radial expansion of the pipe radius; (Right) radial strains of the steel membrane (1 bar = 0.1 N/mm2). Because the amplitude of the radial expansion for internal pressure above 2.8 bar recorded at two locations (East and South) for this specimen (Spec. 10) was found to contain erroneous readings, the plotted average radial expansion was based on readings taken at the other two locations (West and North).
Fibers 10 00071 g014
Figure 15. Measured response for Specimen 7 with fully active prestressing: (Left) average radial expansion of the pipe radius; (Right) radial strains of the prestressing wires (1 bar = 0.1 N/mm2).
Fibers 10 00071 g015
Figure 16. Measured response for Specimen 5 with fully active prestressing and an internal FRP jacket: (Left) average radial expansion; (Right) radial strains of the prestressing wires (1 bar = 0.1 N/mm2).
Fibers 10 00071 g016
Figure 17. Measured response for Specimen 3 with fully active prestressing and an external FRP jacket: (Left) average radial expansion; (Right) radial strains of the external FRP jacket (1 bar = 0.1 N/mm2).
Fibers 10 00071 g017
Figure 18. Measured response for Specimen 1 with fully active prestressing and an external RC jacket: (Left) average radial expansion of the pipe radius; (Right) radial strains of the radial reinforcing bars of the external RC jacket (1 bar = 0.1 N/mm2).
Fibers 10 00071 g018
Figure 19. Radial expansion versus internal hydraulic pressure response for all tested specimens.
Fibers 10 00071 g019
Figure 20. Typical cross-section of the pipe with prestressing wires.
Fibers 10 00071 g020
Figure 21. External façade of the pipe at the East cross-section before the 3EB test.
Fibers 10 00071 g021
Figure 22. Measured response of Specimen 8 with 16 prestressing wires neutralized by cutting.
Fibers 10 00071 g022
Figure 23. (a) Variation in radial expansion at East and West sections with the variation in internal pressure for the whole duration of the test. The time and the number of cut wires are also indicated with grey stripes. (b) Variation in wire radial strain versus internal pressure for the specimen with cut wires (4, 8 and 20).
Fibers 10 00071 g023
Figure 24. (a) Variation in the average radial expansion versus internal pressure for the whole duration of the test. The time and the number of cut wires are also indicated with the grey stripes. (b) Variation in wire radial strain versus internal pressure for the specimen with cut wires (4, 8 and 20). The time and the number of cut wires are also indicated with the grey stripes.
Fibers 10 00071 g024
Figure 25. (a) Specimen 1 with an external RC jacket and fully active prestressing wires after the internal hydraulic pressure test. Concrete micro-cracking visible at the internal concrete surface. (b) Specimen 3 with an external FRP jacket and fully active prestressing wires after the internal hydraulic pressure test. (c) Specimen 5 with internal FRP jacket and fully active prestressing wires after the internal hydraulic pressure test. Identified micro-cracking at the external concrete surface. (d) View from different sides of the external surface of Specimen 7 with fully active prestressing wires after the internal hydraulic pressure test. (e) Internal surface and concrete cracking of Specimen 10 with inactive prestressing wires.
Fibers 10 00071 g025aFibers 10 00071 g025b
Table 1. Description of the tested specimens.
Description of Tested Specimens and Code Names
Type of loadNeutralized
prestressed
original pipe
Fully active
prestressed original pipe
Fully active
prestressed with
internal CFRP jacket
Fully active
prestressed with
external CFRP jacket
Fully active
pre-stressed with
external RC jacket
Three-edge bendingSpec. 9
Ex-D = 1980 mm
In-D = 1790 mm
Spec. 8
Ex-D = 2100 mm
In-D = 1790 mm
Spec. 6
Ex-D = 2100 mm
In-D = 1790 mm
Spec. 4
Ex-D = 2100 mm
In-D = 1800 mm
Spec. 2
Ex-D = 2220 mm
In-D = 1790 mm
Internal pressureSpec. 10
Ex-D = 1980 mm
In-D = 1790 mm
Spec. 7
Ex-D = 2120 mm
In-D = 1800 mm
Spec. 5
Ex-D = 2100 mm
In-D = 1790 mm
Spec. 3
Ex-D = 2100 mm
In-D = 1800 mm
Spec. 1
Ex-D = 2220 mm
In-D = 1790 mm
Ex-D = External Diameter, In-D = Internal Diameter.
Table 2. Summary details of the original PCCP pipe and the relevant mechanical properties.
Pipe ParametersUnitsMeasurementSource
Pipe Type ECPEYDAP
Di = Internal diameter of the pipemm1800EYDAP
Earth cover depthm0.3048Assumed
Dy = Outside diameter of the steel cylindrical membranemm1980Measured
ty = Thickness of the steel membranemm1.5Laboratory testing
Steel membrane cylinder gauge 16
fyy = Steel membrane cylinder yield strengthMPa296.7Laboratory testing
hc = Thickness of the concrete coremm141.5Field measurements
fc = Concrete core compressive strengthMPa61.11Laboratory testing
hm = Minimum mortar coating thicknessmm47.5Field measurements
ds = Prestressing wire diametermm4Laboratory testing
Prestressing wire gauge 8
nw = Number of wraps per metre1/m54.4Field measurements
fsg = Wire wrapping stressMPa1370AWWA C304-07
fsu = Wire ultimate strengthMPa1756Laboratory testing
Prestressing wire class III
CFRP thickness per layer (total 3 layers)mm0.167SikaWrapp300C
CFRP sheet tensile strength (total 3 layers)MPa3129Laboratory testing
CFRP sheet Young’s modulus (total 3 layers)GPa250Laboratory testing
Sprayed concrete jacket—thicknessmm50Specified
Sprayed concrete compressive strengthMPa40Specified
Diameter of radial reinforcement of RC jacketmm14Laboratory testing
Yield stress of radial reinforcement of RC jacketMPa481.9Laboratory testing
Ultimate stress of radial reinf. of RC jacketMPa657.2Laboratory testing
Table 3. Measured extreme values obtained during 3EB-ASTM:C497 M-17 testing.
Code Name of SpecimenProperties of SpecimenVertical Load for Concrete Cracking Larger Than 0.3 mm (kN/m)Maximum Vertical Load (kN/m)Shortening of Vertical Diameter at Maximum Load (mm)Elongation of Horizontal Diameter at Maximum Load (mm)
(1)(2)(4)(5)(6)(7)
Spec. 2External RC jacket24044168−48
Spec. 4External jacket with 3 layers of CFRP210401142−90
Spec. 6Internal jacket with 3 layers of CFRP17530065−44
Spec. 8Active prestress17026775−55
Spec. 9Neutralized prestress257551−46
Table 4. Experimental results of internal pressure tests on five specimens (1 bar = 0.1 N/mm2).
Code
Name of
Specimen
Description
of
Specimen
Max.
Applied Pressure (bar)
Pressure at Change in Lateral
Stiffness * (bar)
Radial Expansion at Max. Pressure (mm)Radial Expansion at Change in Lateral Stiffness * (mm)Remaining Radius Expansion at Unloading ** (mm)
Spec. 10No
prestress
5.182.73.440.383.16
Spec. 7 Fully active prestress8.557.40.210.120.06
Spec. 5 Internal
FRP jacket
9.928.00.250.10.10
Spec. 3 External
FRP jacket
12.08.00.390.10.14
Spec. 1 External RC
jacket
22.7611.01.010.230.43
* The point of change in slope in the diagram of internal pressure–average expansion; ** when the load level reaches the highest value.
Publisher’s Note: MDPI stays neutral with regard to jurisdictional claims in published maps and institutional affiliations.

