Article

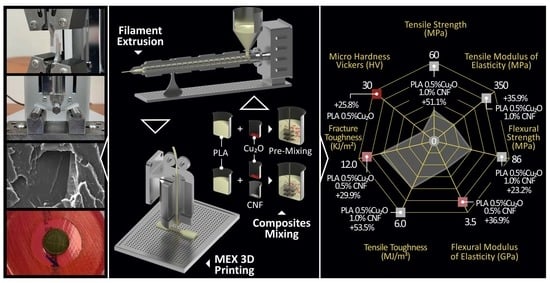
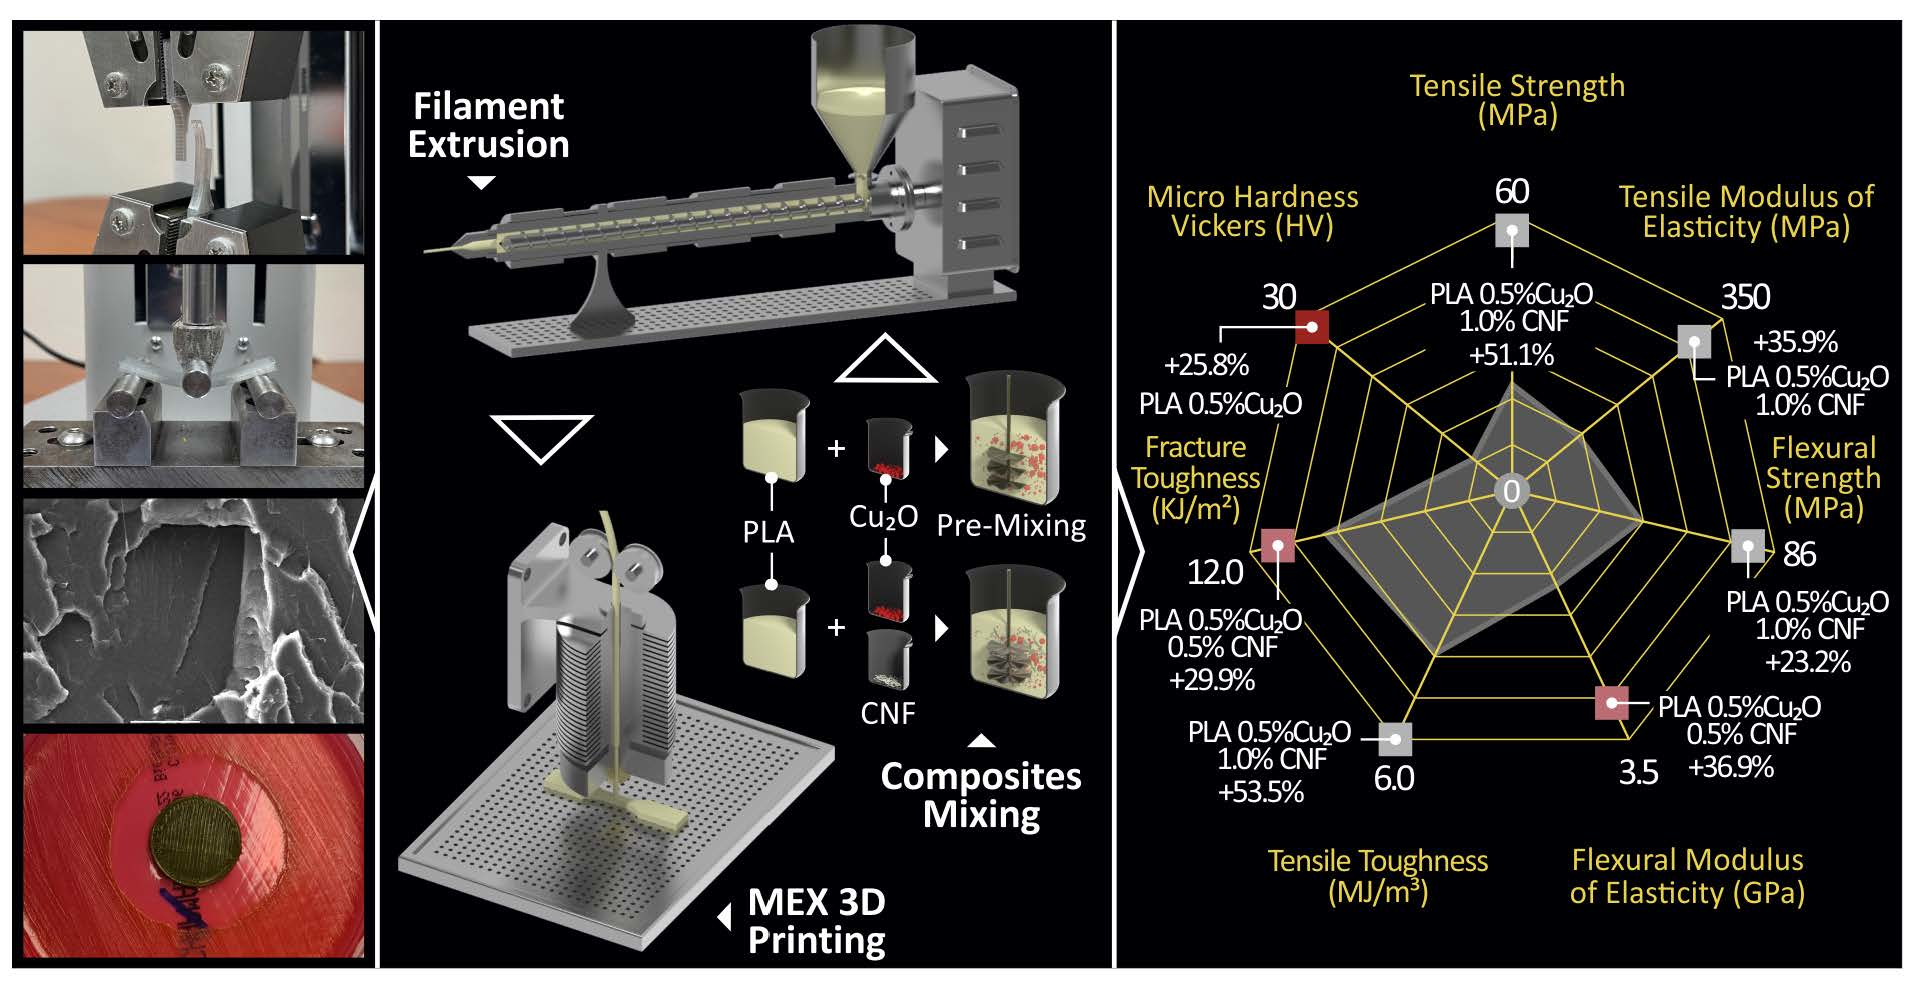
Multifunctional Material Extrusion 3D-Printed Antibacterial Polylactic Acid (PLA) with Binary Inclusions: The Effect of Cuprous Oxide and Cellulose Nanofibers

by
Markos Petousis
1,*,
Nectarios Vidakis
1,
Nikolaos Mountakis
1,
Vassilis Papadakis
2,
Sotiria Kanellopoulou
1,
Aikaterini Gaganatsiou
1,
Nikolaos Stefanoudakis
1 and
John Kechagias
3
1
Mechanical Engineering Department, Hellenic Mediterranean University, Estavromenos, 71410 Heraklion, Greece
2
Institute of Molecular Biology and Biotechnology, Foundation for Research and Technology—Hellas, P.O. Box 1527, GR-711 10 Heraklion, Greece
3
School of Technology, University of Thessaly, 43100 Karditsa, Greece
*
Author to whom correspondence should be addressed.
Fibers 2022, 10(6), 52; https://doi.org/10.3390/fib10060052
Submission received: 18 April 2022 / Revised: 7 June 2022 / Accepted: 8 June 2022 / Published: 10 June 2022
(This article belongs to the Collection Feature Papers in Fibers)

Abstract

:
In this work, we present an effective process easily adapted in industrial environments for the development of multifunctional nanocomposites for material extrusion (MEX) 3D printing (3DP). The literature is still very limited in this field, although the interest in such materials is constantly increasing. Nanocomposites with binary inclusions were prepared and investigated in this study. Polylactic acid (PLA) was used as the matrix material, and cuprous oxide (Cu2O) and cellulose nanofibers (CNF) were used as nanoadditives introduced in the matrix material to enhance the mechanical properties and induce antibacterial performance. Specimens were built according to international standards with a thermomechanical process. Tensile, flexural, impact, and microhardness tests were conducted. The effect on the thermal properties of the matrix material was investigated through thermogravimetric analysis, and Raman spectroscopic analysis was conducted. The morphological characteristics were evaluated with atomic force microscopy (AFM), scanning electron microscopy (SEM), and energy-dispersive X-ray (EDS) analyses. The antibacterial performance of the prepared nanomaterials was studied against Staphylococcus aureus (S. aureus) and Escherichia coli (E. coli) bacteria, with a screening agar well diffusion method. All nanocomposites prepared exhibited biocidal properties against the bacteria tested. The tested PLA/1.0 CNF/0.5 Cu2O material had 51.1% higher tensile strength and 35.9% higher flexural strength than the pure PLA material.

Graphical Abstract

1. Introduction

Additive manufacturing is an increasingly used manufacturing process [1]. Several polymers are employed in the process for the manufacture of parts because they are easy to process, with low associated costs, resulting in extensive research in the field [1]. Current research is focused on the study of the mechanical properties polymers in various types of tests (tensile, flexural, and impact tests, among others) [2,3], the optimization of 3D printing parameters [4,5,6], and their sustainability [7,8], among others. To enhance the performance of polymers and to expand their functionality, additives are introduced in polymer matrices for the development of composites featuring advanced characteristics compared to pure polymers [9,10,11,12].
Polylactic acid (PLA) is a biocompatible and biodegradable thermoplastic polymeric material found in nature with higher mechanical strength than other thermoplastics [13], as well as ease of processing [14]. Due to its specifications, it is widely used in various types of applications, mainly in packaging, the food industry [15], and various types of medical applications, such as implants, scaffolds, sutures, membranes [16], tissue engineering, and drug delivery systems [17], among others. In such applications, the main advantages of polylactic acid include its biocompatibility, biodegradability, easy processing, and high mechanical strength compared to other polymers. As a matrix material, it has great potential in nanocomposite development because of the combination of properties such as biocompatibility, processability, and in situ hydrolytic degradation [18]. In Additive manufacturing (AM), it is the most popular material for material extrusion (MEX) 3D printing [19]. In 3D printing, polylactic acid has been thoroughly studied in the literature for its mechanical properties (tensile strength) [20,21,22,23,24], its surface and dimensional accuracy [25], its recycling behavior [26], its performance in medical applications [27,28], and as a matrix material in nanocomposites [29,30]. Additionally, it has been studied for its response in hybrid additive manufacturing (HAM) technology [31]. Copper (Cu) is a commonly used additive in polymers because it induces electrical [32] and antibacterial properties in matrix materials [33,34]. Its oxides, such as cuprous oxide (Cu2O), have also been used in 3D printing for the development of nanocomposites with multifunctional behavior and antibacterial properties, among others [35]. In MEX 3D printing, copper and its oxides have been mixed with PLA polymer for the development of composites for biomedical applications [36,37], electrical applications [37,38,39], and enhancement of mechanical properties [40,41,42]. Cellulose is an ecofriendly biomass material derived from plants. It is biodegradable and renewable [43,44]. Although cellulose does not possess antibacterial properties, it had been commonly used as a filler in various medical applications, enhancing the performance of metal additives [45]. In nanofiber form (cellulose nanofiber, CNF) it has been used in 3D printing as to enhance the mechanical properties of PLA and other polymers [46,47,48,49,50]. Additionally, research on mixing of PLA with cellulose in 3D printing has been focused on biocomposite development [51,52,53], medical treatment [54,55], and scaffolds with antimicrobial performance [56]. Still, no research is available in the literature that explores the combination of Cu2O and CNF nanofillers with a PLA matrix material to determine their effect on the specifications of the material. Cu2O is known for its antibacterial performance, as mentioned above, whereas CNF is popular in medical applications as an agent used to improve the antibacterial performance of the additives with such performance. CNF has also been used as an additive for the mechanical enhancement of materials. Therefore, to achieve multifunctional performance in nanocomposites with enhanced mechanical performance and antibacterial properties, these two fillers were combined in this work in the developed nanocomposites. The effect of CNF on the antibacterial performance of the nanocomposites was also investigated. Nanocomposites were prepared with various CNF loadings to investigate the possibility of CNF enhancing the medical performance of the Cu2O additive, as stated in the literature for other types of additives and matrix materials.
In this work, we explore the possibility and industrial merit of developing nanocomposites with multifunctional behavior with a rigorous and effective process that can be easily adapted to industrial environments. To that end, for the first time, the effect of binary inclusions, i.e., Cu2O and CNF in nanoscale form, in a PLA matrix was investigated. Moreover, binary inclusion nanomaterials were prepared for MEX 3D printing to consider the effect of 3D printing on their performance and expand their use into 3D printing, exploiting its advantages. The aim of the present study was to develop multifunctional nanocomposites with antibacterial behavior suitable for biomedical applications, such as parts for medical devices, fixtures, and tools requiring an enhanced mechanical response. Such materials have a high industrial potential for various types of applications, especially when 3D printing is the manufacturing process employed. Nanomaterials were prepared with a thermomechanical material extrusion process from raw materials in various concentrations, and specimens were 3D-printed following international standards for experimental investigation, i.e., American Society for Testing and Materials (ASTM) D638-02a for tensile tests, ASTM D790-14 for flexural tests, ASTM D6110-04 for the Charpy’s impact test, and ASTM E384-11 for Vickers’s microhardness measurements. We also assessed the thermal properties (degradation and degradation rate of the material vs. temperature) and spectroscopic response (Raman spectra) of the prepared nanocomposites. Their morphological characteristics were investigated with atomic force microscopy (AFM) (the surface roughness of the side surface of the produced filaments) and scanning electron microscopy (SEM) (structure of the side and the fracture surface of the 3D-printed tensile specimens). Finally, the antibacterial performance was investigated with a screening agar well diffusion process for Gram-negative Escherichia coli (E. coli) and Gram-positive Staphylococcus aureus (S. aureus). We found that binary inclusions further enhance the mechanical response of the matrix material compared to nanocomposites with only one of the tested two fillers. Saturation of the material was reached with the studied concentrations. All of the tested nanocomposites containing Cu2O filler showed a sufficient antibacterial performance against the tested bacteria, with the concentration of CNFs further enhancing this response.

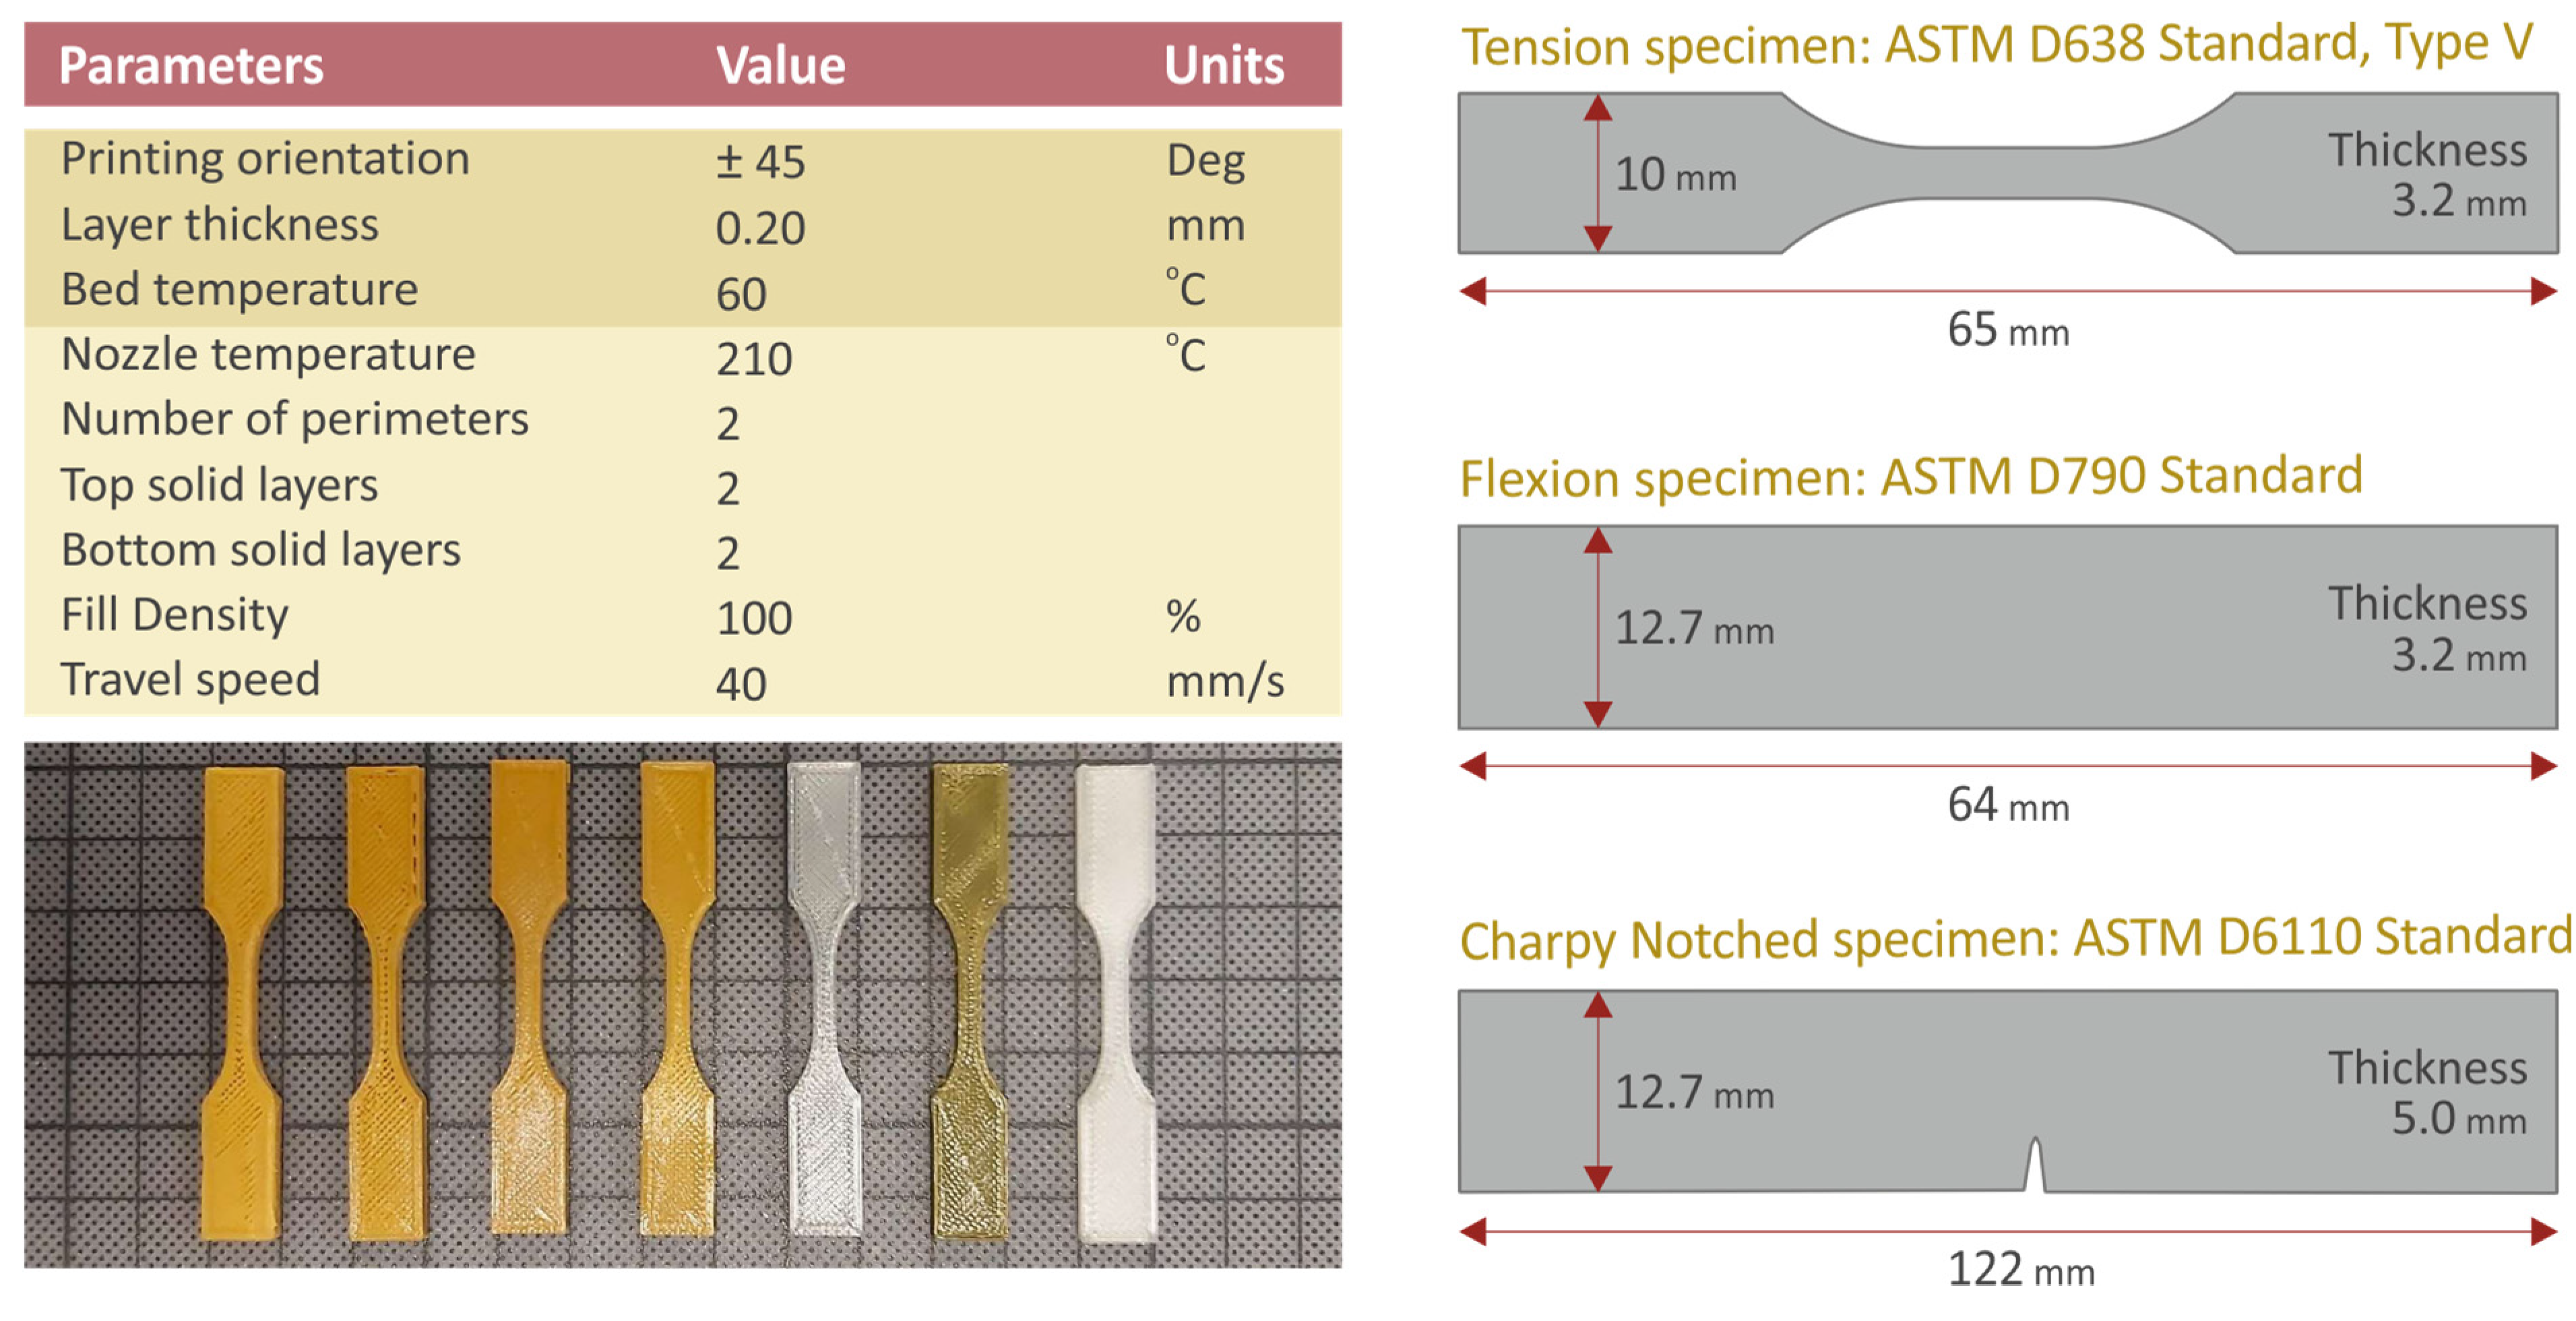
2. Materials and Methods
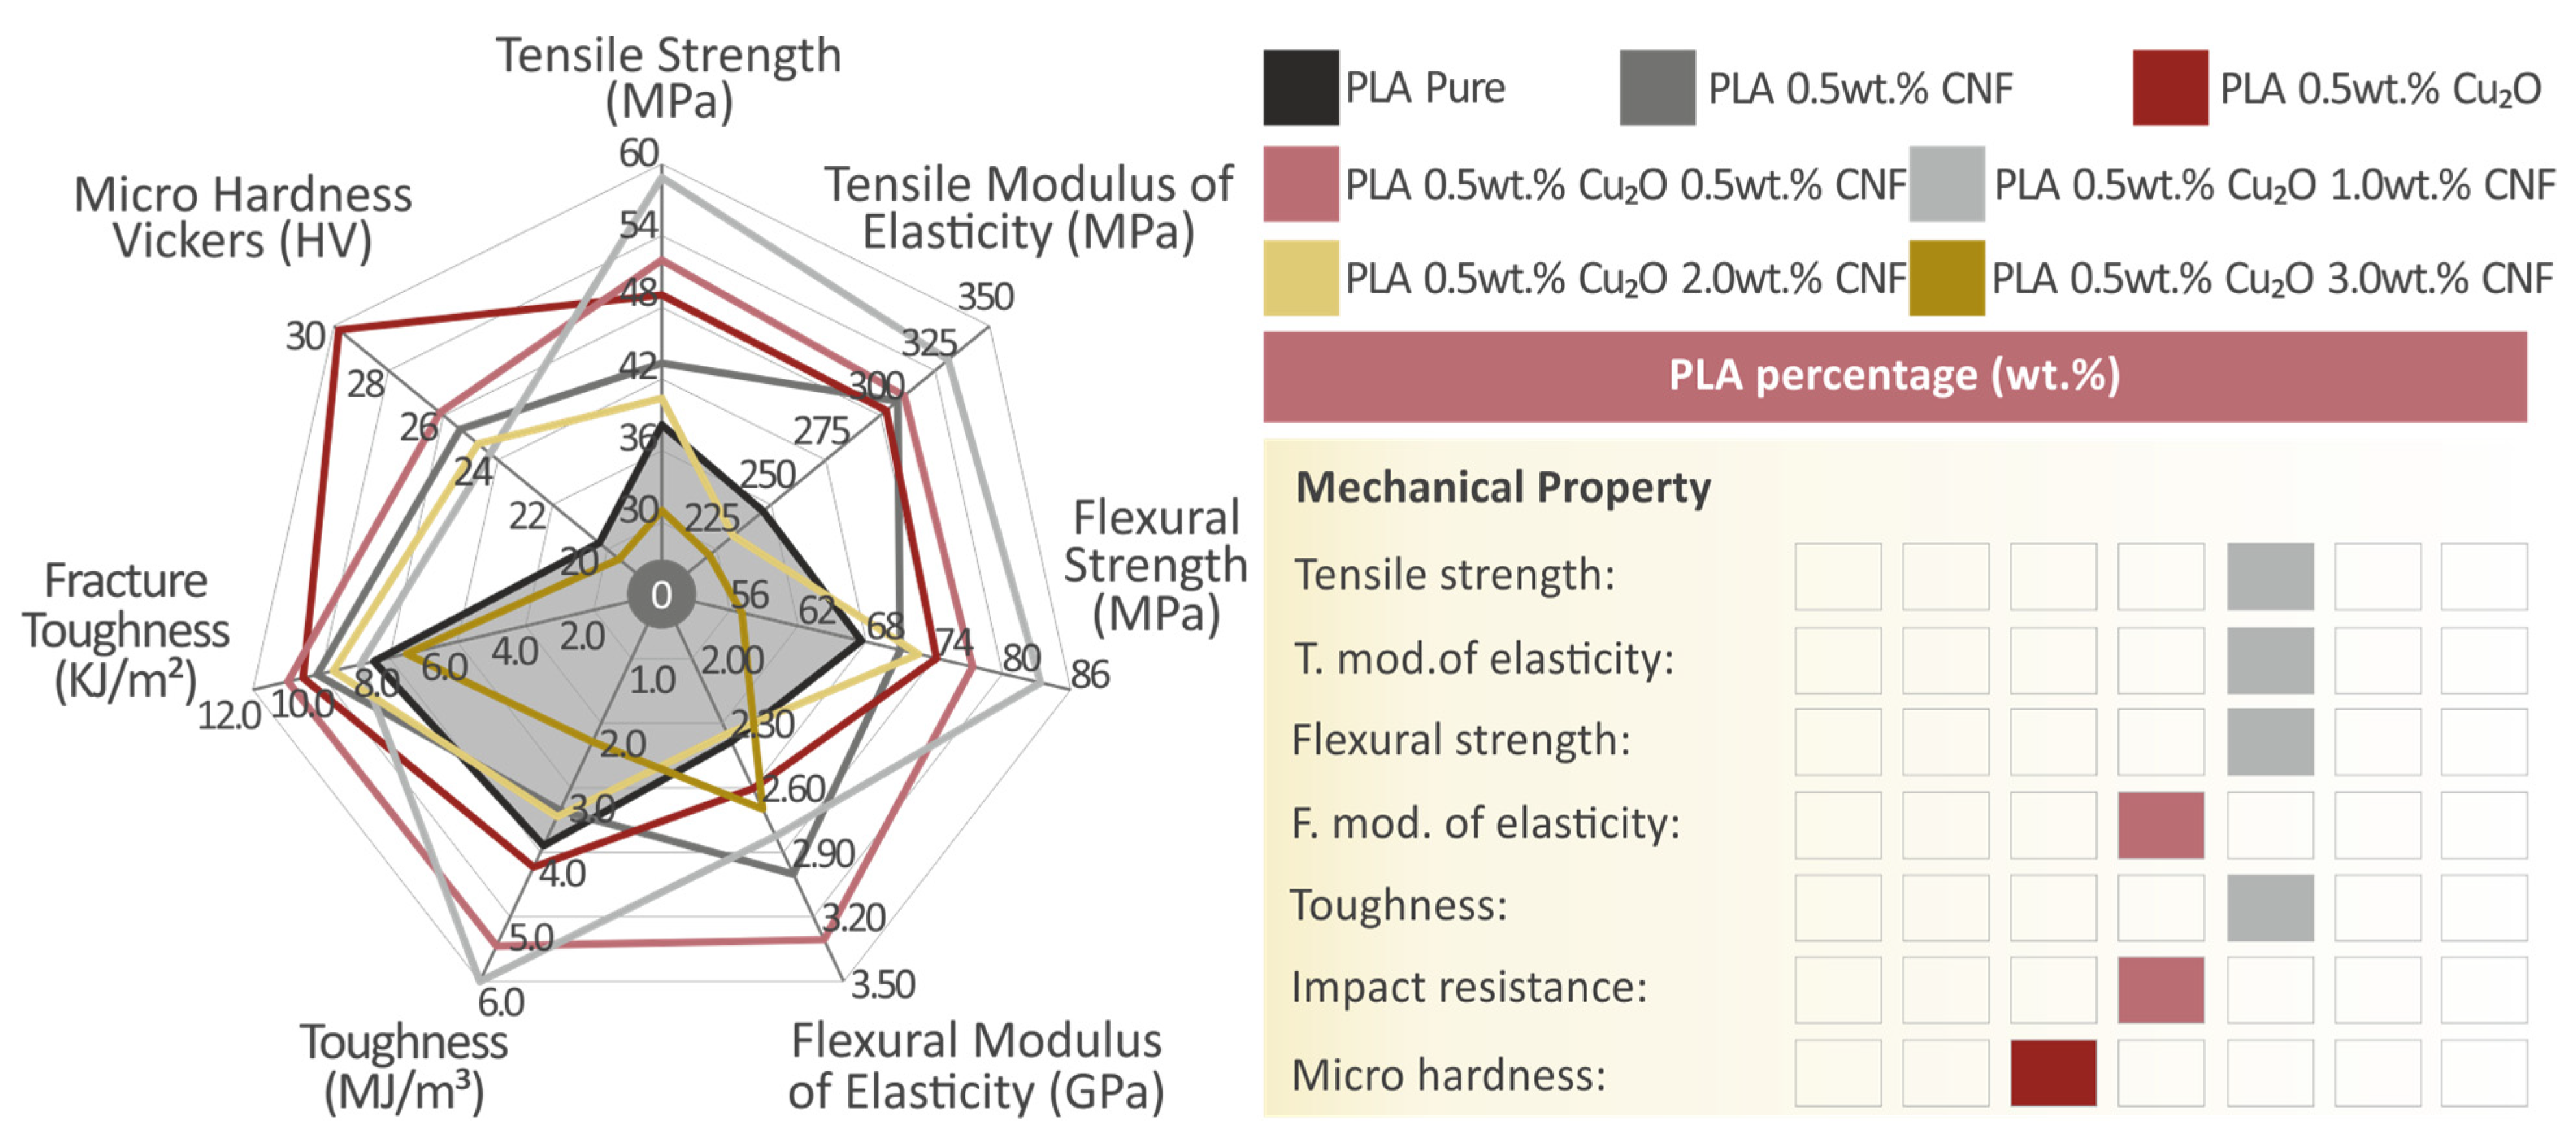
The process for the synthesis of the nanocomposites is summarized in Figure 1. Figure 1(1) presents the preparation of the raw materials, with weights and quantities, to achieve correct filler loadings in the nanocomposites. Figure 1(2) shows the filament preparation process in the filament extruder, with the filament coming out of the extruder and passing through the real-time filament diameter sensor and the extruder’s rollers. Figure 1(3) shows the drying process of the produced filament in a Memmert laboratory oven (Memmert GmbH, Schwabach, Germany). Figure 1(4) shows the 3D printing process with an Intamsys Funmat HT 3D printer (Intamsys Technology Co., Ltd., Shanghai, China). The 3D printer’s head is shown printing a tensile test specimen. The steps for the characterization of the prepared nanocomposites are presented in Figure 2. Figure 2(1) presents the instrument used to obtain the Raman spectra (LabRAM HR Raman Spectrometer). Figure 2(2) shows the TGA process on Perkin Elmer diamond instruments. Specifically, the weights of the device are shown. Figure 2(3) shows a tensile test on a 3D-printed specimen on the Imada MX2 (Imada Inc., Northbrook, IL, USA) instrument. The standardized grips of the instrument are shown, and the image was captured after failure of the specimen in the tensile test. Figure 2(4) shows the 3-point bending flexural test on a 3D-printed specimen on the Imada MX2 instrument (Imada Inc., Northbrook, Illinois, USA). Figure 2(5) shows the topography of a filament’s side surface captured in by atomic force microscopy (AFM) on a Microscope Solver P47H Pro device. Figure 2(6) shows a tensile test specimen fracture surface image at 5000× magnification acquired with scanning electron microscopy on a JEOL JSM 6362LV instrument. Figure 2(7) shows a Petri dish with a specimen inspected by an optical microscope during the agar well diffusion screening process. The bacterium cultures and the inhibition zone were observed with a microscope. Figure 2(8) shows the developed inhibition zone of a specimen tested with the agar well diffusion screening process.
For the preparation of the nanocomposites, raw materials were procured in powder form. More specifically, 3052D-grade (molecular weight, 116.000 g/mol,) PLA was procured from Kritis SA (Heraklion, Greece). Cu2O (average particle size, 80 nm; purity, 99.5%; melting point, 1240 °C) and CNFs (329 °C decomposition temperature, 1.50 g/cm3 density) were procured from Nanografi (Nanografi Inc., Ankara, Turkey). Materials were dried in a laboratory oven before they were mixed at the concentrations studied herein. More specifically, mixtures of PLA with one of the two fillers were prepared for comparison purposes, i.e., nanocomposites with PLA and 0.5 wt.% CNF and PLA with 0.5 wt.% Cu2O. These materials, along with the pure PLA polymer, were used as control samples for the study. Additionally, the effect of each filler in the PLA material was evaluated. Then, nanocomposites combining the two additives were prepared in order to evaluate the effect of binary inclusions in comparison with the control samples. The Cu2O loading was kept constant in all cases at 0.5 wt.%, and CNF was added at various concentrations, i.e., 0.5, 1.0, 2.0, and 3.0 wt.%, to evaluate the effect of CNF concentration in the nanocomposite. With this approach, the potential of CNF to enhance mechanical properties was assessed, along with its effect on improving the antibacterial performance of Cu2O in the nanocomposites.
The powder mixtures were fed into a Noztek Pro extrusion system (Noztek, Shoreham-by-Sea, UK) and processed at 180 °C as a first step for the dispersion of the additives in the nanocomposites. The produced filament was then shredded to pellets on a 3D Evo laboratory shredder (3D Evo B.V., Utrecht, The Netherlands). The pellets were then fed into a 3D Evo 450 composer single-screw extruder (3D Evo B.V., Utrecht, The Netherlands), which is suitable for 1.75 mm diameter filament production for MEX 3D printing. It also features a special screw design for polymers and additive mixing, according to the manufacturer. Materials without CNFs were processed at the following temperatures: 180 °C in heating zone 1, closer to the nozzle; 190 °C in heating zone 2; 185 °C in heating zone 3; and 180 °C in heating zone 4, closer to the hopper. Materials with CNFs were processed at the following temperatures: 190 °C in heating zone 1, closer to the nozzle; 190 °C in heating zone 2; 185 °C in heating zone 3; and 185 °C in heating zone 4, closer to the hopper. Along with the nanocomposites, pure PLA filament was also produced for comparison purposes. The temperatures in the filament extruders were adjusted based on experimental data determined before the production of the filament for this work.
The filament was evaluated for its thermal properties, its surface morphology, and its spectroscopic response. The thermal properties were determined through thermogravimetric analysis (TGA) (temperature range of 40 °C to 550 °C, temperature ramp of 10 °C/min) on a Perkin Elmer Diamond TGA/DTGA (Waltham, MA, USA) apparatus. The surface morphology of the filament was evaluated with atomic force microscopy (AFM). A P47H Pro microscope solver (NT-MDT, Moscow, Russia) apparatus was used, and the surface roughness of the side of the filament was measured. The identification of the surface roughness on the side of the filament with AFM is an index related to the quality of the extrusion process and the effect of the filler loading increase. The surface roughness value measurement in each filament cannot be utilized by itself, but the change in this value with variation of the filler and its loading is an indication of the extrusion process. The filament produced for the MEX 3D printing process is measured for its diameter, which has to be as close as possible to 1.75 mm in this study; however, this by itself is not enough for efficient 3D printing. The surface quality of the filament should also be satisfactory for extrusion to be possible.
Raman measurements were performed with a modified LabRAM HR Raman spectrometer (HORIBA Scientific, Kyoto, Japan). Raman excitation was achieved with a 532 nm central wavelength solid-state laser module with a maximum laser output power of 90 mW. The microscope was coupled with a 50× microscopic objective lens with a 0.5 numerical aperture and a 10.6 mm working distance (LMPlanFL N, Olympus) that delivered the excitation light and collected the Raman signals. A neutral density filter of 5% transmittance was used, which resulted in 2 mW of power on the sample. The laser spot size was proximately 1.7 μm laterally and about 2 μm axially. Grating of 600 groves was used, resulting in a Raman spectral resolution of around 2 cm−1. The Raman spectral range was set in the range of 300 to 3100 cm−1, resulting in 2 optical windows per point. The acquisition time for each measurement was 10 s, with 5 accumulations at each point. Importantly, Raman spectroscopy shows whether new bonds are generated between the PLA and the additive materials. Such a bond could trigger studies regarding material strength improvement.
Afterward, the produced filament was used for specimen fabrication on an Intamsys Funmat HT MEX 3D printer (Intamsys Technology Co., Ltd., Shanghai, China) for mechanical characterization of the produced materials. The 3D printing settings and the produced specimen specifications followed the corresponding international standards, i.e., American Society for Testing and Materials (ASTM) D638-02a for the tensile tests, ASTM D790-14 for the flexural tests, ASTM D6110-04 for the Charpy’s impact test, and ASTM E384-11 for the Vickers’s microhardness measurements, as shown in Figure 3. Six specimens were manufactured in each mechanical test, and five were tested according to the standards (an extra specimen was prepared as a spare in case of a defective specimen).
The produced specimens were tested for determination of their mechanical response in tensile (ASTM D638 [57]), flexural (ASTM D790 [58]), and Charpy impact (ASTM D6110 [59]) tests. Tensile (Figure 2(3)) and flexural tests (Figure 2(4)) were carried out on an Imada MX2 (Imada Inc., Northbrook, IL, USA) apparatus with a suitable setup for each case (standard grips in the tensile tests and three-point bending with a 52 mm support span in the flexural tests), with 10 mm/min elongation speed. Impact tests were carried out on a Terco MT 220 (Terco AB, Kungens Kurva, Sweden) apparatus (initial hammer height, 367 mm). Additionally, the Vickers microhardness of the specimens was measured (ASTM E384 [60]) on an Innova Test 400-Vickers (Innova Test Europe BV, Maastricht, The Netherlands) apparatus (0.2 kg force scale, 10 s indentation, indenter apex angle of 136°). Scanning electron microscopy (SEM) was employed to reveal the morphological characteristics and the fracture mechanism of the specimens (Figure 2(6)), and images were captured at various magnifications on gold-sputtered specimens at 20kV. A JEOL JSM 6362LV apparatus (JEOL, Ltd., Tokyo, Japan) was used. Additionally, on the same apparatus, energy-dispersive x-ray spectroscopy (EDS) was applied to verify the elements in the nanocomposites by studying unsputtered specimens.
Finally, the antibacterial response of the nanocomposites was tested with a screening agar well diffusion process [61] for Gram-positive Staphylococcus aureus (S. aureus) and Gram-negative Escherichia Coli (E. coli) bacteria. Petri dishes (85 mm diameter) were procured that contained the bacterium growth agent, which differs for each bacterium. More specifically, Petri dishes with MC.2, C.010066 for E. coli and Chapman, C.010068 for S. aureus were used as bacterium growth agents. Initially, they were placed in a laboratory oven for about half an hour in order to remove any moisture. Each bacterium was acquired with a syringe and dissolved in a natural serum to create a bacterium solution. The concentration of the bacterium in the solution was sufficient (developing dense bacterium colonies as observed under an optical microscope) for the process, with the same concentration used for all tests performed. The solution was homogenized and then inspected optically. The specimens were numbered, with each number corresponding to a specific specimen, i.e., a specific material. Corresponding numbered specimens were also placed in the Petri dishes. The solution was placed in a test tube and acquired with a swab. With the swab, the bacterium solution was uniformly smeared in the bacterium growth agent in the Petri dishes. Specimens were placed on the Petri dishes with the corresponding number close to their center. The Petri dishes were placed in a laboratory oven for 24 h at 37 °C. The developed inhibition zones (IZs) were measured afterward using optical equipment, following the same process for each specimen.

3. Results

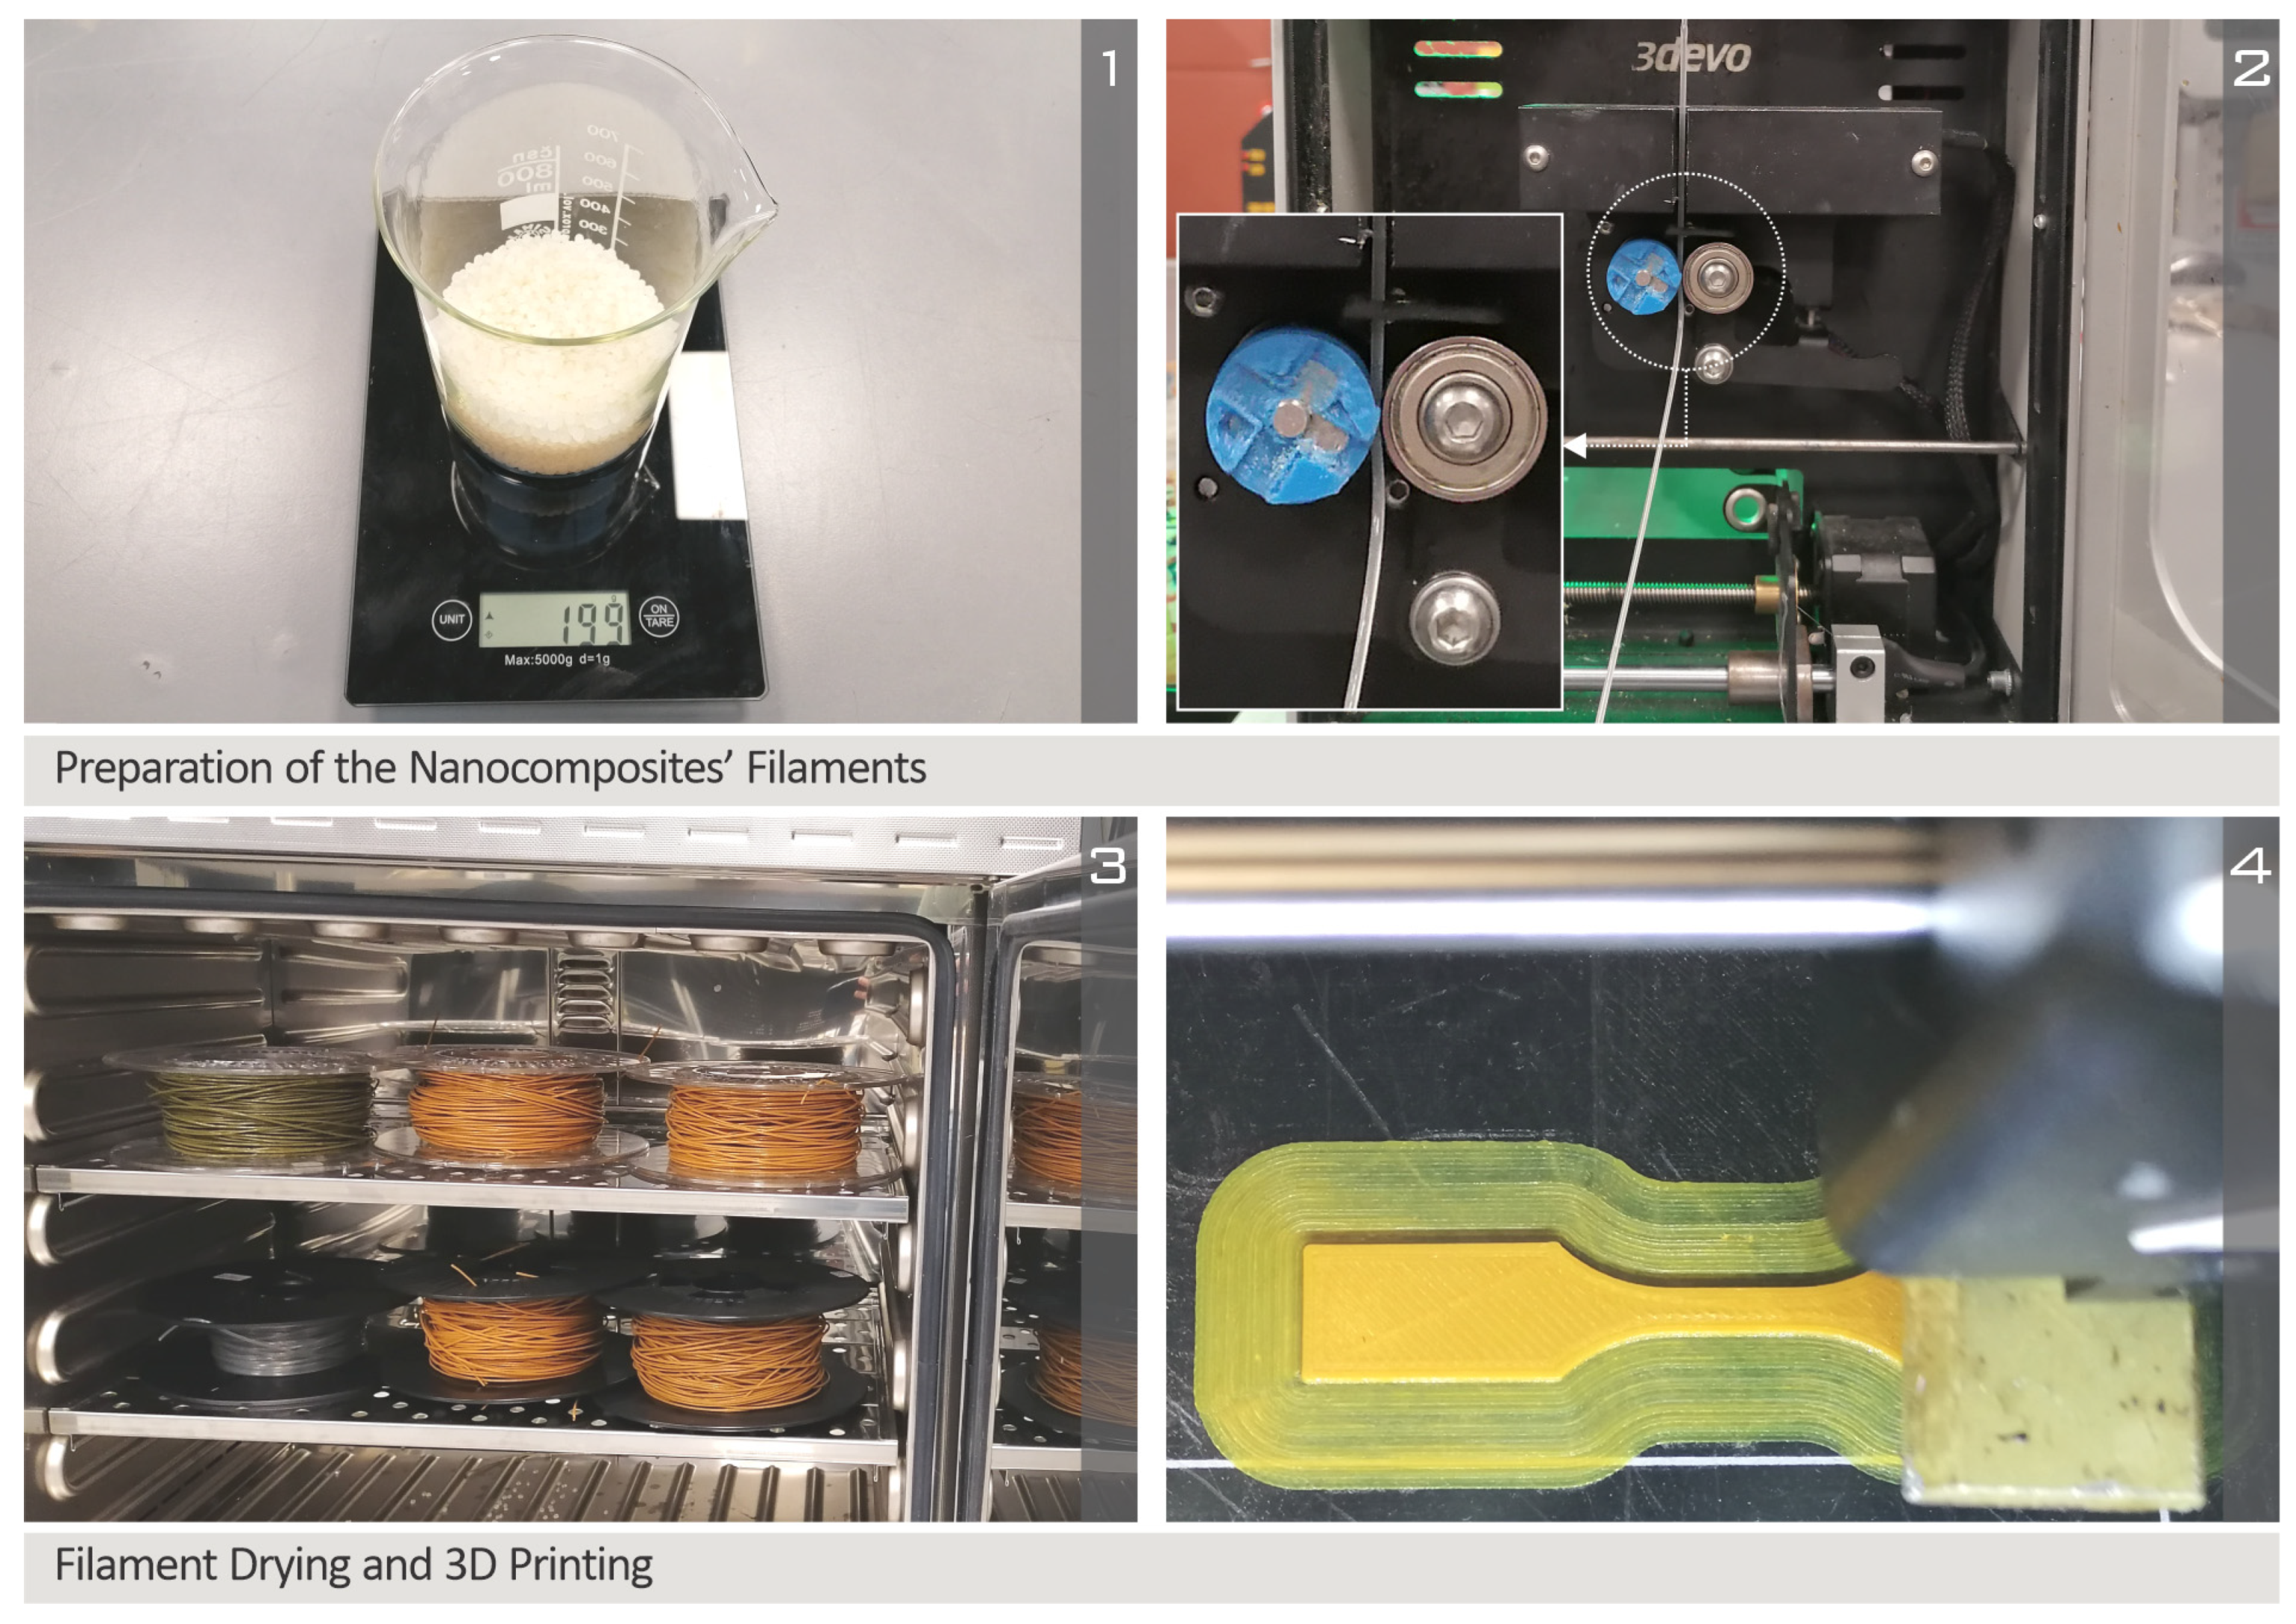
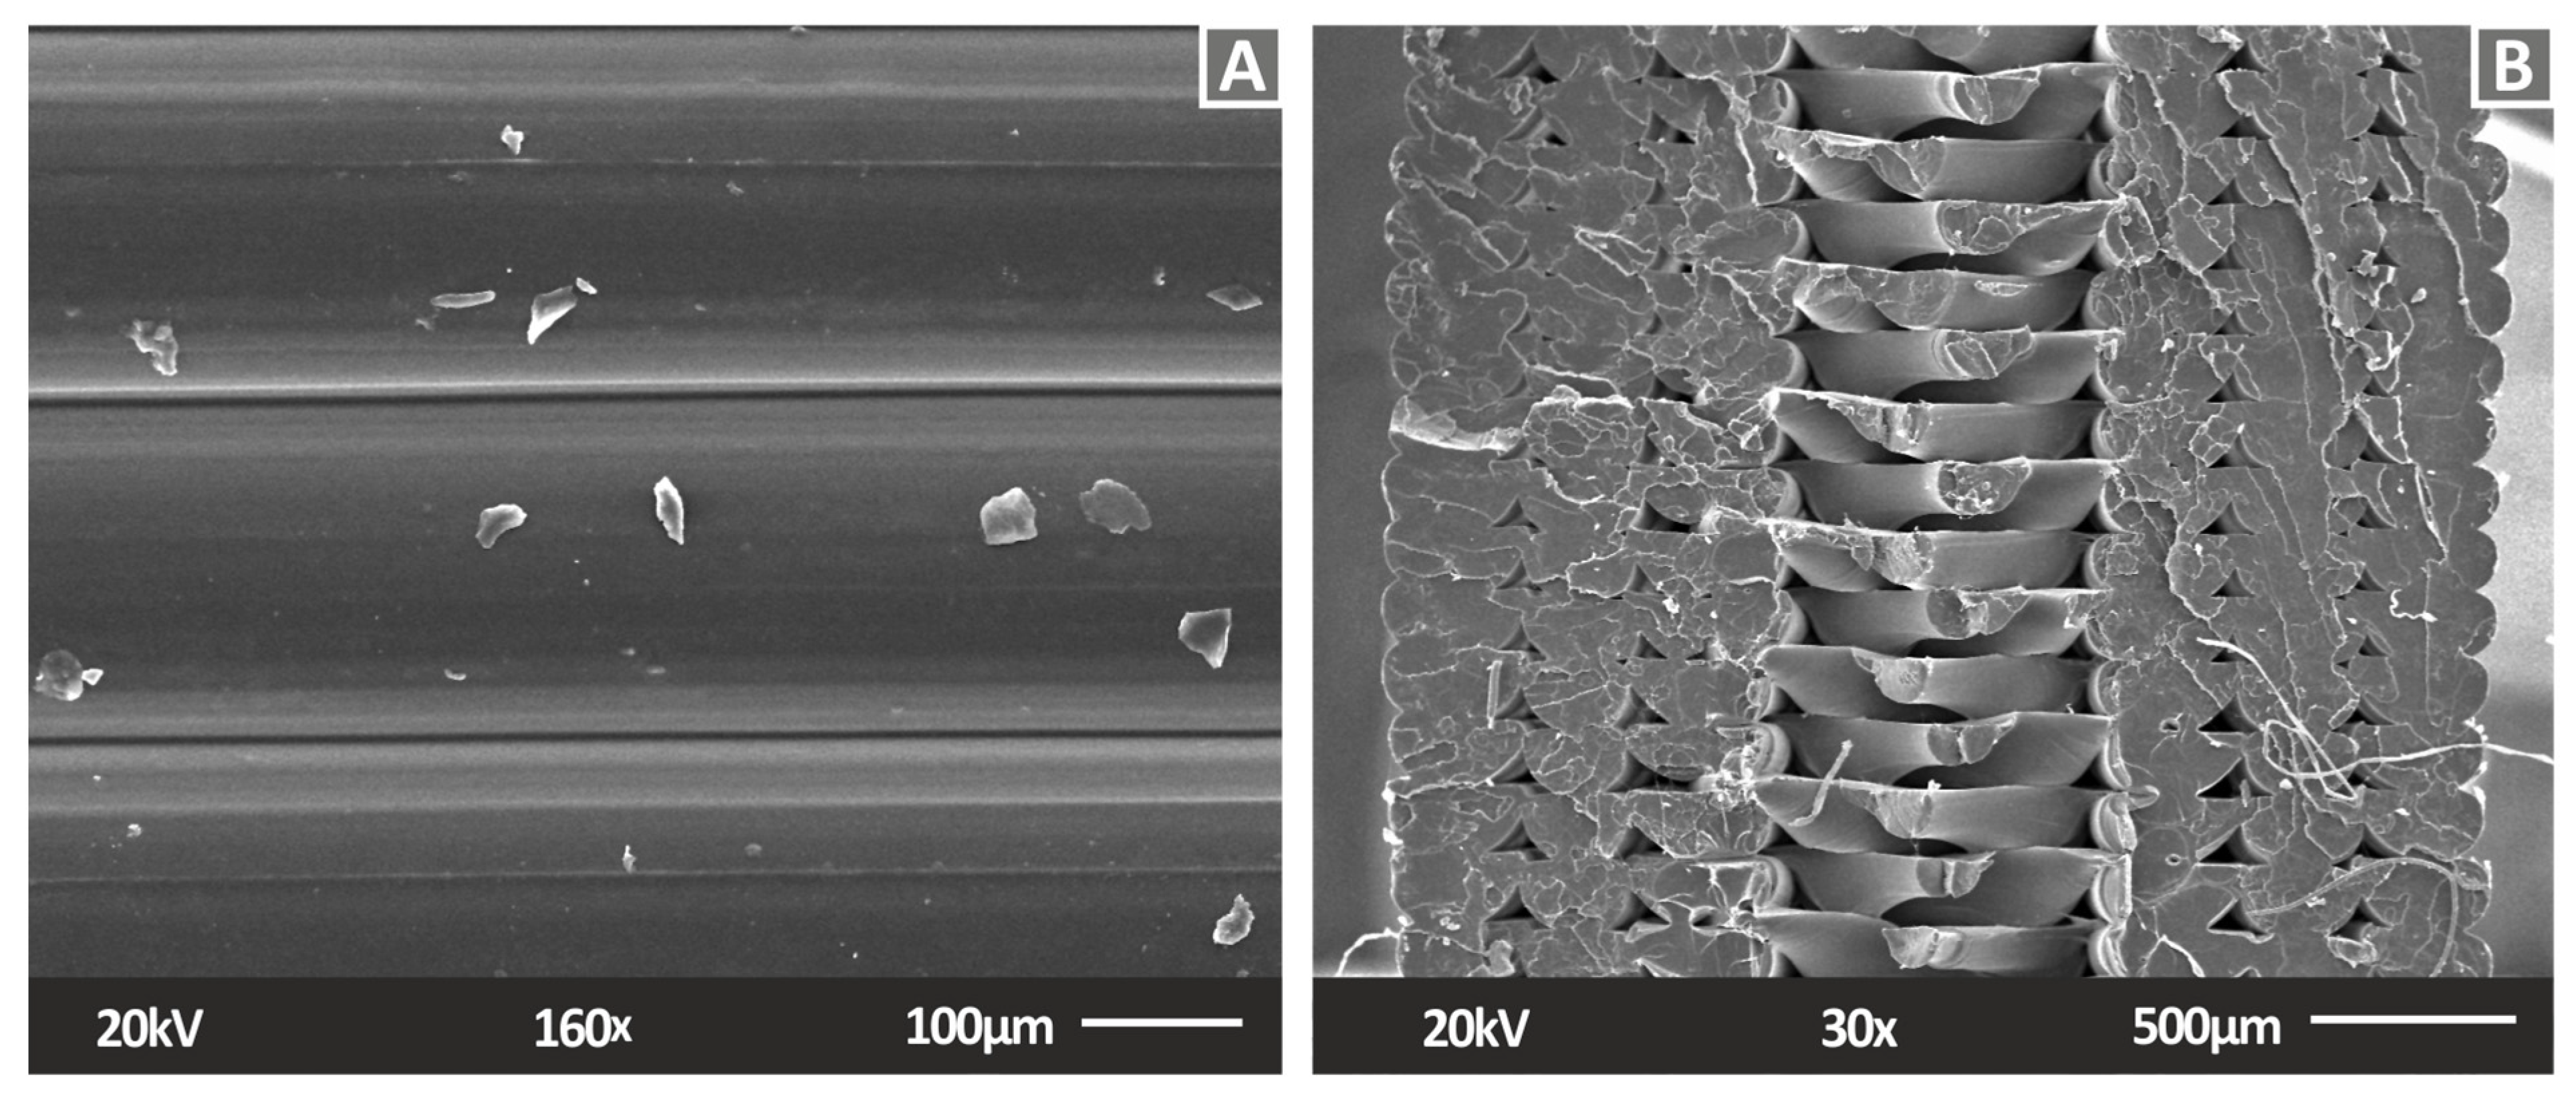
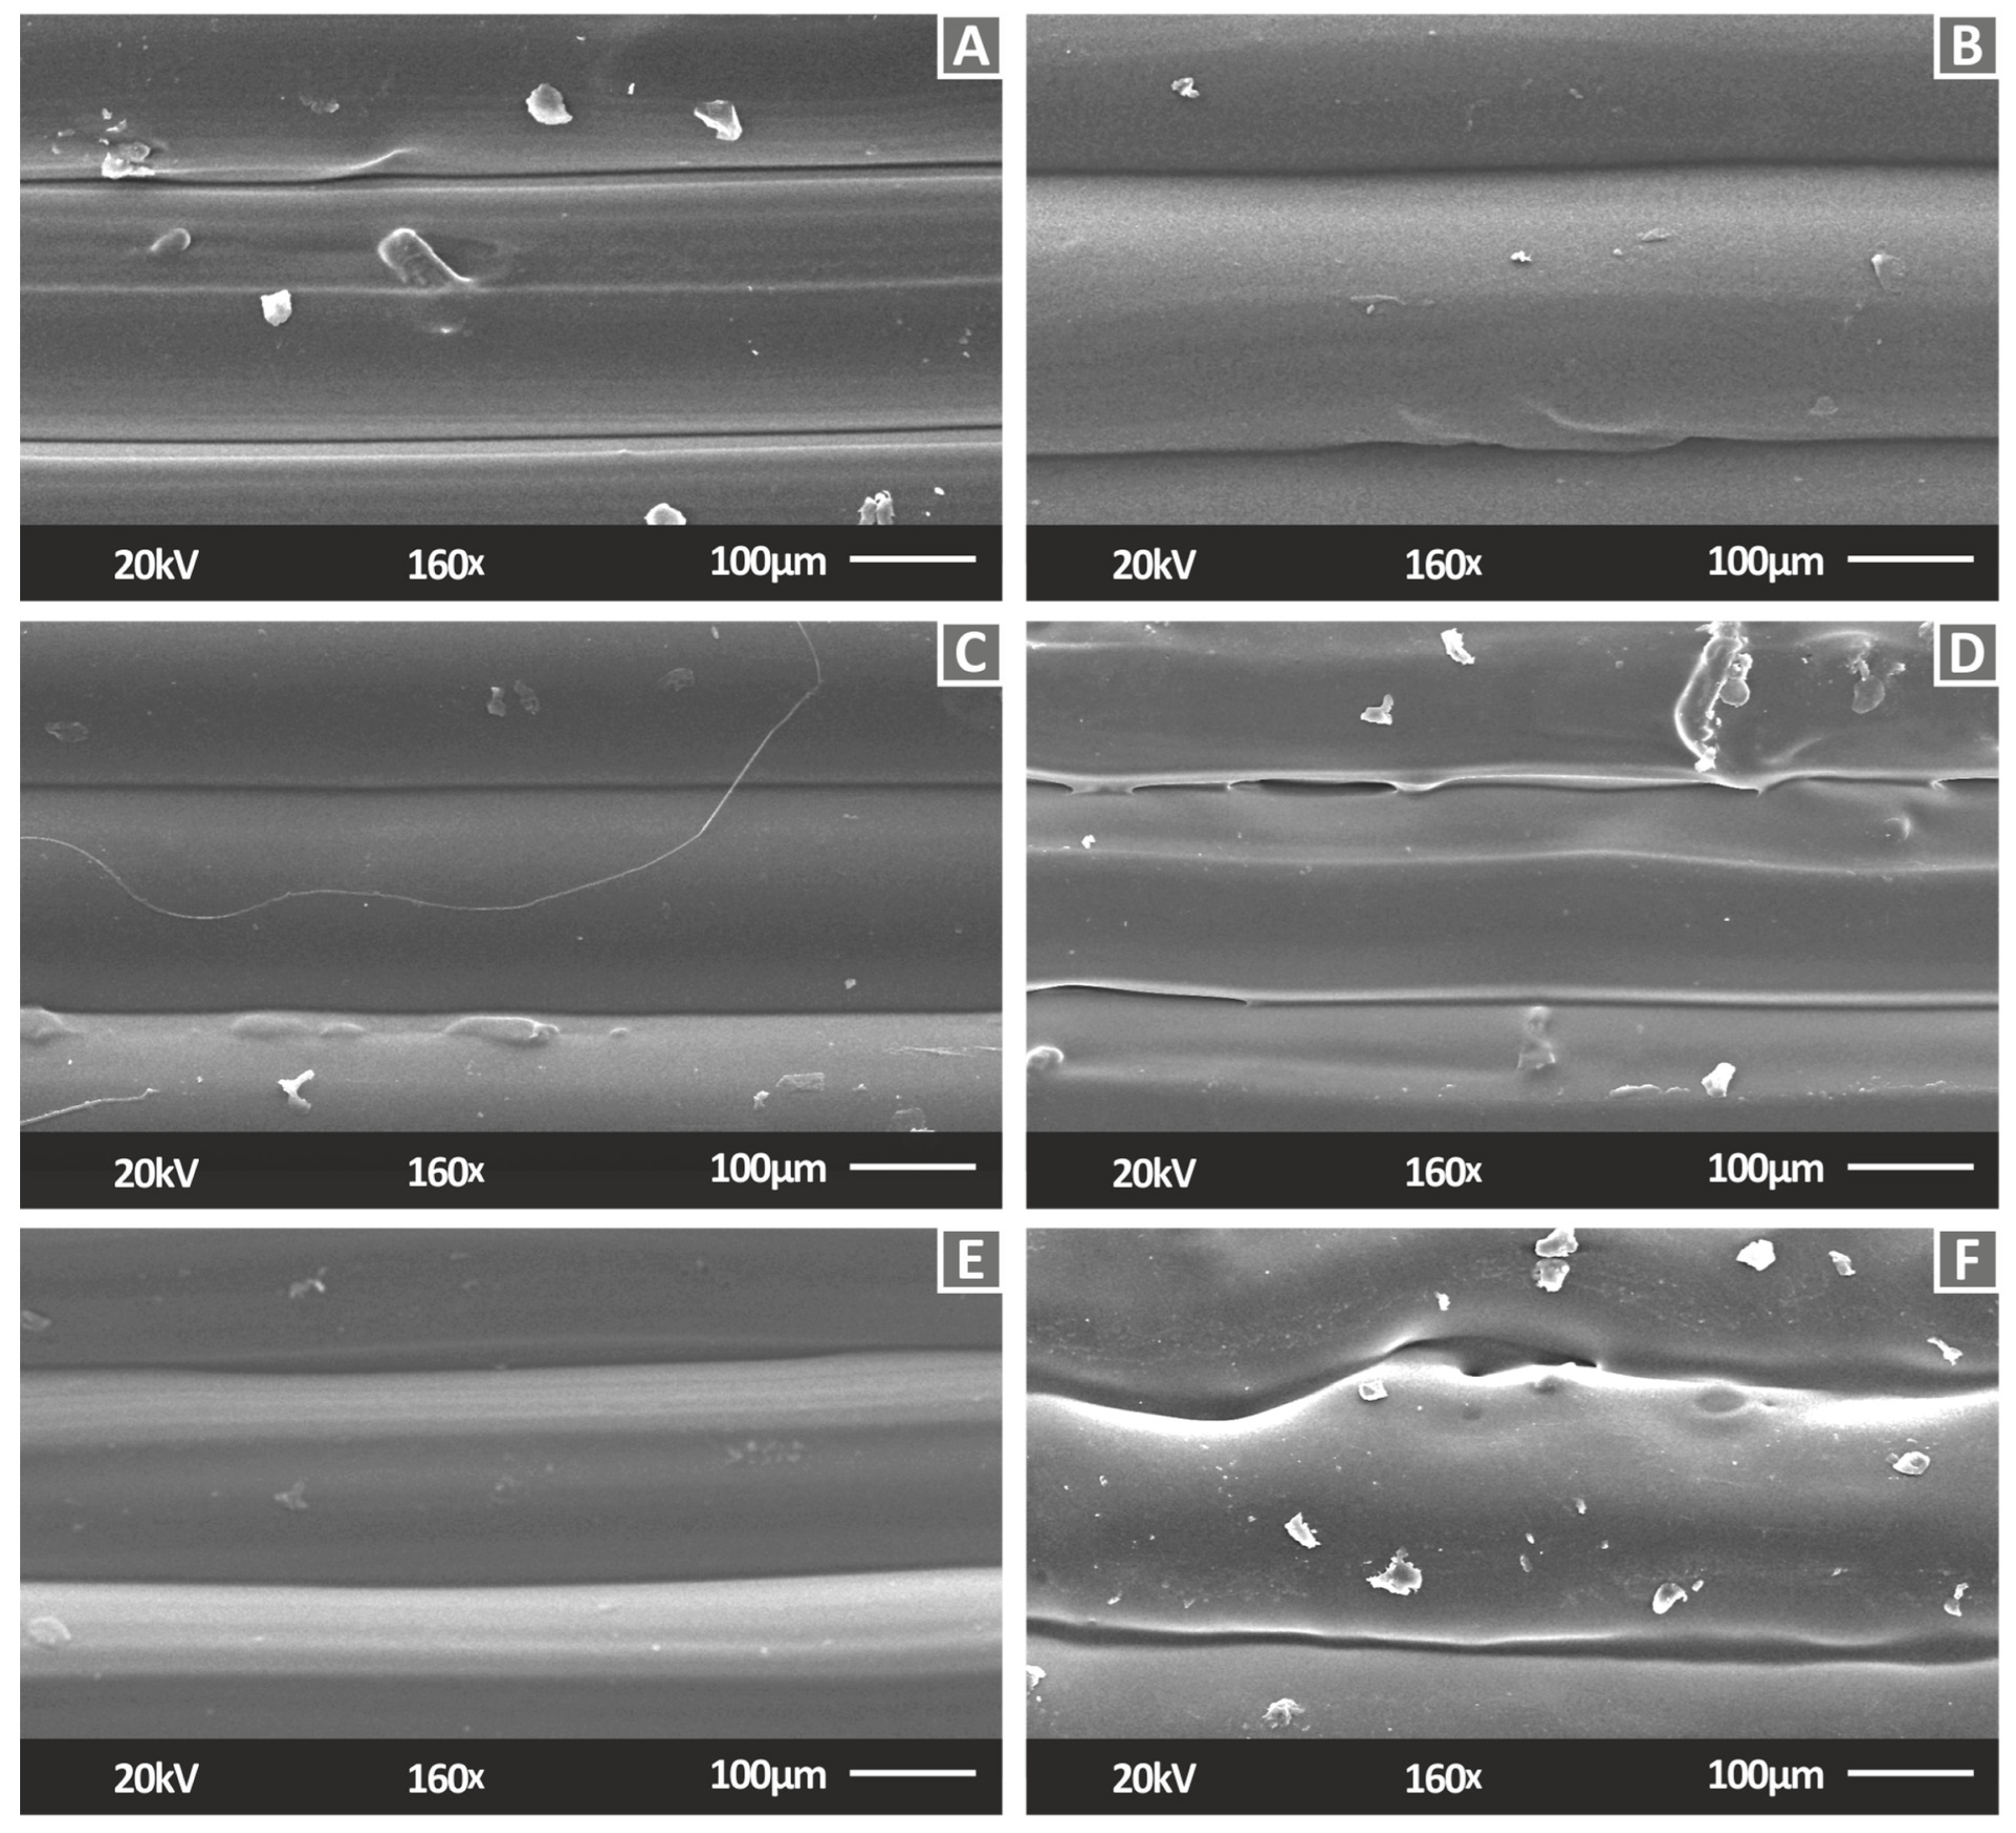
3.1. Filament Evaluation

The TGA and derivative thermogravimetry (DTGA) graphs for all materials tested in this work as shown in Figure 4. No significant changes in material degradation can be observed (Figure 4A), with the graphs shifting to slightly lower temperatures with increased filler concentration. A small increase in the weight of samples presented in the inset graph of Figure 4A is typical behavior during the TGA. This is an artifact of the machine at the point at which the material changes its behavior until the machine is stabilized. As shown in Figure 4B, the increase in the filler reduces the weight loss rate, and the maximum rate occurs at lower temperatures; however, the differences between the tested materials are not significant.
For evaluation of the surface quality of the produced filament, surface measurements were taken with AFM. The surface morphology of all tested materials is presented in Figure 5. No specific trend in the recorded surface roughness values can be observed between the different materials. The highest surface roughness values are reported for the PLA/CNF 0.5 wt.% and the lowest for the PLA/Cu2O 0.5 wt.% material. The results show that the addition of two fillers does not significantly affect the surface quality of the filaments. Based on these results, it can be assumed that the addition of the studied fillers does not significantly affect the processability of the materials and their ability to be extruded.
As is shown in Figure 6, the major Raman peaks are associated with pure PLA. The PLA sample with 0.5 wt.% CNF shows no significant changes. The PLA sample with 0.5 wt.% Cu2O presented a very high photoluminescence signal that could not be removed during background subtraction. This high photoluminescence was expected from Cu2O, as clearly described in the literature [62]. When mixed with CNF, this photoluminescence is reduced is due to the high absorption of CNF. The PLA sample with 0.5 wt.% Cu2O and 0.5 wt.% CNF, the PLA sample with 0.5 wt.% Cu2O and 1.0 wt.% CNF, the PLA sample with 0.5 wt.% Cu2O and 2.0 wt.% CNF, and the PLA sample with 0.5 wt.% Cu2O and 3.0 wt.% CNF did not present the same high characteristic photoluminescence as Cu2O but exhibited a significant increase in the Raman line at 2945 cm−1 related to C-H stretching and bending. The remaining photoluminescence from Cu2O was successfully removed by background subtraction.
The major Raman peaks identified in analysis of pure PLA, as well as their related assignments, are presented in Table 1. The range of the identified Raman peaks is between 870 cm−1 and 1996 cm−1.

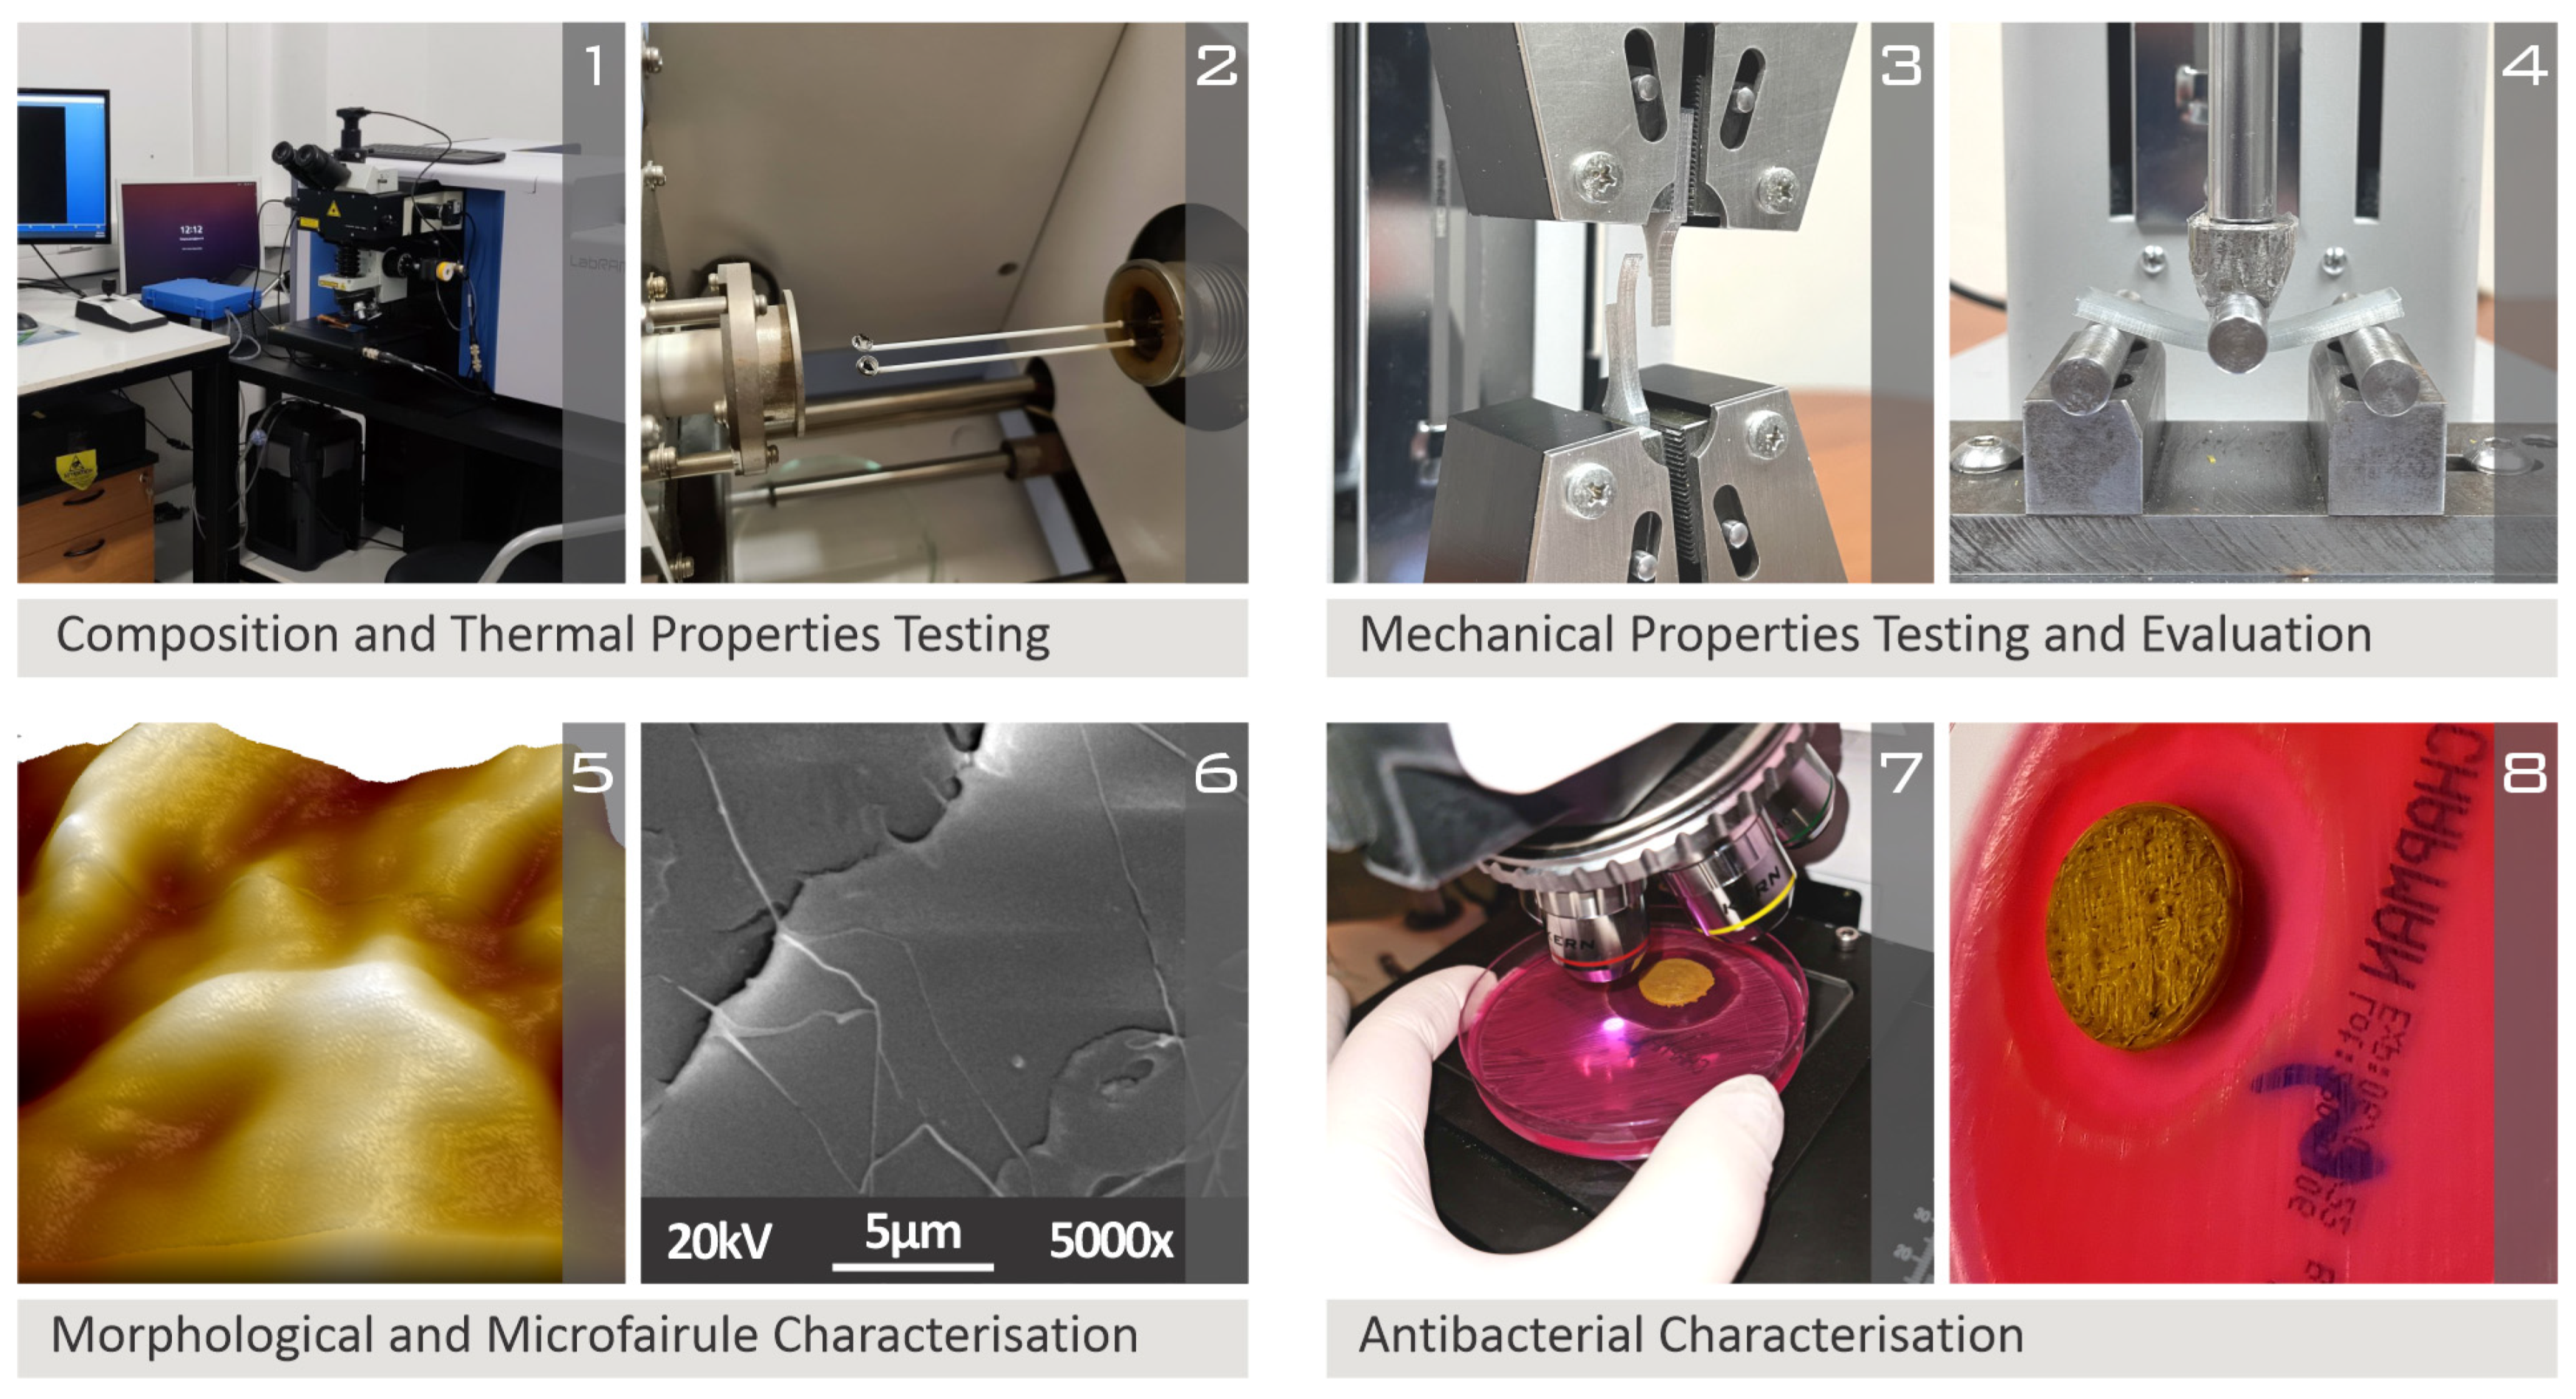
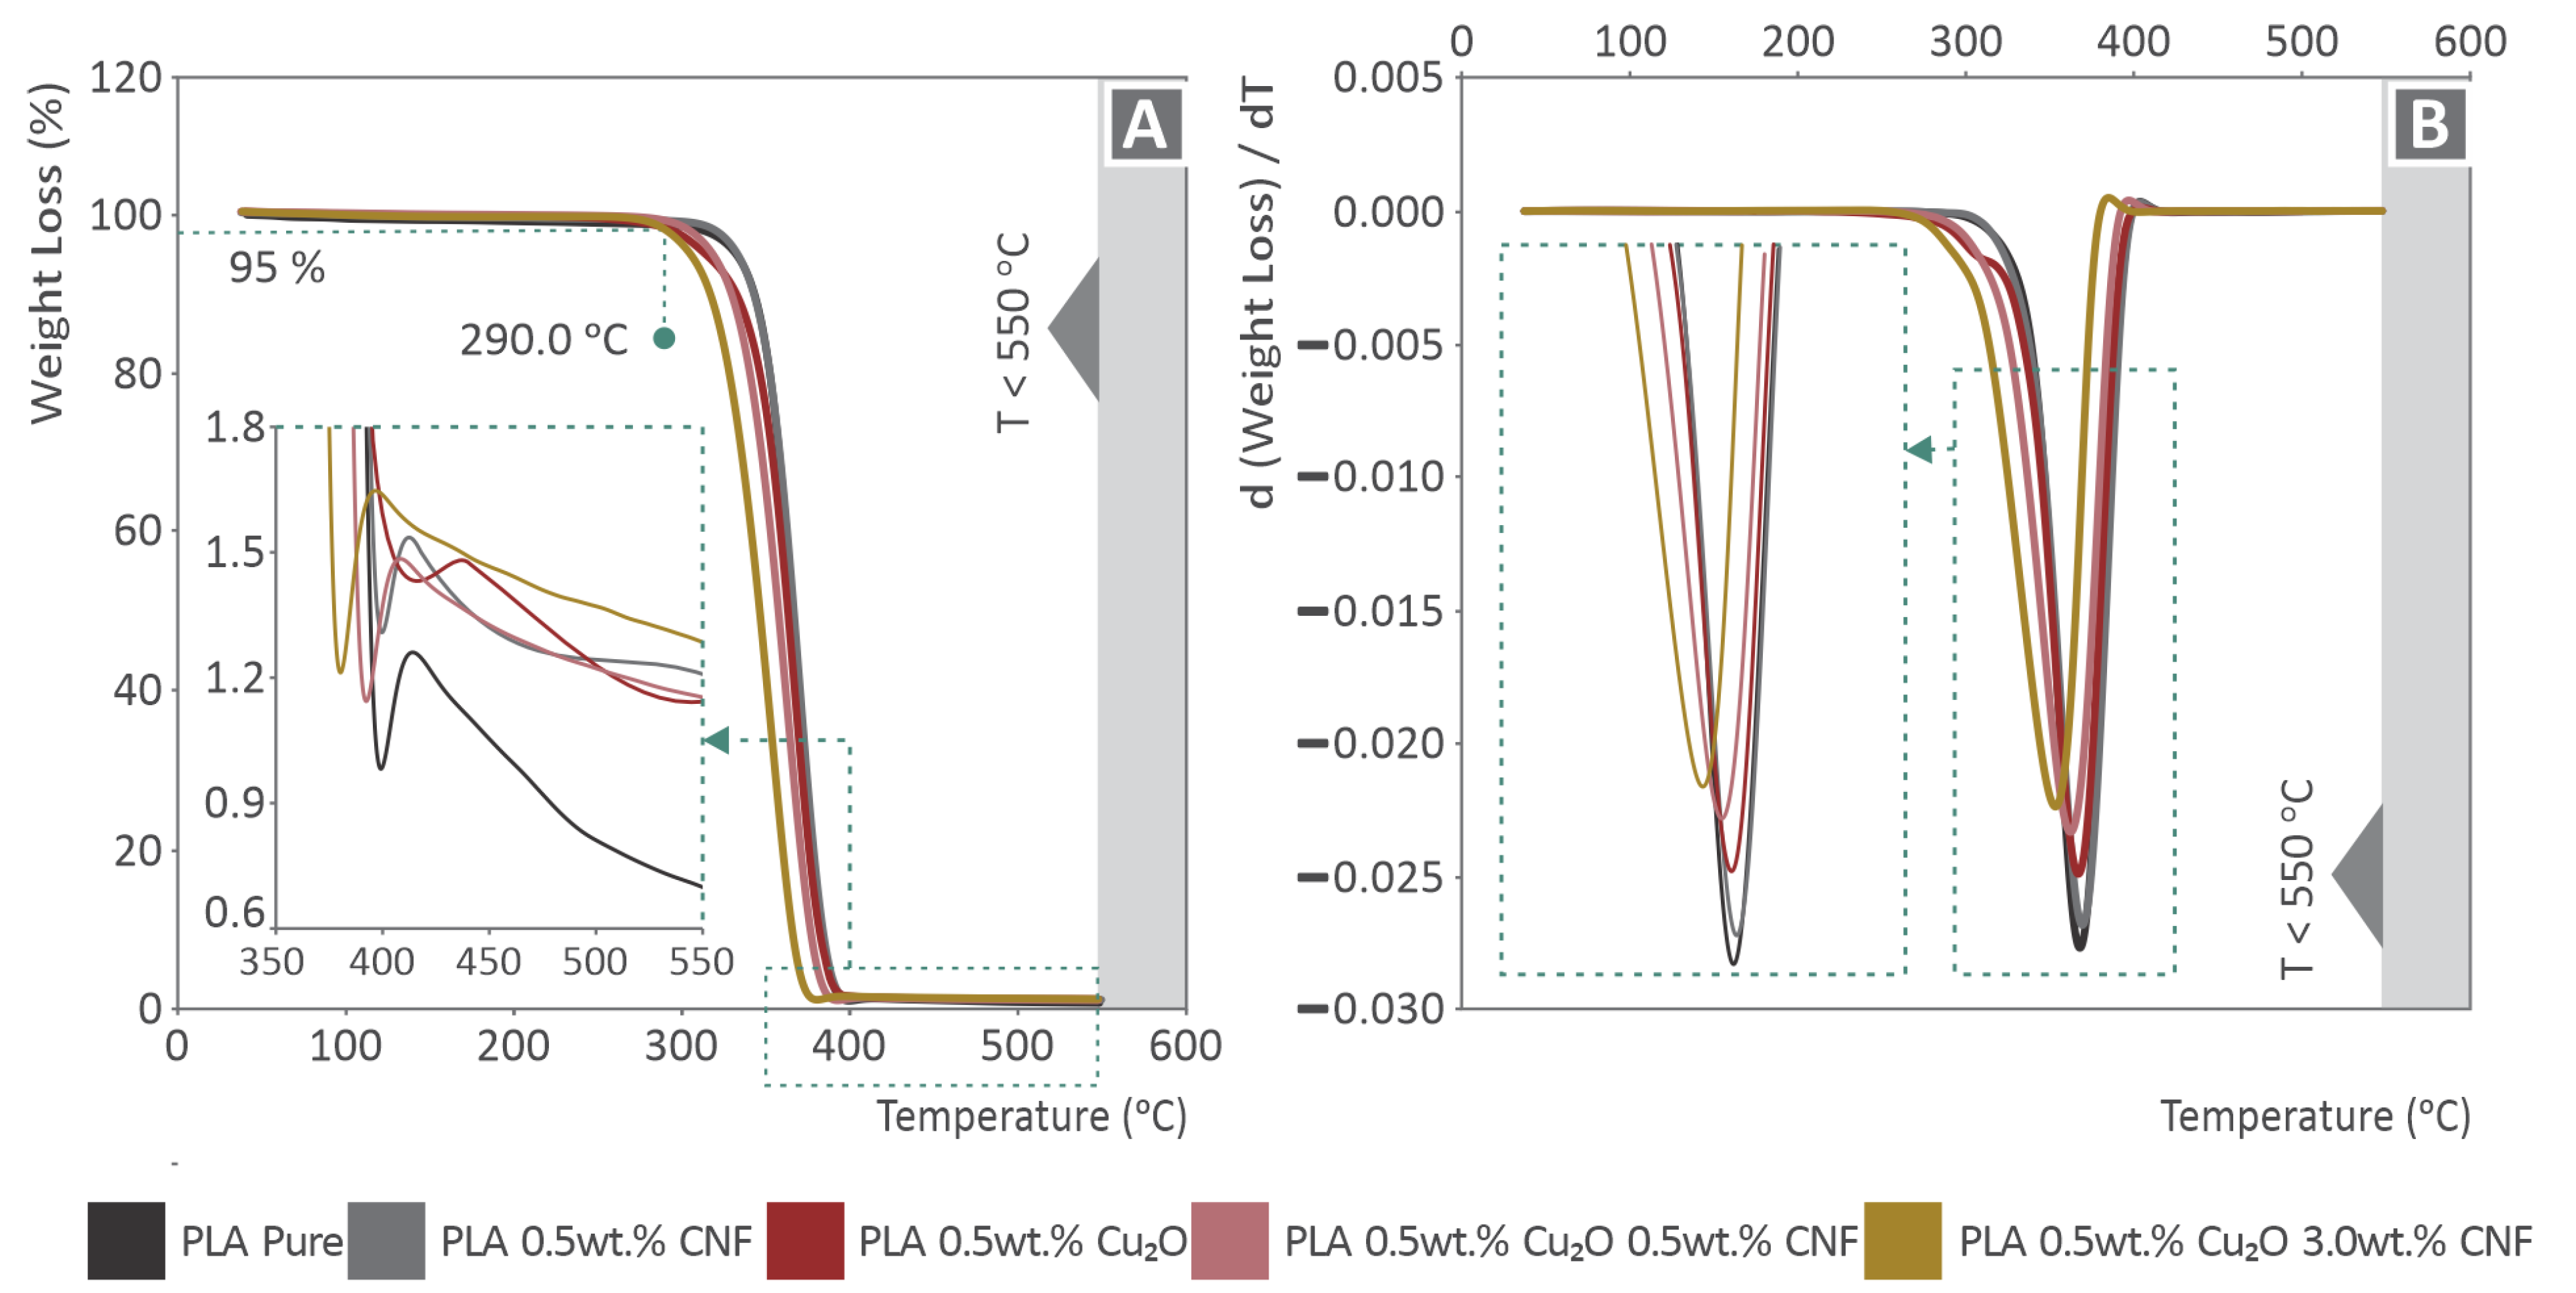
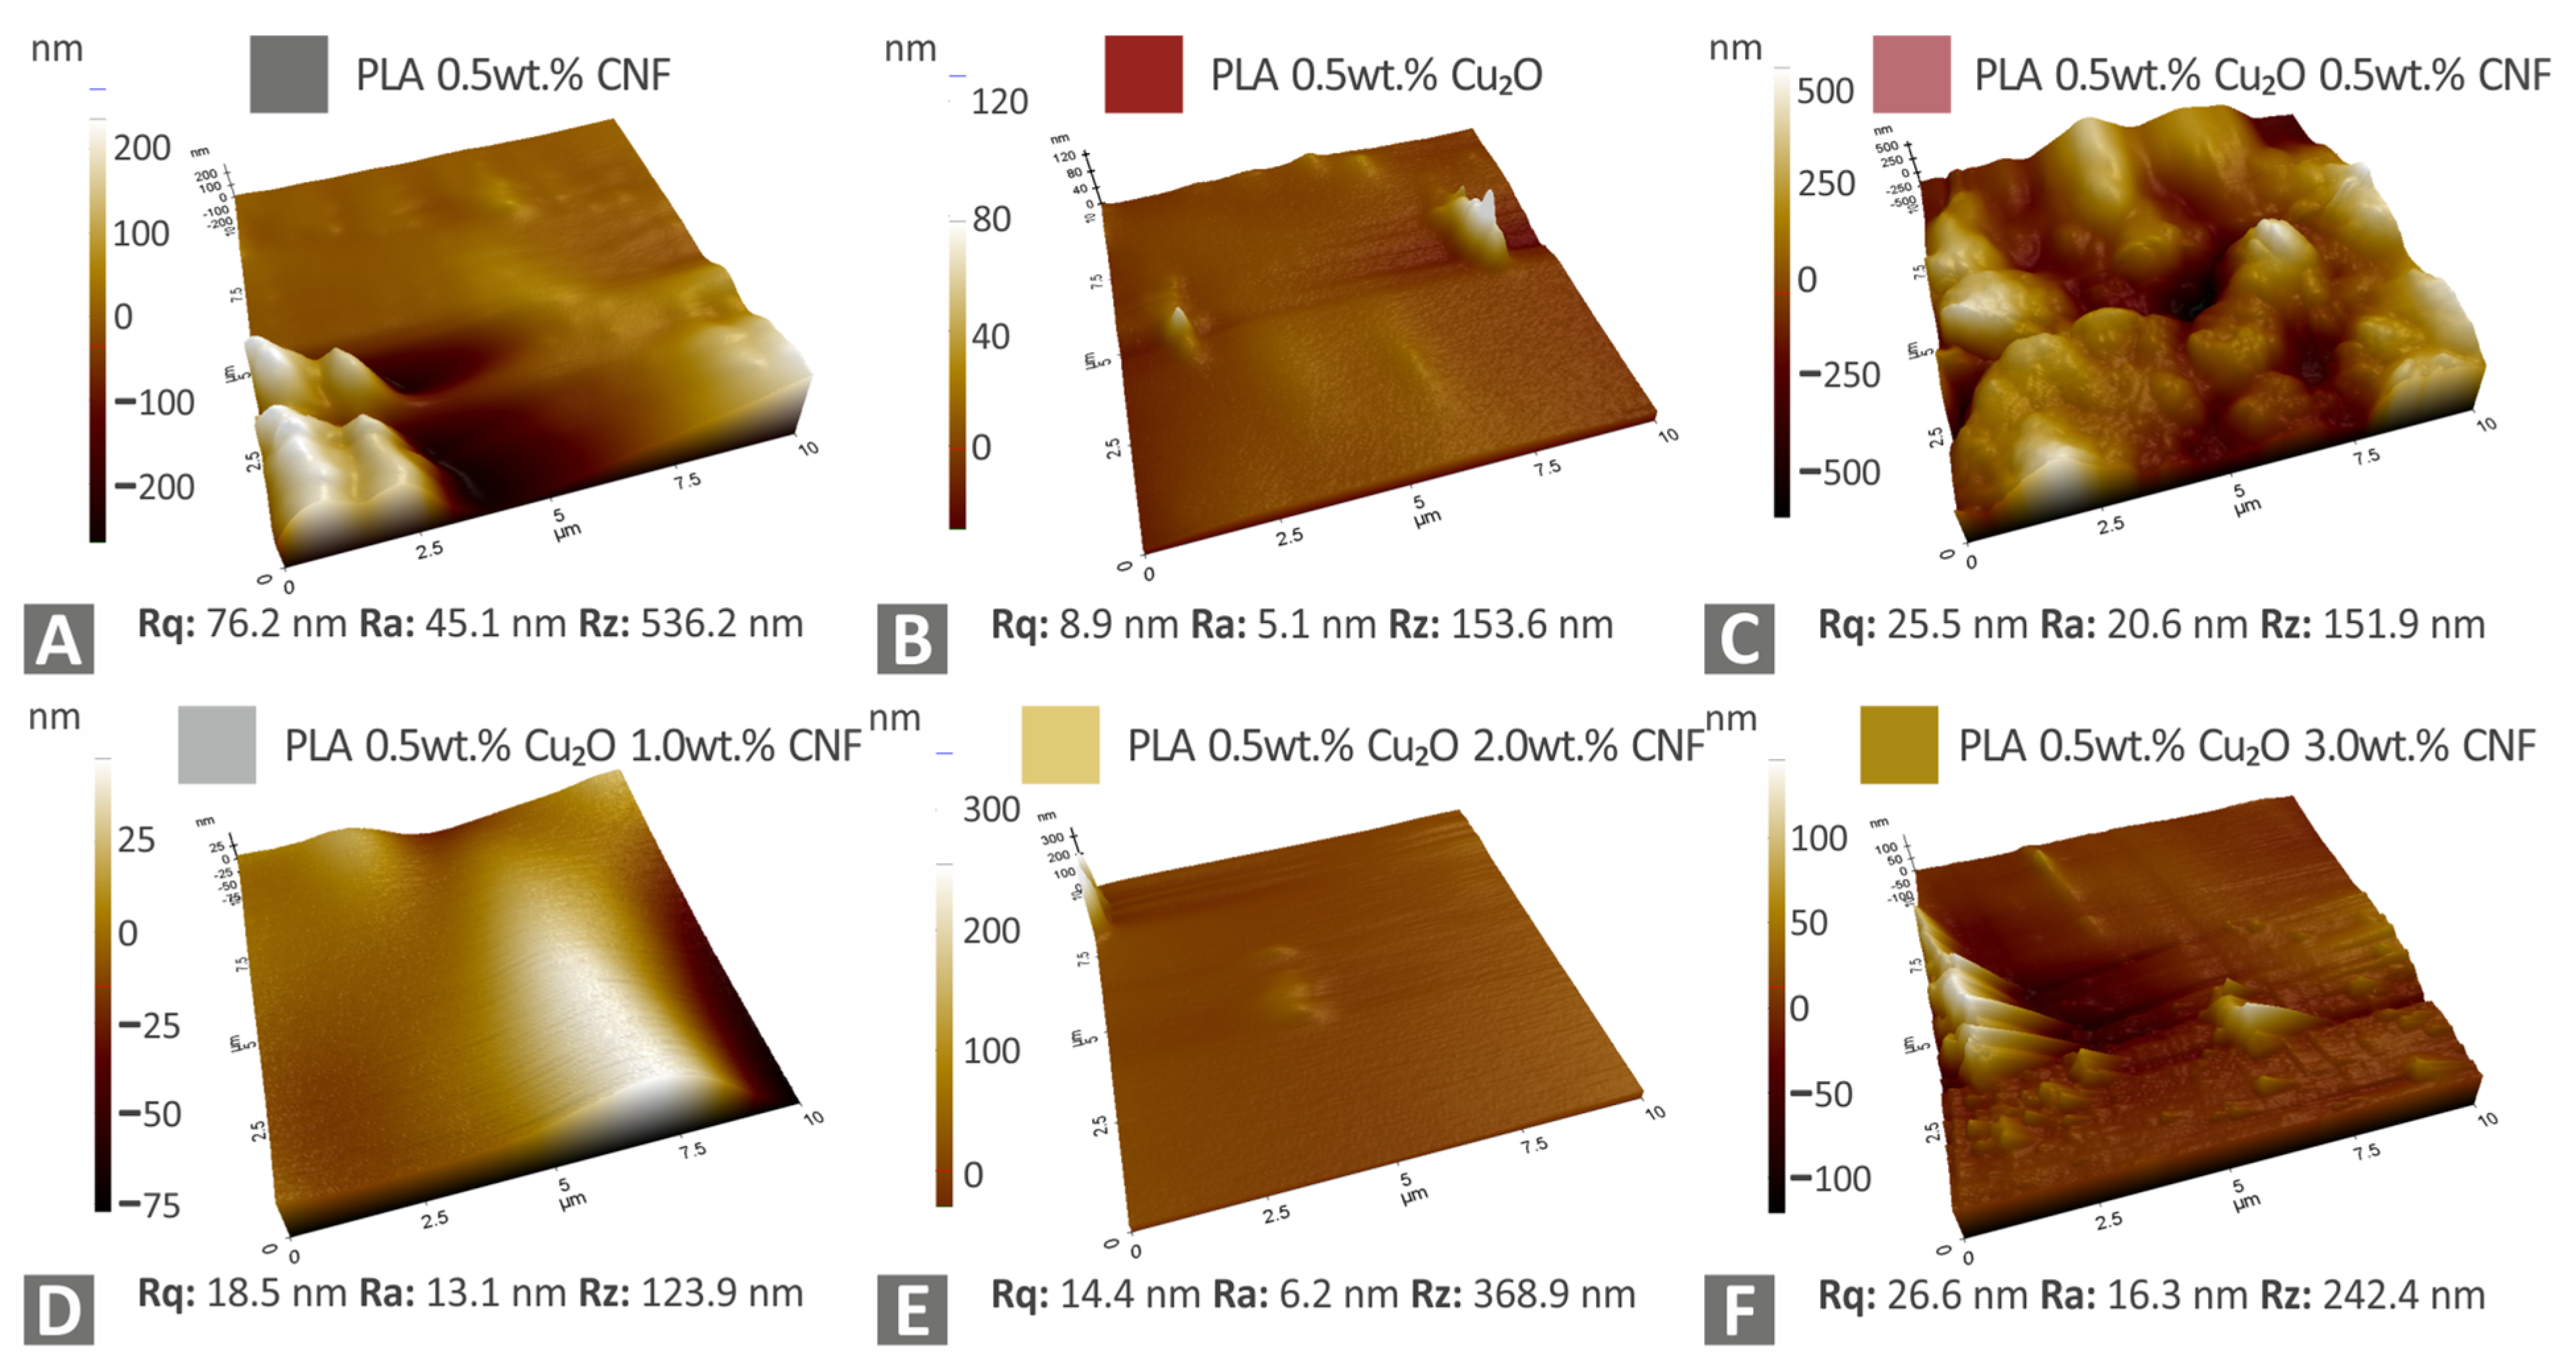
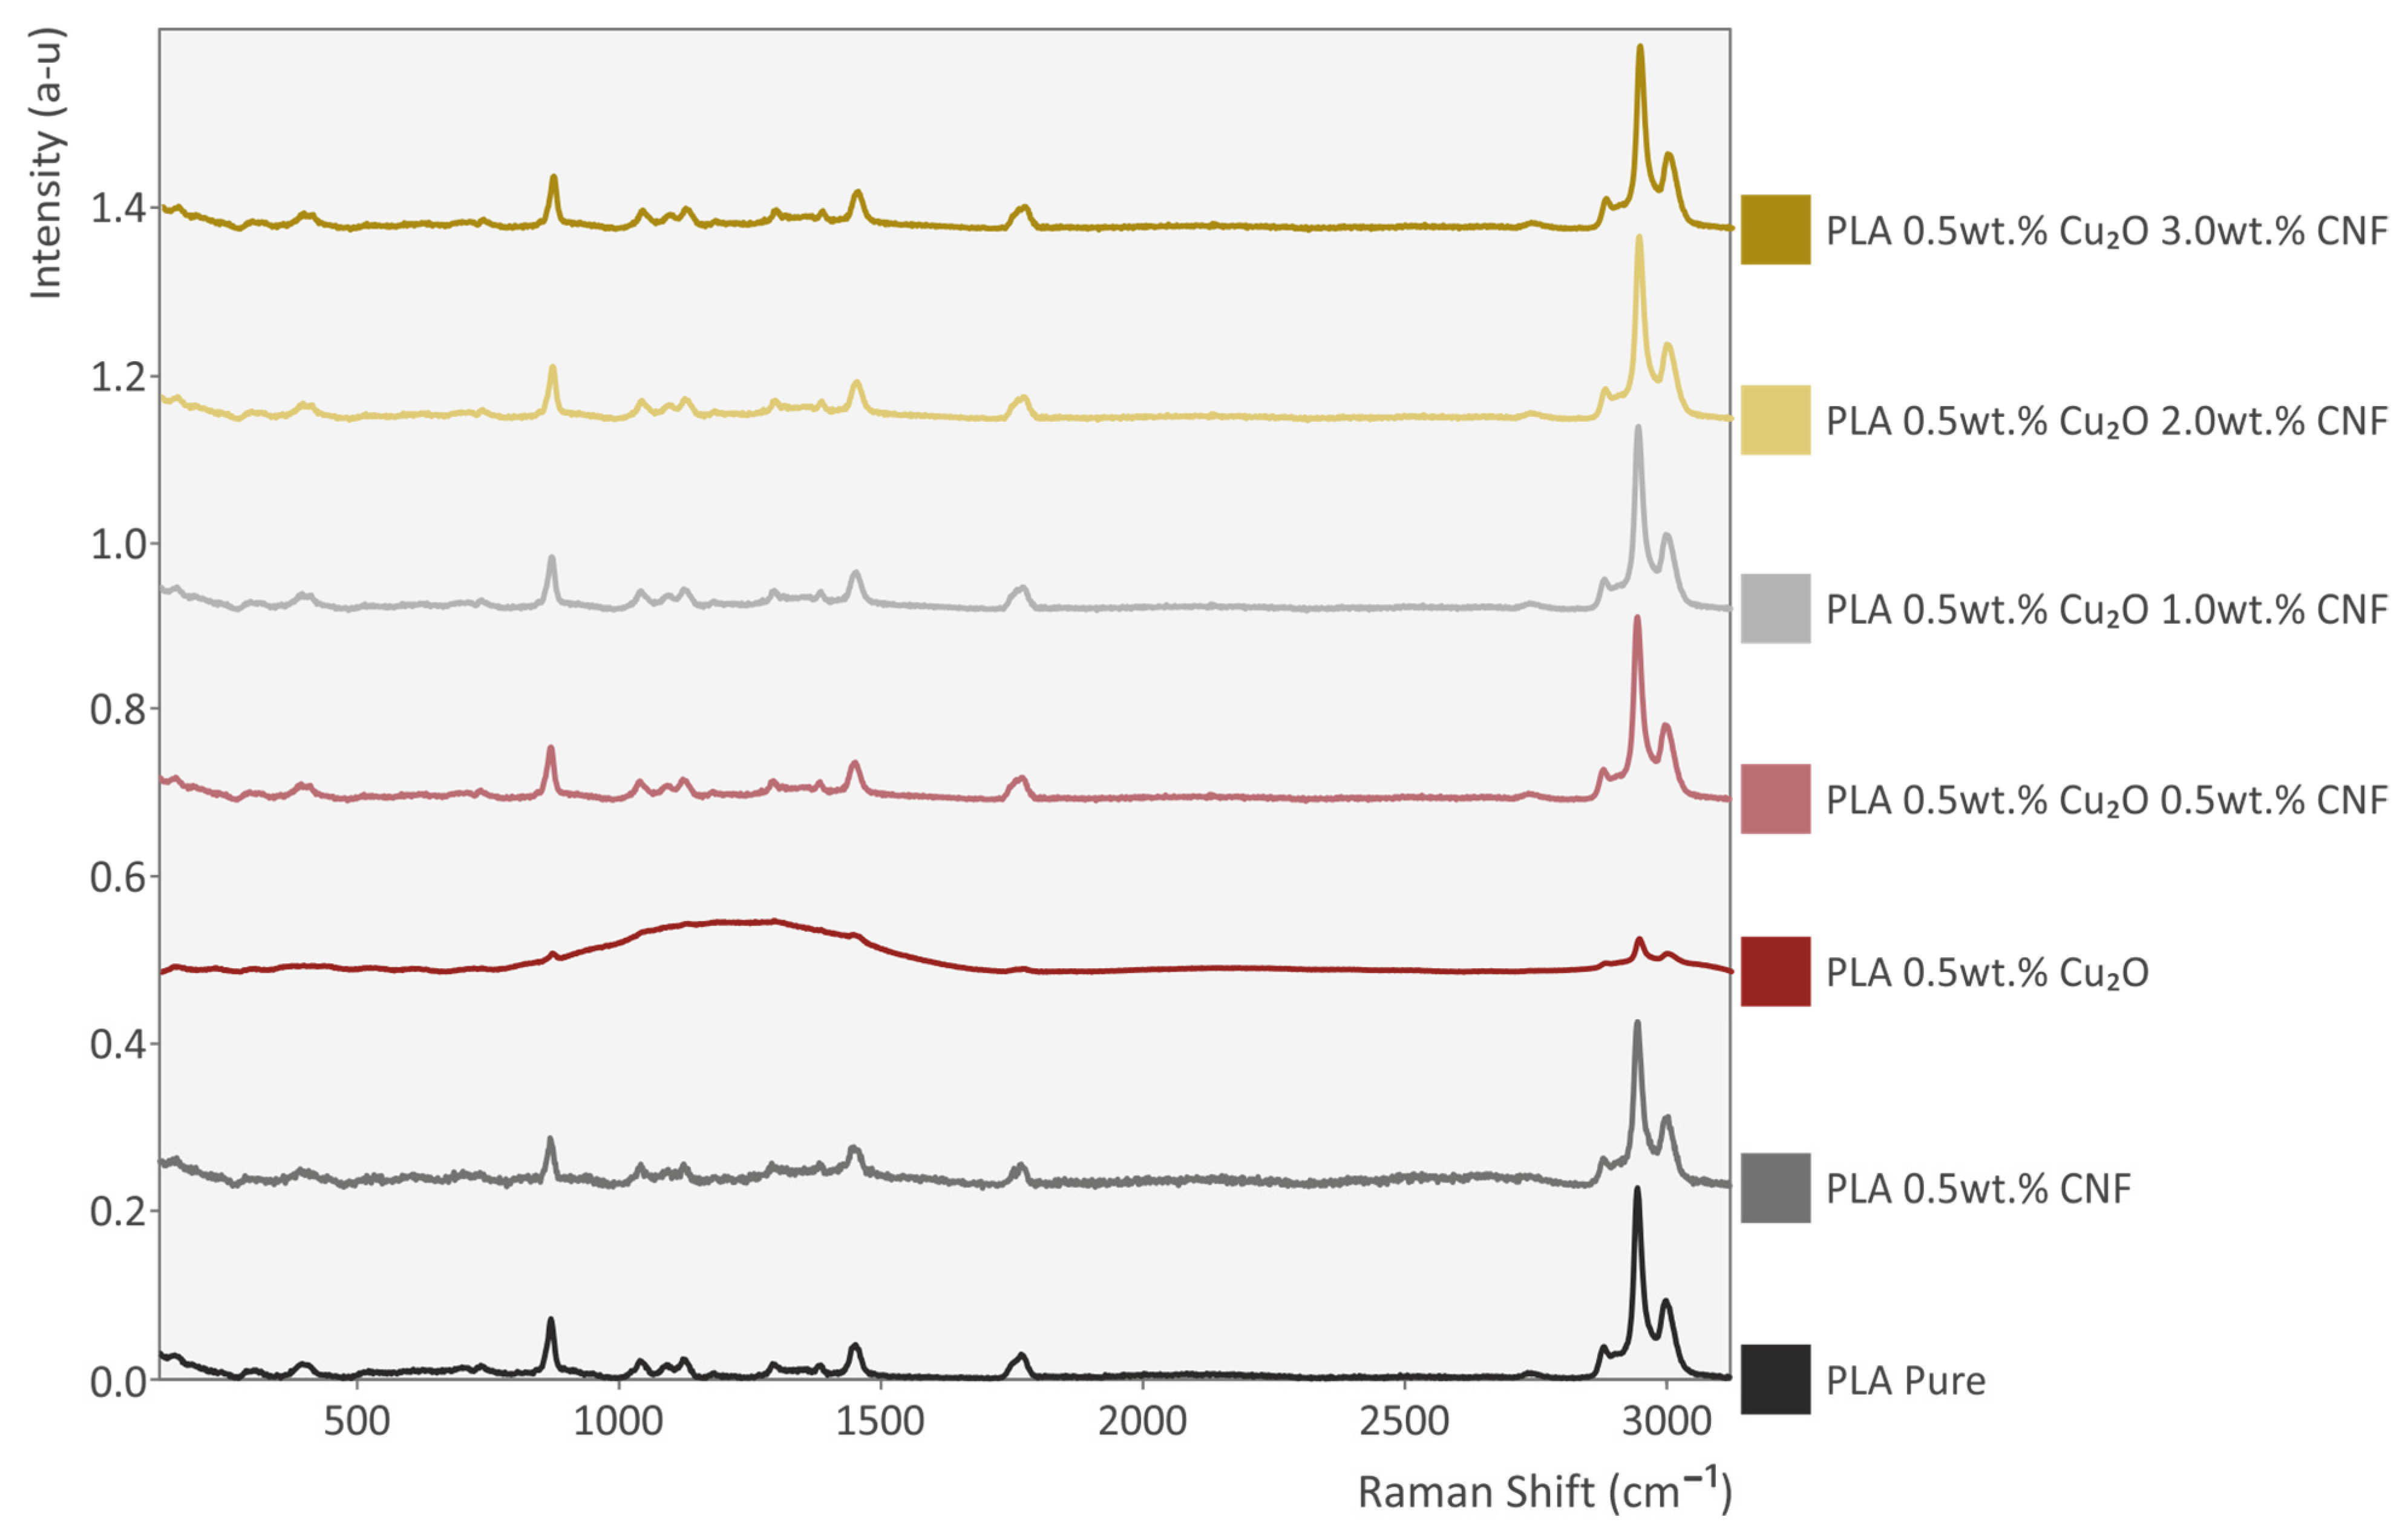
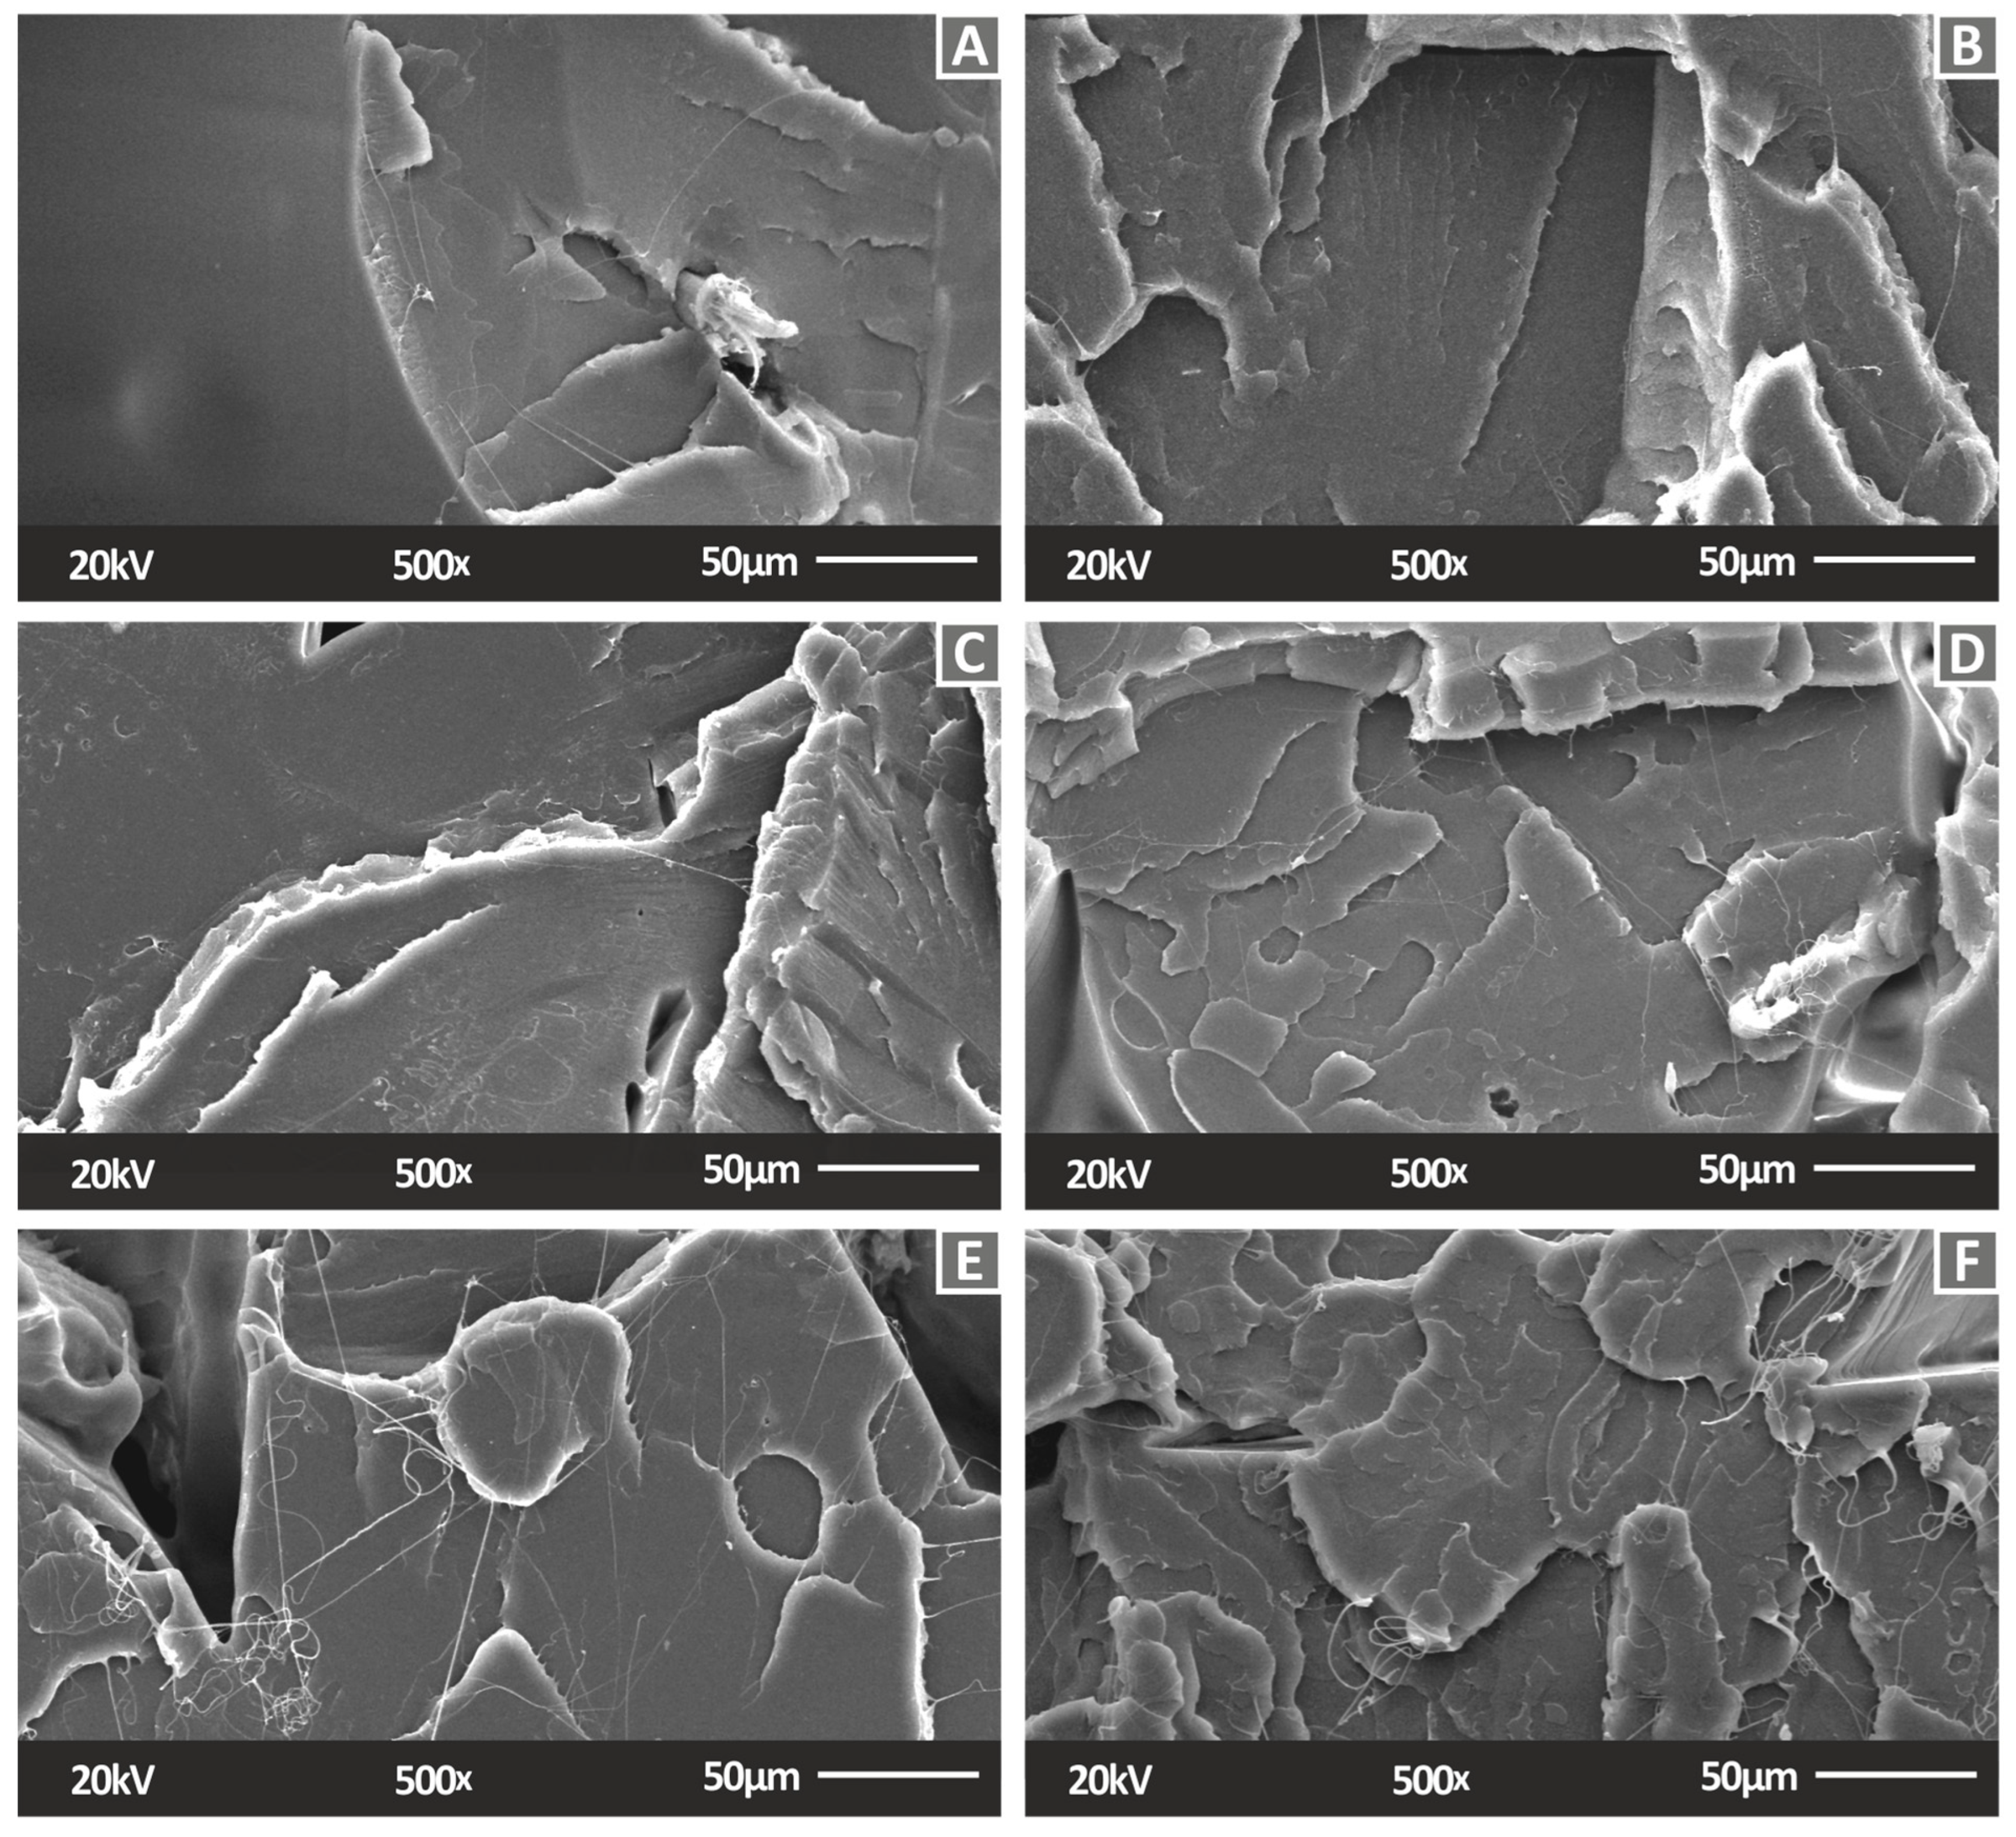
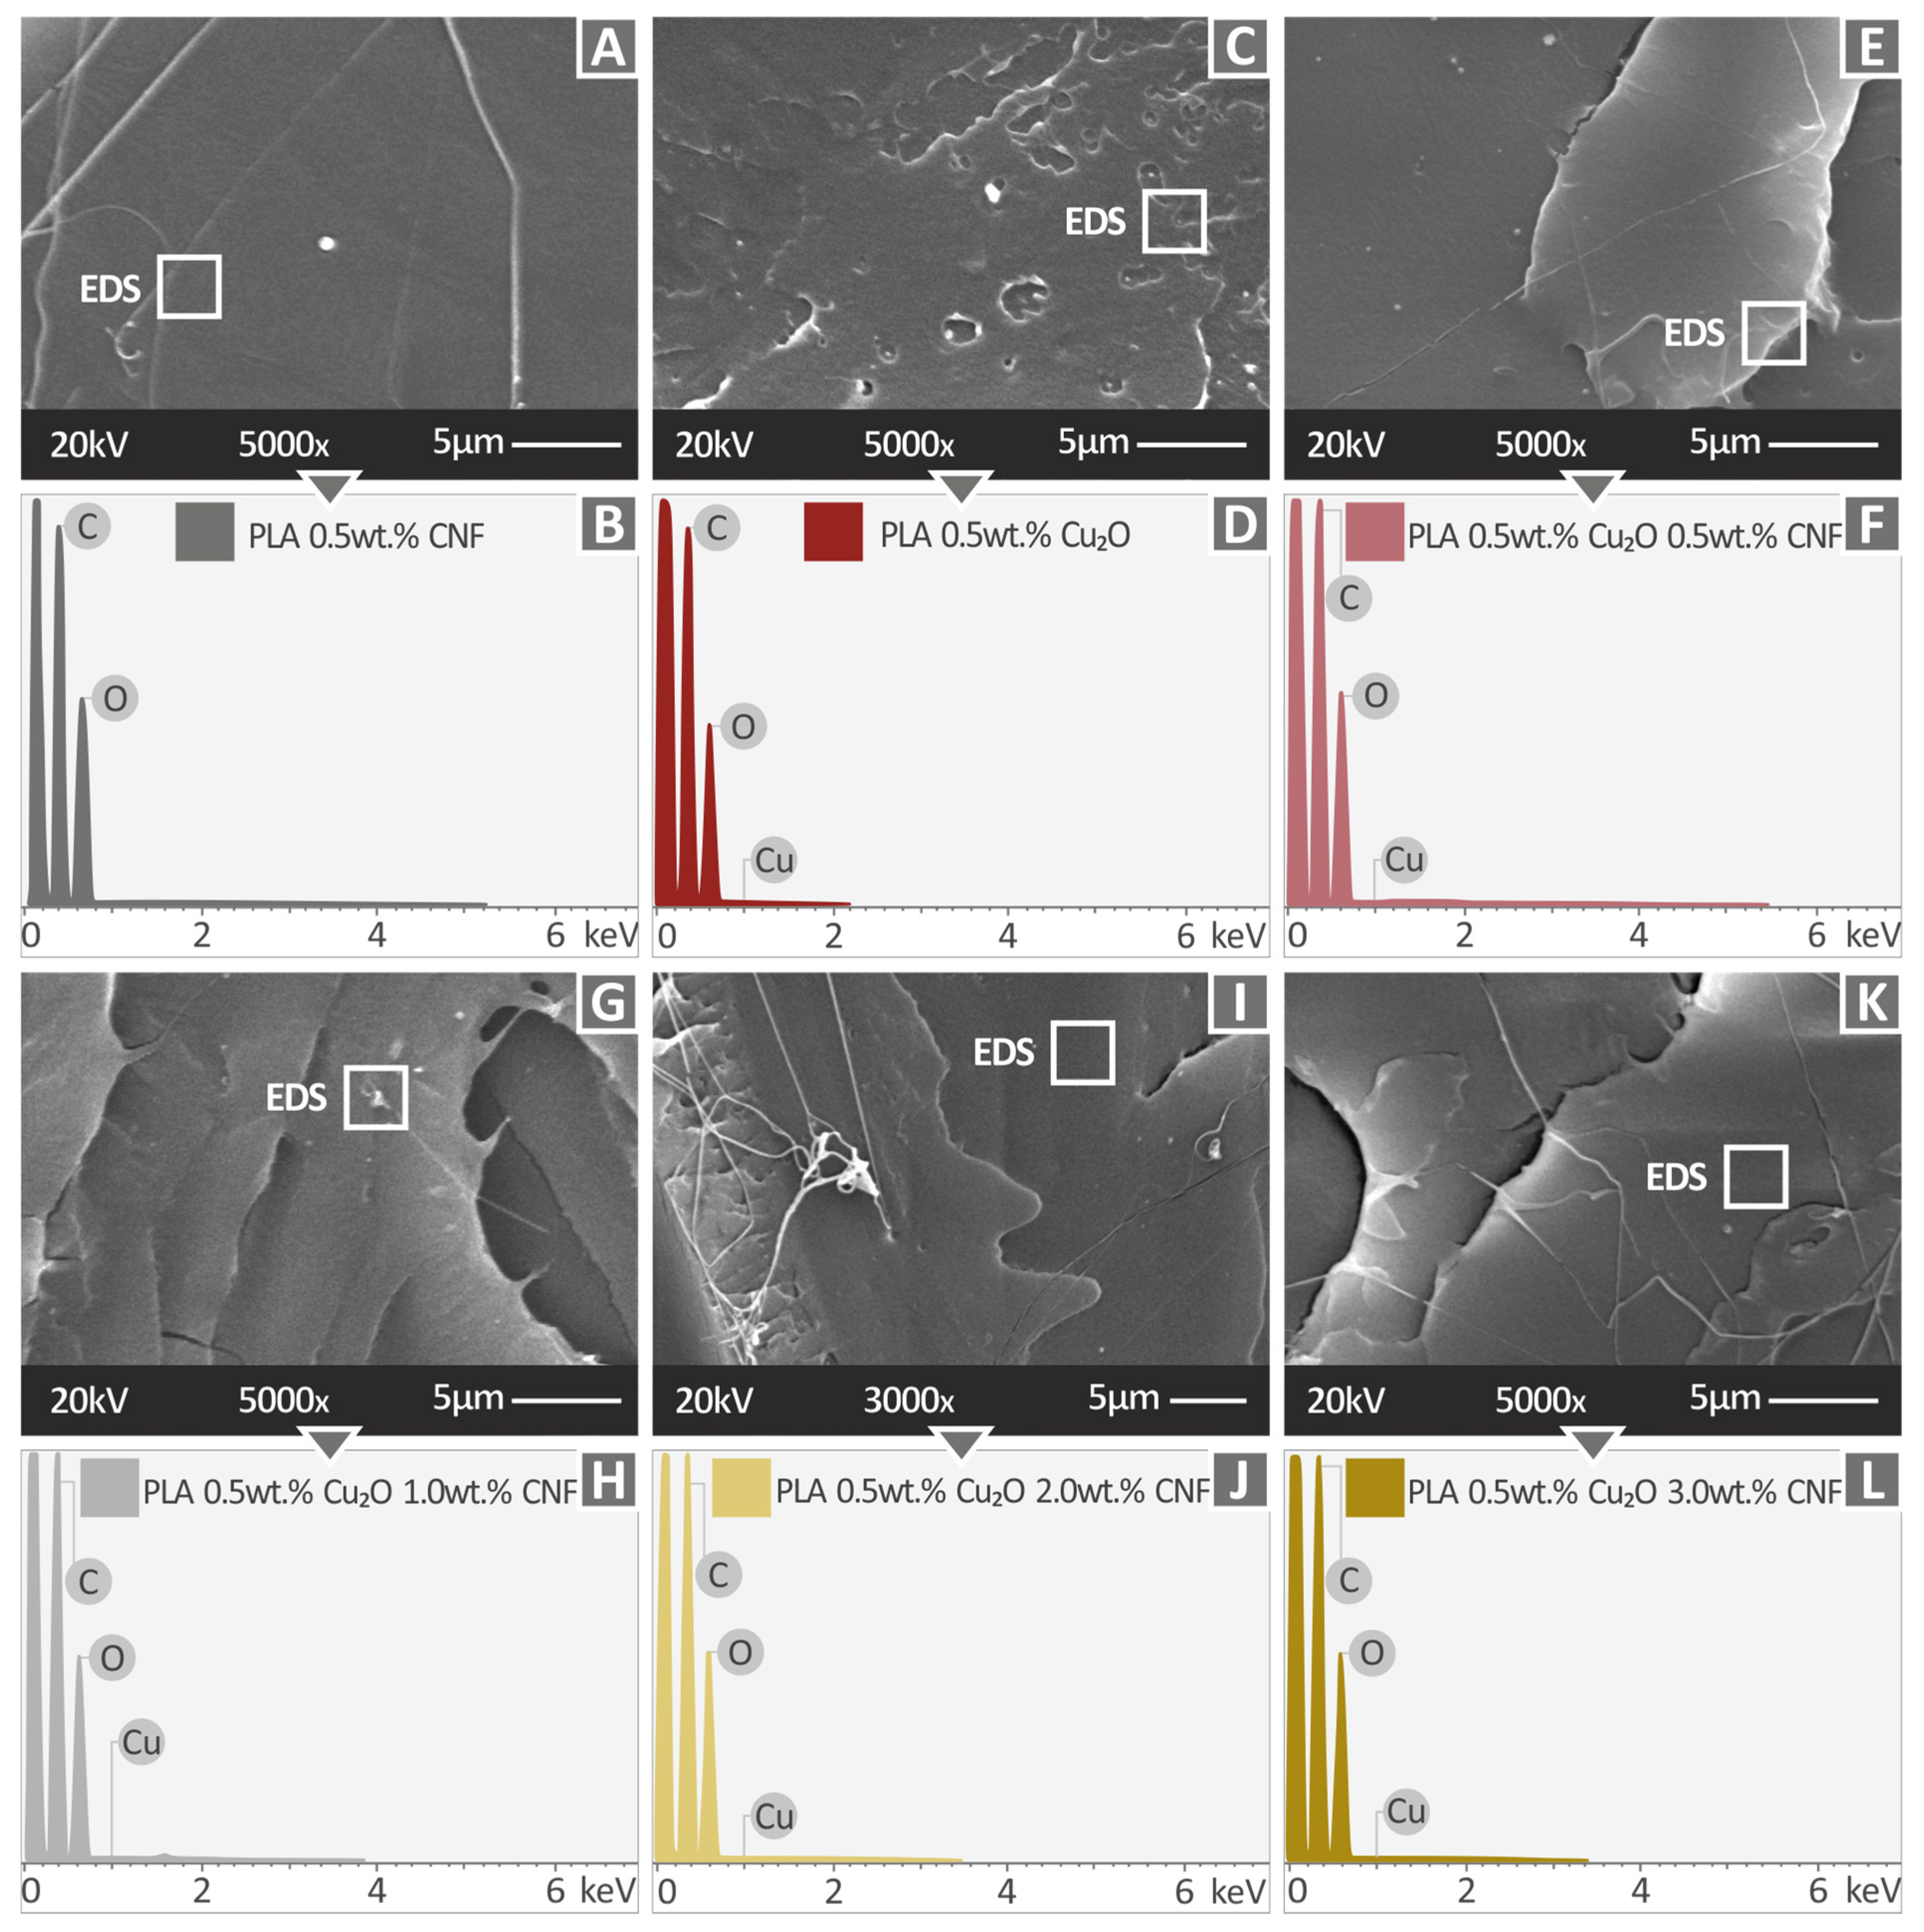
3.2. Material Characterization and Morphological Evaluation

The tensile experiment results are shown in Figure 7 in the form of typical stress vs. strain graphs for all the tested materials. An enhancement can be observed with the introduction of additives in the matrix material. The maximum recorded strain does not significantly differ between the cases, indicating that the ductility of the matrix material is not affected. The enhancement of the tensile properties with the addition of the fillers is also verified in Figure 7B, in which the calculated average tensile strength is presented for all the materials tested. The highest tensile strength is reported for the nanocomposite with 0.5 wt.% Cu2O and 1.0 wt.% CNF, with an enormous 51.1% increase compared to the pure PLA material. Increasing the CNF loading decreases the tensile strength of the materials, with the highest loading of 3.0 wt.% resulting lower strength than the pure PLA. This is an indication that saturation of the fillers in the matrix was reached. The exact saturation point was not determined, as when further increasing the fillers loadings, processability issues occurred, preventing the preparation of nanocomposite materials and specimens with higher filler loadings. A similar trend is observed for the tensile modulus of elasticity (Figure 7C), with the additives making the polymer stiffer. An improvement of 35.9% is reported for the 0.5 wt.% Cu2O and 1.0 wt.% CNF nanocomposite compared to the pure PLA, and a descent in the modulus of elasticity at higher CNF loadings is again reported.
The flexural tests follow a similar trend to the tensile tests regarding the calculated strength (Figure 8A,B). Again, the highest value is reported for the nanocomposite with 0.5 wt.% Cu2O and 1.0 wt.% CNF, with an improvement of 23.2% compared to the pure PLA. The flexural modulus of elasticity does not follow the same trend, with the stiffer response reported for the 0.5 wt.% Cu2O and 0.5 wt.% CNF, with an improvement of 36.9% compared to the pure PLA. Still, the addition of the fillers induces a stiffer behavior in the polymer, and this behavior decreases for CNF loadings higher than 0.5 wt.%. The highest CNF loading of 3.0 wt.% results in a stiffer behavior than the 2.0 wt.% loading, although still following the decreasing stiffness trend.
The calculated tensile and flexural toughness are depicted in Figure 9. This parameter is calculated as the integral of the corresponding stress vs. strain graphs, and it is an indication of the absorbed energy of the material during the tests. For both tests, a similar trend with the corresponding strength values is reported. This is in agreement with the fact that the strain and therefore the ductility of the materials was not significantly affected by the introduction of the additives.
The impact test results are presented in Figure 10A. The additives improve the overall impact strength of the polymer. Only the PLA 0.5 wt.% and 3.0 wt.% CNF has lower strength than the pure PLA, as in the previous tests, again indicating a possible saturation threshold for the nanocomposites. The highest impact strength is reported for the PLA with 0.5 wt.% and 0.5 wt.% CNF, with an improvement of 29.9% compared to the pure PLA material. A similar trend with the impact tests is observed for the Vicker’s microhardness measurements (Figure 10B). Only the highest CNF loading results in values lower than those of pure PLA, and an improvement of 25.8% was measured for the PLA/Cu2O 0.5 wt.%. Nanocomposites with both fillers showed improvement in microhardness relative to the pure PLA but lower values than the PLA/Cu2O 0.5 wt.% nanocomposite. Again, only the nanocomposite with the highest CNF loading results in lower values than the pure PLA material. The nanocomposite with PLA/CNF 0.5 wt.% shows no improvement in microhardness compared to the pure PLA, which partly justifies the response of the nanocomposites containing CNFs in these measurements.
The morphological characteristics of the pure PLA were investigated, and the SEM images are shown in Figure 11. In Figure 11A, the side surface of the specimen is shown. The layer height was verified, and an excellent 3D printing process is depicted, with flawless layer fusion and no voids or defects present. The fracture surface (Figure 11B) shows a rather brittle fracture mechanism, with strands in most of the fracture failing with no visible deformations.
SEM images of the side surfaces of all the tested nanocomposites are shown in Figure 12. A flawless 3D printing process is presented in most cases, with minimal voids shown in specific cases (Figure 12D). Only in the case of PLA/Cu2O 0.5 wt.% and 3.0 wt.% CNF can defects in the layer fusion be observed, justifying the reduced response of the nanocomposite in all the mechanical characterization tests. These defects can be attributed to the possible saturation of the fillers in the matrix, which affected the processability of the material during the 3D printing process.
Figure 13 presents SEM images of the fracture surfaces of tensile specimens of the nanocomposites tested in this work. No severe deformation can be observed in the images, indicating a rather brittle fracture mechanism. The CNFs can be observed in the images, and no agglomerations were detected at this magnification level.
EDS graphs verifying the elements in the nanocomposites were acquired from higher magnification SEM images of uncoated samples (Figure 14). In the higher magnification images, no agglomerations were detected, and the CNFs are visible in the images, indicating a good dispersion of the filler in the matrix material. No additional fillers (elements) that might affect the results of the study were detected in the nanocomposites.
The mechanical characterization results are summarized in Figure 15. Overall, the introduction of the fillers enhances the mechanical response of the pure PLA polymer. The PLA with 0.5 wt.% Cu2O and 1.0 wt.% CNF nanocomposites had the highest mechanical response in most of the tests, indicating a further enhancement in the pure PLA material with the binary inclusions studied herein.

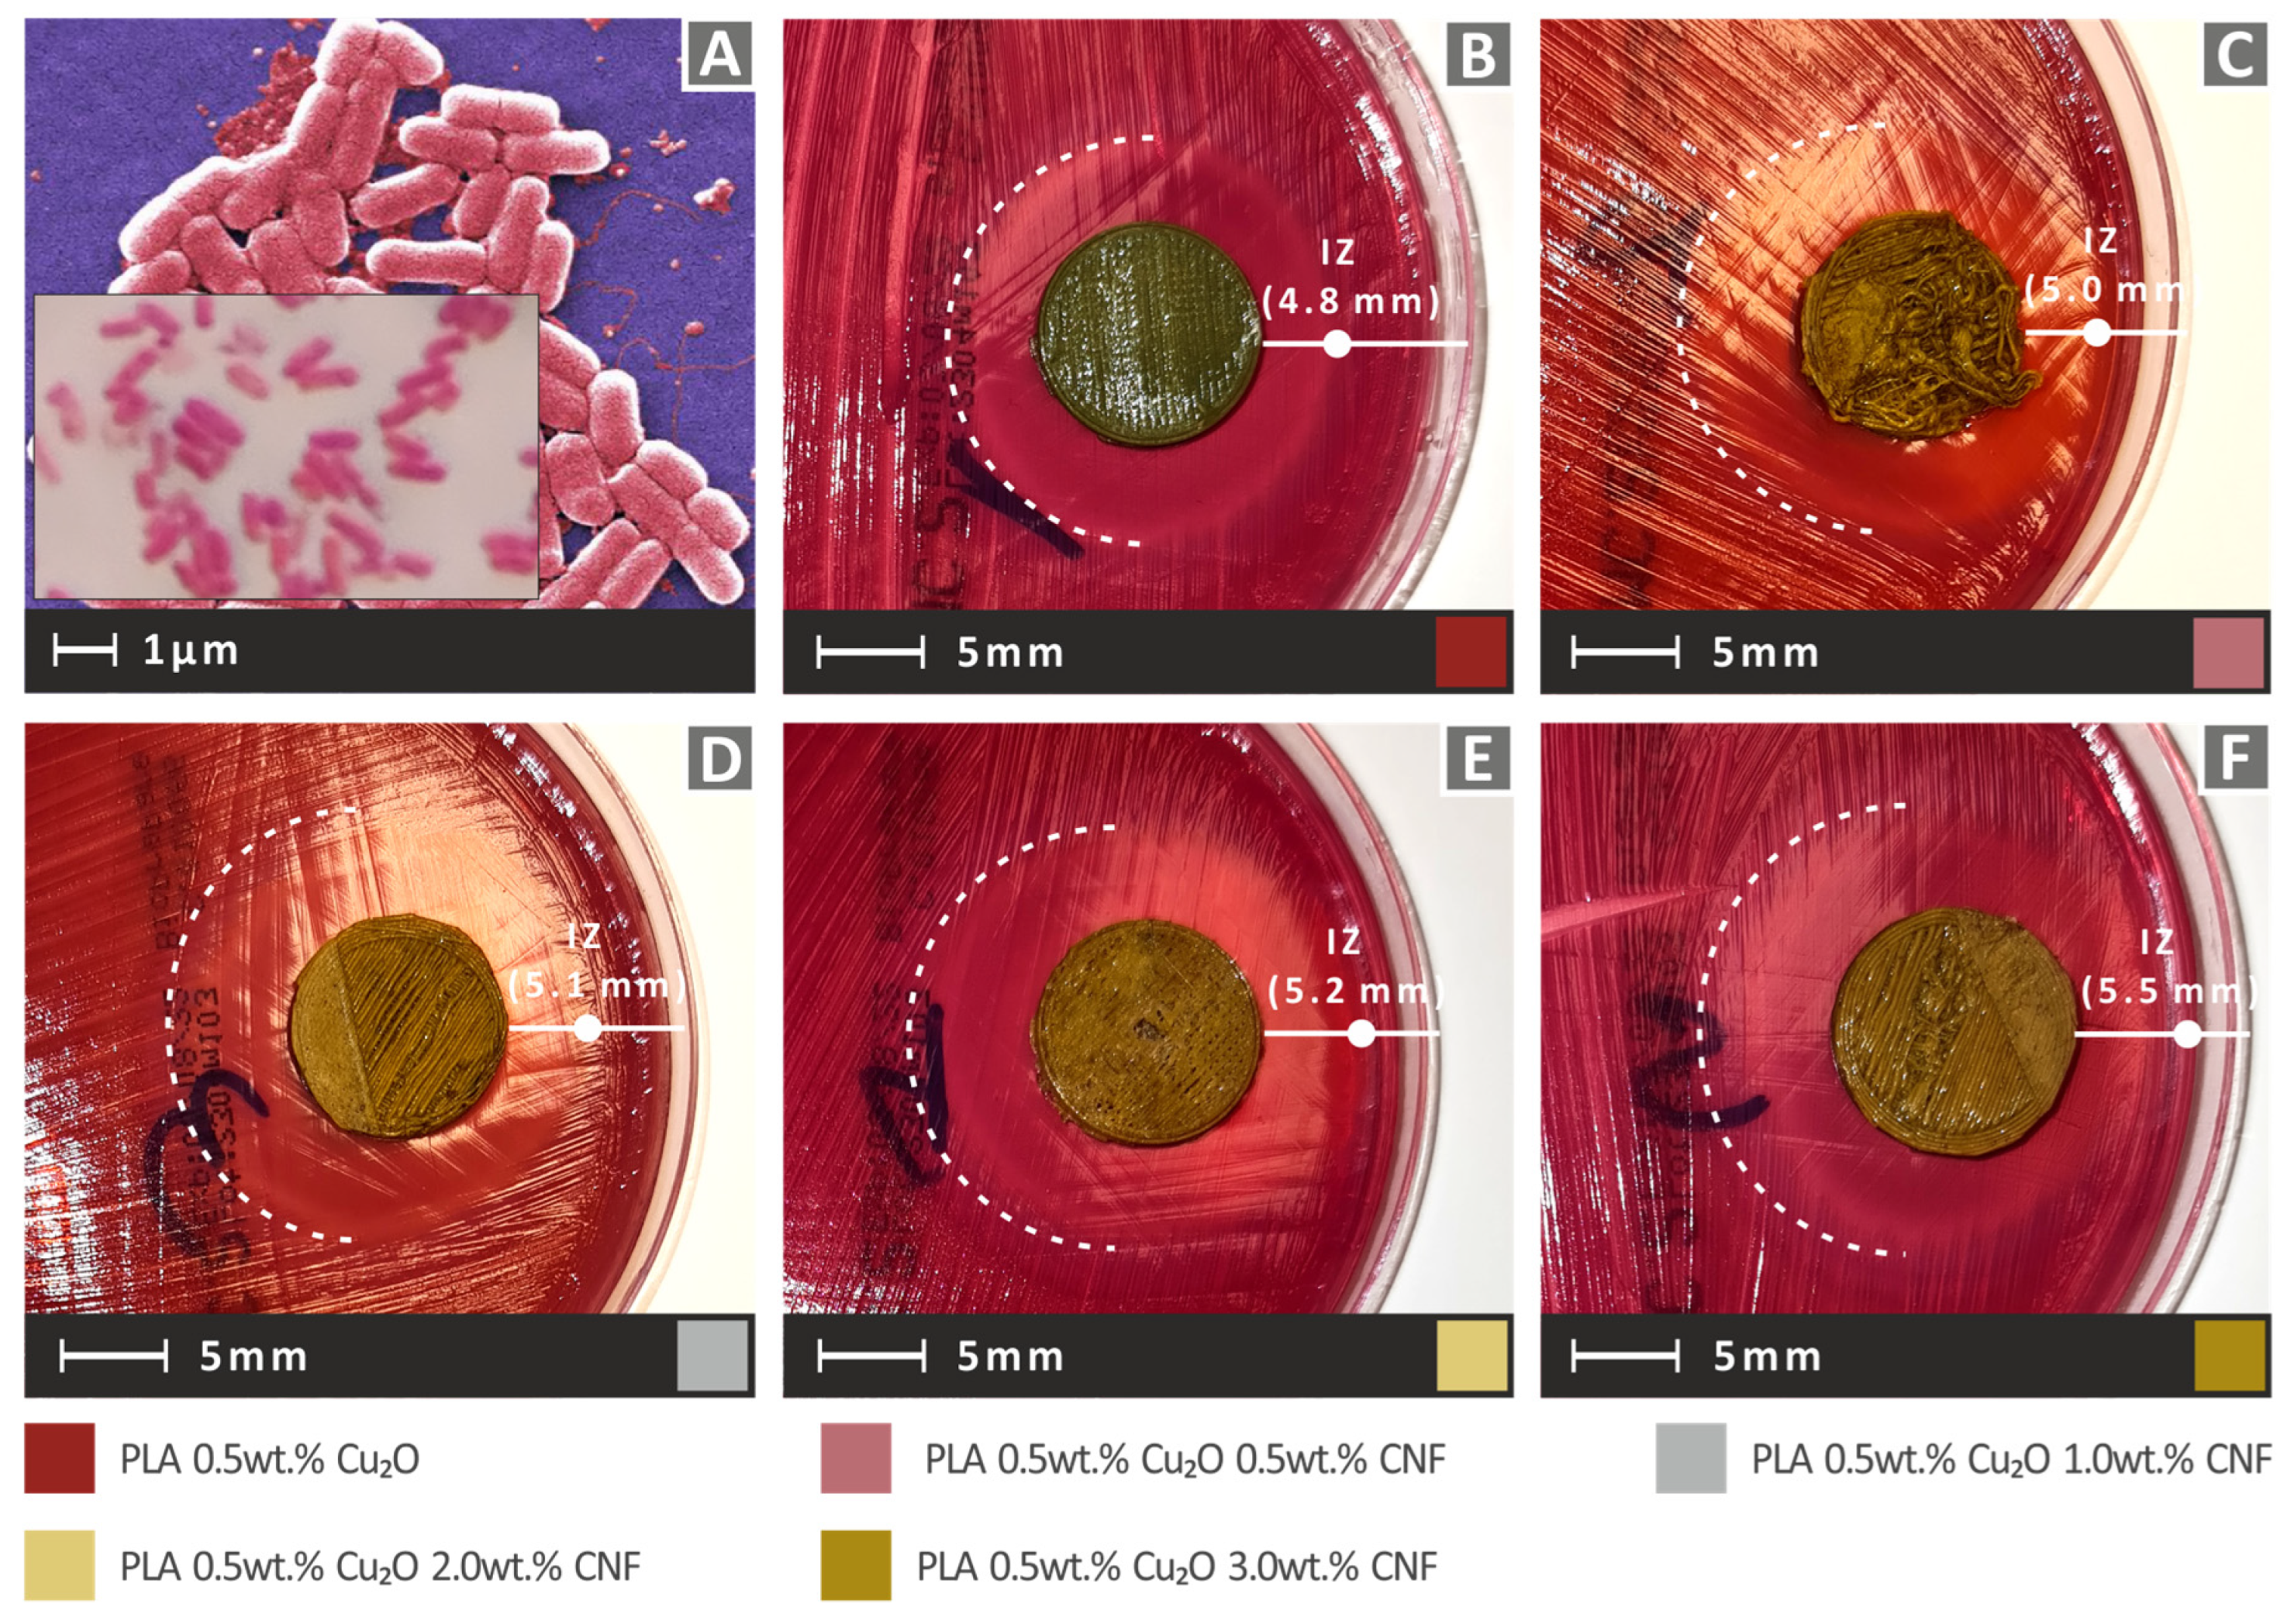
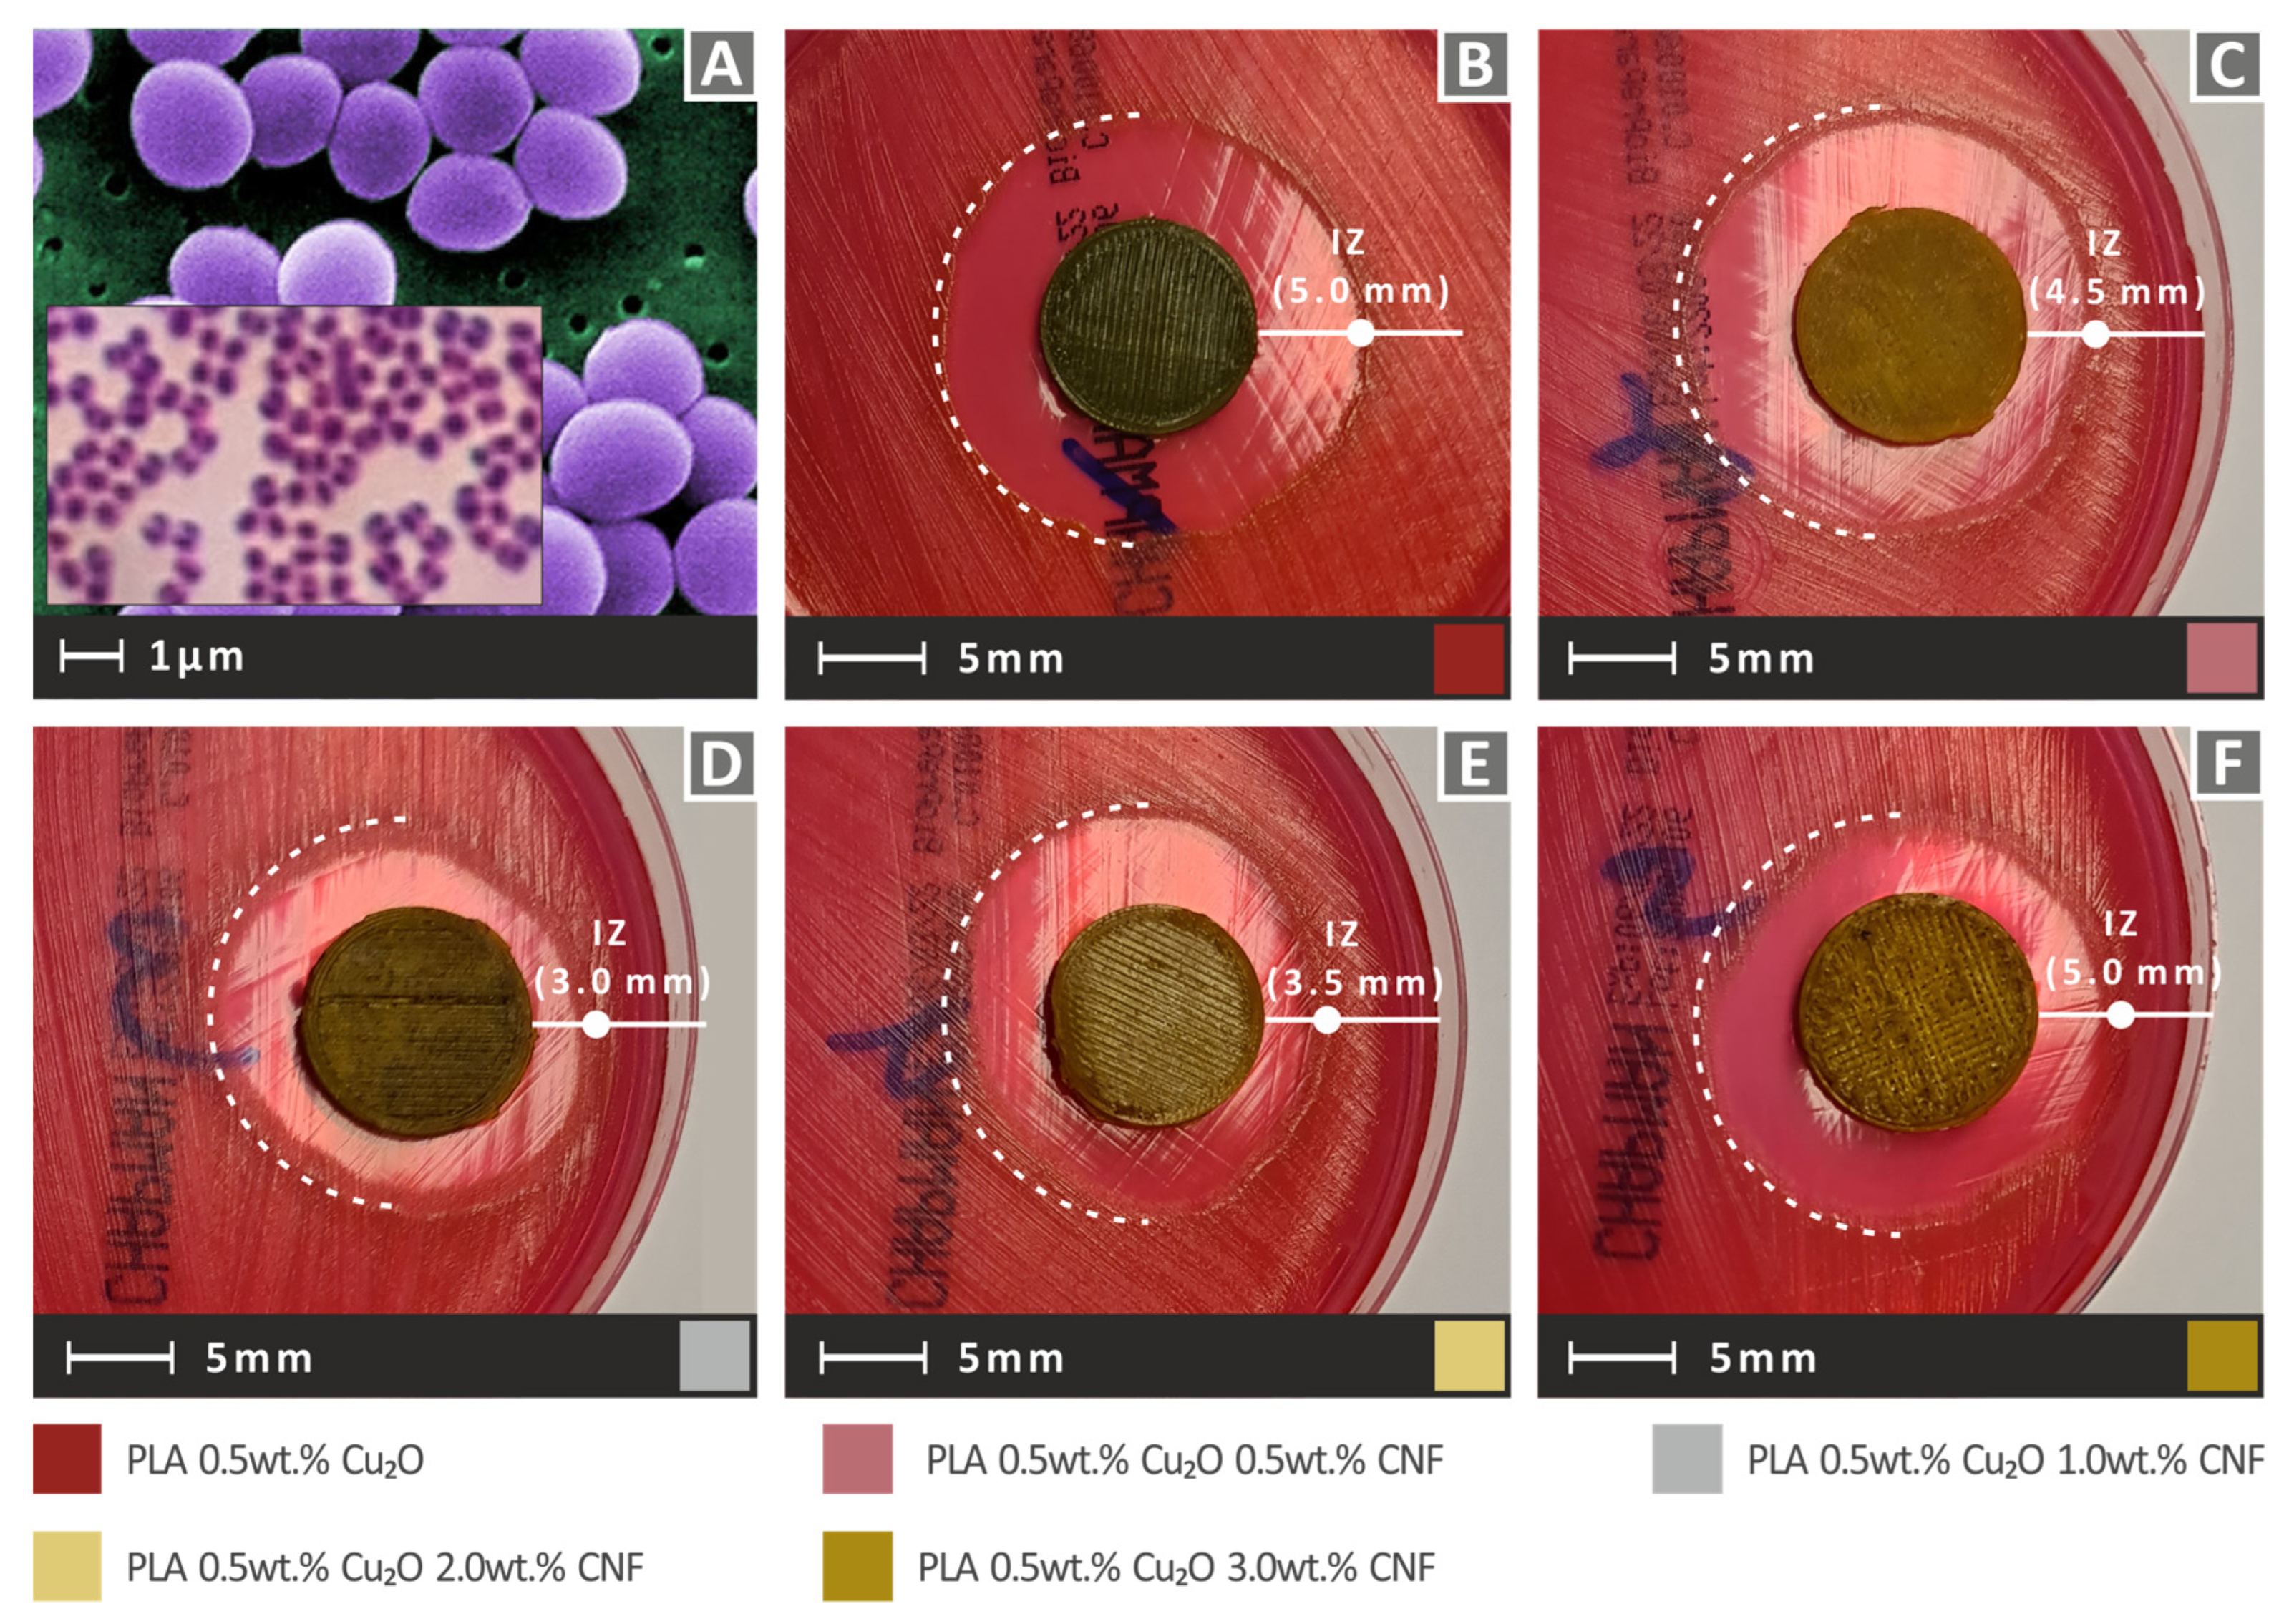
3.3. Antibacterial Activity of the Nanocomposites

The antibacterial activity of the nanocomposites for the two bacteria studied is presented in Figure 16 (E. coli) and Figure 17 (S. aureus), in which the developed inhibition zones (IZs) for each case are presented. All the nanocomposites showed biocidal behavior toward these two bacteria, developing sufficient IZs. Still, the response was different for each bacterium. In Gram-negative E. coli, the introduction of CNFs improved the biocidal performance of the nanocomposites, increased with increased CNF loading. In Gram-positive S. aureus, the opposite behavior was recorded, with the introduction of CNFs reducing the biocidal performance at low loadings when compared to nanocomposites with only the Cu2O filler. The nanocomposite with the highest CNF loading studied herein achieved in the Gram-positive S. aureus screening test had the same IZ as the nanocomposite with only the Cu2O filler. In the case of Gram-positive S. aureus, the addition of CNFs did not further improve the antibacterial performance of the Cu2O filler (and act as an antibacterial property enhancement agent, as stated in the literature for other materials), which has known antibacterial properties.

4. Discussion

With the aim of developing multifunctional nanocomposites for MEX 3D printing, a binary inclusions strategy was followed to enhance the mechanical performance and induce antibacterial properties in the tested materials. A thorough characterization process was followed in this work to investigate the performance of the developed nanocomposites, as well as the effect of fillers in the matrix material. Pure PLA and nanocomposites with one of the two fillers were also prepared and tested for comparison purposes. Such nanocomposites with solitary inclusions (PLA with one filler) have already been investigated in the literature, but no research has yet reported on the effect of simultaneously adding these two fillers in the PLA matrix material for MEX 3D printing or any manufacturing process. The effect of the filler loading was also considered in the present study. Comparing the existing work results with those reported in the literature, PLA/Cu2O nanocomposite mechanical test results (tensile and flexural) are in agreement with corresponding results for PLA/Cu nanocomposites prepared by MEX 3D printing [40,42]. PLA/CNF nanocomposite mechanical test results are also in good agreement with corresponding results reported in the literature [49,52,53]. Any deviations can be attributed to the different grades of the materials and the different equipment used in these research works. Comparison the results obtained in the current study with those reported in the literature further justifies the reliability of the current research results.
Through investigation of thermal properties, we found that the addition of the fillers does not significantly affect the thermal stability of the material. Additionally, the temperatures used for filament extrusions and the 3D printing process were lower than the temperatures at which the developed materials started to degrade. Therefore, these parameters do not affect the experimental results. The surface quality measurements showed that the addition of the fillers does not significantly affect the surface quality of the produced filament.
The preparation of the nanocomposites consisted of steps aiming to achieve good dispersion of the filler in the matrix material with simple processes and equipment. First, the powders were vigorously mixed in a high-power blender for a sufficient time. Then, a first extrusion process was implemented to provide an initial distribution of the fillers in the matrix material. Afterward, the produced nanocomposite filament was shredded into pellets and underwent a second extrusion process in a special MEX 3D printing extruder capable of mixing materials and additives, owing to the geometry of its screw, according to the manufacturer. The good dispersion level achieved with this process for the prepared nanocomposites was verified by the characterization process. In the tests, deviation in the results was within an acceptable limit in all cases. Furthermore, in the morphological investigation process, no agglomerations were observed, and the visible CNFs indicated a rather good dispersion of the filler in the matrix material.
The mechanical characterization tests showed a clear enhancement in the response of the materials with the addition of the fillers. This enhancement was more intense in the nanocomposites containing both fillers, and a similar result pattern was found in most of the tests conducted. This indicates a rather good interaction between the nanofillers and the creation of a fine nanoparticle network. At the highest CNF filler loading, a plausible saturation in filler loading resulted in a decreased mechanical response from the nanocomposite. Morphological investigations on the side surface of the specimens revealed a fine 3D printing quality in all cases, except the case with the highest CNF loading, which is in agreement with the results of mechanical tests carried out in the present study. Morphological investigations of the fracture surface of the tensile specimens revealed a rather brittle fracture mechanism on the filament strands. In the antibacterial performance tests, all the nanocomposites exhibited biocidal properties, with the addition of the CNFs further enhancing the performance of the nanocomposites. Overall, the addition of the CNFs had a positive impact on the material performance at low concentrations. With increased CNF loading, at the highest concentration studied, a plausible filler saturation was reached, as the mechanical properties at this loading were drastically decreased compared to lower filler concentrations. At the highest concentration studied, as expected, only the antibacterial performance increased, developing increased IZ in the tests for the Gram-negative E. coli. For the gram-positive S. aureus, the addition of CNFs at low concentrations negatively affected the antibacterial performance of the Cu2O. At the highest CNF concentration studied, the antibacterial performance of the binary inclusion nanocomposite was the same as that of the nanocomposite with only a Cu2O additive. Higher concentrations could not be achieved due to processability issues.
An agar well diffusion screening process was employed in this work for comparison in order to evaluate the effect of the filler on the antibacterial response. The findings of the screening process were assessed optically. It cannot be safely assumed that the additives induce a radical antibacterial improvement in the materials; however, the prepared nanocomposites have biocidal properties, given that inhibition zones developed during the process. The matrix material alone cannot inhibit bacterial growth, and no inhibition zone was developed with the matrix material in this test, as expected. With this process, the differences between the nanocomposites with different additives and the effect of the binary inclusions in the matrix material were revealed. The differences were found to be marginal in this test.

5. Conclusions

In this work, nanocomposites were developed with binary inclusions for MEX 3D printing. The aim was to develop multifunctional nanocomposites that further expand the usability of the materials and the 3D printing process. More specifically, in the most popular polymer in MEX 3D printing (PLA), Cu2O and CNF nanoparticles were included, which are known in the literature for their effect as fillers in nanocomposites, although they have never been introduced together in a composite. An enhanced mechanical response from the prepared nanocomposites, along with antibacterial properties, was expected to be achieved. This was verified in the work with the characterization processes followed for the prepared nanocomposites. The effect of CNF loading in the nanocomposites was also considered, and a saturation threshold was reached at the highest loading concentration studied herein. This indicates that low CNF loadings are sufficient for inducing a multifunctional character in the nanocomposites. Good synergistic behavior between these two fillers can be assumed, as the addition of the CNFs further enhanced the performance of the materials studied. Overall, the PLA with 0.5 wt.% Cu2O and 1.0 wt.% CNF exhibited the highest mechanical performance, with a 51.1% increase in tensile strength, a 35.9% increase in tensile modulus of elasticity, a 23.2% increase in flexural strength, and a sufficient response in the other mechanical tests conducted compared to the pure PLA polymer. Regarding the antibacterial performance, all the prepared nanocomposites exhibited such properties for the two bacteria tested. The addition of CNFs did not affect the antibacterial performance of the nanocomposites any significant way, so no solid conclusions can be derived. In the screening tests, an increase was achieved with the addition of CNFs in the nanocomposites for the Gram-negative E. coli bacterium. For the Gram-positive S. aureus bacterium, the opposite result is reported, with a slight decrease in the antibacterial performance in the screening tests at low CNF concentrations, with an increasing trend with increased CNF concentration. The nanocomposites prepared and studied herein can be easily adapted for industrial-scale use, with potential to expand MEX 3D printing for applications requiring enhanced mechanical performance and antibacterial properties. In future work, these material loadings can be further optimized, and the process can be expanded for industrial-scale use.

Author Contributions

Conceptualization, N.V. and M.P.; methodology, N.V. and J.K.; software, N.M. and V.P.; validation, N.V. and J.K.; formal analysis, N.M. and V.P.; investigation, S.K., A.G. and N.S.; resources, N.V. and N.S.; data curation, N.M., J.K., V.P., S.K., A.G. and N.S.; writing—original draft preparation, M.P.; writing—review and editing, M.P.; visualization, N.V. and N.M.; supervision, N.V.; project administration, M.P.; funding acquisition, N.V. and M.P. All authors have read and agreed to the published version of the manuscript.

Funding

This research received no external funding.

Institutional Review Board Statement

Not applicable.

Informed Consent Statement

Not applicable.

Data Availability Statement

The data presented in this study are available upon request from the corresponding author.

Acknowledgments

The authors would like to thank Aleka Manousaki from the Institute of Electronic Structure and Laser of the Foundation for Research and Technology, Hellas (IESL-FORTH), obtaining the SEM images presented in this work, as well as the Photonic Phononic and Meta-Materials Laboratory for sharing the Raman instrumentation.

Conflicts of Interest

The authors declare no conflict of interest.

References

  1. Shanmugam, V.; Rajendran, D.J.J.; Babu, K.; Rajendran, S.; Veerasimman, A.; Marimuthu, U.; Singh, S.; Das, O.; Neisiany, R.E.; Hedenqvist, M.S.; et al. The mechanical testing and performance analysis of polymer-fibre composites prepared through the additive manufacturing. Polym. Test. 2021, 93, 106925. [Google Scholar] [CrossRef]
  2. Savvakis, K.; Petousis, M.; Vairis, A.; Vidakis, N.; Bikmeyev, A.T. Experimental determination of the tensile strength of fused deposition modeling parts. In Proceedings of the ASME International Mechanical Engineering Congress and Exposition, Montreal, QB, Canada, 14–20 November 2014; Volume 14. [Google Scholar]
  3. Al Rashid, A.; Ikram, H.; Koç, M. Additive manufacturing and mechanical performance of carbon fiber reinforced Polyamide-6 composites. Mater. Today Proc. 2022. [Google Scholar] [CrossRef]
  4. Lyu, Y.; Zhao, H.; Wen, X.; Lin, L.; Schlarb, A.K.; Shi, X. Optimization of 3D printing parameters for high-performance biodegradable materials. J. Appl. Polym. Sci. 2021, 138, 50782. [Google Scholar] [CrossRef]
  5. Mahmood, M.A.; Visan, A.I.; Ristoscu, C.; Mihailescu, I.N. Artificial neural network algorithms for 3D printing. Materials 2021, 14, 163. [Google Scholar] [CrossRef]
  6. Vidakis, N.; Petousis, M.; Kechagias, J.D. Parameter effects and process modelling of Polyamide 12 3D-printed parts strength and toughness. Mater. Manuf. Processes 2022, 1–12. [Google Scholar] [CrossRef]
  7. Gebler, M.; Schoot Uiterkamp, A.J.M.; Visser, C. A global sustainability perspective on 3D printing technologies. Energy Policy 2014, 74, 158–167. [Google Scholar] [CrossRef]
  8. Vidakis, N.; Petousis, M.; Tzounis, L.; Maniadi, A.; Velidakis, E.; Mountakis, N.; Kechagias, J.D. Sustainable additive manufacturing: Mechanical response of polyamide 12 over multiple recycling processes. Materials 2021, 14, 466. [Google Scholar] [CrossRef] [PubMed]
  9. Vidakis, N.; Maniadi, A.; Petousis, M.; Vamvakaki, M.; Kenanakis, G.; Koudoumas, E. Mechanical and Electrical Properties Investigation of 3D-Printed Acrylonitrile–Butadiene–Styrene Graphene and Carbon Nanocomposites. J. Mater. Eng. Perform. 2020, 29, 1909–1918. [Google Scholar] [CrossRef]
  10. Valino, A.D.; Dizon, J.R.C.; Espera, A.H.; Chen, Q.; Messman, J.; Advincula, R.C. Advances in 3D printing of thermoplastic polymer composites and nanocomposites. Prog. Polym. Sci. 2019, 98, 101162. [Google Scholar] [CrossRef]
  11. Campbell, T.A.; Ivanova, O.S. 3D printing of multifunctional nanocomposites. Nano Today 2013, 8, 119–120. [Google Scholar] [CrossRef]
  12. Gnanasekaran, K.; Heijmans, T.; van Bennekom, S.; Woldhuis, H.; Wijnia, S.; de With, G.; Friedrich, H. 3D printing of CNT- and graphene-based conductive polymer nanocomposites by fused deposition modeling. Appl. Mater. Today 2017, 9, 21–28. [Google Scholar] [CrossRef]
  13. Lunt, J. Large-scale production, properties and commercial applications of poly lactic acid polymers. Polym. Degrad. Stab. 1998, 59, 145–152. [Google Scholar] [CrossRef]
  14. Vidakis, N.; Petousis, M.; Velidakis, E.; Liebscher, M.; Tzounis, L. Three-Dimensional Printed Antimicrobial Objects of Polylactic Acid (PLA)-Silver Nanoparticle Nanocomposite Filaments Produced by an In-Situ Reduction Reactive Melt Mixing Process. Biomimetics 2020, 5, 42. [Google Scholar] [CrossRef] [PubMed]
  15. Divakara Shetty, S.; Shetty, N. Investigation of mechanical properties and applications of polylactic acids—A review. Mater. Res. Express 2019, 6, 112002. [Google Scholar] [CrossRef]
  16. Singhvi, M.S.; Zinjarde, S.S.; Gokhale, D.V. Polylactic acid: Synthesis and biomedical applications. J. Appl. Microbiol. 2019, 127, 1612–1626. [Google Scholar] [CrossRef] [Green Version]
  17. Hamad, K.; Kaseem, M.; Yang, H.W.; Deri, F.; Ko, Y.G. Properties and medical applications of polylactic acid: A review. Express Polym. Lett. 2015, 9, 435–455. [Google Scholar] [CrossRef]
  18. Casalini, T.; Rossi, F.; Castrovinci, A.; Perale, G. A Perspective on Polylactic Acid-Based Polymers Use for Nanoparticles Synthesis and Applications. Front. Bioeng. Biotechnol. 2019, 7, 259. [Google Scholar] [CrossRef] [PubMed]
  19. Vidakis, N.; Petousis, M.; Tzounis, L.; Grammatikos, S.A.; Porfyrakis, E.; Maniadi, A.; Mountakis, N. Sustainable additive manufacturing: Mechanical response of polyethylene terephthalate glycol over multiple recycling processes. Materials 2021, 14, 1162. [Google Scholar] [CrossRef]
  20. Chen, K.; Yu, L.; Cui, Y.; Jia, M.; Pan, K. Optimization of printing parameters of 3D-printed continuous glass fiber reinforced polylactic acid composites. Thin-Walled Struct. 2021, 164, 107717. [Google Scholar] [CrossRef]
  21. Yao, T.; Deng, Z.; Zhang, K.; Li, S. A method to predict the ultimate tensile strength of 3D printing polylactic acid (PLA) materials with different printing orientations. Compos. Part B Eng. 2019, 163, 393–402. [Google Scholar] [CrossRef]
  22. Moradi, M.; Moghadam, M.K.; Shamsborhan, M.; Bodaghi, M. The synergic effects of fdm 3d printing parameters on mechanical behaviors of bronze poly lactic acid composites. J. Compos. Sci. 2020, 4, 17. [Google Scholar] [CrossRef] [Green Version]
  23. Liu, Z.; Wang, Y.; Wu, B.; Cui, C.; Guo, Y.; Yan, C. A critical review of fused deposition modeling 3D printing technology in manufacturing polylactic acid parts. Int. J. Adv. Manuf. Technol. 2019, 102, 2877–2889. [Google Scholar] [CrossRef]
  24. Giordano, R.A.; Wu, B.M.; Borland, S.W.; Cima, L.G.; Sachs, E.M.; Cima, M.J. Mechanical properties of dense polylactic acid structures fabricated by three dimensional printing. J. Biomater. Sci. Polym. Ed. 1997, 8, 63–75. [Google Scholar] [CrossRef] [PubMed]
  25. Kechagias, J.; Chaidas, D.; Vidakis, N.; Salonitis, K.; Vaxevanidis, N.M. Key parameters controlling surface quality and dimensional accuracy: A critical review of FFF process. Mater. Manuf. Processes 2022. [Google Scholar] [CrossRef]
  26. Anderson, I. Mechanical Properties of Specimens 3D Printed with Virgin and Recycled Polylactic Acid. 3D Print. Addit. Manuf. 2017, 4, 110–115. [Google Scholar] [CrossRef]
  27. Chen, X.; Chen, G.; Wang, G.; Zhu, P.; Gao, C. Recent Progress on 3D-Printed Polylactic Acid and Its Applications in Bone Repair. Adv. Eng. Mater. 2020, 22, 1901065. [Google Scholar] [CrossRef]
  28. Tao, Z.; Ahn, H.J.; Lian, C.; Lee, K.H.; Lee, C.H. Design and optimization of prosthetic foot by using polylactic acid 3D printing. J. Mech. Sci. Technol. 2017, 31, 2393–2398. [Google Scholar] [CrossRef]
  29. Antoniac, I.; Popescu, D.; Zapciu, A.; Antoniac, A.; Miculescu, F.; Moldovan, H. Magnesium filled polylactic acid (PLA) material for filament based 3D printing. Materials 2019, 12, 719. [Google Scholar] [CrossRef] [Green Version]
  30. Vidakis, N.; Petousis, M.; Velidakis, E.; Mountakis, N.; Fischer-Griffiths, P.E.; Grammatikos, S.; Tzounis, L. Fused Filament Fabrication Three-Dimensional Printing Multi-Functional of Polylactic Acid/Carbon Black Nanocomposites. C 2021, 7, 52. [Google Scholar] [CrossRef]
  31. Kechagias, J.D.; Ninikas, K.; Petousis, M.; Vidakis, N.; Vaxevanidis, N. An investigation of surface quality characteristics of 3D printed PLA plates cut by CO2 laser using experimental design. Mater. Manuf. Processes 2021, 36, 1544–1553. [Google Scholar] [CrossRef]
  32. Kottasamy, A.; Samykano, M.; Kadirgama, K.; Rahman, M.; Noor, M.M. Experimental investigation and prediction model for mechanical properties of copper-reinforced polylactic acid composites (Cu-PLA) using FDM-based 3D printing technique. Int. J. Adv. Manuf. Technol. 2022, 119, 5211–5232. [Google Scholar] [CrossRef]
  33. Yang, F.; Zeng, J.; Long, H.; Xiao, J.; Luo, Y.; Gu, J.; Zhou, W.; Wei, Y.; Dong, X. Micrometer copper-zinc alloy particles-reinforced wood plastic composites with high gloss and antibacterial properties for 3d printing. Polymers 2020, 12, 621. [Google Scholar] [CrossRef] [PubMed] [Green Version]
  34. Vidakis, N.; Petousis, M.; Velidakis, E.; Mountakis, N.; Tsikritzis, D.; Gkagkanatsiou, A.; Kanellopoulou, S. Investigation of the Biocidal Performance of Multi-Functional Resin/Copper Nanocomposites with Superior Mechanical Response in SLA 3D Printing. Biomimetics 2022, 7, 8. [Google Scholar] [CrossRef]
  35. Vidakis, N.; Petousis, M.; Michailidis, N.; Grammatikos, S.; David, C.N.; Mountakis, N.; Argyros, A.; Boura, O. Development and Optimization of Medical-Grade MultiFunctional Polyamide 12-Cuprous Oxide Nanocomposites with Superior Mechanical and Antibacterial Properties for Cost-Effective 3D Printing. Nanomaterials 2022, 12, 534. [Google Scholar] [CrossRef]
  36. Alam, F.; Shukla, V.R.; Varadarajan, K.M.; Kumar, S. Microarchitected 3D printed polylactic acid (PLA) nanocomposite scaffolds for biomedical applications. J. Mech. Behav. Biomed. Mater. 2020, 103, 103576. [Google Scholar] [CrossRef] [PubMed]
  37. Tümer, E.H.; Erbil, H.Y. Extrusion-based 3D printing applications of pla composites: A review. Coatings 2021, 11, 390. [Google Scholar] [CrossRef]
  38. Vaněčková, E.; Bouša, M.; Sokolová, R.; Moreno-García, P.; Broekmann, P.; Shestivska, V.; Rathouský, J.; Gál, M.; Sebechlebská, T.; Kolivoška, V. Copper electroplating of 3D printed composite electrodes. J. Electroanal. Chem. 2020, 858, 113763. [Google Scholar] [CrossRef]
  39. Avşar Aydın, E.; Torun, A.R. 3D printed PLA/copper bowtie antenna for biomedical imaging applications. Phys. Eng. Sci. Med. 2020, 43, 1183–1193. [Google Scholar] [CrossRef]
  40. Kesavarma, S.; Lee, E.H.; Samykano, M.; Kadirgama, K.; Rahman, M.M.; Sofiah, A.G.N. Flextural properties of 3D printed Copper-Filler Polylactic Acid (Cu-PLA). IOP Conf. Ser. Mater. Sci. Eng. 2020, 788, 012051. [Google Scholar] [CrossRef]
  41. Bardot, M.; Schulz, M.D. Biodegradable poly(Lactic acid) nanocomposites for fused deposition modeling 3d printing. Nanomaterials 2020, 10, 2567. [Google Scholar] [CrossRef]
  42. Zhang, X.; Chen, L.; Mulholland, T.; Osswald, T.A. Characterization of mechanical properties and fracture mode of PLA and copper/PLA composite part manufactured by fused deposition modeling. SN Appl. Sci. 2019, 1, 616. [Google Scholar] [CrossRef] [Green Version]
  43. Lin, Q.; Jiang, P.; Ren, S.; Liu, S.; Ji, Y.; Huang, Y.; Yu, W.; Fontaine, G.; Bourbigot, S. Advanced functional materials based on bamboo cellulose fibers with different crystal structures. Compos. Part A Appl. Sci. Manuf. 2022, 154, 106758. [Google Scholar] [CrossRef]
  44. Graninger, G.; Kumar, S.; Garrett, G.; Falzon, B.G. Effect of shear forces on dispersion-related properties of microcrystalline cellulose-reinforced EVOH composites for advanced applications. Compos. Part A Appl. Sci. Manuf. 2020, 139, 106103. [Google Scholar] [CrossRef]
  45. Drogat, N.; Granet, R.; Sol, V.; Memmi, A.; Saad, N.; Klein Koerkamp, C.; Bressollier, P.; Krausz, P. Antimicrobial silver nanoparticles generated on cellulose nanocrystals. J. Nanoparticle Res. 2011, 13, 1557–1562. [Google Scholar] [CrossRef]
  46. Vidakis, N.; Petousis, M.; Velidakis, E.; Spiridaki, M.; Kechagias, J.D. Mechanical Performance of Fused Filament Fabricated and 3D-Printed Polycarbonate Polymer and Polycarbonate/Cellulose Nanofiber Nanocomposites. Fibers 2021, 9, 74. [Google Scholar] [CrossRef]
  47. Zhou, L.; Ke, K.; Yang, M.B.; Yang, W. Recent progress on chemical modification of cellulose for high mechanical-performance Poly(lactic acid)/Cellulose composite: A review. Compos. Commun. 2021, 23, 100548. [Google Scholar] [CrossRef]
  48. Dong, J.; Mei, C.; Han, J.; Lee, S.; Wu, Q. 3D printed poly(lactic acid) composites with grafted cellulose nanofibers: Effect of nanofiber and post-fabrication annealing treatment on composite flexural properties. Addit. Manuf. 2019, 28, 621–628. [Google Scholar] [CrossRef]
  49. Ambone, T.; Torris, A.; Shanmuganathan, K. Enhancing the mechanical properties of 3D printed polylactic acid using nanocellulose. Polym. Eng. Sci. 2020, 60, 1842–1855. [Google Scholar] [CrossRef]
  50. Kaščák, J.; Gašpár, Š.; Paško, J.; Husár, J.; Knapčíková, L. Polylactic acid and its cellulose based composite as a significant tool for the production of optimized models modified for additive manufacturing. Sustainability 2021, 13, 1256. [Google Scholar] [CrossRef]
  51. Murphy, C.A.; Collins, M.N. Microcrystalline cellulose reinforced polylactic acid biocomposite filaments for 3D printing. Polym. Compos. 2018, 39, 1311–1320. [Google Scholar] [CrossRef]
  52. Aumnate, C.; Soatthiyanon, N.; Makmoon, T.; Potiyaraj, P. Polylactic acid/kenaf cellulose biocomposite filaments for melt extrusion based-3D printing. Cellulose 2021, 28, 8509–8525. [Google Scholar] [CrossRef]
  53. Wang, Q.; Ji, C.; Sun, L.; Sun, J.; Liu, J. Cellulose Nanofibrils Filled Poly(Lactic Acid) Biocomposite Filament for FDM 3D Printing. Molecules 2020, 25, 2319. [Google Scholar] [CrossRef] [PubMed]
  54. Dong, J.; Li, M.; Zhou, L.; Lee, S.; Mei, C.; Xu, X.; Wu, Q. The influence of grafted cellulose nanofibers and postextrusion annealing treatment on selected properties of poly(lactic acid) filaments for 3D printing. J. Polym. Sci. Part B Polym. Phys. 2017, 55, 847–855. [Google Scholar] [CrossRef]
  55. Li, L.; Chen, Y.; Yu, T.; Wang, N.; Wang, C.; Wang, H. Preparation of polylactic acid/TEMPO-oxidized bacterial cellulose nanocomposites for 3D printing via Pickering emulsion approach. Compos. Commun. 2019, 16, 162–167. [Google Scholar] [CrossRef]
  56. Zuo, M.; Pan, N.; Liu, Q.; Ren, X.; Liu, Y.; Huang, T.S. Three-dimensionally printed polylactic acid/cellulose acetate scaffolds with antimicrobial effect. RSC Adv. 2020, 10, 2952–2958. [Google Scholar] [CrossRef] [Green Version]
  57. ASTM D638-02a; Standard Test Method for Tensile Properties of Plastics. ASTM International: West Conshohocken, PA, USA, 2002.
  58. ASTM D790-14; Standard Test Methods for Flexural Properties of Unreinforced and Reinforced Plastics and Electrical Insulating Materials. ASTM International: West Conshohocken, PA, USA, 2010.
  59. ASTM D6110-04; Standard Test Method for Determining the Charpy Impact Resistance of Notched Specimens of Plastics. ASTM International: West Conshohocken, PA, USA, 2004.
  60. ASTM E384-11; Standard Test Method for Knoop and Vickers Hardness of Materials1. ASTM International: West Conshohocken, PA, USA, 2012.
  61. Balouiri, M.; Sadiki, M.; Ibnsouda, S.K. Methods for in vitro evaluating antimicrobial activity: A review. J. Pharm. Anal. 2016, 6, 71–79. [Google Scholar] [CrossRef] [PubMed] [Green Version]
  62. Giraldo, B.; Yeh, W.; Kobayashi, N.P. Formation of single-crystal Cu2O strips in non-single-crystal CuO thin films by continuous-wave laser diode with micro-chevron laser beam (μ-CLB). J. Mater. Sci. 2020, 55, 14105–14111. [Google Scholar] [CrossRef]
  63. Lin, Z.; Guo, X.; He, Z.; Liang, X.; Wang, M.; Jin, G. Thermal degradation kinetics study of molten polylactide based on Raman spectroscopy. Polym. Eng. Sci. 2021, 61, 201–210. [Google Scholar] [CrossRef]
  64. Zou, H.; Yi, C.; Wang, L.; Liu, H.; Xu, W. Thermal degradation of poly(lactic acid) measured by thermogravimetry coupled to Fourier transform infrared spectroscopy. J. Therm. Anal. Calorim. 2009, 97, 929–935. [Google Scholar] [CrossRef]
  65. Liu, X.; Zou, Y.; Li, W.; Cao, G.; Chen, W. Kinetics of thermo-oxidative and thermal degradation of poy(D,L-lactide) (PDLLA) at processing temperature. Polym. Degrad. Stab. 2006, 91, 3259–3265. [Google Scholar] [CrossRef]
Figure 1. Process for the synthesis of the nanocomposites: (1) raw material preparation, (2) filament extrusion (3D Evo Composer), (3) filament drying, and (4) 3D printing of specimens (Intamsys Funmat HT).
Fibers 10 00052 g001
Figure 2. The characterization process for the prepared nanocomposites: (1) Raman spectra (LabRAM HR Raman spectrometer), (2) thermogravimetric analysis (Perkin Elmer Diamond), (3) tensile test (Imada MX2), (4) 3-point bending flexural test (Imada MX2), (5) surface morphology of the filament side surface in atomic force microscopy (Microscope Solver P47H Pro), (6) morphological investigation with SEM (JEOL JSM 6362LV), (7) antibacterial investigation with agar well diffusion screening process (inspection of the bacteria cultures with an optical microscope), (8) inhibition zone developed by a specimen 3D-printed with PLA/0.5 wt.% Cu2O nanocomposite by the agar well diffusion screening process on S. aureus bacterium.
Fibers 10 00052 g002
Figure 3. 3D printing settings and specimen geometry according to international standards.
Fibers 10 00052 g003
Figure 4. TGA results for all materials tested: (A) weight loss (%) vs. temperature; (B) DTGA graph depicting the weight loss ratio vs. temperature.
Fibers 10 00052 g004
Figure 5. Filament surface morphology of all tested nanomaterials, PLA with: (A) 0.5 wt.% CNF, (B) 0.5 wt.% Cu2O, (C) 0.5 wt.% Cu2O and 0.5 wt.% CNF, (D) 0.5 wt.% Cu2O and 1.0 wt.% CNF, (E) 0.5 wt.% Cu2O and 2.0 wt.% CNF, and (F) 0.5 wt.% Cu2O and 3.0 wt.% CNF.
Fibers 10 00052 g005
Figure 6. Raman spectra graphs depicting the characteristic peaks for all tested materials.
Fibers 10 00052 g006
Figure 7. For all materials tested: (A) tensile stress vs. strain graph, (B) tensile strength and deviation (five specimens were tested), (C) tensile modulus of elasticity and deviation (five specimens were tested).
Fibers 10 00052 g007
Figure 8. For all materials tested: (A) flexural stress vs. strain graph, (B) flexural strength and deviation (five specimens were tested), (C) flexural modulus of elasticity and deviation (five specimens were tested).
Fibers 10 00052 g008
Figure 9. For all materials tested: (A) tensile toughness (MJ/m3) and deviation (five specimens were tested), (B) flexural toughness (MJ/m3) and deviation (five specimens were tested).
Fibers 10 00052 g009
Figure 10. For all materials tested: (A) impact toughness (kJ/m2) and deviation (five specimens were tested), (B) Vicker’s microhardness (HV) and deviation (five measurements were taken).
Fibers 10 00052 g010
Figure 11. SEM images for the pure PLA material 3D-printed tensile specimen: (A) side of the specimen, (B) fracture surface.
Fibers 10 00052 g011
Figure 12. SEM images at 160× magnification for the side surface of the 3D-printed tensile specimens made with the nanocomposites tested in this work, PLA with: (A) 0.5 wt.% CNF, (B) 0.5 wt.% Cu2O, (C) 0.5 wt.% Cu2O and 0.5 wt.% CNF, (D) 0.5 wt.% Cu2O and 1.0 wt.% CNF, (E) 0.5 wt.% Cu2O and 2.0 wt.% CNF, and (F) 0.5 wt.% Cu2O and 3.0 wt.% CNF.
Fibers 10 00052 g012
Figure 13. SEM images at 500× magnification for the fracture surface of the 3D-printed tensile specimens made with the nanocomposites tested in this work, PLA with: (A) 0.5 wt.% CNF, (B) 0.5 wt.% Cu2O, (C) 0.5 wt.% Cu2O and 0.5 wt.% CNF, (D) 0.5 wt.% Cu2O and 1.0 wt.% CNF, (E) 0.5 wt.% Cu2O and 2.0 wt.% CNF, and (F) 0.5 wt.% Cu2O and 3.0 wt.% CNF.
Fibers 10 00052 g013
Figure 14. SEM images at 5000× magnification and the corresponding EDS graphs for PLA with: (A,B) 0.5 wt.% CNF, (C,D) 0.5 wt.% Cu2O, (E,F) 0.5 wt.% Cu2O 0.5 wt.% CNF, (G,H), 0.5 wt.% Cu2O 1.0 wt.% CNF, (I,J) 0.5 wt.% Cu2O 2.0 wt.% CNF, and (K,L) 0.5 wt.% Cu2O 3.0 wt.% CNF.
Fibers 10 00052 g014
Figure 15. Spider graph summarizing the mechanical test results for all the tested materials. The material with the highest measured value in each test is indicated on the right side.
Fibers 10 00052 g015
Figure 16. Antibacterial screening process for nanocomposites performance against E. coli bacterium: (A) typical E. coli morphology, (B) 0.5 wt.% Cu2O, (C) 0.5 wt.% Cu2O, 0.5 wt.% CNF, (D) 0.5 wt.% Cu2O, 1.0 wt.% CNF, (E) 0.5 wt.% Cu2O, 2.0 wt.% CNF, and (F) 0.5 wt.% Cu2O, 3.0 wt.% CNF.
Fibers 10 00052 g016
Figure 17. Antibacterial screening process for nanocomposites performance against S. aureus bacterium: (A) typical E. S. aureus morphology, (B) 0.5 wt.% Cu2O, (C) 0.5 wt.% Cu2O, 0.5 wt.% CNF, (D) 0.5 wt.% Cu2O, 1.0 wt.% CNF, (E) 0.5 wt.% Cu2O, 2.0 wt.% CNF, and (F) 0.5 wt.% Cu2O, 3.0 wt.% CNF.
Fibers 10 00052 g017
Table 1. Major identified Raman peaks and their related assignments.
Wavenumber (cm−1)Raman Peak Assignment
870C-COO stretching [63]
1115CH3 rocking [63]
1374C-H bending of CH3 [64]
1449CH3 bending [63]
1761C=O stretching [63]
2888C-H antisymmetric stretching [65]
2945C-H stretching and bending [64]
2996CH3 asymmetric stretch [65]
Publisher’s Note: MDPI stays neutral with regard to jurisdictional claims in published maps and institutional affiliations.

