Article

Transverse Loading on Single High-Performance Fibers by Round-Head Indenters and the Fibers’ Failure Visualization

1
School of Aeronautics and Astronautics, Purdue University, 701 W Stadium Avenue, West Lafayette, IN 47907, USA
2
School of Materials Engineering, Purdue University, 701 W Stadium Avenue, West Lafayette, IN 47907, USA
*
Author to whom correspondence should be addressed.
Fibers 2022, 10(6), 48; https://doi.org/10.3390/fib10060048
Submission received: 11 February 2022 / Revised: 20 April 2022 / Accepted: 23 May 2022 / Published: 30 May 2022

Abstract

:
High-performance fibers are well-known for their high stiffness and strength under axial tension. However, in their many applications as critical components of textiles and composites, transverse loads widely exist in their normal service life. In this study, we modified a micro material testing system to transverse load single fibers using round-head indenters. By integrating the loading platform with the Scanning Electron Microscopy (SEM) operating at a low-vacuum mode, we visualized the failure processes of fibers without conductive coatings. Post-fracture analysis was conducted to provide complementary information about the fibers’ failure. The energy dissipation was compared with the axial tensile experiments. Three inorganic and two organic fibers were investigated, namely carbon nanotube, ceramic, glass, aramid, and ultrahigh molecule weight polyethylene fibers. Different failure characteristics were reported. It is revealed that the organic fibers had higher energy dissipation than the inorganic fibers under the transverse loading by the round-head indenters. The fiber’s energy dissipation under transverse loading was no more than 17.9% of that subjected to axial tension. Such a reduced energy dissipation is believed to be due to the stress concentration under the indenter. It is suggested that the fiber’s material constituent, structural characteristics, and stress concentration under the indenter should be considered in the fiber model for textiles and composites.

1. Introduction

The growth of the advanced textile and composite industry necessitates multiscale studies across the single fiber to the engineering structure. In particular, mechanical experiments on materials and structures above the fiber-scale level demonstrate that traditional rod-models cannot always capture fibers’ failure characteristics. For example, transverse impact on yarns [1,2], composite strips [3], composite single plies [4], fabrics [5], and laminates [6] revealed a punch-shear failure mechanism at the critical velocity or ballistic limit, indicating that fibers are not under a pure-tension stress state. Besides, fractography on several fibers after transverse debonding with matrix [7] showed that aramid fibers were split transversely during debonding. In contrast, S-2 glass fibers debonded with the matrix along their interfaces. These findings make it important to perform fundamental experiments on single fibers and understand their fracture behavior under critical conditions.
Recent experimental efforts in single fibers are mostly about the fibers’ mechanical responses under simple loadings, such as axial tension, transverse compression, and pure torsion. First, single-fiber tensile experiments were usually conducted by directly gripping fibers to a tensile loading frame [8] or pulling fibers adhered on cardboards [9,10]. Quasi-static tensile experiments could be performed on lab-constructed material testing systems, which used a linear actuator to control the movement and a load cell to measure the tensile force [8]. To load a single fiber at high strain rates, a modified Kolsky tension bar was designed [9,10]. Compared with the traditional Kolsky bar, the modified setup replaced the transmission bar with a fast-response load cell, recording the fiber’s loading history during the dynamic loading. With the development of the characterization technique, researchers tried to obtain more decent fibers’ deformation and failure information during axial tension. Staniszewski et al. [11] adopted Scanning Electron Microscopy (SEM) to record the fibrils’ deformation of a single Dyneema® SK76 fiber under quasi-static loading and developed a fibril-scale model to describe the fiber’s tensile fracture. Hudspeth et al. [12] integrated the modified Kolsky bar technique with the high-speed synchrotron X-ray phase-contrast imaging, characterizing the dynamic tensile behavior of Kevlar® KM2, Dyneema® SK76, and S-2 glass fibers. To investigate the transverse compressive behavior of single fibers, Guo et al. [13] employed a piezoelectric actuator to apply the quasi-static compressive force and an air gap capacitive displacement sensor to measure the displacement. The methodology was used to examine many fiber types, including Kevlar®, Dyneema®, and carbon nanotube fibers [14,15]. The torsional experiments on single fibers were performed by using a torsion pendulum apparatus [16]. However, the apparatus can only measure the fiber’s specific shear stress at a specific shear strain, while it cannot obtain the entire torsional stress–strain curve of the fiber.
It is noted that most textiles and composites in engineering structures, such as soft armor, aircraft, and construction, are subjected to transverse loads in their normal service life. To provide insight into the actual fiber’s failure in larger-scale materials and structures, Hudspeth et al. [17] transversely loaded single fibers. Five fiber types were studied, including Kevlar® KM2, Spectra® 130d, Dyneema® SK62, Dyneema® SK76, and Zylon® 555. Three indenter geometries were investigated, namely a 0.30 caliber rounded head, a 0.30 caliber fragment simulation projectile (FSP), and high-carbon steel razor blades. It was found that fibers loaded by the rounded indenters yielded failure strain similar to pure tensile experiments, while the razor blade could induce the fiber’s failure in a drastically reduced failure strain. Mayo et al. [18] transversely cut eight single fibers at varied angles, reporting a higher average cut resistance of inorganic fibers than the organic fibers. However, the experiments focused on investigating the fiber’s mechanical response and speculated the failure mechanism through the fiber’s fracture surface. In our previous work [19], we transversely cut single aromatic polyamide (aramid), ultra-high molecular weight polyethylene (UHMWPE), and glass fibers and simultaneously visualized their failure processes by using SEM. The study physically revealed that the fiber could be in a complex multi-axial loading state, including axial tension, bending, transverse compression, and transverse shear.
In this study, we present the real-time visualization of the failure process of multiple single fibers transversely loaded by round-head indenters. Five fiber types were investigated, including carbon nanotube (CNT), ceramic, glass, aramid, and UHMWPE fibers. Compared with the work done by Hudspeth et al. [17] and Mayo et al. [18], we visualized the fiber’s failure process under transverse loading. Besides, the fiber’s failure mechanism by the round-head indenters is demonstrated to be simpler than that by the razor blade reported in [19]. Therefore, the data are deemed more useful to develop fundamental fiber- or fibril-scale models than our previous work.

2. Materials

To cover the most high-performance fiber types in the market, we select three inorganic and two organic fibers for investigation.
The three inorganic fibers are namely CNT, SlyramicTM, and S-2 glass fibers. As a carbon-based high-performance fiber, except for the excellent conductivity and high strength-to-weight ratio [20,21], CNT fibers are bendable and knittable [22]. Therefore, they are regarded as promising materials for wearable electronics [23] and composites [24]. In this work, single long CNT fibers were purchased from DexMat (Houston, TX, USA), manufactured by using a downscaling solution processing method mentioned in [25]. SlyramicTM fibers, made by COI Ceramics, Inc., San Diego, CA, USA, are a kind of ceramic fibers that have extradentary temperature creep resistance [26]. These fibers are the desirable ceramic-matrix composite (CMC) reinforcement used in aircraft and land-based turbine engines [27]. They may also find utility in other areas such as nuclear power, conventional power generation, and waste incineration [26]. With superior strength and elongation, impact, and corrosion resistance, S-2 glass fibers are the critical componential materials of vehicle armors and marine vessels [27,28]. The single glass fiber specimens were extracted from the S-2 glass roving provided by AGY, Aiken, SC, USA.
The two organic fibers are Kevlar® KM2 Plus and Dyneema® SK76 fibers. Kevlar® fibers are a well-known aramid fiber produced by DupontTM. They are famous in the application of personal armor protection, such as ballistic vests, combat helmets, and cut-resistant gloves [29,30]. Compared with Kevlar® fibers, Dyneema® SK76 fibers belong to the ultra-high molecular weight polyethylene (UHMWPE) fiber category and are much lighter. The density of Dyneema® SK76 fibers is reported to be 980 kg/m3 [29], which is ~0.68 times of Kevlar® KM2 Plus fibers [30] and ~0.39 times of S-2 glass fibers [27]. The fibers were commercialized by DSM, Geleen, the Netherlands and are widely used in faster ropes and ultralight backpacking equipment. They also compete with Kevlar® fibers in the soft armor market [31]. The single Kevlar® KM2 Plus and Dyneema® SK76 fibers inspected in this study were extracted from yarns as received from DupontTM and DSM, respectively.

3. Experiments

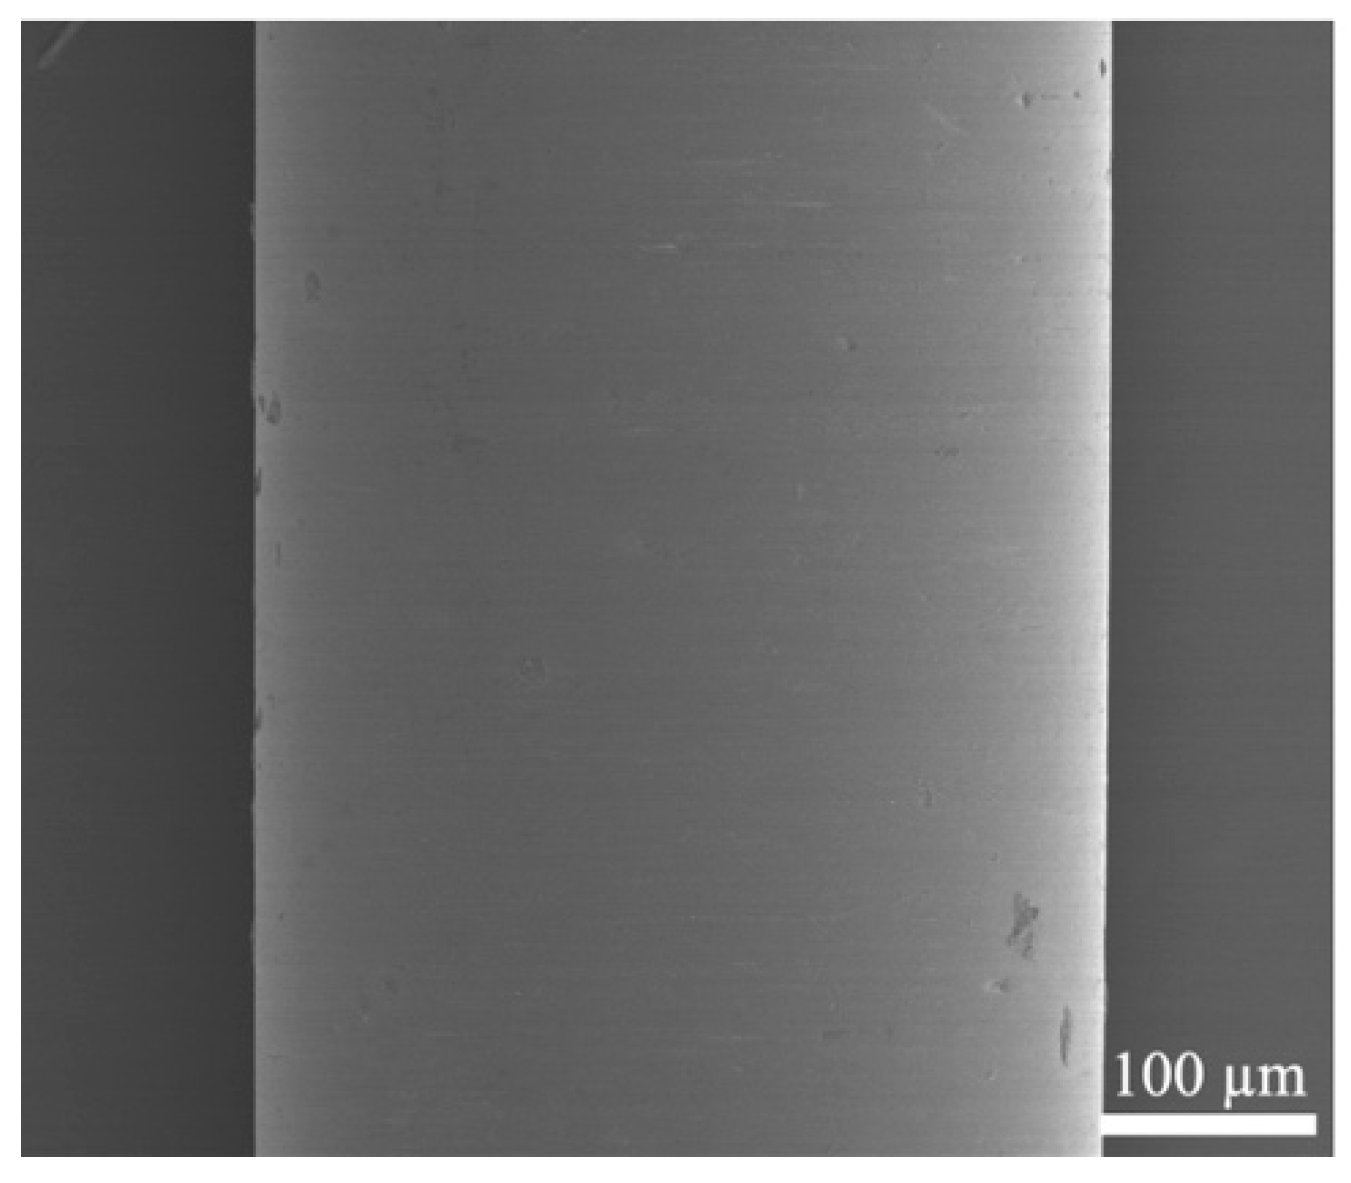
3.1. Specimen and Indenter Preparation

Single CNT fibers were directly cut from the received continuous long filament to the designated length. The other four fibers were first extracted from the yarns provided by the vendors and then sectioned into the desired length. The indenter was the alloy steel dowel pin with a diameter of 0.40 mm and a length of 6.35 mm, purchased from McMaster-Carr, Elmhurst, IL, USA. The stiffness is sufficiently high so that the fiber would not bend the pin during the loading process. Furthermore, the indenter surface was smooth enough, characterized in Figure 1, which avoided introducing additional damage at the fiber/indenter contacting surface.

3.2. Single-Fiber Tensile Experiment

Tensile experiments on single fibers were performed using a Deben microtest tensile stage (Deben UK Ltd., Oxford, UK). Figure 2 is the schematic of the loading platform, containing a threaded rod, left and right jaws supported on stainless steel sliding bearings, an extensometer, and a load cell. Prior to an experiment, a fiber specimen was first cured on cardboard by using DP190 epoxy glue (3M Inc., ST. Paul, MN, USA), spanning a 6.35-mm-diameter circle. The cardboard was then clamped down to the left and right jaws and cut along the dashed lines in Figure 2. During the tensile experiment, the threaded rod was driven by a step motor and controlled the left and right sliding bearings to move apart. The tensile force was applied to the fiber specimen by a displacement-controlled mode at a calibrated rate of 1.67 µm/s. The displacement (Ste) was recorded by the extensometer with a recording rate of 1 s−1, and the force (Fte) was measured by the load cell assembled behind the jaw on the right sliding bearing. The data were then reduced to the stress and strain history of the specimen by
σ = 4 F t e π d 2
ε = S t e L
where d represents the fiber diameter and L is the specimen’s gauge length of 6.35 mm. For each fiber, measurements were taken on ten specimens, and the averaged diameter was reported in Table 1. Fiber specimens were tensioned until fracture. There was no fiber sliding identified during loading. Each fiber type was investigated with 6–10 specimens to ensure the repeatability of the tensile experiments.

3.3. Single-Fiber Transverse Loading Experiment Integrating with SEM

Transverse loading experiments on single fibers were realized by replacing the two clamps on the Deben microtest tensile stage with fiber and indenter holders. As shown in Figure 3, the clamp on the left stage in Figure 2 has been changed to a fiber holder to mount the fiber specimen. The holder is a C-shape resin part, printed by Formlabs stereolithography (SLA) 3D printer (Somerville, MA, USA). The two ends of the fiber specimen were wrapped on two 1-mm-diameter stainless steel pins extruded from the through-thickness holes on the holder’s two arms, which were then cured by DP190 epoxy glue. The distance between the two stainless steel pins was 50 mm. On the main body of the C-shape holder, there were two adapted holes to mount the holder on the Deben microtest tensile stage. The design of the indenter holder is also sketched in Figure 3. Holes were reserved on the holders to introduce the indenters which were secured by superglue. Adapted holes were created to install the indenter holder to the right stainless steel sliding bearing of the Deben microtest tensile stage. The indenter was embraced by the fiber and its C-shape holder. The transverse load was applied to the fiber at the middle span by controlling the movement of the left and right sliding bearings at a rate of 1.67 µm/s. The force (Ftr) and the fiber’s deflection (Str) at the fiber/indenter contacting area were recorded by the load cell and extensometer, respectively. More details of the loading frame can be found in our previous work [32].
The entire Deben microtest tensile stage was installed within a chamber of a Quanta 3D FEG SEM (FEI, Hillsboro, OR, USA) so that the fiber’s real-time morphology during transverse loading could be captured by the secondary electron detector (SED) of the SEM. The cables of the Deben microtest tensile stage were extended to the outside of the chamber through a feed-through adapter and connected to a control box and further to a computer. During an experiment, the computer controlled the imaging and loading. A short scanning time was first adopted, which allowed for monitoring of the fiber’s morphology in a live mode, despite having a lower resolution. Simultaneously, a progressive loading scheme was employed in this study: when a critical failure characteristic was observed, the loading was temporally terminated, providing sufficient time for the SEM to scan the fiber specimen with more details and capture the fiber’s morphology at a high resolution. Moreover, the SEM was operated in a low-vacuum mode. The chamber pressure was controlled to be within 0.23–0.45 Torr. This allowed fibers to be imaged without conductive coatings and avoided the potential effect of coatings on the fibers’ mechanical responses. The accelerating voltage, working distance, and spot size were 5 kV, 10 mm, and 3.0–3.5, respectively. Each fiber type was examined with 3–5 specimens to guarantee the repeatability of the experiments.

3.4. Post-Fracture Imaging

To gain further insight into the fiber failure induced by the round-nose indenter, the failed fibers were collected and sputter-coated with platinum for 60–120 s. The failure surfaces of fibers were examined in a NovaNano SEM (FEI, Hillsboro, MA, USA), which has an Everhart-Thornley Detector (ETD) and a Through-the-Lens Detector (TLD) detecting small features on the 1.4-nm scale. Images were obtained at an average working distance of 5 mm and an accelerating voltage of 5 kV in high-vacuum mode.

4. Results and Discussion

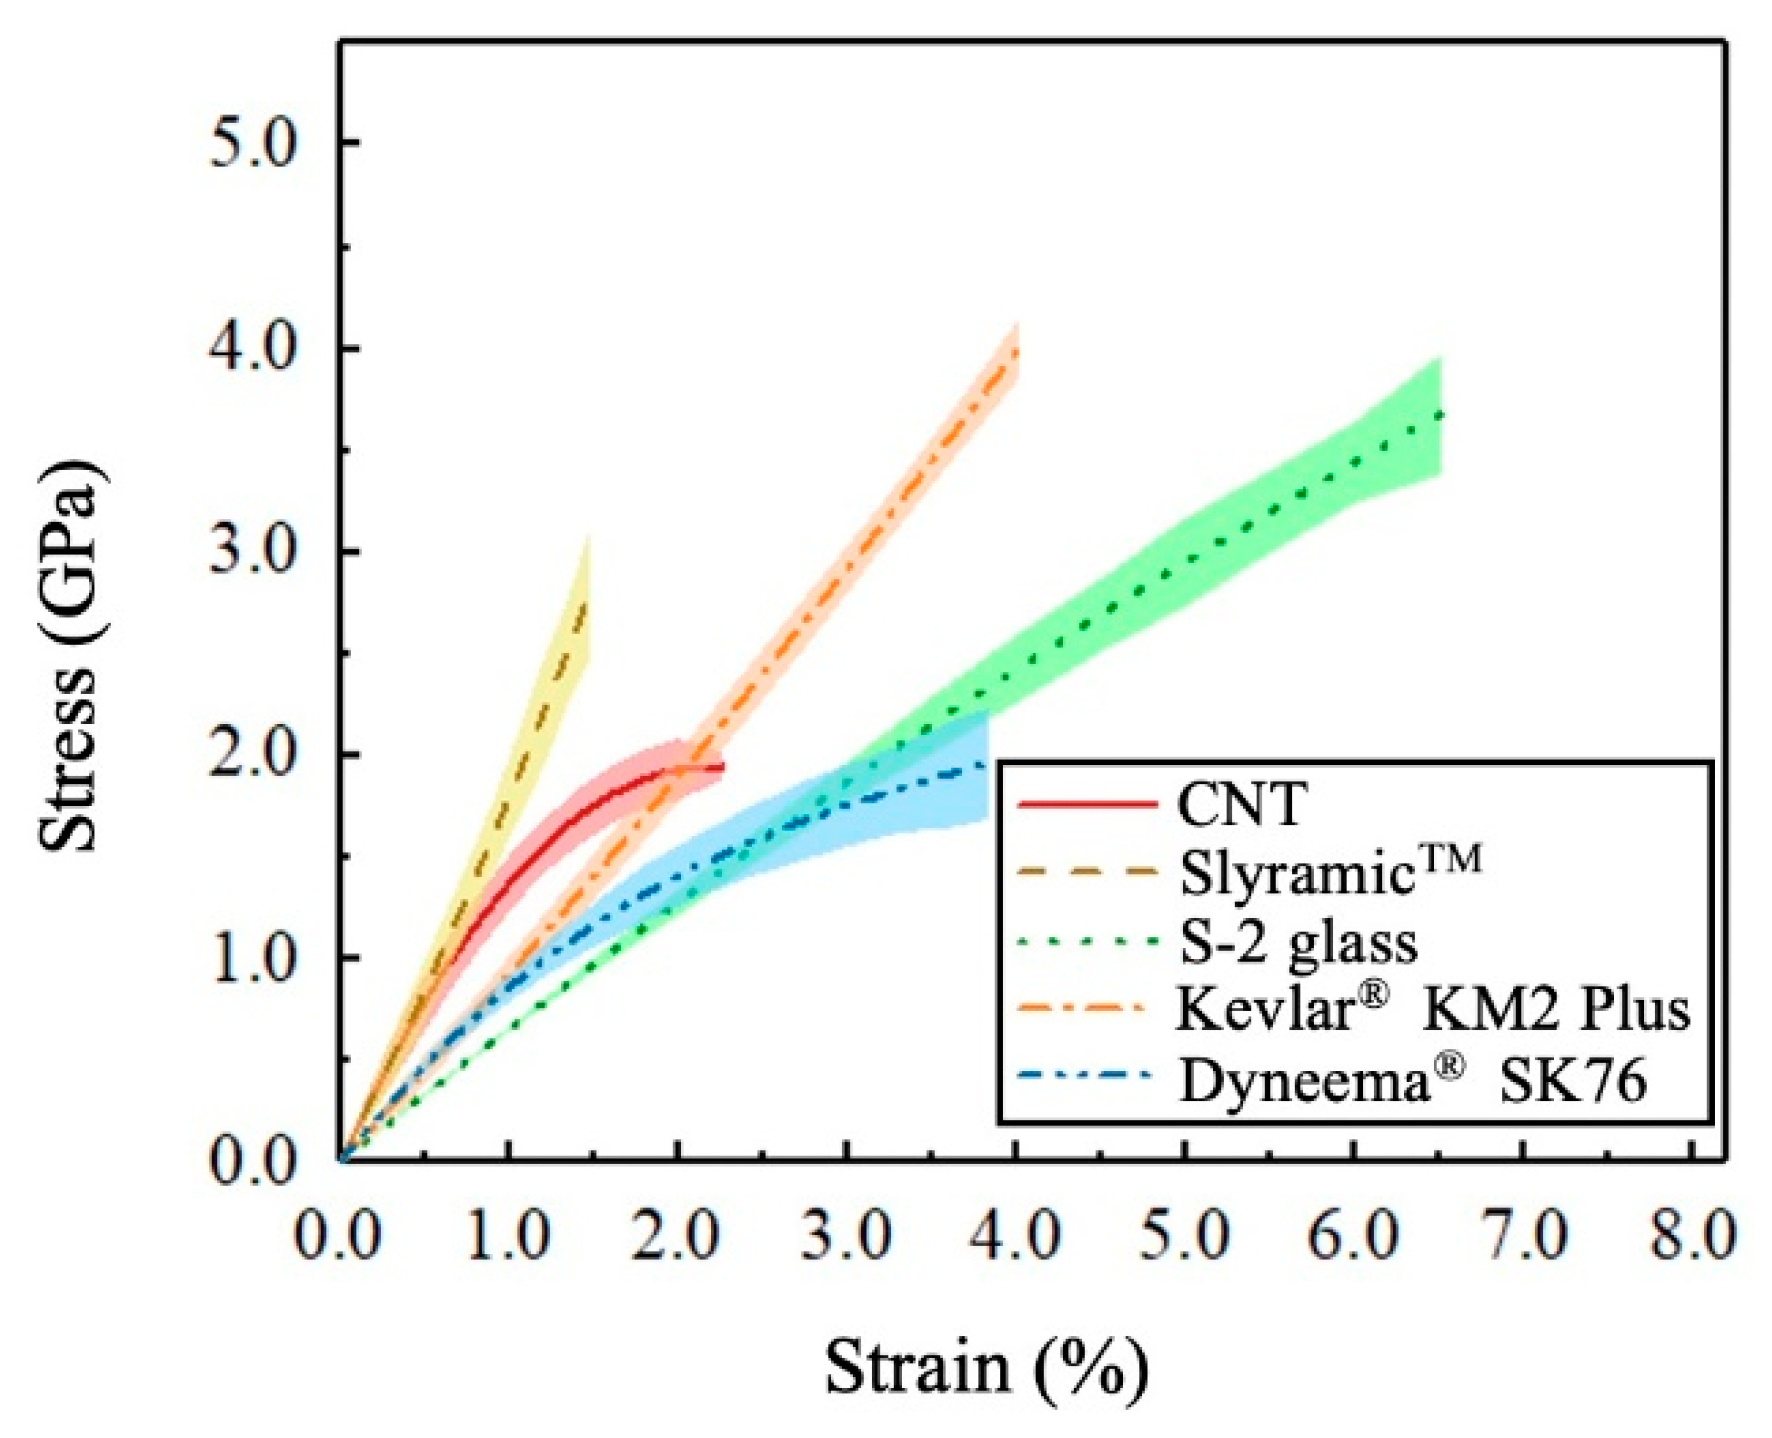
4.1. Stress–Strain Curves of Different Fibers

High-performance fibers are well-recognized for their high strength and stiffness. This section compared the tensile stress–strain curves of five fiber types at the loading rate of 2.6 × 10⁻⁴. For each fiber type, we first obtained the averaged stress–strain curve by curve-fitting the collected stress and strain history of all the 6–10 specimens. Afterward, a total number of 12 points were selected on the averaged curve to determine the standard deviation. Finally, the upper and lower boundaries at each point were determined to get the error band. As shown in Figure 4, S-2 glass fibers have the maximum failure strain, followed by the two organic fibers, Kevlar® KM2 Plus and Dyneema® SK76 fibers. The organic CNT and SlyramicTM ceramic fibers failed in a small elongation. Among the five fiber types, Kevlar® KM2 Plus and S-2 glass fibers are the strongest. CNT fibers are the weakest. The SlyramicTM ceramic fibers had higher average strength than the Dyneema® SK76 fibers. The S-2 glass, SlyramicTM, and Kevlar® KM2 Plus fibers all had an approximately linear stress–strain relation, while the constitutive relation of CNT and Dyneema® SK76 fibers were non-linear. The density and average diameter, tensile strength, and failure strain of the five fibers were summarized in Table 1.

4.2. Failure Processes of Different Fibers

In this section, we visualized and reported the failure behavior of five representative fiber specimens under transverse loading by the round-head indenters, which is presented in Figure 5, Figure 6, Figure 7, Figure 8, Figure 9 and Figure 10. In Figure 5, Figure 6, Figure 7 and Figure 8 and Figure 10, the force-deflection curve is first provided. The fiber’s failure process is then depicted by the SEM image sequence. In each SEM image, the indenter is at the top, and the fiber is under the indenter. The identification of the initial contact between the fiber and indenter was aided by the SEM, indicated as Str = 0 and shown in the first image of each image sequence. This is regarded as the start of loading. Each SEM image corresponds to a fiber deflection (Str) point and is denoted in the force-deflection curve. The failure processes and mechanical responses of five fibers were then illustrated and compared.

4.2.1. CNT Fiber

The failure behavior of a representative CNT fiber and the corresponding force-deflection curve are presented in Figure 5. The fiber contacted the indenter in Figure 5b and was observed to bend slightly at Str = 1.862 mm in Figure 5c. When the fiber deflection Str increased to 3.003 mm, the fiber experienced significant transverse compression by the indenter, as revealed in Figure 5d. The fiber was damaged, and a crack formed at the bottom of the fiber. As the loading continued, the fiber/indenter contacting area increased. The fiber failed at Str = 3.174 mm, indicated by a sudden drop in the force-deflection curve. However, the fiber was not physically identified to fracture within the field of view in Figure 5d. This is possible because of the defects in the CNT fiber, which may induce the fiber’s failure at the weakest point but out of the field of view.

4.2.2. SlyramicTM Ceramic Fiber

A single SlyramicTM ceramic fiber’s failure under transverse loading by the indenter was in a brittle manner. As shown in Figure 6, the representative SlyramicTM fiber failed when the deflection was only 1.382 mm. Presumably due to the high hardness and modulus of the ceramic fiber [35], the fiber did not have observable transverse deformation. Merely a small bending deformation was captured in Figure 6d before the fiber fractured.

4.2.3. S-2 Glass Fiber

The failure progression of a single S-2 glass fiber was very similar to the SlyramicTM ceramic fiber. The fiber was bent by the indenter until fracture. However, owing to the higher elongation of the S-2 glass fiber, it fractured at a larger deflection of Str = 4.704 mm, shown in Figure 7a. The fiber’s transverse compressive deformation under the indenter was small because of the high transverse stiffness of the glass fiber. Compared with the SlyramicTM ceramic fiber, the S-2 glass fiber had a more significant bending deformation before failure (see Figure 7d).

4.2.4. Kevlar® KM2 Plus Fiber

Failure processes of the organic fibers are more complicated than the inorganic fibers. Figure 8 presents a representative Kevlar® KM2 Plus fiber’s failure and the force-deflection curve. The fiber was fixed at two ends and transversely loaded by the indenter at the middle point in Figure 8b. Being softer in the transverse direction, the fiber was bent and simultaneously locally compressed at the fiber/indenter contacting area in Figure 8c. The increasing global bending and local compression inversely enlarged the fiber/indenter contacting area, resulting in a growing fiber/indenter interaction. The fiber became stiffer during loading, revealed by an increasing slope of the force-deflection curve in Figure 8a. When the deflection Str increased to 6.511 mm, we observed two cracks initiating at the bottom of the fiber with a spacing of ~10 μm. As the indenter continued to load the fiber, the tensile stress in the fiber accumulated and the two vertical cracks opened. At the time when Str = 6.621 mm in Figure 8e, the two cracks bridged with each other through a new crack along the fiber’s length. This indicates the transverse debonding of the nanoscale fibrils inside the fiber. Afterward, the two vertical cracks propagated upwards to the indenter. The stress concentration at the crack tip could induce a secondary crack, splitting the fiber in Figure 8f. The fiber’s failure started with the bottom fiber separating from the entire structure after the horizontal cracks propagated along the fiber length to a certain distance. Figure 8g is a close image of the fiber under the indenter, while Figure 8h shows the fiber’s morphology in a larger view. The effective cross section of the fiber then decreased dramatically, resulting in the rapid growth of the tensile stress in the residual fiber. Finally, the fiber could not resist the high tensile stress and failed abruptly in tension.
It is noted that defects may not be evenly distributed in the Kevlar® KM2 Plus fiber. The cracks might occur in many places with different numbers. As observed in Figure 9a, two vertical cracks were initiated with a large interval up to 40 μm. In Figure 9b, only one vertical crack was seen during loading. The only difference in failure between these fibers and that in Figure 8 is that the crack’s development did not interact. During the propagation of the vertical cracks, the secondary cracks in the horizontal direction were also generated and split the fiber.

4.2.5. Dyneema® SK76 Fiber

The deformation of the Dyneema® SK76 fiber at the beginning of the loading was similar to the Kevlar® KM2 Plus fiber. The fiber also experienced bending and transverse compression under the indenter. The major difference is the crack initiation and propagation. As presented in Figure 10c,d, the microfibrils on the top of the Dyneema® SK76 fiber fractured at Str = 7.521 mm, resulting in the crack initiation. The cracks opened at the original sites and fractured the fiber from top to bottom (see Figure 10e–g). No secondary cracks were being generated, splitting the Dyneema® SK76 fiber during loading. At the moment just before the fiber’s failure, many kink bands appeared at the fiber/indenter contact area in Figure 10f, presumably due to the unloading process during crack propagation. The force-deflection curve is shown in Figure 10a.

4.3. Fracture Surfaces of Different Fibers

The representative fiber specimens were examined on the fracture surfaces. The fracture surfaces of the SlyramicTM ceramic fiber in Figure 11b and S-2 glass fiber in Figure 11c indicate a brittle failure mode. As shown in Figure 11d, the Kevlar® KM2 Plus fiber failed in a manner of fibrillation: the fiber split into several fibril bundles at the place of rupture. The failure mode is the same as that observed in the single-fiber tensile experiments [12]. Kink bands were not identified during the loading process in Figure 8 while they appeared in the fractured fibers. Unlike the Kevlar® KM2 Plus fiber, Dyneema® SK76 fibers did not split into many fibril bundles near the failure surface. All the microfibrils broke locally at the cracking area, revealed in Figure 11e. Besides, in Figure 11f, more kink bands were detected on the Dyneema® SK76 fiber than the Kevlar® KM2 Plus fiber. At the fiber/indenter contacting area in Figure 11g, the Dyneema® SK76 fiber was transversely compressed and broke into small parts. Although the CNT fiber is an inorganic fiber, its fracture surface morphology is more similar to the two organic polymer fibers, which are not brittle. The fiber fractured into CNT bundles at the fracture surface in tension, as shown in Figure 11a. Kink bands were also uncovered, likely to appear during the unloading process.

4.4. Energy Dissipation of Different Fibers under Transverse Loading

Using a similar method in the tensile experiments, we plotted the averaged force-deflection curves with error bands for different fibers under transverse loads, presented in Figure 12. The fiber’s energy dissipation (Etr) under the transverse loading is determined by integrating the averaged force-deflection curve as
E t r = 0 S t r F t r d S t r
By comparing the energy dissipation of the five fibers in Figure 13, we find that the Dyneema® SK76 fiber dissipated the most energy during transverse loading, followed by Kevlar® KM2 Plus, S-2 glass, and CNT. The energy dissipation of the SlyramicTM ceramic fiber was the lowest.
To compare the fiber’s energy absorption capacity considering the fiber diameters, the energy density (utr) of different fibers is computed as
u t r = 4 E t r π d 2 L
and plotted in Figure 14. The energy density of Kevlar® KM2 Plus fiber was 1.85 times of the Dyneema® SK76 fiber and 2.34 times of the S-2 glass fiber. Subjected to the transverse loading by the indenters, CNT and SlyramicTM ceramic fibers had an energy density that was lower than other fibers.
It is noted that the weight of textiles and composites is also a critical factor to be considered in practical engineering. In this study, we used the specific energy (etr) to evaluate the mass-efficient energy dissipation of different fibers. The calculation is made by
e t r = 4 E t r π d 2 ρ L
where the density (ρ) and diameter (d) of different fibers are obtained from Table 1. As demonstrated in Figure 15, all the inorganic fibers had a lower energy dissipation per unit mass than the organic fibers. Besides, although the Dyneema® SK76 fiber specimens have the lowest density and dissipated 37% more energy than the Kevlar® KM2 Plus fiber specimens, they possessed a larger diameter. The specific energy of the Dyneema® SK76 fiber was 25% lower than the Kevlar® KM2 Plus fiber.
Compared with the fibers under transverse cut by the razor blades, the failure and energy dissipation of the fibers transversely loaded by the round-nose indenters in this study are different. The fiber’s specific energy in a transverse cut experiment from high to low is in the order of CNT, S-2 glass, Kevlar® KM2 Plus, Dyneema® SK76, and SlyramicTM fibers [36]. Specifically, the specific energy of CNT fibers cut by the razor blades was ~2.7 times of the Kevlar® KM2 Plus fibers. The Dyneema® SK76 fibers had a specific energy which was less than 19% of the Kevlar® KM2 Plus fibers. Such a difference is possibly due to the different failure mechanisms. The razor blades could shear into the organic fibers, such as Kevlar®, Dyneema® fibers, which failed those fibers before the tensile deformation was completely developed. Therefore, the specific energy of Kevlar® and Dyneema® fibers was much lower than the CNT and S-2 glass fibers. In this study, the indenter’s round head could not shear into the fibers. The organic fibers dissipated the indenter’s energy through transverse compressive and axial tensile deformation, inducing a higher specific energy than the inorganic fibers.

4.5. Effect of Transverse Loading on the Energy Dissipation

Lim et al. [37] used the residual specific strain energy [38] to quantify the effect of transverse loading on the Twaron yarn’s energy dissipation. In this study, we defined a non-dimensional parameter (η) to evaluate the effect of transverse loading on the energy dissipation of single fibers
η = E t r E t e = e t r e t e
where Ete and ete are the energy and specific energy dissipation of the fiber determined by the force-deflection curve obtained in the single-fiber tensile experiment in Figure 4. The calculations are similar to Etr and etr in Equations (3) and (4), respectively. Such a non-dimensional parameter enables to compare the different fibers’ energy dissipation at the same weight. As shown in Figure 16, the organic fibers have much higher η than the inorganic fibers. This indicates the transverse loading by the round-nose indenter has a lower impact on the energy dissipation of the organic fibers than the inorganic fibers. However, the maximum energy dissipation of a single fiber under transverse loading is merely 17.9% of that under axial tension. Such a significant degradation in the fiber’s energy dissipation is suspected to be due to the stress concentration under the indenter. The local stress and deformation of the fiber under the indenter should be carefully considered in the modeling.

5. Conclusions

In this study, we reported the failure behavior of single high-performance fibers under transverse loads by the round-nose indenters. A microscale material tensile testing system was modified to transversely load single fibers and measure their mechanical responses. By integrating the loading platform with SEM, we were able to visualize the failure process of each fiber under the transverse loading. Post-fracture analysis using a higher-resolution SEM was also conducted to provide complementary information about the fibers’ failure. The energy dissipation was compared with the single-fiber tensile experiments. Five fiber types were investigated: CNT, SlyramicTM ceramic, S-2 glass, Kevlar® KM2 Plus, and Dyneema® SK76 fiber. The findings are concluded below:
(1)
The SlyramicTM ceramic and S-2 glass fibers failed in a brittle manner: they were bent under the indenter and fractured suddenly. The S-2 glass fiber had a larger deflection before failure due to its higher elongation in tension.
(2)
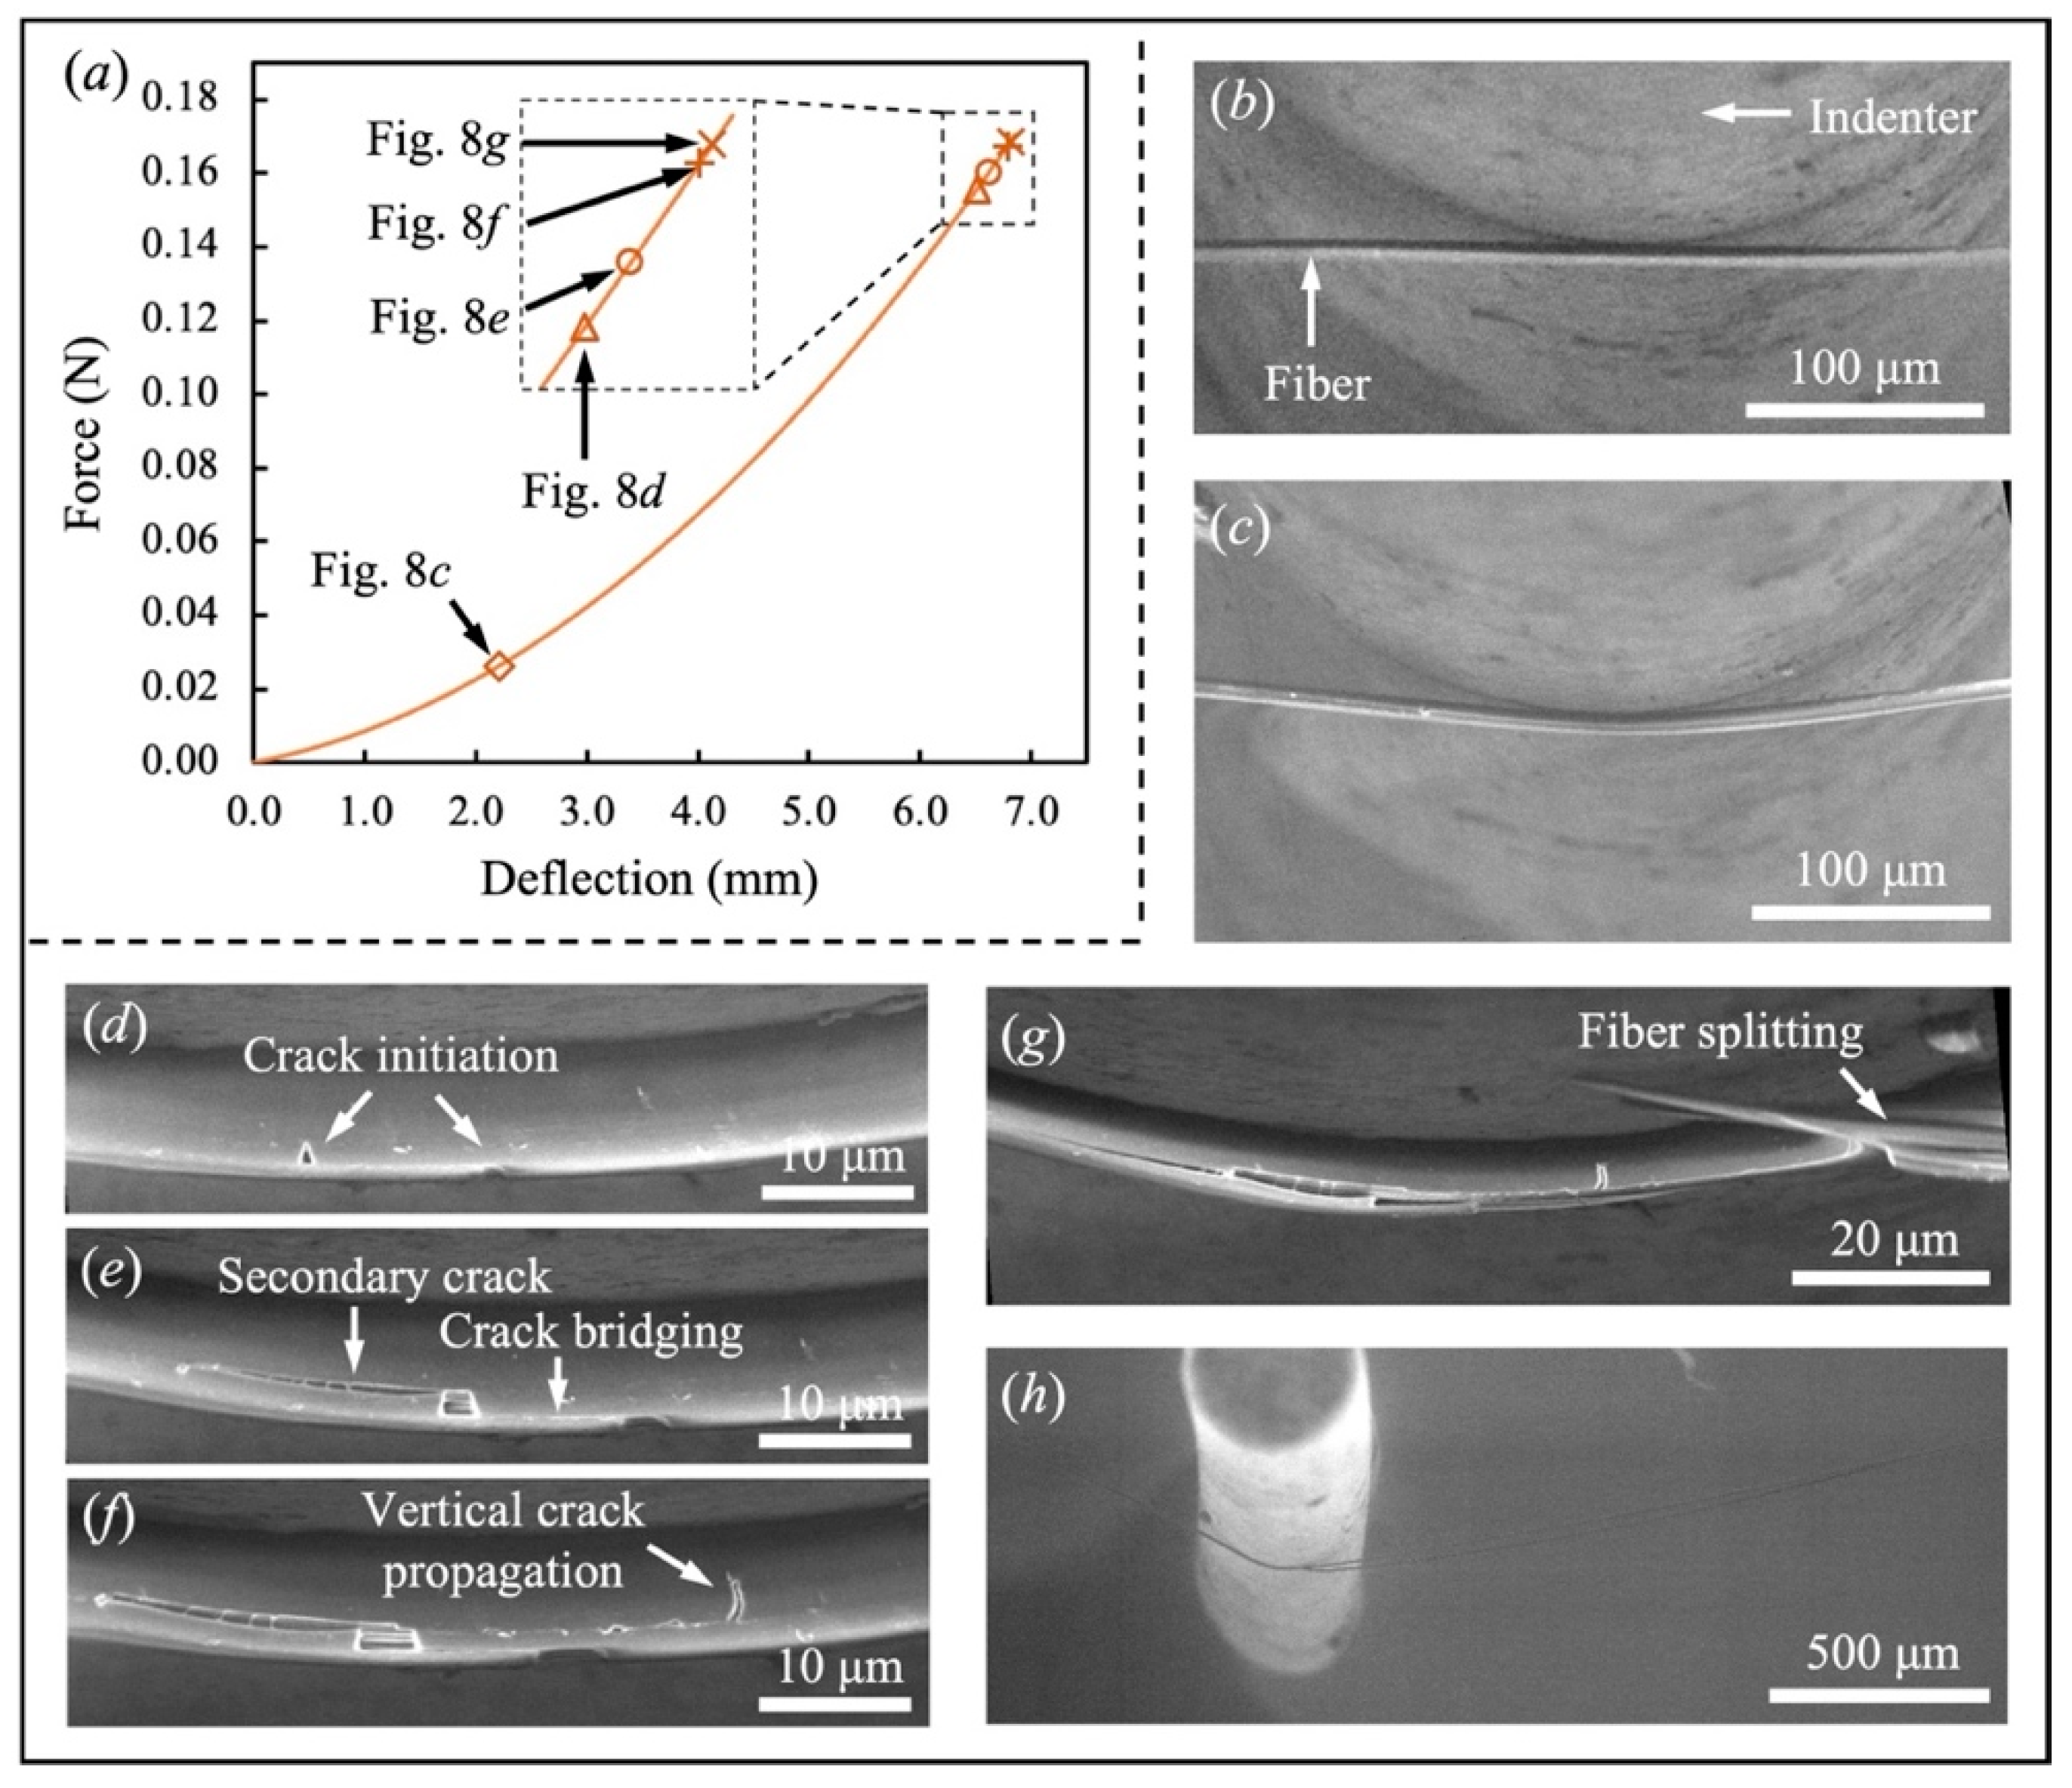
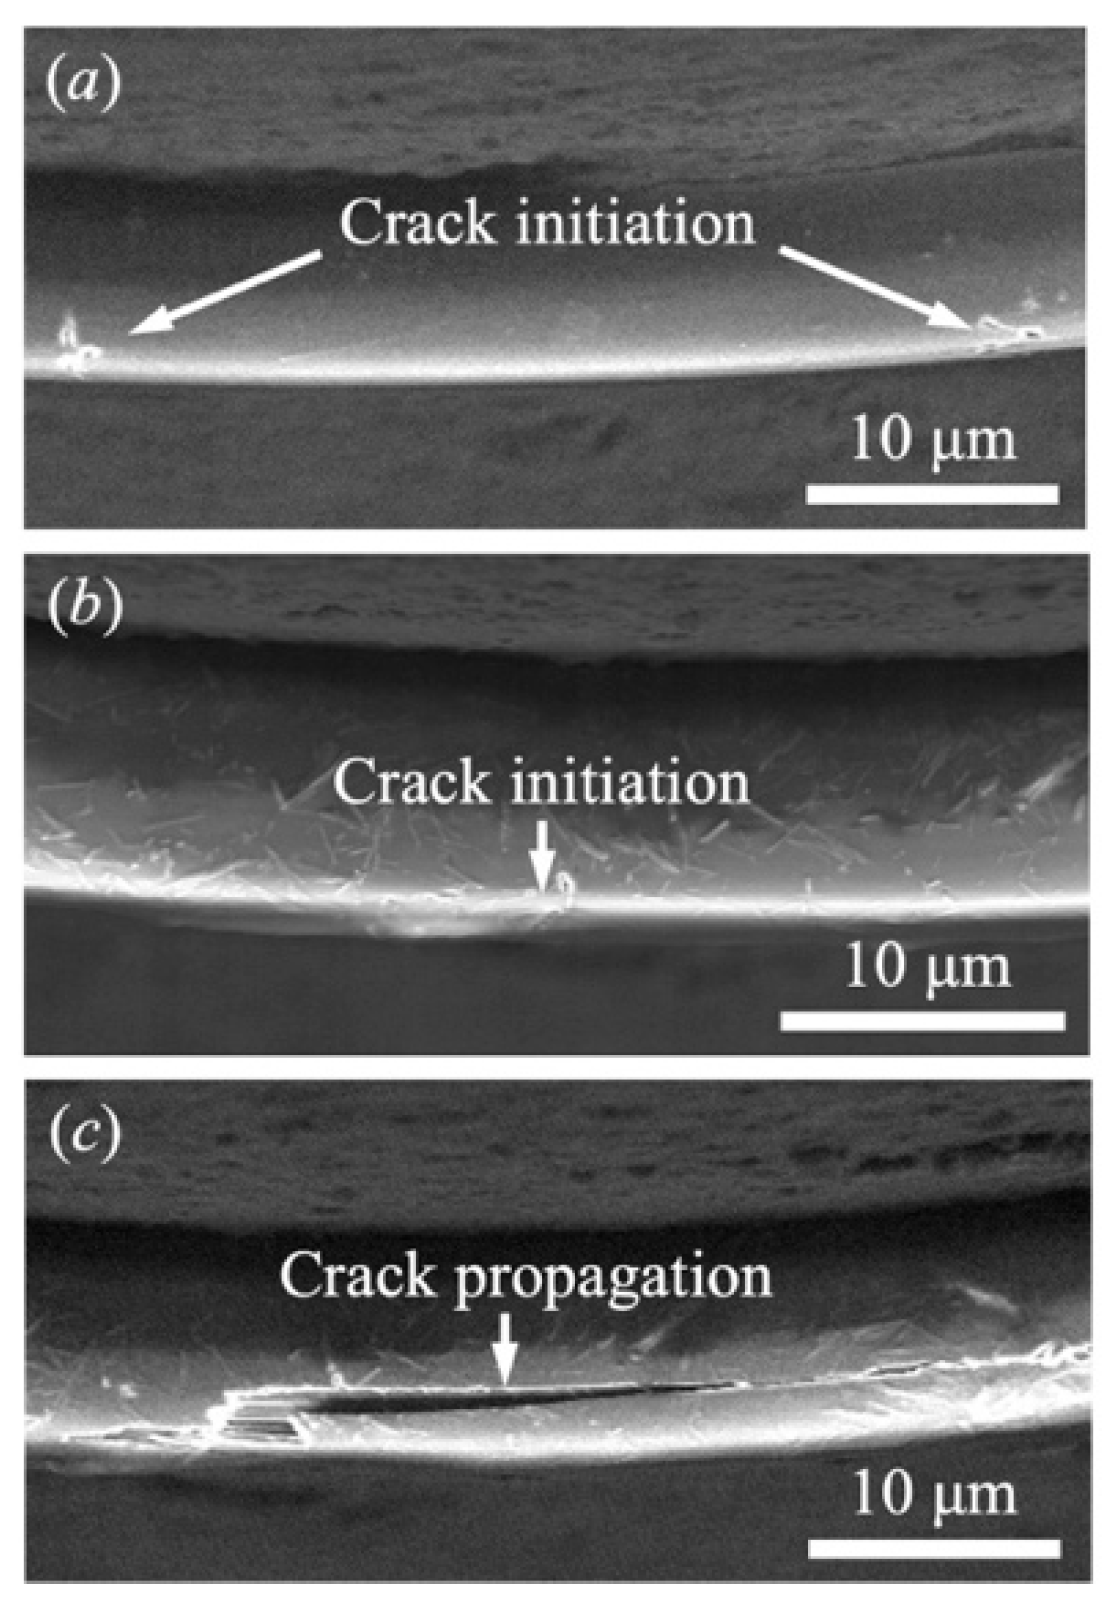
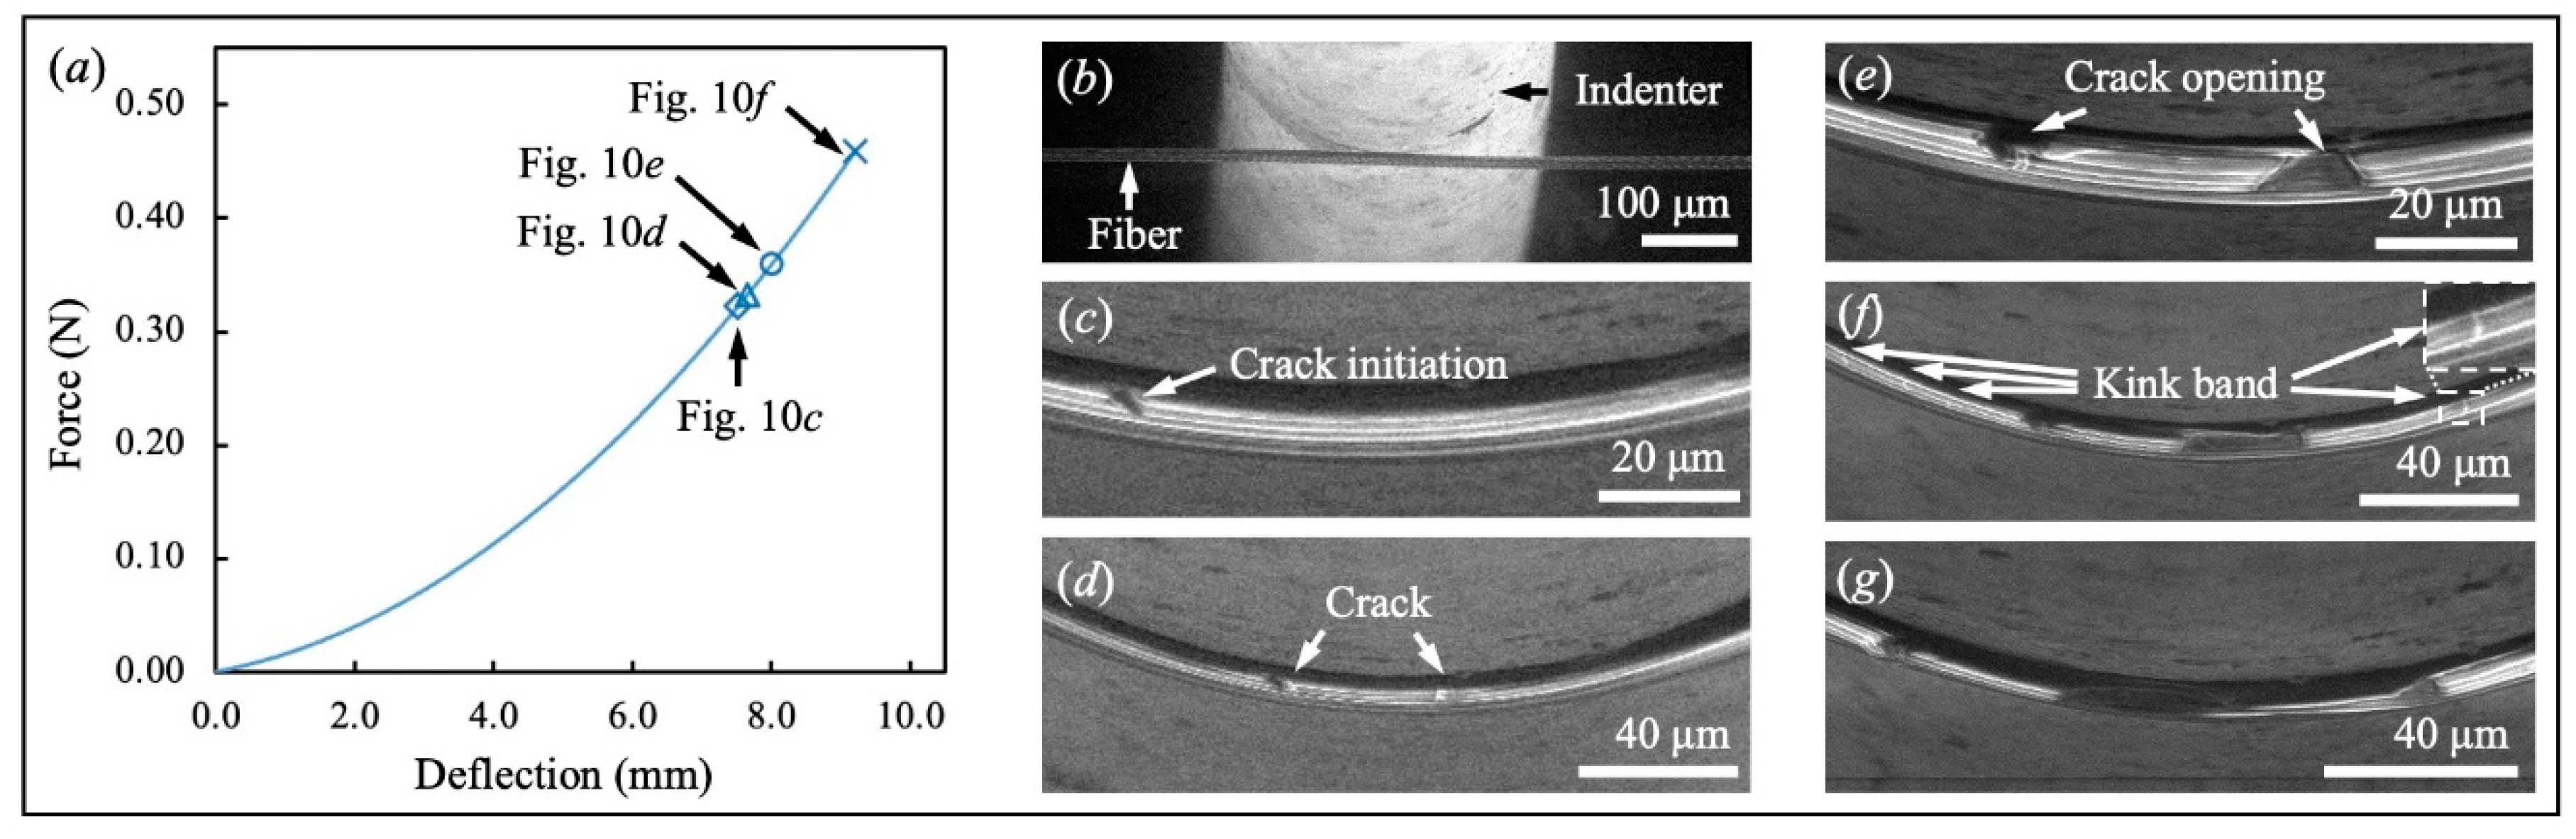
Subjected to the transverse loading, the CNT, Kevlar® KM2 Plus, and Dyneema® SK76 fibers were observed to experience bending, transverse compression, and axial tension. Kevlar® KM2 Plus fibers failed in fibrillation. The cracks initiated at the bottom of the fiber and propagated vertically to the indenter. During the vertical crack propagation, secondary cracks along the fiber were activated at the vertical crack tip and split the Kevlar® KM2 Plus fibers. Finally, the residual fiber could not resist the increasing transverse load and failed in tension. Unlike the Kevlar® KM2 Plus fiber, the Dyneema® SK76 fiber had cracks initiated at the top of the fiber, where the fiber contacted the indenter. The cracks then propagated downwards and opened at the initial positions until the fiber’s breakage. On the other hand, CNT fibers may fail away from the fiber/indenter contacting area, depending on the defect distribution in the fibers. Kink bands were found in the post-fracture images.
(3)
During the transverse loading, the organic fibers had higher energy dissipation than the inorganic fibers. Kevlar® KM2 Plus fibers have the highest mass-efficient energy dissipation, followed by Dyneema® SK76, S-2 glass, CNT, and SlyramicTM ceramic fibers. The findings contribute to the lightweight material selection in body and vehicle armor and show the necessity to improve the CNT fibers’ properties under axial tension.
(4)
The transverse loading significantly suppressed the fiber’s high performance in tension. The energy dissipation during transverse loading was no more than 17.9% of that under axial tension. The stress concentration under the indenter is believed to result in such degradation in energy dissipation, which is suggested to be considered in the modeling.

Author Contributions

Methodology, J.G.; Formal analysis, J.G.; investigation, J.G., N.K., B.H.L., Y.N. and X.Z.; resources, J.G.; writing—original draft preparation, J.G.; writing—review and editing, N.K., B.H.L., Y.N. and W.C.; visualization, J.G.; supervision, W.C.; funding acquisition, W.C. All authors have read and agreed to the published version of the manuscript.

Funding

This research was funded by US Army PEO Soldier with a grant number W91CRB-14-C-0025. In addition, this research was partially sponsored by the Army Research Laboratory and was accomplished under Cooperative Agreement Number W911NF-12-2-0022. The views and conclusions contained in this document are those of the authors and should not be interpreted as representing the official policies, either expressed or implied, of the Army Research Laboratory or the U.S. Government. The U.S. Government is authorized to reproduce and distribute reprints for Government purposes notwithstanding any copyright notation herein.

Acknowledgments

The authors would also like to thank for the technical support from Christopher J. Gilpin, Laurie Mueller, Robert Seiler at the Life Science Microscopy Facility at Purdue University.

Conflicts of Interest

The authors declare no conflict of interest.

References

  1. Lim, B.H.; Chu, J.M.; Gao, J.; Claus, B.; Nie, Y.; Chen, W. The effect of projectile nose shape on the critical velocity of high-performance yarn. Fibers 2019, 7, 29. [Google Scholar] [CrossRef] [Green Version]
  2. Hudspeth, M.; Chu, J.M.; Jewell, E.; Lim, B.; Ytuarte, E.; Tsutsui, W.; Horner, S.; Chen, W. Effect of projectile nose geometry on the critical velocity and failure of yarn subjected to transverse impact. Text. Res. J. 2017, 87, 953–972. [Google Scholar] [CrossRef]
  3. Gao, J.; Guo, Z.; Hernandez, J.A.; Zhou, F.; Nie, Y.; Gao, J.; Lim, B.H.; Kedir, N.; Zhai, X.; Wang, J.; et al. Transverse impact by RCCs on S-glass and Kevlar® FRC strips. Compos. Part A Appl. Sci. Manuf. 2021, 146, 106425. [Google Scholar] [CrossRef]
  4. Meyer, C.S.; Haque, B.Z.G.; O’Brien, D.J.; Getinet, N.; Jian, H.Y.; Bonyi, E.; Aslan, K.; Gillespie, J.W., Jr. Mesoscale ballistic damage mechanisms of a single-layer woven glass/epoxy composite. Int. J. Impact Eng. 2018, 113, 118–131. [Google Scholar] [CrossRef]
  5. Chen, W.; Hudspeth, M.; Guo, Z.; Lim, B.H.; Horner, S.; Zheng, J.Q. Multi-scale experiments on soft body armors under projectile normal impact. Int. J. Impact Eng. 2017, 108, 63–72. [Google Scholar] [CrossRef]
  6. Gama, B.A.; Gillespie, J.W., Jr. Punch shear based penetration model of ballistic impact of thick-section composites. Compos. Struct. 2008, 86, 356–369. [Google Scholar] [CrossRef]
  7. Chu, J.M.; Claus, B.; Lim, B.H.; O’Brien, D.; Sun, T.; Fezzaa, K.; Chen, W. Rate effects on fiber–matrix interfacial transverse debonding behavior. J. Compos. Mater. 2020, 54, 501–517. [Google Scholar] [CrossRef]
  8. Sanborn, B.; DiLeonardi, A.M.; Weerasooriya, T. Tensile properties of Dyneema SK76 single fibers at multiple loading rates using a direct gripping method. J. Dyn. Behav. Mater. 2015, 1, 4–14. [Google Scholar] [CrossRef]
  9. Cheng, M.; Chen, W.; Weerasooriya, T. Mechanical properties of Kevlar® KM2 single fiber. J. Eng. Mater. Technol. 2005, 127, 197–203. [Google Scholar] [CrossRef]
  10. Lim, J.; Chen, W.W.; Zheng, J.Q. Dynamic small strain measurements of Kevlar® 129 single fibers with a miniaturized tension Kolsky bar. Polym. Test. 2010, 29, 701–705. [Google Scholar] [CrossRef]
  11. Staniszewski, J.M.; Bogetti, T.A.; Wu, V.; Moy, P. Interfibrillar behavior in ultra-high molecular weight polyethylene (UHMWPE) single fibers subjected to tension. Int. J. Solids Struct. 2020, 206, 354–369. [Google Scholar] [CrossRef]
  12. Hudspeth, M.; Claus, B.; Parab, N.; Lim, B.H.; Chen, W.; Sun, T.; Fezza, K. In situ visual observation of fracture processes in several high-performance fibers. J. Dyn. Behav. Mater. 2015, 1, 55–64. [Google Scholar] [CrossRef] [Green Version]
  13. Guo, Z.; Casem, D.; Hudspeth, M.; Nie, X.; Sun, J.; Chen, W. Transverse compression of two high-performance ballistic fibers. Text. Res. J. 2016, 86, 502–511. [Google Scholar] [CrossRef]
  14. Sockalingam, S.; Bremble, R.; Gillespie, J.W., Jr.; Keefe, M. Transverse compression behavior of Kevlar KM2 single fiber. Compos. Part A Appl. Sci. Manuf. 2016, 81, 271–281. [Google Scholar] [CrossRef]
  15. Li, Y.; Sun, B.; Sockalingam, S.; Pan, Z.; Lu, W.; Chou, T.W. Influence of transverse compression on axial electromechanical properties of carbon nanotube fibers. Mater. Des. 2020, 188, 108463. [Google Scholar] [CrossRef]
  16. Sun, J.; Hudspeth, M.; Chen, W. Biaxial shear/tension failure behavior of Spectra single fibers. Compos. Part A Appl. Sci. Manuf. 2016, 88, 286–294. [Google Scholar] [CrossRef]
  17. Hudspeth, M.; Li, D.; Spatola, J.; Chen, W.; Zheng, J. The effects of off-axis transverse deflection loading on the failure strain of various high-performance fibers. Text. Res. J. 2016, 86, 897–910. [Google Scholar] [CrossRef]
  18. Mayo, J.B., Jr.; Wetzel, E.D. Cut resistance and failure of high-performance single fibers. Text. Res. J. 2014, 84, 1233–1246. [Google Scholar] [CrossRef]
  19. Gao, J.; Nie, Y.; Lim, B.H.; Zhai, X.; Kedir, N.; Chen, W. In-situ observation of cutting-induced failure processes of single high-performance fibers inside a SEM. Compos. Part A Appl. Sci. Manuf. 2020, 131, 105767. [Google Scholar] [CrossRef]
  20. Koziol, K.; Vilatela, J.; Moisala, A.; Motta, M.; Cunniff, P.; Sennett, M.; Windle, A. High-performance carbon nanotube fiber. Science 2007, 318, 1892–1895. [Google Scholar] [CrossRef]
  21. Behabtu, N.; Young, C.C.; Tsentalovich, D.E.; Kleinerman, O.; Wang, X.; Ma, A.W.K.; Bengio, E.A.; ter Waarbeek, R.F.; de Jong, J.J.; Hoogerwerf, R.E.; et al. Strong, light, multifunctional fibers of carbon nanotubes with ultrahigh conductivity. Science 2013, 339, 182–186. [Google Scholar] [CrossRef] [PubMed] [Green Version]
  22. Choi, J.; Jung, Y.; Yang, S.J.; Oh, J.Y.; Oh, J.; Jo, K.; Son, J.G.; Moon, S.E.; Park, C.R.; Kim, H. Flexible and robust thermoelectric generators based on all-carbon nanotube yarn without metal electrodes. ACS Nano 2017, 11, 7608–7614. [Google Scholar] [CrossRef] [PubMed]
  23. Lee, S.H.; Park, J.; Moon, S.Y.; Lee, S.Y.; Kim, S.M. Strong and highly conductive carbon nanotube fibers as conducting wires for wearable electronics. Appl. Nano Mater. 2021, 4, 3833–3842. [Google Scholar] [CrossRef]
  24. Liu, K.; Sun, Y.; Lin, X.; Zhou, R.; Wang, J.; Fan, S.; Jiang, K. Scratch-resistant, highly conductive, and high-strength carbon nanotube-based composite yarns. ACS Nano 2010, 4, 5827–5834. [Google Scholar] [CrossRef]
  25. Headrick, R.J.; Tsentalovich, D.E.; Berdegué, J.; Bengio, E.A.; Liberman, L.; Kleinerman, O.; Lucas, M.S.; Talmon, Y.; Pasquali, M. Structure–property relations in carbon nanotube fibers by downscaling solution processing. Adv. Mater. 2018, 30, 1704482. [Google Scholar] [CrossRef]
  26. Jones, R.E.; Petrak, D.; Rabe, J.; Szweda, A. SYLRAMIC™ SiC fibers for CMC reinforcement. J. Nucl. Mater. 2000, 283, 556–559. [Google Scholar] [CrossRef]
  27. AGY. High Strength Glass Fibers; Aiken, SC, USA, 2006; Available online: https://www.agy.com/wp-content/uploads/2014/03/High_Strength_Glass_Fibers-Technical.pdf (accessed on 10 February 2022).
  28. Sathishkumar, T.P.; Satheeshkumar, S.; Naveen, J. Glass fiber-reinforced polymer composites—A review. J. Reinf. Plast. Compos. 2014, 33, 1258–1275. [Google Scholar] [CrossRef]
  29. Singh, T.J.; Samanta, S. Characterization of Kevlar fiber and its composites: A review. Mater. Today Proc. 2015, 2, 1381–1387. [Google Scholar] [CrossRef]
  30. Cline, J.; Wu, V.; Moy, P. Assessment of the Tensile Properties for Single Fibers; US Army Research Laboratory Aberdeen Proving Ground: Aberdeen, MD, USA, 2018. [Google Scholar]
  31. Abouzaid, H.A.K. An investigation into the functional properties of Kevlar and Dyneema fabrics used as bulletproof. Int. Des. J. 2021, 11, 331–337. [Google Scholar]
  32. Gao, J.; Nie, Y.; Lim, B.H.; Kedir, N.; Chen, W. A microscopic experimental method transversely loading on single high-performance fibers. Exp. Mech. 2019, 59, 669–679. [Google Scholar] [CrossRef]
  33. DexMat High Performance CNT Products. Galvorn CNT Fiber 10 Microns. Available online: https://store.dexmat.com/galvorn-cnt-fiber-10-microns-1-m-long/#product-details (accessed on 13 January 2021).
  34. COI Ceramics. Incorporated, SylramicTM SiC Fiber; Magna, UT, USA, 2013; Available online: https://pdf4pro.com/cdn/sylramictm-sic-fiber-coi-ceramics-2bae04.pdf (accessed on 10 February 2022).
  35. Sola, F.; Bhatt, R. Mapping the local modulus of Sylramic silicon carbide fibers by nanoindentation. Mater. Lett. 2015, 159, 395–398. [Google Scholar] [CrossRef]
  36. Gao, J.; Kedir, N.; Chen, W. Characterization of failure of single carbon nanotube fibers under extreme transverse loading. Mater. Des. 2022, 215, 110482. [Google Scholar] [CrossRef]
  37. Lim, B.H.; Chu, J.M.; Chen, W. Mechanical behavior of high-performance yarns transversely loaded by different indenters. Fibers 2018, 6, 69. [Google Scholar] [CrossRef] [Green Version]
  38. Doyle, J.F. Wave Propagation in Structure: Spectral Analysis Using Fast Discrete Fourier Transforms; Springer: New York, NY, USA, 1997. [Google Scholar]
Figure 1. The SEM image of the indenter surface.
Fibers 10 00048 g001
Figure 2. Single-fiber tensile experimental setup.
Fibers 10 00048 g002
Figure 3. Single-fiber transverse loading experimental setup.
Fibers 10 00048 g003
Figure 4. Tensile stress–strain curves of different fibers.
Fibers 10 00048 g004
Figure 5. Failure behavior of a representative CNT fiber. (a) Force-deflection curve; Real-time fiber morphology at Str = (b) 0; (c) 1.862 mm; (d) 3.003 mm.
Fibers 10 00048 g005
Figure 6. Failure behavior of a representative SlyramicTM ceramic fiber. (a) Force-deflection curve; Real-time fiber morphology at Str = (b) 0; (c) and (d) 0.832 mm.
Fibers 10 00048 g006
Figure 7. Failure behavior of a representative S-2 glass fiber. (a) Force-deflection curve; Real-time fiber morphology at Str = (b) 0; (c) and (d) 4.017 mm.
Fibers 10 00048 g007
Figure 8. Failure behavior of a representative Kevlar KM2 Plus fiber. (a) Force-deflection curve; Real-time fiber morphology at Str = (b) 0; (c) 2.206 mm; (d) 6.511 mm; (e) 6.621 mm; (f) 6.787 mm; (g) and (h) 6.817 mm.
Fibers 10 00048 g008
Figure 9. Crack initiation and propagation in other representative Kevlar KM2 Plus fiber specimens. (a) Two cracks initiated with a large interval; (b) One crack initiated during loading; (c) Crack propagation.
Fibers 10 00048 g009
Figure 10. Failure behavior of a representative Dyneema® SK76 fiber. (a) Force-deflection curve; Real-time fiber morphology at Str = (b) 0; (c) 7.521 mm; (d) 7.651 mm; (e) 8.005 mm; (f,g) 9.205 mm.
Fibers 10 00048 g010
Figure 11. Fracture surfaces of different fibers. (a) CNT fiber; (b) SlyramicTM ceramic fiber; (c) S-2 glass fiber; (d) Kevlar® KM2 Plus fiber; (eg) Dyneema® SK76 fiber.
Fibers 10 00048 g011
Figure 12. Force-deflection curves of different fibers.
Fibers 10 00048 g012
Figure 13. Comparison of energy dissipation of different fibers.
Fibers 10 00048 g013
Figure 14. Comparison of energy density of different fibers.
Fibers 10 00048 g014
Figure 15. Comparison of specific energy of different fibers.
Fibers 10 00048 g015
Figure 16. Comparison of η for different fibers.
Fibers 10 00048 g016
Table 1. Material properties of different fibers.
Fiber TypeDensity ρ (kg/m3)Diameter d (μm)Tensile Strength σte (GPa)Failure Strain εte (%)
CNT1500 [33]9.60 ± 0.581.94 ± 0.222.26 ± 0.31
SlyramicTM3100 [34]10.15 ± 0.312.73 ± 0.411.47 ± 0.16
S-2 glass2488 [27]9.93 ± 0.323.68 ± 0.206.50 ± 0.42
Kevlar® KM2 Plus1450 [30]10.48 ± 0.323.92 ± 0.263.99 ± 0.19
Dyneema® SK76980 [8]16.67 ± 0.661.99 ± 0.263.83 ± 0.42
The strain rate is 2.6 × 10⁻⁴.
Publisher’s Note: MDPI stays neutral with regard to jurisdictional claims in published maps and institutional affiliations.

