Article

Synthesis of Silane Functionalized Graphene Oxide and Its Application in Anti-Corrosion Waterborne Polyurethane Composite Coatings

1
School of Chemistry and Chemical Engineering, Chongqing University, Chongqing 400045, China
2
National Key Laboratory for Remanufacturing, Army Academy of Armored Forces, Beijing 100072, China
*
Author to whom correspondence should be addressed.
Coatings 2019, 9(9), 587; https://doi.org/10.3390/coatings9090587
Submission received: 9 August 2019 / Revised: 2 September 2019 / Accepted: 10 September 2019 / Published: 17 September 2019

Abstract

:
In this study, novel silane functionalized graphene oxide (PVSQ-GO) composite material is synthesized through the hydrolysis condensation reaction of vinyl triethoxysilane monomers occurred at the surface of graphene oxide. Results obtained from FTIR, Raman, X-ray photoelectronic spectroscopy (XPS), XRD and TGA measurements reveal that polyvinyl sesquisiloxane microspheres adhere to graphene oxide lamellae in the form of chemical bonds. Meanwhile, it is intuitive that abundant polyvinyl sesquisiloxane microspheres stick to the surface of graphene oxide and increase the thickness of the flake. Modified graphene oxide changes from hydrophilicity to hydrophobicity were owing to the existence of polyvinyl sesquisiloxane microspheres on the surface of graphene oxide (GO). PVSQ-GO composite exhibited good dispersion in eco-friendly waterborne polyurethane coating. Electrochemical impedance spectroscopy manifested that the anti-corrosion performance of waterborne polyurethane (WPU) coating embedded at 0.5 wt.% PVSQ-GO composite improved effectively. Tafel curves reveal that 0.5 wt.% PVSQ-GO/WPU coating specimen shows the lowest corrosion rate of 8.95 × 10⁻⁵ mm/year when compared with the other coating specimens. The good anti-corrosion abilities of PVSQ-GO composite coating can be interpreted as the good compatibility between PVSQ-GO composite and waterborne polyurethane, however, the intrinsic hydrophobicity of PVSQ-GO composite is beneficial to inhibit the permeation of corrosive medium and thus slows down the corrosion rate.

1. Introduction

Graphene, a novel two-dimensional carbon nanomaterial with a special single-atom-thick lamellar structure, which urges with graphene, possesses some superior properties, such as thermal stability [1], good conductivity [2], excellent mechanical properties [3,4], high specific surface area [5] and impermeability, [6] etc. So far, many studies have proved that graphene has enormous potential in the application of the anticorrosion field [7,8]. The original studies had demonstrated that directly coating graphene on metal substrate through chemical vapor deposition (CVD) could provide an effective anticorrosion protection for the metal substrate which is mainly ascribed to the impermeability of graphene nanosheets [9,10,11]. Prasai et al. [12] employed electrochemical methods to grow graphene on a copper and nickel matrix, the result revealed that the graphene coating could restrain metal oxidation and oxygen reduction effectively, hence, it presented good anti-corrosive performance when compared with bare copper and nickel, however, the metal was corroded at the cracks in the graphene film. There are also reports that graphene grown on copper may accelerate the oxidation of copper under ambient conditions because it provides an additional electron channel that induces the rapid formation of oxygen ions at the air/oxide interface [7,13]. It would be a great failure for graphene coating to offer a long period of anti-corrosion effects owing to the existence of microgalvanic corrosion once a defect has formed [14,15].
Another strategy to apply graphene on metal anti-corrosion is adding graphene to a conventional polymer coating. Initially, graphene nanoplatelets are directly mixed with organic coating without any modification treatment [16,17]. However, and in fact, simply adding graphene is not common, because the compatibility between graphene and polymer materials is not ideal, graphene has the tendency to agglomerate and stack, and can even have an adverse effect. In addition, the electrical connection of metal and graphene will promote the corrosion process once the coatings are destroyed and the electrolyte penetrates the coating into a coating/metal interface, which are ascribed to the potential differences between graphene and metal, thus leading to microgalvanic corrosion. Sun et al. [18] encapsulated graphene sheets in insulating materials (3-aminopropyl)-triethoxysilane (APTES) to form a reduced graphene oxide@APTES sandwich structure composite, the barrier properties of the polyvinyl butyral coating improved remarkably by embedding appropriate amounts of the composite in the coating and the corrosion-promotion activity of graphene was completely inhibited. Subsequently, they also investigated the functionalization degree of graphene which would influence the anti-corrosive performance of the composite coatings. The result revealed that there was a critical functionalization degree of graphene that could inhibit the corrosion promotion activity, however, due to the restrictions of the extent of reaction between graphene and APTES, the corrosion promotion activity was difficult to suppress absolutely [19]. Liu et al. [20] succeeded in synthesizing the titanium dioxide-decorated graphene oxide (GO) nanocomposite, then the nanocomposite was modified with γ-(2,3-epoxypropoxy) propyl-trimethoxysilane and afterwards the final product was incorporated into epoxy resin to fabricate an epoxy coating, and then it was painted on the surface of aluminum alloy. The nanocomposite exhibited good dispersion in the epoxy matrix and the enhancement of anti-corrosion performance for the coating was observed in an obvious way. Zhang et al. [21] used four kinds of silane coupling agents to modify graphene oxide. The result demonstrated that graphene oxide grafted by 3-methacryloxypropyltrimethoxysilane showed better dispersion stability than 3-aminopropyltrimethoxysilane. This might be attributed to the preferential reaction of amino groups in 3-aminopropyltrimethoxysilane with carboxyl groups on the surface edge of graphene oxide, which inhibited the reaction between hydroxyl groups hydrolyzed by 3-aminopropyltrimethoxysilane and hydroxyl groups on the surface of graphene oxide. Graphene oxide, when combined with the 3-methacryloxypropyltrimethoxysilaneby chemical bond could disperse uniformly in an urushiol formaldehyde polymer (UFP) coating, and thus, presented significant enhancement in anticorrosion performance which was ascribed as critical for 3-methacryloxypropyltrimethoxysilane to improve the interfacial interaction between UFP and graphene oxide. Above all, a silane coupling agent can effectively improve the compatibility between graphene and an organic polymer matrix, which provides a new idea for the application of graphene.
Polysesquisiloxane (PSQ) microspheres are a new type of organic–inorganic hybrid material that have a special spatial stereostructure of both an inorganic siloxane “skeleton” structure and a side chain featuring an organic group. The special chemical composition and structure endows it with excellent properties of inorganic/organic hybrid materials, such as excellent thermal stability, corrosion resistance, and hydrophobicity etc. Furthermore, the functional organic groups on the surface of PSQ microspheres play an important role in hydrophobicity and chemical reactivity of PSQ [22]. Rabby et al. [23] coated octaisobutyl polyhedral oligomeric silsesquioxane (POSS) on the surface of SiC nanoparticles via a sonochemistry method to manufacture a more compatible interface between the particle and the thermoset polymer. It was found that the flexural strength, modulus, and glass transition temperature of the polymer improved obviously after the injection of the nanoparticles. Yadav et al. [24] synthesized new composite material consisting of POSS and carbon nanotubes; the processability and solubility of the composite was enhanced substantially due to the better reactivity and solubility of POSS molecules in organic solvent. Xue et al. [25] prepared polysesquiloxane grafted graphene oxide hybrids by the reaction of the epoxy group and the carboxyl group on the surface of graphene oxide with the amino of amine-functionalized polyhedraloligomeric silsesquioxane. The POSS-GO hybrids could be stably dispersed in many common organic solvents, such as tetrahydrofuran, toluene, acetone and chloroform. The contact angle between the film prepared by POSS-GO and water/air was 157°, which exhibited strong hydrophobicity. S. Naderizadeh et al. [26] used a simple annealing process to fabricate superhydrophobic silica nanoparticle films over a metal surface, and found a significant enhancement of wear resistance by using a thin graphene nanoplatelet film as a thermal interface material between the primer and the silica nanoparticle film. At present, there are rarely any investigations in regard to polysesquisiloxane in situ formation on the surface of graphene nanosheets. To the best of our knowledge, polyvinyl sesquisiloxane (PVSQ) is synthesized by a hydrolysis condensation reaction, and the reaction conditions are mild and easy to control. Moreover, PVSQ microspheres possess the organic functional group of double bond which will improve compatibility with the organic matrix. On the other hand, as an organic–inorganic hybrid material, PVSQ microspheres display hydrophobicity. It is a potential for PVSQ to be applied in the modification of graphene and anti-corrosion waterborne polyurethane.
Therefore, in this research, we choose vinyl triethoxysilane as the reaction monomer to synthesize polyvinyl sesquisiloxane microspheres and then attach them in situ on the surface of graphene oxide. Subsequently, the silane functionalized graphene oxide (PVSQ-GO) composite was introduced into an eco-friendly, waterborne polyurethane coating at different amounts to investigate the corrosion resistance performance by traditional electrochemical methods, such as electrochemical impedance spectroscopy (EIS) and Tafel curves. The results showed that addition of 0.5 wt.% PVSQ-GO composite coating exhibited better barrier properties.

2. Experimental

2.1. Materials

Graphene oxide powder (lateral dimension: 0.5–5 μm) was purchased from Qitaihe Baotailong Graphene New Materials Co., Ltd (Qitaihe, China). Vinyltriethoxysilane (97%) was purchased from Aladdin Industrial Corporation (Shanghai, China) without further purification. Waterborne polyurethane (NeoRez R-9679) was provided by Royal Dutch Dismann Group (Shanghai, China), and the solid content was 37 wt.%, the Fourier transform infrared (FTIR) spectra confirmed it was polyester (Figure 1). Ammonia (25%) and absolute ethanol were purchased from Shanghai Titan Scientific Co., Ltd (Shanghai, China). Deionized water was made in the laboratory. Q235 Steel with a dimension of 150 mm × 75 mm × 2 mm was abraded using sand-papers with 400, 800, and 1200 grades. Then these samples were washed with absolute ethanol and deionized water prior to coating application. The composition of Q235 steel is shown in Table 1.

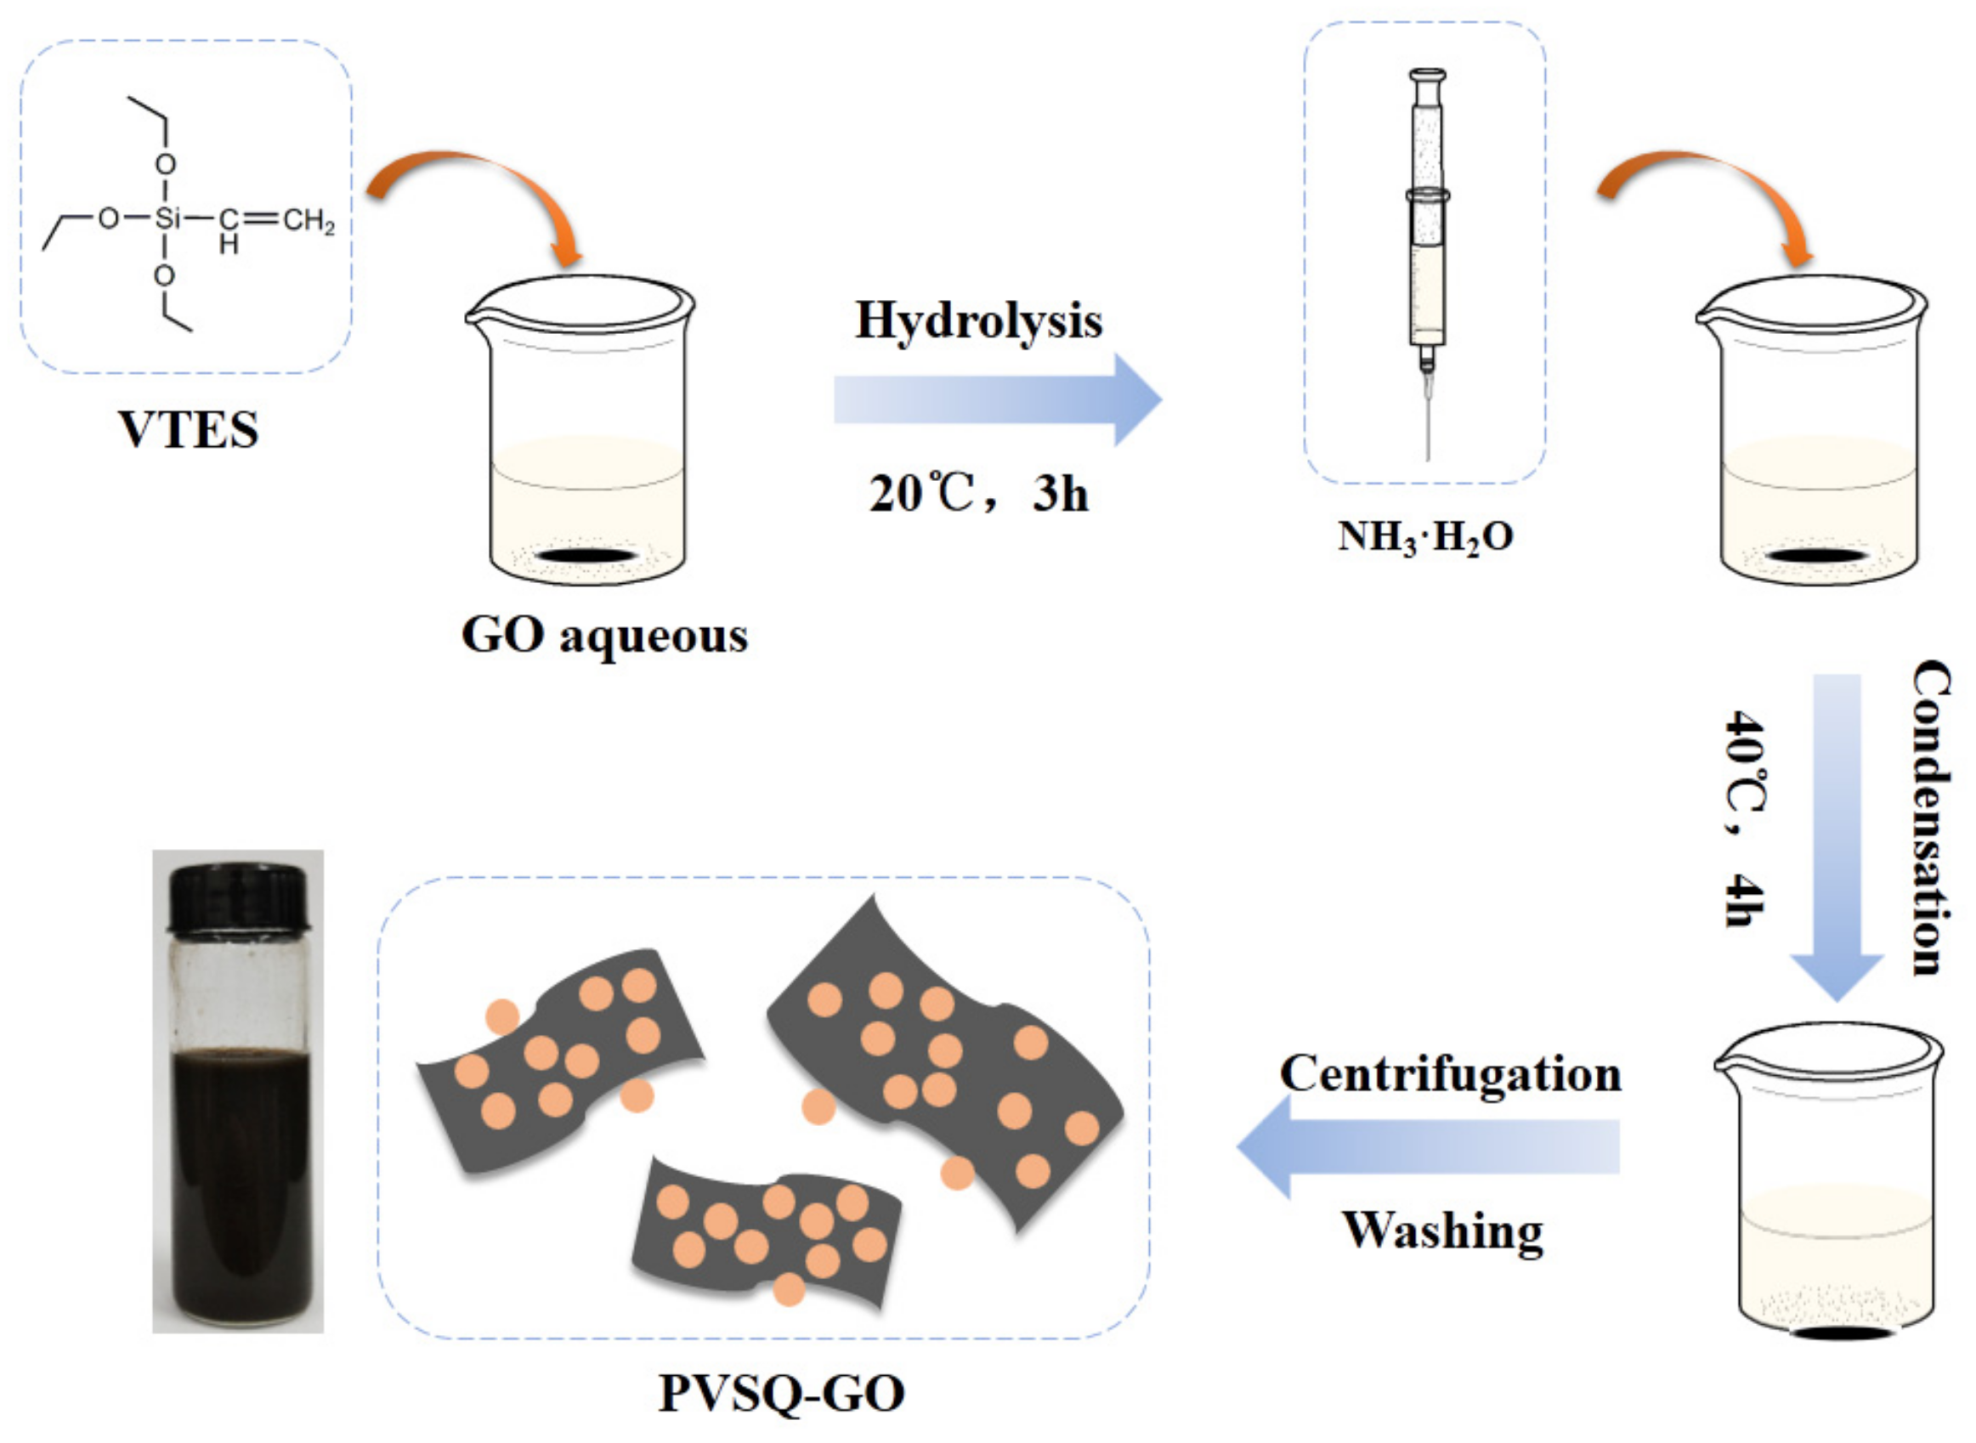
2.2. Synthesis of Silane Functionalized Graphene

Silane functionalized graphene was synthesized by the process as shown in Scheme 1. At first, 150 mg graphene oxide was dissolved in 50 mL of deionized water with continuous sonication for 30 min to prepare GO aqueous suspensions. Then, 5 mL of vinyltriethoxysilane was added into the GO aqueous, after a reaction under magnetic stirring at 20 °C for 3 h, and then 3 mL of ammonia was added into the above aqueous solution dropwise. The reaction was maintained at 40 °C for 4 h. Finally, the modified GO was centrifuged and washed with absolute ethanol and deionized water several times to remove unreacted reagents. The modified GO was named PVSQ-GO and stored for the following experiments.

2.3. Fabrication of the Composite Coatings

A certain amount of PVSQ-GO composite (18.5 and 37 mg) was dispersed in 8.5 g of deionized water by ultrasonication for 30 min at room temperature. Then 10 g of waterborne polyurethane was added into the above mixture by ultrasonication for 5 min, and then stirred for 10 min to make it disperse uniformly. The mixture was painted onto the pretreated Q235 steel substrates via a wire bar coater with a thickness of 30 μm after being aged for 1 h. The composites coatings were cured in a vacuum oven at 110 °C for 30 min. Based on the different weight content of silane functionalized graphene, the coatings were named as 0.5 wt.% PVSQ-GO/waterborne polyurethane (WPU) and 1.0 wt.% PVSQ-GO/WPU, respectively. For comparison, graphene oxide was also used to prepare the waterborne polyurethane coating according to the above procedure, which was named as 0.5 wt.% GO/WPU. Further, the pure waterborne polyurethane coating (pure WPU) was also prepared for comparison.

2.4. Characterization

The morphology of GO and PVSQ-GO was estimated by scanning electron microscopy (SEM, Quanta FEG 250, FEI, Hillsboro, OR, USA), transmission electron microscopy (TEM, Tecnai G2F20, FEI, Hillsboro, OR, USA) and atomic force microscope (AFM, Dimension Icon, Bruker, Billerica, MA, USA). X-ray photoelectronic spectroscopy (XPS, Thermo SCIENTIFIC ESCALAB 250Xi, Waltham, MA, USA) was utilized to evaluate the chemical structure of the GO and PVSQ-GO composite. A Fourier transform infrared spectrum was recorded using an FTIR spectrometer (FTIR, NICOLET iS50, Thermo Fisher Scientific) operating at room temperature. Thermogravimetric analyses (TGA, NETZSCH STA449F3, Selb, Germany) was conducted from 30 to 800 °C under a nitrogen atmosphere with a heating rate of 10 °C/min. Raman spectrum was measured with a confocal Raman spectrometer (HORIBA Scientific, Kyoto, Japan) using the wavelength of 514 nm. Contact angles of graphene and as-prepared composite coatings were characterized through DSA100 contact goniometer. X-ray diffraction (XRD, Xpert Pro, New Delhi, India) patterns were obtained using monochromatic Cu Kα radiation at a speed of 10°/min in the range of 5°−90°, and the interplanar distance (d) was calculated by the Bragg equation. The morphology of surface and fracture surface of the coatings was examined by scanning electron microscopy (SEM, Quanta FEG 250). EIS and potentiodynamic polarization were performed on a ZENNIUM electrochemical workstation (ZAHNER MESSSYSTEME, Kronach, Germany) with a three-electrode system in 3.5 wt.% NaCl solution. The Ag/AgCl electrode was used as the reference electrode, a platinum plate was used as the counter electrode, and coated specimens (exposed surface area of 1 cm2) were used as working electrodes. Before each electrochemical measurement, open-circuit potential (OCP) was recorded to reach a steady status. At various time intervals, EIS was carried out in the frequency range of 105 Hz to 10−2 Hz with applied 100 mV sinusoidal perturbations. ZSimDemo3.30d software was used for fitting and analyzing the EIS results. Potentiodynamic polarization measurements were scanned from −0.50 to +0.50 V (vs. OCP) with a scan rate of 1 mV/s. A salt spray test was done according to ASTM B117 [27]. In this test, the coating samples were destoried and placed in the test chamber with a continuous spray of atomized 5.0 wt.% NaCl solution (pH 7.0, temperature 40 °C).

3. Results and Discussion

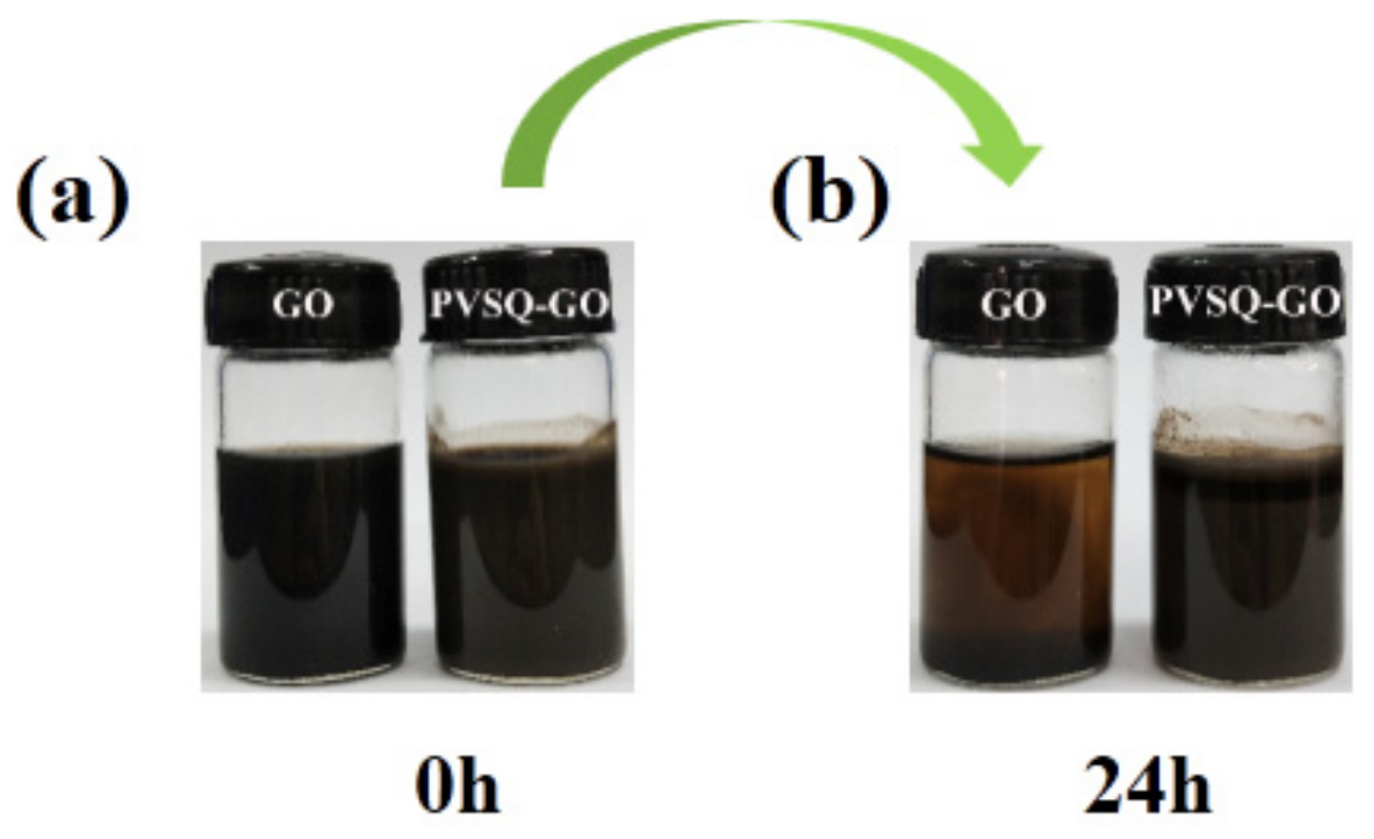
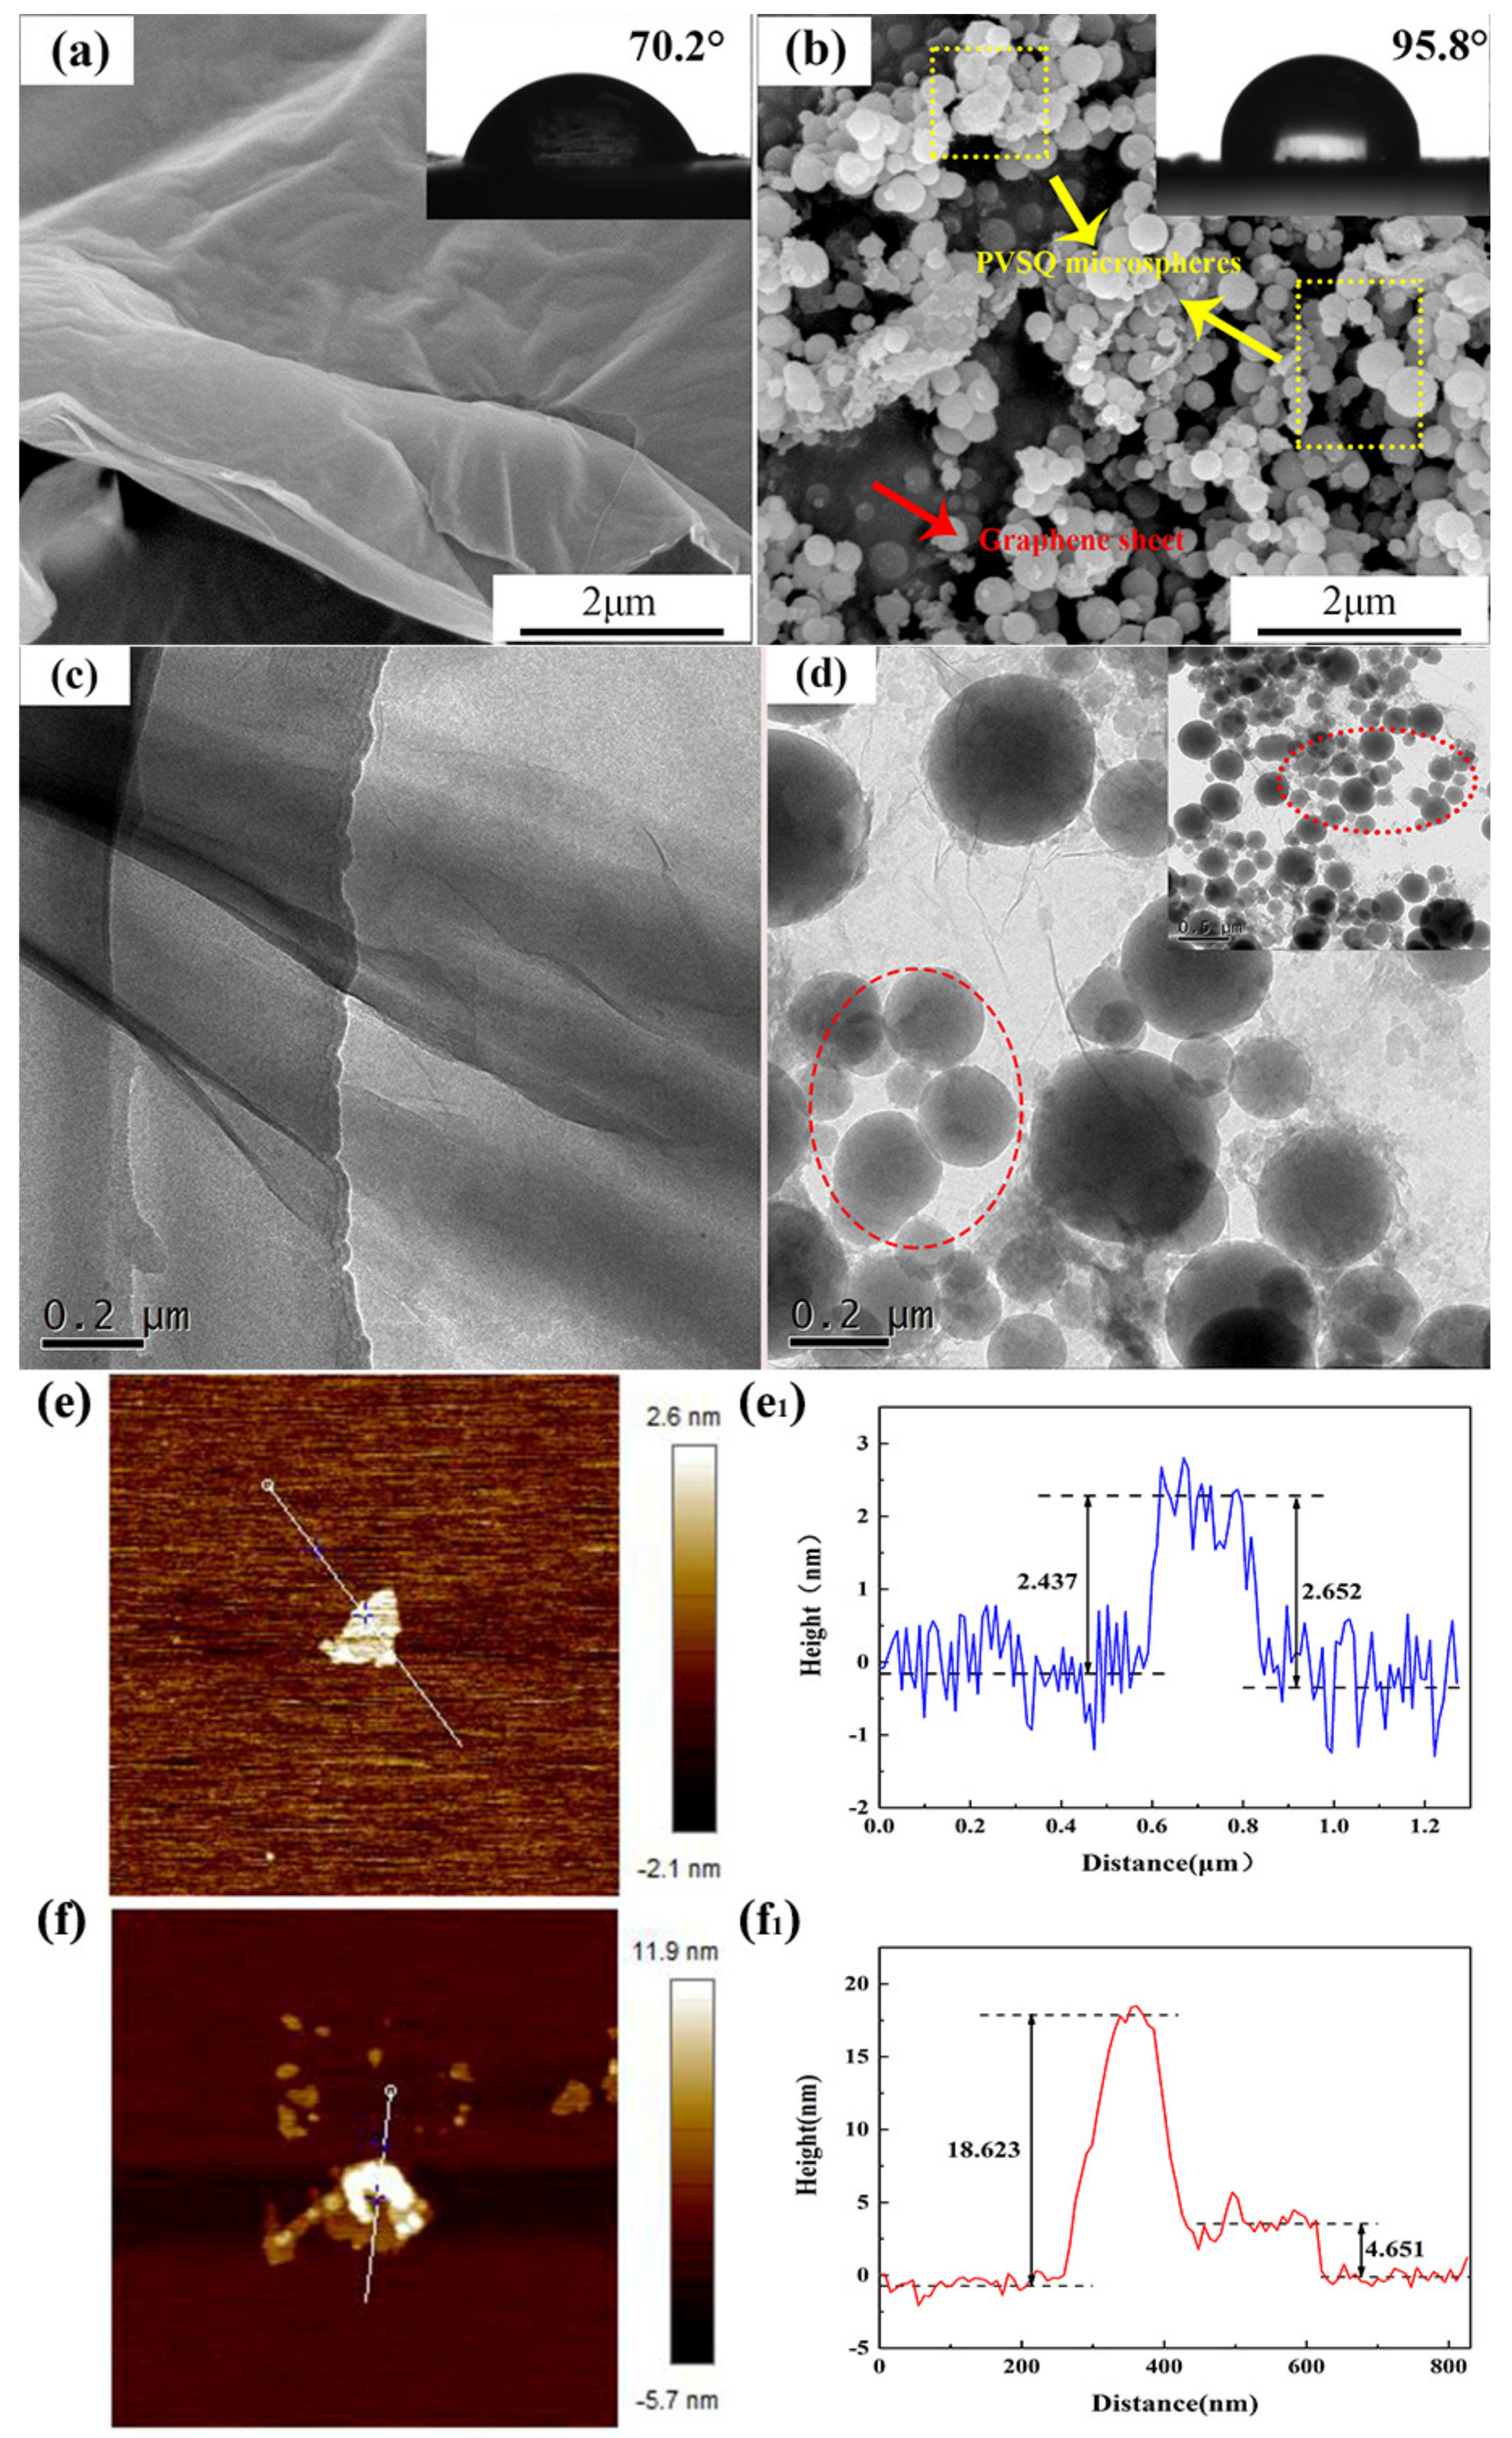
3.1. Characterization of the PVSQ-GO Composite Material

A sedimentation test was used to examine the dispersion ability of GO and PVSQ-GO in deionized water. The sedimentation test result is shown in Figure 2. GO and PVSQ-GO were well dispersed after ultrasonication for 30 min (Figure 2a), but after 24 h storage, GO aqueous solution was partly deposited at the bottom of the bottle, while there was no obvious stratification phenomenon in PVSQ-GO aqueous solution (Figure 2b). It indicated that the dispersion ability of GO in water was significantly improved after it was modified with vinyltriethoxysilane.
An FTIR spectra of GO and PVSQ-GO hybrid nanomaterial was utilized to investigate the chemical bonding between PVSQ and GO. Figure 3a shows the characteristic peaks of GO at 3400, 2357, 1728, 1626, 1358, 1207 and 1050 cm−1, which were assigned to hydroxyl vibration (O–H), stretching of carboxyl groups on carbon skeleton (C–COOH), C=O vibration (–COOH), aromatic C=C vibration, stretching vibration of hydroxyl groups in carboxyl groups (–CO–OH), C–OH stretching vibrations and epoxy C–O stretching [28]. Obviously, some new peaks were observed in the spectrum of PVSQ-GO hybrid material. The absorption peaks at 3062 and 2960 cm−1 belonged to the asymmetric and symmetric stretching vibration of =CH2, respectively. The absorption peaks of aromatic C=C vibration at 1626 cm−1 of graphene oxide shifted slightly to 1606 cm−1, and the intensity of the characteristic peak increased obviously, both of which were due to the vinyl functional group in vinyltriethoxysilane. The absorption peaks at 1132 and 1132 cm−1 belonged to Si–O–C symmetrical stretching vibration and the Si–O–Si symmetrical stretching vibration, respectively [26]. This could be ascribed to the hydrolysis and condensation reaction of vinyltriethoxysilane. The presence of various functional groups on GO sheets demonstrate that grapheme oxide is successfully silane functionalized.
XRD was utilized to provide further insight into the crystalline structure of GO and PVSQ-GO. As shown in Figure 3b, GO displayed a sharp characteristic diffraction peak at 2θ = 12.42° which corresponded to the (001) plane, indicating an interlayer spacing of 0.712 nm associated with the existence of oxygen-containing functional groups on the basal plane and residual water molecules trapped between the adjacent sheets. After modification with vinyltriethoxysilane, the peak at 12.43° shifted to 9.31° (d = 0.950 nm), signifying the successful covalent attaching and exfoliation of GO. Furthermore, a new broad peak emerged at approximately 22.68°, implying that GO was reduced by vinyltriethoxysilane partially and the restoration of a natural graphitic structure.
The structure of GO and PVSQ-GO could be determined through a Raman spectra presented in Figure 3c. GO exhibited two characteristic peaks located at around 1350 cm−1 (D band) and 1592 cm−1 (G band), which were attributed to the structural defects associated with oxygen-containing functional groups and the in-plane vibration of sp2 carbon atoms, respectively [29]. In addition, the relative intensity ratio of D band to G band (ID/IG) was used to evaluate the disordered degree of graphene. PVSQ-GO hybrids showed a higher relative intensity ratio (ID/IG = 0.921) compared with pristine GO (ID/IG = 0.884). The result demonstrated a higher irregular structure of the PVSQ-GO composite. The increased relative intensity ratio could account for the graphene oxide that was modified by vinyltriethoxysilane [30].
TGA analysis was used to measure the thermal stability of materials. Figure 3d shows the TGA curves of GO and PVSQ-GO. There was a conspicuous difference in weight loss which meant that the structure and composition of GO changed after modification. There were two weight loss stages in GO, For Stage I, the weight loss was nearly 17.2 wt.% when the temperature rose to 180 °C due to the volatilization of residual moisture between graphene sheets. The ultimate weight loss was up to approximately 57.6 wt.% as the temperature reached 800 °C in Stage II, which was assigned to the decomposition of oxygen-containing functional groups. However, PVSQ-GO exhibited only one weight loss stage, and the total weight loss (10.9 wt.%) was far less than that of GO. It was because the PVSQ-GO composite possesses strong non-polar covalent bonds of Si–O–C, it can better maintain the integrity of the internal structure. When the carbon materials are effectively modified by a silane coupling agent, the embedding of silane groups will improve the thermal stability of materials [31,32]. Meanwhile, polyvinyl sesquisiloxane has good heat resistance, inherently.
The chemical states and composition analysis of GO and PVSQ-GO hybrids were further evaluated by XPS. The appearance of an Si element in the full XPS spectrum of PVSQ-GO compared with GO (Figure 3e,f) was observed, which originated from the modification by vinyltriethoxysilane. The high-resolution C 1s spectra of PVSQ-GO (Figure 3g) could be deconvoluted into five major peaks located at 284.1, 284.7, 286.5, 287.2 and 288.6 eV, which were allocated to C–Si, C–C/C=C, C–O,C=O and O=C–O bonds, respectively [33]. Two peaks were exhibited in the Si 2p spectra at 102.4 and 103.5 eV related to Si–O–Si and Si–O–C bonds [34] (Figure 3h). The presence of an Si–O–Si and Si–O–C peak further demonstrated that PVSQ microspheres attach on the surface of the GO sheet via a chemical bond. This finding was consistent with FT-IR and Raman results.
The morphology and microstructure of GO and PVSQ-GO were investigated by SEM, TEM, AFM and contact angle. As shown in Figure 4a, the surface of GO was wrinkled and uneven, and the contact angle of GO was about 70.2°. It exhibited a hydrophilic property because there were amounts of oxygen-containing functional groups on the surface of the GO sheet, but after being modified, a large number of microspheres covered the surface of the prepared PVSQ-GO hybrids (Figure 4b), which was attributed to the hydrolysis and condensation reaction of vinyltriethoxysilane which took place on the surface of GO. The rough surface made it possess a hydrophobicity structure and the contact angle was up to 95.8°. For the TEM image, the GO exhibited a slight aggregation state (Figure 4c), however, a great amount of organosilica microspheres stuck to the surface of GO which varied in size, and the PVSQ-GO nanosheets were transparent with less aggregation (Figure 4d). This meant that the Van der Waals interaction force between the interlayer of GO was weakened by the modified vinyltriethoxysilane. The thickness of GO and PVSQ-GO were further analyzed by AFM. GO exhibited a thin layer structure and the average thickness was about 2.652 nm (Figure 4e), while the average thickness of PVSQ-GO was about 18.62 nm (Figure 4f). It was much larger than the average lamellar thickness of GO, this was because a lot of organosilica microspheres covered the surface of the GO sheet which thus increased the thickness of graphene sheet. To summarize all the above analyses, the possible reaction mechanism between vinylriethoxysilane and graphene oxide is shown at Scheme 2.

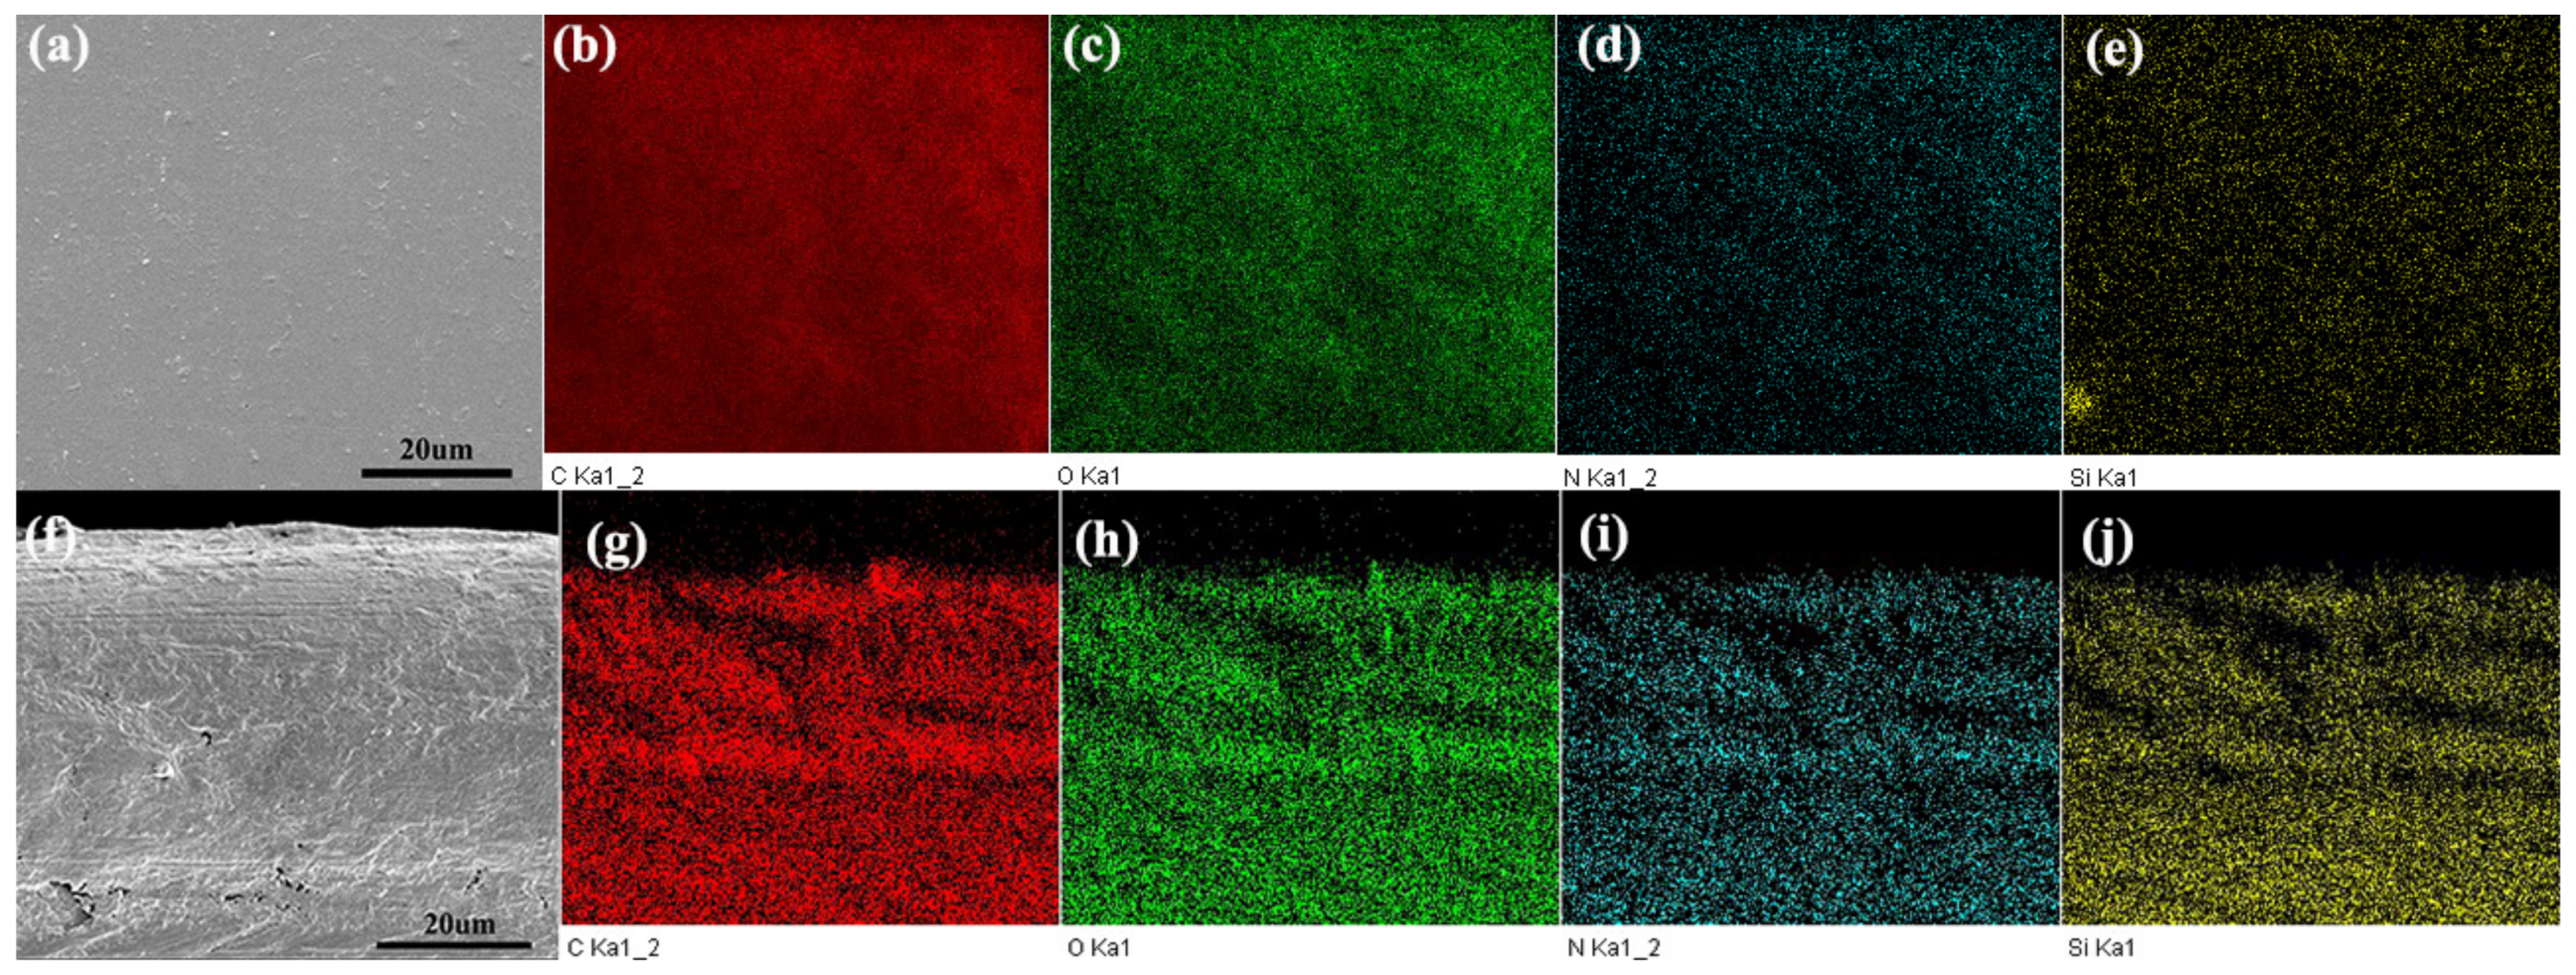
3.2. Surface Properties and Section Morphology

In order to study the dispersion and interfacial interaction of graphene nanofillers in waterborne polyurethane coatings, the surface and cross-sectional morphologies of coating specimens are shown in Figure 5 and Figure 6, respectively. As it can be seen from Figure 5a, pure WPU coating showed a smooth surface, after the incorporation of the GO and PVSQ-GO composite, the surface became rougher than pure WPU. But it was notable that there were many small protuberances distributed uniformly on the surface of the 0.5 wt.% PVSQ-GO WPU coating specimen which were ascribed to the good dispersion of the PVSQ-GO composite, while the small protuberances agglomerated together for the 1.0 wt.% PVSQ-GO WPU specimen, corresponding to the excessive PVSQ-GO composite agglomerated in the WPU matrix. The contact angle of the coating surface would have affected the anticorrosion performance of the coating. The pure WPU coating specimen exhibited a contact angle of 71.4°, but while inserting the hydrophilic GO into the WPU coating, the value of the contact angle dropped to 65.3°. The 0.5 wt.% PVSQ-GO WPU coating specimen exhibited a maximum contact angle value up to 83.6°, which was to account for the inserting of the hydrophobic PVSQ-GO composite. With the increase of the PVSQ-GO composite additional amount, the contact angle value showed a downward trend which was attributed to the excessive PVSQ-GO composite which was difficult to disperse well in the WPU matrix.
The cross-section morphology of the as-prepared coating specimens are shown in Figure 6. A large number of cracks and holes were observed for the pure WPU coating specimen (Figure 6a), which were ascribed to the evaporation of water during curing of the waterborne polyurethane. After the addition of 0.5 wt.% GO, the holes slightly decreased, but numerous cracks were still displayed (Figure 6b), which owed to the poor compatibility between GO and waterborne polyurethane. However, for the 0.5 wt.% PVSQ-GO/WPU coating specimen, the cracks and holes almost disappeared and displayed a smooth fracture surface (Figure 6c), demonstrating that the good dispersion of the PVSQ-GO composite in the WPU matrix and excellent compatibility with waterborne polyurethane. With the filler content being increased up to 1.0 wt.%, the fracture surface was uneven and rough (Figure 6d), thus, it could be inferred that excessive PVSQ-GO composite agglomerated existed in the WPU matrix.
The EDS map scanning was also utilized to further investigate the dispersion of PVSQ-GO composite in waterborne polyurethane matrix. Figure 7 shows the EDS map scanning of the surface and cross-section for 0.5 wt.% PVSQ-GO/WPU coating specimen. The results revealed that Si elements were detected and distributed uniformly in both the surface and cross-section which suggested good dispersion of the PVSQ-GO composite in the WPU matrix.

3.3. Mechanical Performances

The adhesion strength between the coatings and the metal substrate directly affected the corrosion resistance of coatings. The coatings tended to foam and delaminate in the process of immersion which may be attributed to the weak adhesion strength between coatings and metal substrate, thus resulting the failure of the coating [35]. It was considered that the coating system with strong protective ability should have a high adhesion strength. The adhesion strength of these as-prepared specimen was measured by a pull-off test. The result was presented in Figure 8a. For pure WPU specimen, it showed that the smallest adhesion strength (1.79 MPa), indicated the poor adhesive strength between the pure WPU coating and the metal substrate. After incorporating 0.5 wt.% GO into WPU, the adhesion strength increased slightly to 2.26 MPa. The specimen which incorporated 0.5 wt.% PVSQ-GO showed the largest value of adhesion strength up to 2.97 MPa, suggesting the best reinforcement effect. While the adhesion strength value of 1.0 wt.% PVSQ-GO/WPU specimen showed a downward trend, this may be imputed to the agglomeration of excessive graphene. The results showed that the PVSQ-GO composite could effectively enhance the adhesion strength of the coating and prevent the delaminating of the coating from the steel surface, so that the composite coating was predicted to exhibit excellent protection performance.
The hardness of the coating is an important parameter in detecting the mechanical properties of the coating. The ability of the coating to resist crushing and scratching is stronger when the coating has high hardness. Figure 8b showed the hardness of four kind of coating specimen, the hardness of pure WPU specimen was about 9.8 HV. When inserted 0.5 wt.% GO into WPU, the hardness of the coating increased slightly, this could be interpreted as the inserting of GO nanosheets with high hardness. The well-dispersed PVSQ-GO in WPU increased the hardness of coating up to 11.9 HV, which was 21.43% higher than pure WPU specimen. The organosilica microspheres attached on the surface of GO may also enhance the hardness of the coating, the existing of PVSQ-GO will increase the structural density of waterborne polyurethane. While the mass fraction of PVSQ-GO nano-additives increased to 1.0 wt.%, the hardness of coating decreased by contrary, illustrated that the distribution state of nano-additive in the coating matrix was an important factor affecting the hardness of coating specimens.

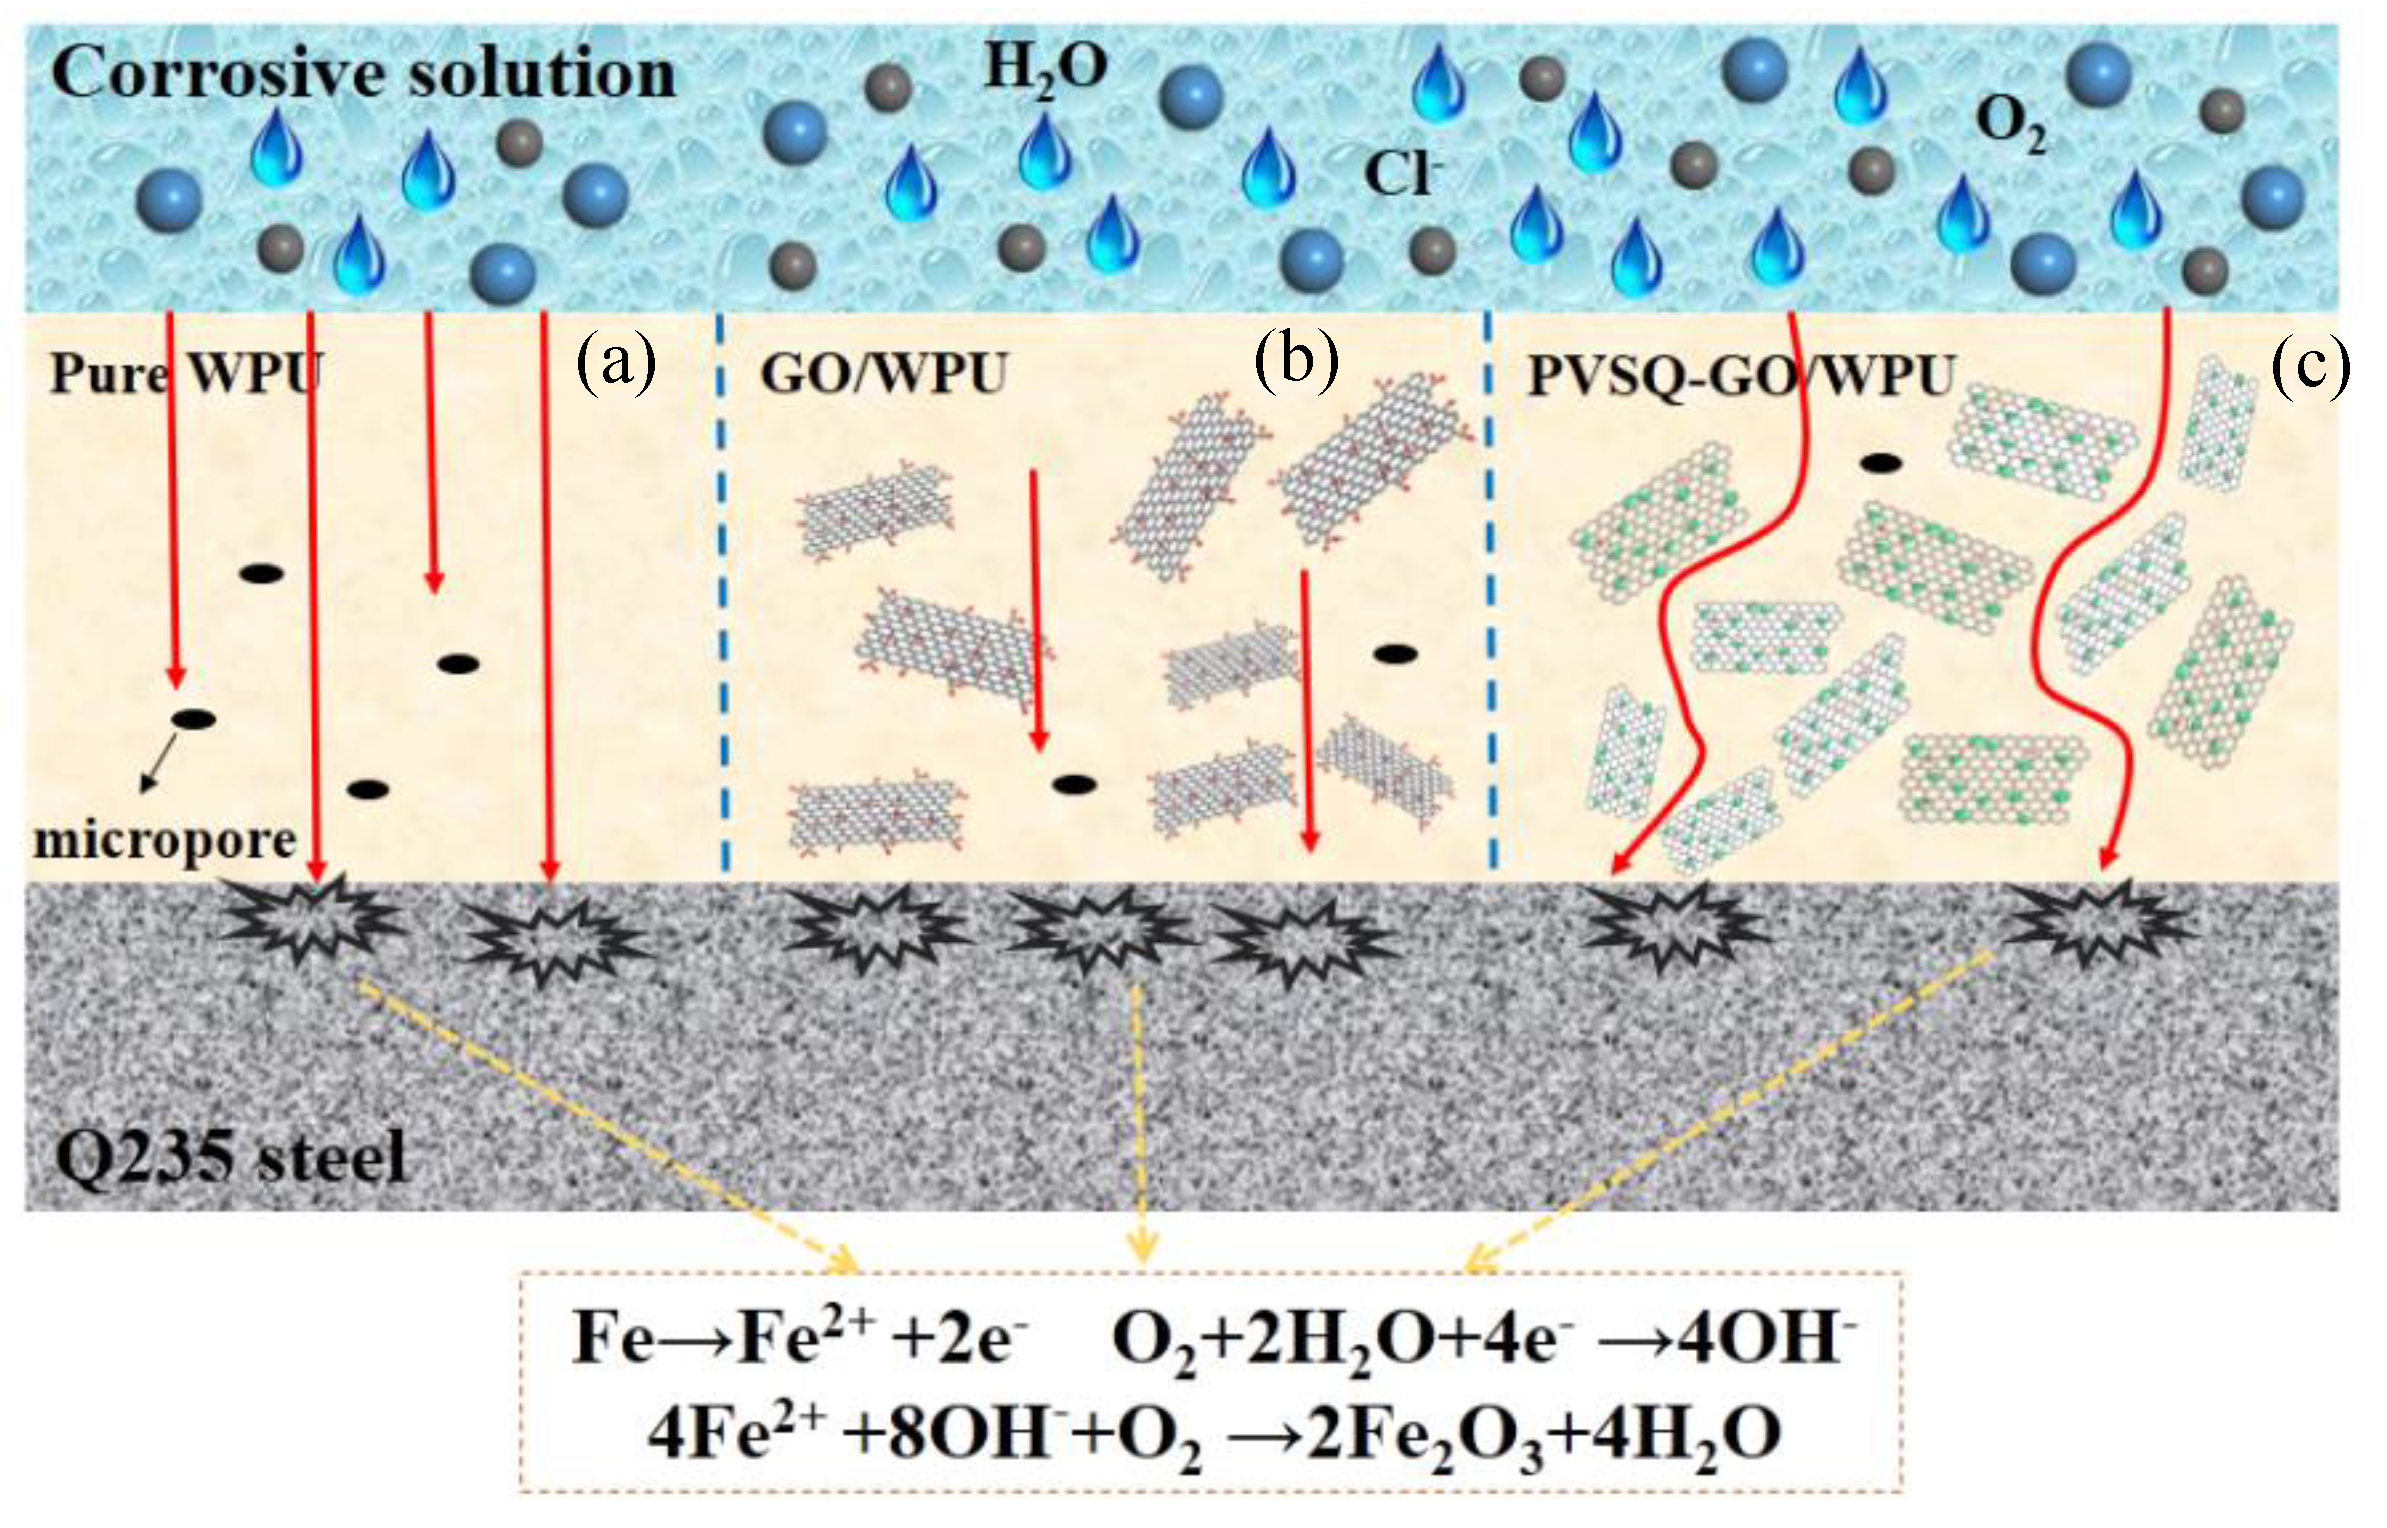
3.4. Anticorrosive Performances

Open circuit potential (OCP) was considered as a reference for corrosion tendency to some extent [36,37]. Generally, high OCP value implied a low corrosion trend. The evolution of OCP value for coating specimen in 3.5% NaCl solution at different immersion times was recorded, as shown in Figure 9. In the initial immersion, all coating specimens exhibited relatively high potential value at −0.040 to −0.120 V because the corrosive medium had not yet reached the interface between the coating and the metal matrix. With the prolongation of immersion time, open-circuit potential showed a downward trend which demonstrated that the corrosive medium permeated through the coating and metals were corroded. It was notable that the open circuit potential of pure WPU coating increased slightly after 10 days immersion which was owed to the corrosive medium blocking the micropores formed in the curing process of the coating. For 0.5 wt.% GO/WPU coating, the OCP value dropped by 0.35 V from one to five days immersion which could be interpreted as the negative effect of hydrophilic graphene oxide. As a whole, the 0.5 wt.% PVSQ-GO/WPU coating specimen exhibited relatively high potential value in the all immersion times and showed the lowest rate of declination compared with any other coating.
The anti-corrosive performance of the coating was investigated by electrochemical impedance spectroscopy (EIS). Figure 10 depicts the EIS date of coating specimens during the immersion of 30 days. For Bode plots, the impedance modulus at a low frequency of 0.01 Hz (|Z| 0.01Hz) was regarded as a semi-quantitative indicator of the coatings barrier performance [38,39]. The Bode plots of pure WPU showed a high |Z| 0.01Hz value (1.68 × 10⁷ Ω·cm2) at the initial immersion. However, the |Z| 0.01Hz value of pure WPU gradually decreased to 7.42 × 10⁶ Ω·cm2 after 30 days of immersion, which indicated that the penetration of the corrosive solution caused the coating to lose efficacy. For the 0.5 wt.% GO/WPU coating specimen, its impedance modulus was much lower than pure WPU and failed to protect metal from corrosion after five days of immersion. It was observed that the coating with 1.0 wt.% PVSQ-GO composite exhibited a higher |Z| 0.01Hz value than the 0.5 wt.% PVSQ-GO/WPU coating at the onset of immersion. This was because more fillers could prevent water molecules from penetrating into the coating, but the impedance modulus declined quickly after 10 days of immersion. In all immersion times, the 0.5 wt.% PVSQ-GO/WPU coating specimen maintained a higher |Z| 0.01Hz value which indicated its optimal protection behavior. From the Nyquist plots, all coatings exhibited a shrinkage capacitance loop during immersion time, indicating the declining corrosion resistance of coatings [40]. Generally, larger capacitive arcs and diameters of a coating system denoted superior protective performance. The 0.5 wt.% PVSQ-GO/WPU coating specimen exhibited a large capacitive arc radius during all immersion times, which was owed to the good barrier performance of the PVSQ-GO composite in the WPU matrix.
To further investigate the anti-corrosive performance of coating specimens, EIS date were fitted with ZSimDemo3.30d software, and the corresponding equivalent electrical circuits were displayed on Figure 11. In the equivalent electrical circuit, Rs, Rc, Qc, Rct and Qdl were used to represent the solution resistance, coating resistance, coating capacitance, charge transfer resistance and double-layer capacitance, respectively. Warburg impedance element (Zw) represented the diffusion process of the electrolyte solution through the coating, resulting in the increase of the cathodic reaction [41]. In the initial immersion time, the corrosive solution had not penetrated the coating system yet, and the corresponding equivalent electrical circuit is shown in Figure 11a. With the penetration of the corrosive solution into the interface between coating and substrate, corrosion began to occur (Figure 11b). Owing to the existence of impermeable graphene nanosheets, the transfer procedure of corrosive solution in the coating system became the control step, the circuit is shown in Figure 11c. In the ultimate immersion time, the coating system lost the protective effect, and the circuit is shown in Figure 11d.
Rc was used for evaluating the barrier performance of coating specimens [42]. In general, the Rc value of all coating specimens decreased with the prolongation of immersion time (Figure 12a). The 0.5 wt.% PVSQ-GO/WPU coating exhibited a superior Rp value when compared to other specimens during the test time, and its Rc value decreased from 7.652 × 10⁷ to 9.424 × 10⁶ Ω·cm2 after the immersion of 30 days. The Rc value was an order of the magnitude higher than the pure WPU coating. The Rct value indicated the corrosion resistance of the metal matrix [43]. The Rct appeared for the 0.5 wt.% PVSQ-GO/WPU coating when immersed at 10 days, and it maintained at approximately 7.326 × 10⁷ Ω·cm2 when the immersion time increased to 30 days, which suggested that the steel matrix was well protected by the WPU coating added 0.5 wt.% PVSQ-GO composite(Figure 12b).
The protective properties of composite coatings were also studied by the potentiodynamic polarization test, and the result is shown in Figure 13 and Table 2. The corrosion potential (Ecorr), the corrosion current density (Icorr), anodic Tafel lope (ba), and cathodic Tafel slope (bc) were calculated by Tafel extrapolation using electrochemical analysis software (CorrView-2). Generally speaking, the lower corrosion current density (Icorr) and higher corrosion potential (Ecorr) indicated coatings with better corrosion resistance. It was clearly shown that there was a negative shift in the trend of the Icorr from 2.404 × 10⁻⁷ A/cm2 for pure WPU coating towards 7.079 × 10⁻⁹ A/cm2 for 0.5 wt.% PVSQ-GO/WPU coating specimen which manifested the enhancement barrier performance of the PVSQ-GO composite.
The Rp of the coating was calculated based on the Stearn–Geary Equation [44];
R p = b a b c 2.303 b a + b c I corr
where, ba, bc, was the Tafel slope of anode and cathode, respectively.
The corrosion rate vcorr (mm/year) was calculated by the following Equation [45];
v corr mm / year = A I corr n ρ F × 87600
where A and ρ were the molecular weight and the density for Q235 steel, respectively. The corrosion reaction of iron would release two electrons and the chemical valence (n) is 2; and F is the Faraday constant (F = 96,485 C/mol = 26.8 A·h).
The protection efficiency was calculated using the following equation:
PE % = I corr bare I corr I corr bare × 100 %
where I corr bare and I corr represent the corrosion current density of blank sample and coating samples. As shown in Table 2, the maximum Rp (5.86 × 10⁵ Ω·cm2) could be observed in 0.5 wt.% PVSQ-GO/WPU compared with other coating specimen. All the protection efficiency (PE) values of the coating specimens were much higher than 95% and it was noted that the PE% of 0.5 wt.% PVSQ-GO/WPU (99.9%) was the highest, which might be ascribed to the well-dispersed PVSQ-GO composite in coating matrix that increased the tortuosity of the diffusion path for corrosive medium penetrating into the interface of the substrate and coating. The corrosion rate of bare steel exhibited an extremely high value of 0.921 mm/year. After incorporating 0.5 wt.% PVSQ-GO composite, the corrosion rate reduced to 8.96 × 10⁻⁵ mm/year, it was two orders of magnitude lower than pure WPU. The corrosion rate (vcorr) was consistent with the result of protection efficiency (PE) and polarization resistance (Rp).
In order to verify the corrosion resistance of the composite coatings, a neutral salt spray test was carried out and the failure process of the composite coatings was studied. The neutral salt spray test was a usual method to test the accelerated corrosion resistance of coatings. The as-prepared coating specimens were exposed in a salt-fog chamber with continuous spray (5 wt.% NaCl solution, pH ≈ 7), and the spray ambient temperature was kept at 40 ± 2 °C. Figure 14 shows the photographs of coating specimens immersed in salt spray chambers for different exposure times. For pure WPU, red rust appeared near the scratch of the coating after 24 h of exposure. With the increase of the exposure time up to 200 h, the corrosion became more serious and a large quantity of red rust accumulated near the scratch area. This phenomenon was attributed to the penetration of corrosive medium through scratches and micropores into the coating matrix, which indicated the poor barrier properties of pure WPU coatings. For 0.5 wt.% GO/WPU specimen, there were obvious rust near the scratch area, and the undamaged area was covered with plenty of blistering during all exposure time. This could be explained as the hydrophilicity of graphene oxide which could induce the penetration of water molecule into the interface of the coating/metal substrate. However, almost no obvious rust was observed after 24 exposure time for 0.5 wt.% PVSQ-GO/WPU specimen and 1.0 wt.% PVSQ-GO/WPU specimen. At the ultimate exposure time, the specimen contained 1.0 wt.% PVSQ-GO composite corroded more seriously than 0.5 wt.% PVSQ-GO/WPU specimen and the corrosive area spreads from scratches area to the undamaged area. This is because agglomerated graphene accelerated the corrosion process. The 0.5 wt.% PVSQ-GO/WPU coating specimen showed better anti-corrosive performance among these specimens, the hydrophobicity of PVSQ-GO composite inhibited the penetration of corrosive media. The graphene nanosheets with good dispersion in organic polymer matrix could also effectively improve the barrier properties of the coatings.
Based on the above analysis results, the possible anticorrosion mechanism of composite coating was shown by a schematic drawing in Figure 15. In terms of the pure WPU coating, the corrosive medium quickly passes through the defects and pores in the coating formed by solvent evaporation during the coating curing process, and the corrosion of the substrate happened when the corrosive medium reached the coating/substrate interface. For the 0.5 wt.% GO/WPU coating, hydrophilic graphene oxide promotes the penetration of water molecules into the interior, thus it accelerated the corrosion of the metal substrate. In case of the 0.5 wt.% PVSQ-GO/WPU, the improvement of corrosion resistance could be attributed to the following reasons: (1) Because of the impermeability of graphene to small molecules, it would provide a tortuous pathway for the penetration of corrosive media; (2) the well-dispersed PVSQ-GO composite could improve the integrity of coatings by blocking defects and pores; and (3) the hydrophobic PVSQ-GO composite inhibited the penetration of water molecules, thus delaying the corrosion process of metal substrate.

4. Conclusions

In summary, we have successfully synthesized novel silane functionalized graphene oxide composite material through the hydrolysis and condensation reaction. The chemical structure and morphology of the as-prepared PVSQ-GO composite was confirmed by FTIR, Raman, XPS, XRD and TGA measurement. Further, the as-prepared PVSQ-GO composite presented a hydrophobic nature and showed good dispersion after being incorporated into waterborne polyurethane coating. The anti-corrosion performance of composite coating was evaluated by electrochemical impedance spectroscopy, Tafel curves and neutral salt spray test. The results showed that the composite coating incorporated with 0.5 wt.% PVSQ-GO composite possessed superior anti-corrosion abilities. Meanwhile, the adhesion strength and hardness of the composite coating increased in an obvious way. Furthermore, the anti-corrosion mechanism was also discussed. The superior anti-corrosion performance might originate from impermeable graphene sheets prolonged by the permeation path of the corrosive medium and good compatibility between the hydrophobic PVSQ-GO composite and the waterborne polyurethane matrix.

Author Contributions

Data curation, C.C.; Formal analysis, B.X. and Y.Y.; Funding acquisition, S.W.; Investigation, Y.L.; Methodology, C.C.; Resources, Y.W.; Writing—original draft, C.C.; Writing—review & editing, B.W.

Funding

This research was funded by the National Natural Science Foundation of China (Project Nos. 51675533, 51701238 and 51605455) and China Postdoctoral Science Foundation Funded Projects (2018M643857).

Conflicts of Interest

The authors declare no conflict of interests.

References

  1. Balandin, A.A.; Ghosh, S.; Bao, W.; Calizo, I.; Teweldebrhan, D.; Miao, F.; Lau, C.N. Superior thermal conductivity of single-layer grapheme. Nano Lett. 2008, 8, 902–907. [Google Scholar] [CrossRef] [PubMed]
  2. Canal-Rodríguez, M.; Arenillas, A.A.; Rey-Raap, N.; Ramos-Fernández, G.; MartínGullón, I.; Menéndez, J.A. Graphene-doped carbon xerogel combining high electrical conductivity and surface area for optimized aqueous supercapacitors. Carbon 2017, 118, 291–298. [Google Scholar] [CrossRef] [Green Version]
  3. Wen, S.; Wang, Z.; Zheng, X.; Wang, X. Improved mechanical strength of porous chitosan scaffold by graphene coatings. Mater. Lett. 2017, 186, 17–20. [Google Scholar] [CrossRef]
  4. Dong, B.; Yuan, Y.; Luo, J.; Dong, L.; Liu, R.; Liu, X. Acryloyl-group functionalized graphene for enhancing thermal and mechanical properties of acrylated epoxidized soybean oil UV-curable based coatings. Prog. Org. Coat. 2018, 118, 57–65. [Google Scholar] [CrossRef]
  5. Suk, J.W.; Piner, R.D.; An, J.; Ruoff, R.S. Mechanical properties of monolayer graphene oxide. ACS Nano 2010, 4, 6557–6564. [Google Scholar] [CrossRef]
  6. Chang, K.C.; Hsu, M.H.; Lu, H.I.; Lai, M.C.; Liu, P.J.; Hsu, C.H.; Ji, W.F.; Chuang, T.L.; Wei, Y.; Yeh, J.M.; et al. Room temperature cured hydrophobic epoxy/graphene composites as corrosion inhibitor for coldrolled steel. Carbon 2014, 6, 144–153. [Google Scholar] [CrossRef]
  7. Zhou, F.; Li, Z.T.; Shenoy, G.J.; Li, L.; Liu, H.T. Enhanced room-temperature corrosion of copper in the presence of grapheme. ACS Nano 2013, 7, 6939–6947. [Google Scholar] [CrossRef]
  8. Sahu, S.C.; Samantara, A.K.; Seth, M.; Parwaiz, S.; Singh, B.P.; Rath, P.C.; Jena, B.K. A facile electrochemical approach for development of highly corrosion protective coatings using graphene nanosheets. Electrochem. Commun. 2013, 32, 22–26. [Google Scholar] [CrossRef]
  9. Li, X.; Zhu, Y.; Cai, W.; Borysiak, M.; Han, B.; Chen, D.; Piner, R.D.; Colombo, L.; Ruoff, R.S. Transfer of large-area graphene films for high-performance transparent conductive electrodes. Nano Lett. 2009, 9, 4359. [Google Scholar] [CrossRef]
  10. Giovannetti, G.; Khomyakov, P.A.; Brocks, G.; Karpan, V.M.; Van den, B.J.; Kelly, P.J. Doping graphene with metal contacts. Phys. Rev. Lett. 2008, 101, 026803. [Google Scholar] [CrossRef]
  11. Pu, N.W.; Shi, G.N.; Liu, Y.M.; Sun, X.; Chang, J.K.; Sun, C.L.; Ger, M.D.; Chen, C.Y.; Wang, P.C.; Peng, Y.Y. Graphene grown on stainless steel as a high performance and ecofriendly anti-corrosion coating for polymer electrolyte membrane fuel cell bipolar plates. J. Power Sources 2015, 282, 248–256. [Google Scholar] [CrossRef]
  12. Prasai, D.; Tuberquia, J.C.; Harl, R.R.; Jennings, G.K. Graphene: Corrosion-inhibiting coating. ACS Nano 2012, 6, 1102–1108. [Google Scholar] [CrossRef] [PubMed]
  13. Schriver, M.; Regan, W.; Gannett, W.J.; Zaniewski, A.M.; Crommie, M.F.; Zettl, A. Graphene as a long-term metal oxidation barrier: Worse than nothing. ACS Nano 2013, 7, 5763–5768. [Google Scholar] [CrossRef] [PubMed]
  14. Lee, J.; Berman, D. Inhibitor or promoter: Insights on the corrosion evolution in a graphene protected surface. Carbon 2018, 126, 225–231. [Google Scholar] [CrossRef]
  15. Jo, M.; Lee, H.C.; Lee, S.G.; Cho, K. Graphene as a metal passivation layer: Corrosion-accelerator and inhibitor. Carbon 2017, 116, 232–239. [Google Scholar] [CrossRef]
  16. Chang, C.H.; Huang, T.C.; Peng, C.W.; Yeh, T.C.; Lu, H.I.; Hung, W.I.; Weng, C.J.; Yang, T.I.; Yeh, J.M. Novel anticorrosion coatings prepared from polyaniline/graphene composites. Carbon 2012, 50, 5044–5051. [Google Scholar] [CrossRef]
  17. Chang, K.C.; Ji, W.F.; Lai, M.C.; Hsiao, Y.R.; Hsu, C.H.; Chuang, T.L.; Wei, Y.; Yeh, J.M.; Liu, W.R. Correction: Synergistic effects of hydrophobicity and gas barrier properties on the anticorrosion property of PMMA nanocomposite coatings embedded with graphene nanosheets. Polym. Chem. 2014, 5, 6865. [Google Scholar] [CrossRef]
  18. Sun, W.; Wang, L.; Wu, T.; Wang, M.; Yang, Z.; Pan, Y.; Liu, G. Inhibiting the corrosion-promotion activity of graphene. Chem. Mater. 2015, 27, 2367–2373. [Google Scholar] [CrossRef]
  19. Sun, W.; Wang, L.; Wu, T.; Dong, C.; Liu, G. Tuning the functionalization degree of graphene: Determining critical conditions for inhibiting the corrosion promotion activity of graphene/epoxy nanocomposite coatings. Mater. Lett. 2019, 240, 262–266. [Google Scholar] [CrossRef]
  20. Liu, J.; Yu, Q.; Yu, M.; Li, S.; Zhao, K.; Xue, B.; Zu, H. Silane modification of titanium dioxide-decorated graphene oxide nanocomposite for enhancing anticorrosion performance of epoxy coatings on AA-2024. J. Alloy. Compd. 2018, 744, 728–739. [Google Scholar] [CrossRef]
  21. Zhang, L.; Wu, H.; Wei, M.; Zheng, Z.; Vu, D.D.; Bui, T.T.; Huang, X. Preparation, characterization, and properties of graphene oxide/urushiol-formaldehyde polymer composite coating. J. Coat. Technol. Res. 2018, 15, 1343–1356. [Google Scholar] [CrossRef] [Green Version]
  22. Wu, Z.J.; Xiang, H.; Kim, T.; Chun, M.S.; Lee, K. Surface properties of submicrometer silica spheres modified with aminopropyltriethoxysilane and phenyltriethoxysilane. J. Colloid Interface Sci. 2006, 304, 119–124. [Google Scholar] [CrossRef] [PubMed]
  23. Reza-E-Rabby, M.; Jeelani, S.; Rangari, V.K. Structural Analysis of Polyhedral Oligomeric Silsesquioxane Coated SiC Nanoparticles and Their Applications in Thermoset Polymers. J. Nanomater. 2015, 2015, 894856. [Google Scholar] [CrossRef]
  24. Yadav, S.K.; Mahapatra, S.S.; Yoo, H.J.; Cho, J.W. Synthesis of multi-walled carbon nanotube/polyhedral oligomeric silsesquioxane nanohybrid by utilizing click chemistry. Nanoscale Res. Lett. 2011, 6, 122. [Google Scholar] [CrossRef] [PubMed]
  25. Xue, Y.; Liu, Y.; Lu, F.; Qu, J.; Chen, H.; Dai, L. Functionalization of graphene oxide with polyhedral oligomeric silsesquioxane (POSS) for multifunctional applications. J. Phys. Chem. Lett. 2012, 3, 1607–1612. [Google Scholar] [CrossRef]
  26. Naderizadeh, S.; Athanassiou, A.; Bayer, I.S. Interfacing superhydrophobic silica nanoparticle films with graphene and thermoplastic polyurethane for wear/abrasion resistance. J. Colloid Interface Sci. 2018, 519, 285–295. [Google Scholar] [CrossRef] [PubMed]
  27. ASTM B117 Standard Practice for Operating Salt Spray (Fog) Apparatus; ASTM International: West Conshohocken, PA, USA, 2018; Volume 03.02.
  28. Kaminska, I.; Das, M.R.; Coffinier, Y.; Niedziolka-Jonsson, J.; Sobczak, J.; Woisel, P.; Lyskawa, J.; Opallo, M.; Boukherroub, R.; Szunerits, S. Reduction and functionalization of graphene oxide sheets using biomimetic dopamine derivatives in one step. ACS Appl. Mater. Interfaces 2012, 4, 1016–1020. [Google Scholar] [CrossRef]
  29. Das, A.K.; Srivastav, M.; Layek, R.K.; Uddin, M.E.; Jung, D.; Kim, N.H.; Lee, J.H. Iodide-mediated room temperature reduction of graphene oxide: A rapid chemical route for the synthesis of a bifunctional electrocatalyst. J. Mater. Chem. A 2014, 2, 1332–1340. [Google Scholar] [CrossRef]
  30. Stankovich, S.; Dikin, D.A.; Piner, R.D.; Kohlhaas, K.A.; Kleinhammes, A.; Jia, Y.; Wu, Y.; Nguyen, S.T.; Ruoff, R.S. Synthesis of graphene-based nanosheets via chemical reduction of exfoliated graphite oxide. Carbon 2007, 45, 1558–1565. [Google Scholar] [CrossRef]
  31. Ramezanzadeh, B.; Ahmadi, A.; Mahdavian, M. Enhancement of the corrosion protection performance and cathodic delamination resistance of epoxy coating through treatment of steel substrate by a novel nanometric sol-gel based silane composite film filled with functionalized graphene oxide nanosheets. Corros. Sci. 2016, 109, 182–205. [Google Scholar] [CrossRef]
  32. Yu, Z.; Lv, L.; Ma, Y.; Di, H.; He, Y. Covalent modification of graphene oxide by metronidazole for reinforced anti-corrosion properties of epoxy coatings. RSC Adv. 2016, 6, 18217–18226. [Google Scholar] [CrossRef]
  33. Li, Z.; Wang, R.; Young, R.J.; Deng, L.; Yang, F.; Hao, L.; Jiao, W.; Liu, W. Control of the functionality of graphene oxide for its application in epoxy nanocomposites. Polymer 2013, 54, 6437–6446. [Google Scholar] [CrossRef]
  34. Deshpande, R.R.; Eckert, H. Sol-gel preparation of mesoporous sodium aluminosilicate glasses: Mechanistic and structural investigation by solid state nuclear magnetic resonance. J. Mater. Chem. 2009, 19, 3419–3426. [Google Scholar] [CrossRef]
  35. Nguyen, T.; Hubbard, J.B.; Mcfadden, G.B.A. Mathematical model for the cathodic blistering of organic coatings on steel immersed in electrolytes. J. Coat. Technol. 1982, 54, 693–695. [Google Scholar]
  36. Cui, Z.; Liu, Z.; Wang, L.; Li, X.; Du, C.; Wang, X. Effect of plastic deformation on the electrochemical and stress corrosion cracking behavior of X70 steel in near-neutral pH environment. Mater. Sci. Eng. 2016, 677, 259–273. [Google Scholar] [CrossRef]
  37. Zhou, L.; Liu, Z.; Wu, W.; Li, X.; Du, C.; Jiang, B. Stress corrosion cracking behavior of ZK60 magnesium alloy under different conditions. Int. J. Hydrog. Energy 2017, 42, 2662–2674. [Google Scholar] [CrossRef]
  38. Hinderliter, B.R.; Croll, S.G.; Tallman, D.E.; Su, Q.; Bierwagen, G.P. Interpretation of EIS data from accelerated exposure of coated metals based on modeling of coating physical properties. Electrochim. Acta 2006, 51, 4505–4515. [Google Scholar] [CrossRef]
  39. Sarkar, N.; Sahoo, G.; Das, R.; Prusty, G.; Sahu, D.; Swain, S.K. Anticorrosion performance of three-dimensional hierarchical PANI@BN nanohybrids. Ind. Eng. Chem. Res. 2016, 55, 2921–2931. [Google Scholar] [CrossRef]
  40. Li, J.; Cui, J.; Yang, J.; Li, Y.; Qiu, H.; Yang, J. Reinforcement of graphene and its derivatives on the anticorrosive properties of waterborne polyurethane coatings. Compos. Sci. Technol. 2016, 129, 30–37. [Google Scholar] [CrossRef]
  41. Cano, E.; Lafuente, D.; Bastidas, D.M. Use of EIS for the evaluation of the protective properties of coatings for metallic cultural heritage: A review. J. Solid State Electrochem. 2010, 14, 381–391. [Google Scholar] [CrossRef]
  42. Visser, P.; Meeusen, M.; Garcia, Y.G.; Terryn, H.; Mol, J.M.C. Electrochemical evaluation of corrosion inhibiting layers formed in a defect from lithium-leaching organic coatings. J. Electrochem. Soc. 2017, 164, 396–406. [Google Scholar] [CrossRef]
  43. Visser, P.; Garcia, Y.G.; Mol, J.M.C.; Terryn, H. Mechanism of passive layer formation on AA2024-T3 from alkaline lithium carbonate solutions in the presence of sodium chloride. J. Electrochem. Soc. 2018, 165, 60–70. [Google Scholar] [CrossRef]
  44. Huang, T.C.; Su, Y.A.; Yeh, T.C.; Huang, H.Y.; Wu, C.P.; Huang, K.Y.; Chou, Y.C.; Yeh, J.M.; Wei, Y. Advanced anticorrosive coatings prepared from electroactive epoxy-SiO2 hybrid nanocomposite materials. Electrochim. Acta 2011, 56, 6142–6149. [Google Scholar] [CrossRef]
  45. Yeh, T.C.; Huang, T.C.; Huang, H.Y.; Huang, Y.P.; Cai, Y.T.; Lin, S.T.; Wei, Y.; Yeh, J.M. Electrochemical investigations on anticorrosive and electrochromic properties of electroactive polyurea. Polym. Chem. 2012, 3, 2209–2216. [Google Scholar] [CrossRef]
Figure 1. FTIR spectra of pure waterborne polyurethane.
Coatings 09 00587 g001
Scheme 1. The detail schematic procedure of silane functionalized graphene.
Coatings 09 00587 sch001
Figure 2. Optical photographs of graphene oxide (GO) and silane functionalized graphene oxide (PVSQ-GO) dispersions after 24 h. (a) just ultrasonication for 30 min; (b) storage for 24 h.
Coatings 09 00587 g002
Figure 3. (a) FTIR, (b) XRD patterns, (c) Raman spectra, (d) TGA curves of GO and PVSQ-GO. (e,f) Survey X-ray photoelectronic spectroscopy (XPS) spectra of GO and PVSQ-GO, (g,h) C 1s and N 1s spectrum of PVSQ-GO.
Coatings 09 00587 g003
Figure 4. (a,b) SEM and contact angle of GO and PVSQ-GO; (c,d) TEM of GO and PVSQ-GO; (e,f) atomic force microscope (AFM) image of GO and PVSQ-GO; (e1,f1) thickness of GO and PVSQ-GO.
Coatings 09 00587 g004
Scheme 2. The schematic diagram of the reaction mechanism of synthesizing silane functionalized graphene.
Coatings 09 00587 sch002
Figure 5. SEM images of surfaces and contact angle for (a1a4) pure WPU, (b1b4) 0.5 wt.% GO/WPU, (c1c4) 0.5 wt.% PVSQ-GO/WPU, and (d1d4) 1.0 wt.% PVSQ-GO/WPU coatings.
Coatings 09 00587 g005
Figure 6. Cross-section morphology of all as-prepared coatings; (a1a3) pure waterborne polyurethane (WPU), (b1b3) 0.5 wt.% GO/WPU, (c1c3) 0.5 wt.% PVSQ-GO/WPU, and (d1d3) 1.0 wt.% PVSQ-GO/WPU.
Coatings 09 00587 g006
Figure 7. The EDS map scanning of surface (a) and cross-section (f) for 0.5 wt.% PVSQ-GO/WPU coating specimen, (b,g) C element, (c,h) O element, (d,i) N element, (e,j) Si element distribution.
Coatings 09 00587 g007
Figure 8. Adhesion strength (a) and hardness (b) of all as-prepared coating specimens.
Coatings 09 00587 g008
Figure 9. Evolution of open circuit potential (OCP) value for the coating specimens with continuous immersion.
Coatings 09 00587 g009
Figure 10. Nyquist and Bode plots of the specimens with different coatings. (a) Pure WPU, (b) 0.5 wt.% GO/WPU, (c) 0.5 wt.% PVSQ-GO/WPU, and (d) 1.0 wt.% PVSQ-GO/WPU.
Coatings 09 00587 g010
Figure 11. Electrical equivalent circuit models for composite coatings. (a) initial immersion, (b,c) midterm immersion, (d) coating lose efficacy.
Coatings 09 00587 g011
Figure 12. Variation of the electrical parameters (a) Rc, (b) Rct obtained from the fitting results for different coating systems at various immersion times under 3.5% NaCl solution.
Coatings 09 00587 g012
Figure 13. Tafel curves of bare substrate and bare substrate with coatings.
Coatings 09 00587 g013
Figure 14. The pictures of different coating systems (a) pure WPU, (b) 0.5 wt.% GO/WPU, (c) 0.5 wt.% PVSQ-GO/WPU, and (d) 1.0 wt.% PVSQ-GO/WPU immersed in salt spray chamber after 200 h.
Coatings 09 00587 g014
Figure 15. The possible corrosion protection mechanism of pure WPU (a), GO/WPU (b), and PVSQ-GO/WPU (c) composite coatings.
Coatings 09 00587 g015
Table 1. The chemical composition of the Q235 steel specimen.
ElementsFeCMnSiSP
Content (wt.%)99.030.160.420.300.0500.045
Table 2. Potentiodynamic polarization parameter values for coated Q235 metal.
SampleEcorr (V)Icorr (A/cm2)ba (mV/dec)bc (mV/dec)Rp (Ω·cm2)IE (%)vcorr (mm/year)
Bare steel−0.7917.921 × 10−5143.46−198.254.56 × 1020.921
Pure WPU−0.6142.404 × 10−7246.74−180.311.88 × 10599.692.79 × 10−3
0.5 wt.% GO/WPU−0.5394.366 × 10−7194.64−236.841.06 × 10599.445.07 × 10−3
0.5 wt.% PVSQ-GO/WPU−0.3257.079 × 10−9233.41−160.395.83 × 10699.998.96 × 10−5
1.0 wt.% PVSQ-GO/WPU−0.4424.875 × 10−8216.25−184.568.87 × 10599.935.76 × 10−4

