Article

Influence of TiO2 Additives on Cavitation Erosion Resistance of Al-Mg Alloy Micro-Arc Oxidation Coating

1
School of Mechatronic and Power Engineering, Zhangjiagang Campus, Jiangsu University of Science and Technology, Zhenjiang 212003, China
2
School of Mechanical Engineering, Tongji University, Shanghai 201804, China
3
Jiangsu Key Laboratory of Advanced Food Manufacturing Equipment and Technology, Jiangnan University, Wuxi 214122, China
4
School of Mechanical Engineering, Jiangnan University, Wuxi 214122, China
*
Author to whom correspondence should be addressed.
Coatings 2019, 9(8), 521; https://doi.org/10.3390/coatings9080521
Submission received: 12 July 2019 / Revised: 10 August 2019 / Accepted: 12 August 2019 / Published: 16 August 2019

Abstract

:
Four ceramic coatings are fabricated on 6061 aluminum alloy substrates with a micro-arc oxidation technique in silicate electrolytes with different TiO2 nano-additive concentrations. To explore the cavitation erosion resistance of the micro-arc oxidation (MAO) coating, cavitation tests are performed using a vibratory test rig. After cavitation tests lasting 10 min, the mass losses, surface morphologies, and chemical compositions of the samples after cavitation tests are examined using a digital balance, scanning electron microscopy (SEM), and energy dispersive spectroscopy (EDS), respectively. The results indicate that, in contrast to the aluminum alloy, the MAO coatings, by adjusting TiO2 nano-additive concentration, can decrease the mean depth of erosion rate (MDER) due to the cavitation damage, and lead to an excellent cavitation erosion resistance. The results also show that: In contrast to aluminum alloy, MAO coatings can decrease the MDER due to the cavitation damage in a short period of time by adjusting TiO2 nano-additive concentration. With the increase of TiO2 nano-additive concentration, the compactness and the surface hardness of MAO coatings decrease, which can easily lead to larger erosion pits.

1. Introduction

Aluminium magnesium alloy, with low density, high strength [1] and a good corrosion resistance [2], receives significant attention in hydraulic machinery, such as ships, pumps and valves. In these flowing systems, however, cavitation can occur if the pressure at any location falls below the vapor pressure of the liquid at the operating temperature. The resulting vapor bubbles or cavities are transported by the flow and subsequently collapse when the pressure recovers to a value above the vapor pressure. If the bubbles collapse adjacent to the solid material surface, it can result in pitting or erosion of the surface and component failure [3,4]. In particular, the dealloying process of Al under the cavitation exposure also has an influence on cavitation erosion resistance [5].
The protection of aluminum alloys by applying micro-arc oxidation (MAO) coatings is currently of a great interest [6,7,8]. With the introduction of hard ceramic coatings by means of micro-arc oxidation, the wear resistance, corrosion resistance, cavitation erosion resistance, and electrical insulation of the metals were increased [9,10,11,12,13]. In recent years, nanometer-TiO2 or nanometer-SiO2 as additives were incorporated into coatings or greases, which improved the wear resistance of the protective film [14,15]. Furthermore, ceramic coatings were fabricated on aluminum alloy substrates by MAO in silicate electrolytes doped with different concentrations of the TiO2 nano-additive. When increasing the nano-additive TiO2 concentration to 3.2 g/L, the adhesion value increased, while mean friction coefficient and mass loss decreased [16]. Nevertheless, there is little research work on their cavitation erosion resistance, and in particular, the influence of nano-additives on performance of MAO coatings. In light of this, the main aim of the current work is to (a) investigate effects of TiO2 additives on cavitation erosion resistance of Al-Mg alloy micro-arc oxidation coating by a vibratory test rig, and (b) attempt to reveal the cause of these effects by surface analyses.

2. Experiment Details

2.1. Material Preparation

The 6061 aluminum alloy was used as the specimen substrate. The surface of the specimen, with dimensions of 35 mm × 35 mm × 4 mm, was successively polished by fine emery papers down to 5000 grit, which provided the surface roughness of Ra < 0.2 μm. All the specimens were cleaned with acetone in an ultrasonic cleaner and dried in the air before cavitation erosion tests. The specimen’s chemical composition, given in Table 1, was analyzed by an energy dispersive spectroscopy (EDS) system (GENESIS2000XMS60, EDAX Inc., Pheonix, AZ, USA).

2.2. Micro-Arc Oxidation Treatment

The electrolyte was a dilute aqueous solution of 5 g/L NaOH, 10 g/L Na2SiO3, and 0.5 g/L KF. Rutile TiO2 nano-additive with a size of about 20 nm was dispersed evenly in the solution, and the concentration of nano-additives was in a range of 0.0–9.0 g/L. The electrolyte was agitated with a mechanical stirrer. A five liter bath made of stainless-steel was used. The samples and the wall of the stainless-steel bath were used as the anode and the cathode respectively. The power supply was pulsed DC MAO equipment (DSM30F, Harbin Di Si CNC Equipment Co. LTD, Harbin, China) with a maximum voltage amplitude of 1000 V. During the MAO process, the current density was fixed at 5 A/dm2 by controlling the voltage amplitude, the pulse width was 2500 µs. The system was cooled by cold water pumped through the double walls of the bath, and the solution temperature was kept at 25–30 °C throughout the oxidation process. According to different concentration of nano-additives, 0.0, 3.0, 6.0, and 9.0 g/L, four MAO coatings were prepared on the top of samples and were labeled MAO-1, MAO-2, MAO-3, and MAO-4, respectively. In the study, the four MAO coatings prepared were further ground with the SiC paper, and the polished inner layers with a thickness of 10 μm respectively were left before tests. Then the micro hardness of thick oxide coatings was evaluated by means of an HV-1000 hardness tester (Shanghai JuHui Instrument Manufacturing Co. LTD, Shanghai, China) with a Vicker indenter at a load of 25 g and for a loading duration of 5 s. The detailed process parameters employed in this study are listed in Table 2. As shown in Table 2, the hardness of MAO coatings increased and then decreased with TiO2 addition to coating, and reached a higher value of 1000 HV as the nano-additive concentration was 3.0 g/L. However, as the TiO2 concentration is higher than 3.0 g/L, the decreasing hardness value may be caused by too much TiO2 nano-additive incorporation since the hardness of ceramic Al2O3 is lower than that of TiO2.

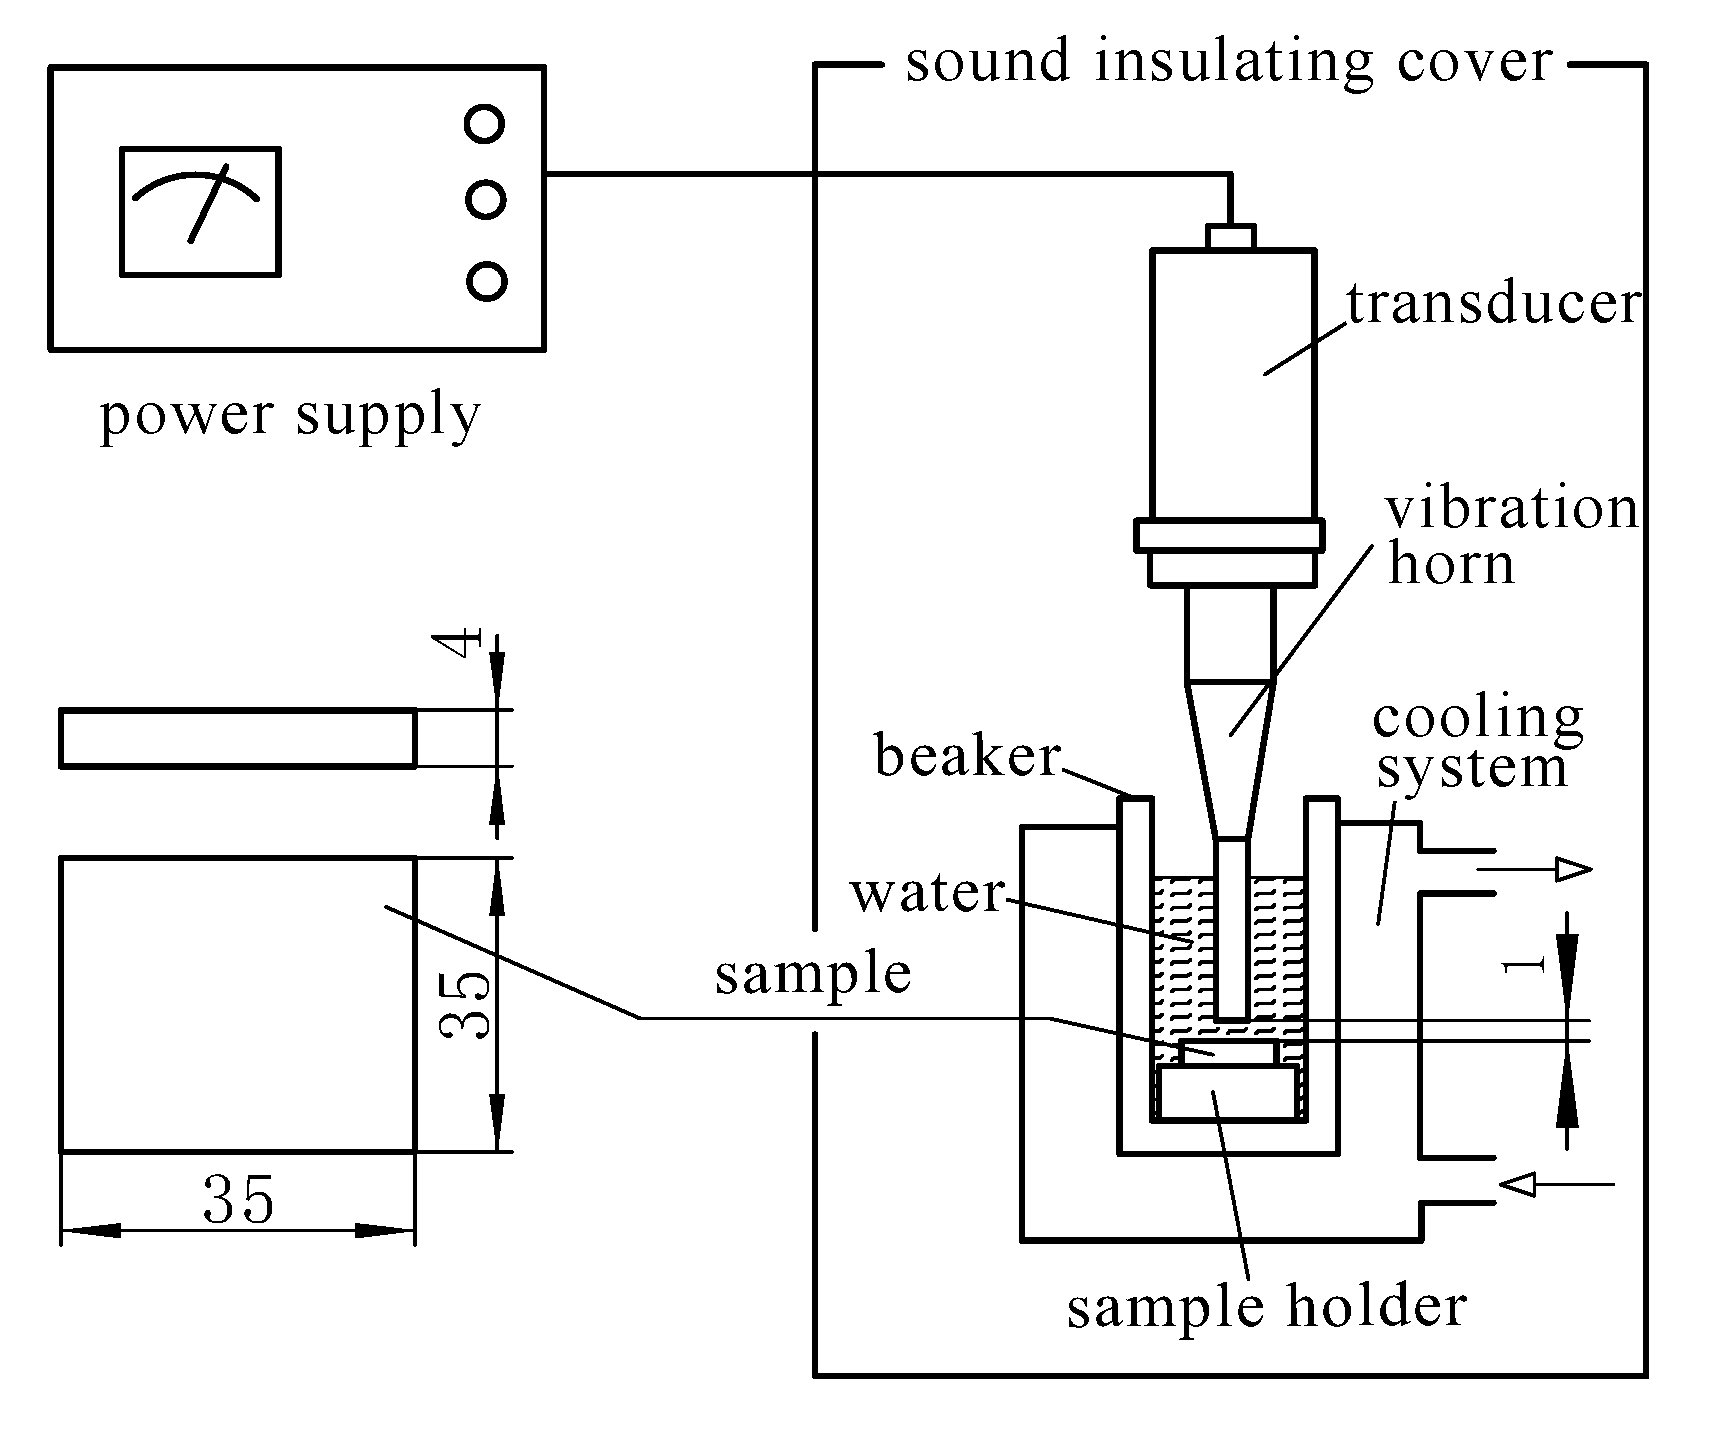
2.3. Test Procedures

Cavitation was produced in tap water by a vibratory test rig illustrated in Figure 1, according to ASTM-G32 [17]. The test rig consists of a quartz transducer, a vibration horn, a cooling system, a power supply, a sample holder, and a beaker with tap water. The specimen was fixed on the sample holder and immersed in water. The distance between the sample and the horn bottom was 1 mm so as to cause cavitation erosion. The test rig was operated at a frequency of 20 ± 0.5 kHz and 1 kW power with a vibration amplitude of 20 μm to produce ultrasonic cavitation. Since the test water temperature markedly affects the degree of cavitation erosion, the temperature of tap water was kept within 24 ± 2 °C by a circulating cooling water system. Before or after each test, the samples were cleaned with acetone in an ultrasonic cleaner, dried in air, and weighed separately. All reported results were the average values of at least three instances of weighing. After a duration of 10 min in the cavitating condition, the detailed features (pit morphology) of the sample surfaces were examined by the JSM-6360LV scanning electron microscope (SEM, JEOL, Tokyo, Japan), and the chemical elements of the individual damaged surfaces of the samples were further analyzed by the EDS system (GENESIS2000XMS60).
Furthermore, as the density of Al is less than that of aluminum oxides, the erosion loss of materials is expressed in terms of the mean depth of erosion (MDE) and the mean depth of erosion rate (MDER) is calculated by the following equations:
MDE (μm) = (1000·Δm)/(ρ·π·r2)
and
MDER (μm/min) = (1000·Δm)/(ρ·π·r2·Δt)
where Δm is the mass loss in each time interval in g, ρ is the density of the sample surface layer (6061 alloy, 2780 Kg/m3, MAO coating, 3950 Kg/m3), r is the erosion radius of the sample (0.008 m), and Δt is the time interval in min. In actual calculation, the critical thickness of coverings is equal to 10 μm, shown in Table 2. As the MDE is less than 10 μm, ρ is equal to 3950 Kg/m3. Otherwise, ρ is equal to 2780 Kg/m3.

3. Results and Discussion
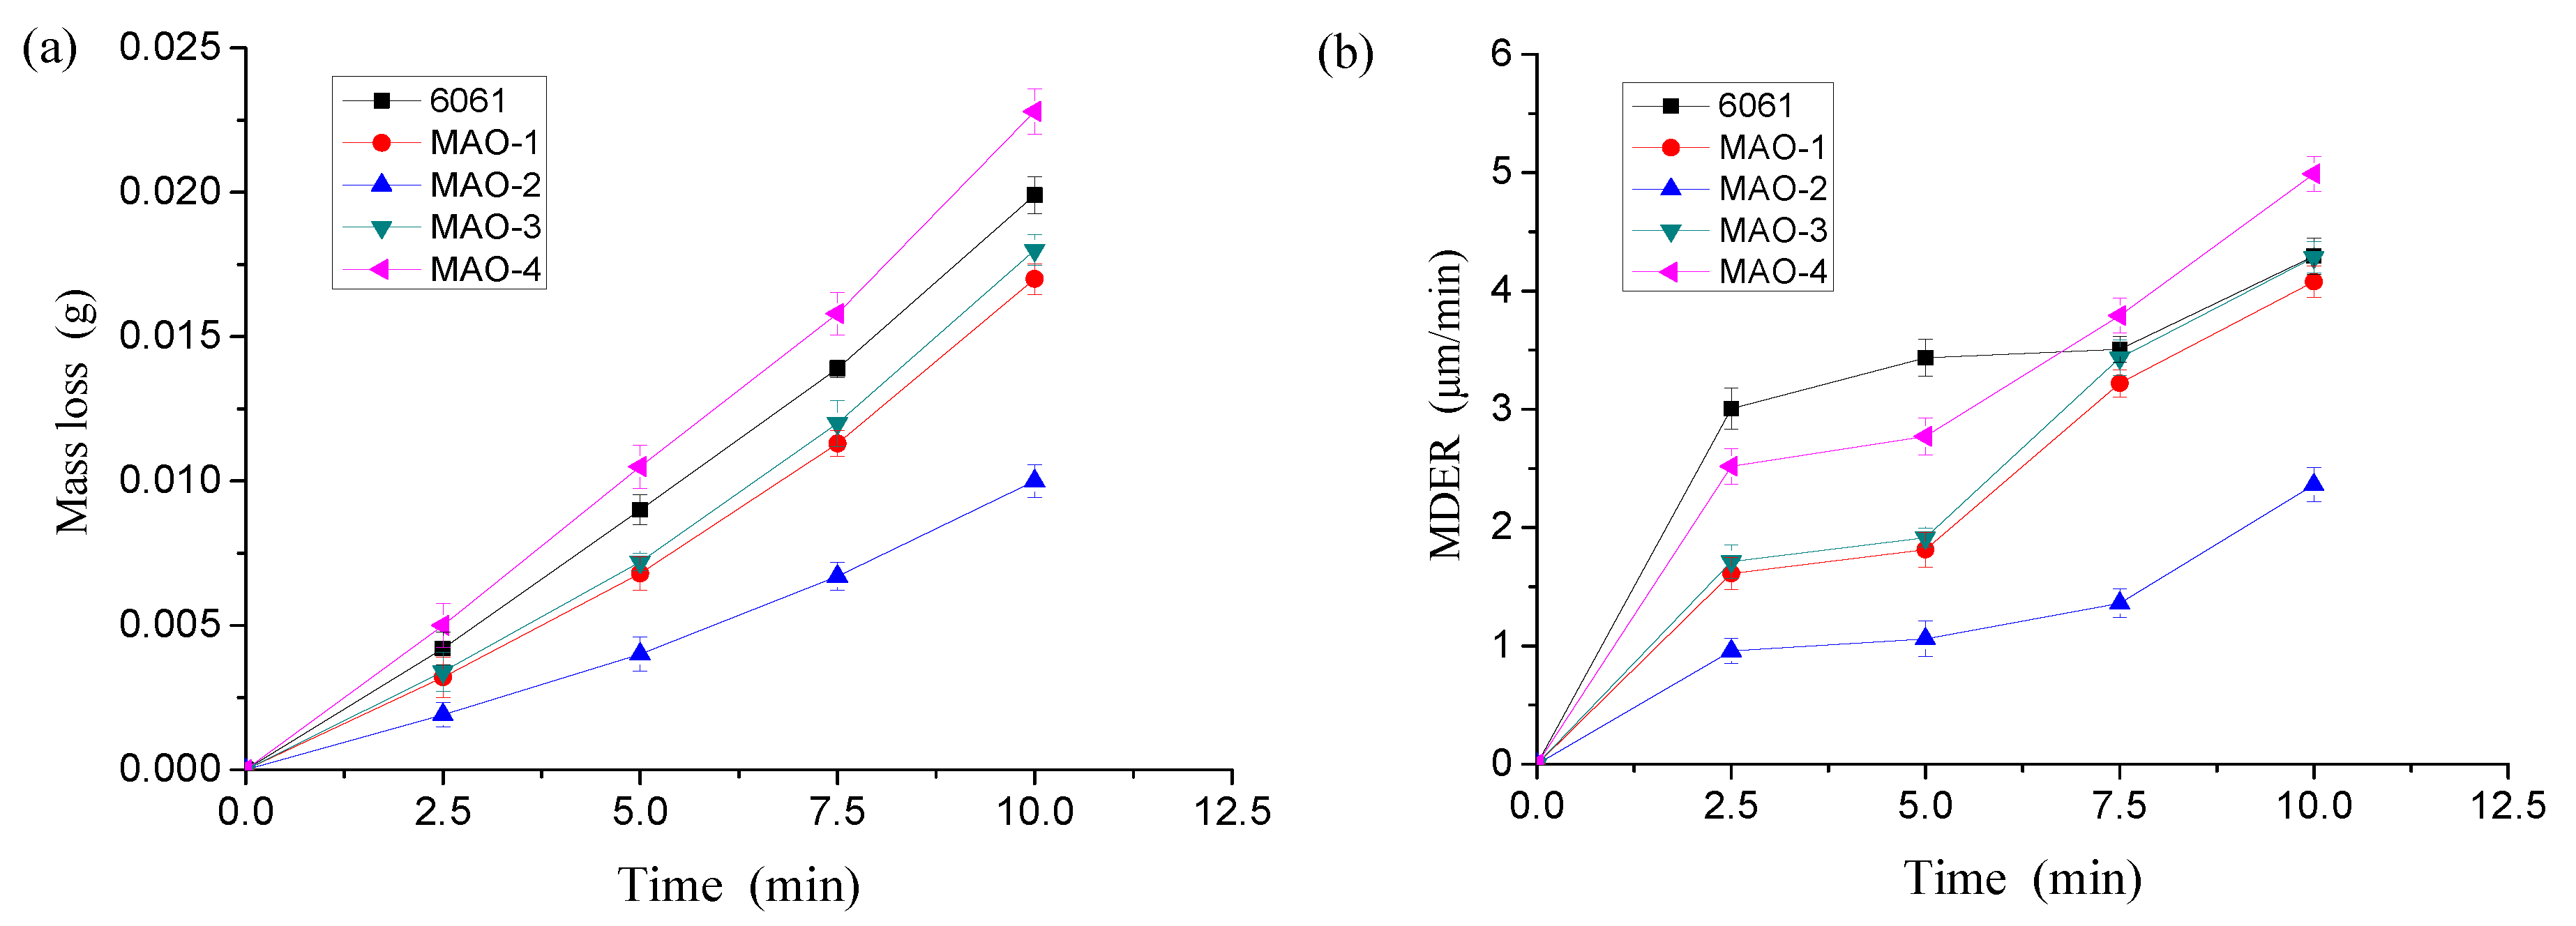
3.1. Mass Loss

Figure 2a shows the mass loss curves of the five specimens. As shown in Figure 2a, the mass loss of all four samples increased with the test time, which reflects the acceleration period. After the 10 min test, the MAO-4 has the greatest mass loss (22.8 mg), which is about 1.15 times greater than those of Al alloy specimens (19.9 mg). In contrast, the MAO-2 exhibits the lowest mass loss (10 mg), which decreases the mass loss by 49.7% compared to those of the Al specimen. In contrast, the mass losses of MAO-1 and MAO-3 are 17 and 18 mg respectively. It can be seen from Figure 2a that the incubation period is shorter and much less than 2.5 min under higher acoustic power of 1 KW. The results suggest that the applied layer has negligible anti-erosion properties. In addition, the MDER is an important parameter for the study of cavitation erosion resistance. It can be seen from Figure 2b that the MDER of the five samples all increase with the increase of time. The MDER of 6061, MAO-1, MAO-2, MAO-3, and MAO-4 are 3.01, 1.61, 0.96, 1.71, and 2.52 μm/min at 2.5 min cavitation tests, respectively. While for the 10 min cavitation tests, all MAO coatings were removed and the erosion occurred in the substrate, and five samples had the larger MDER of 4.29, 4.08, 2.36, 4.29 and 4.99 μm/min, respectively.

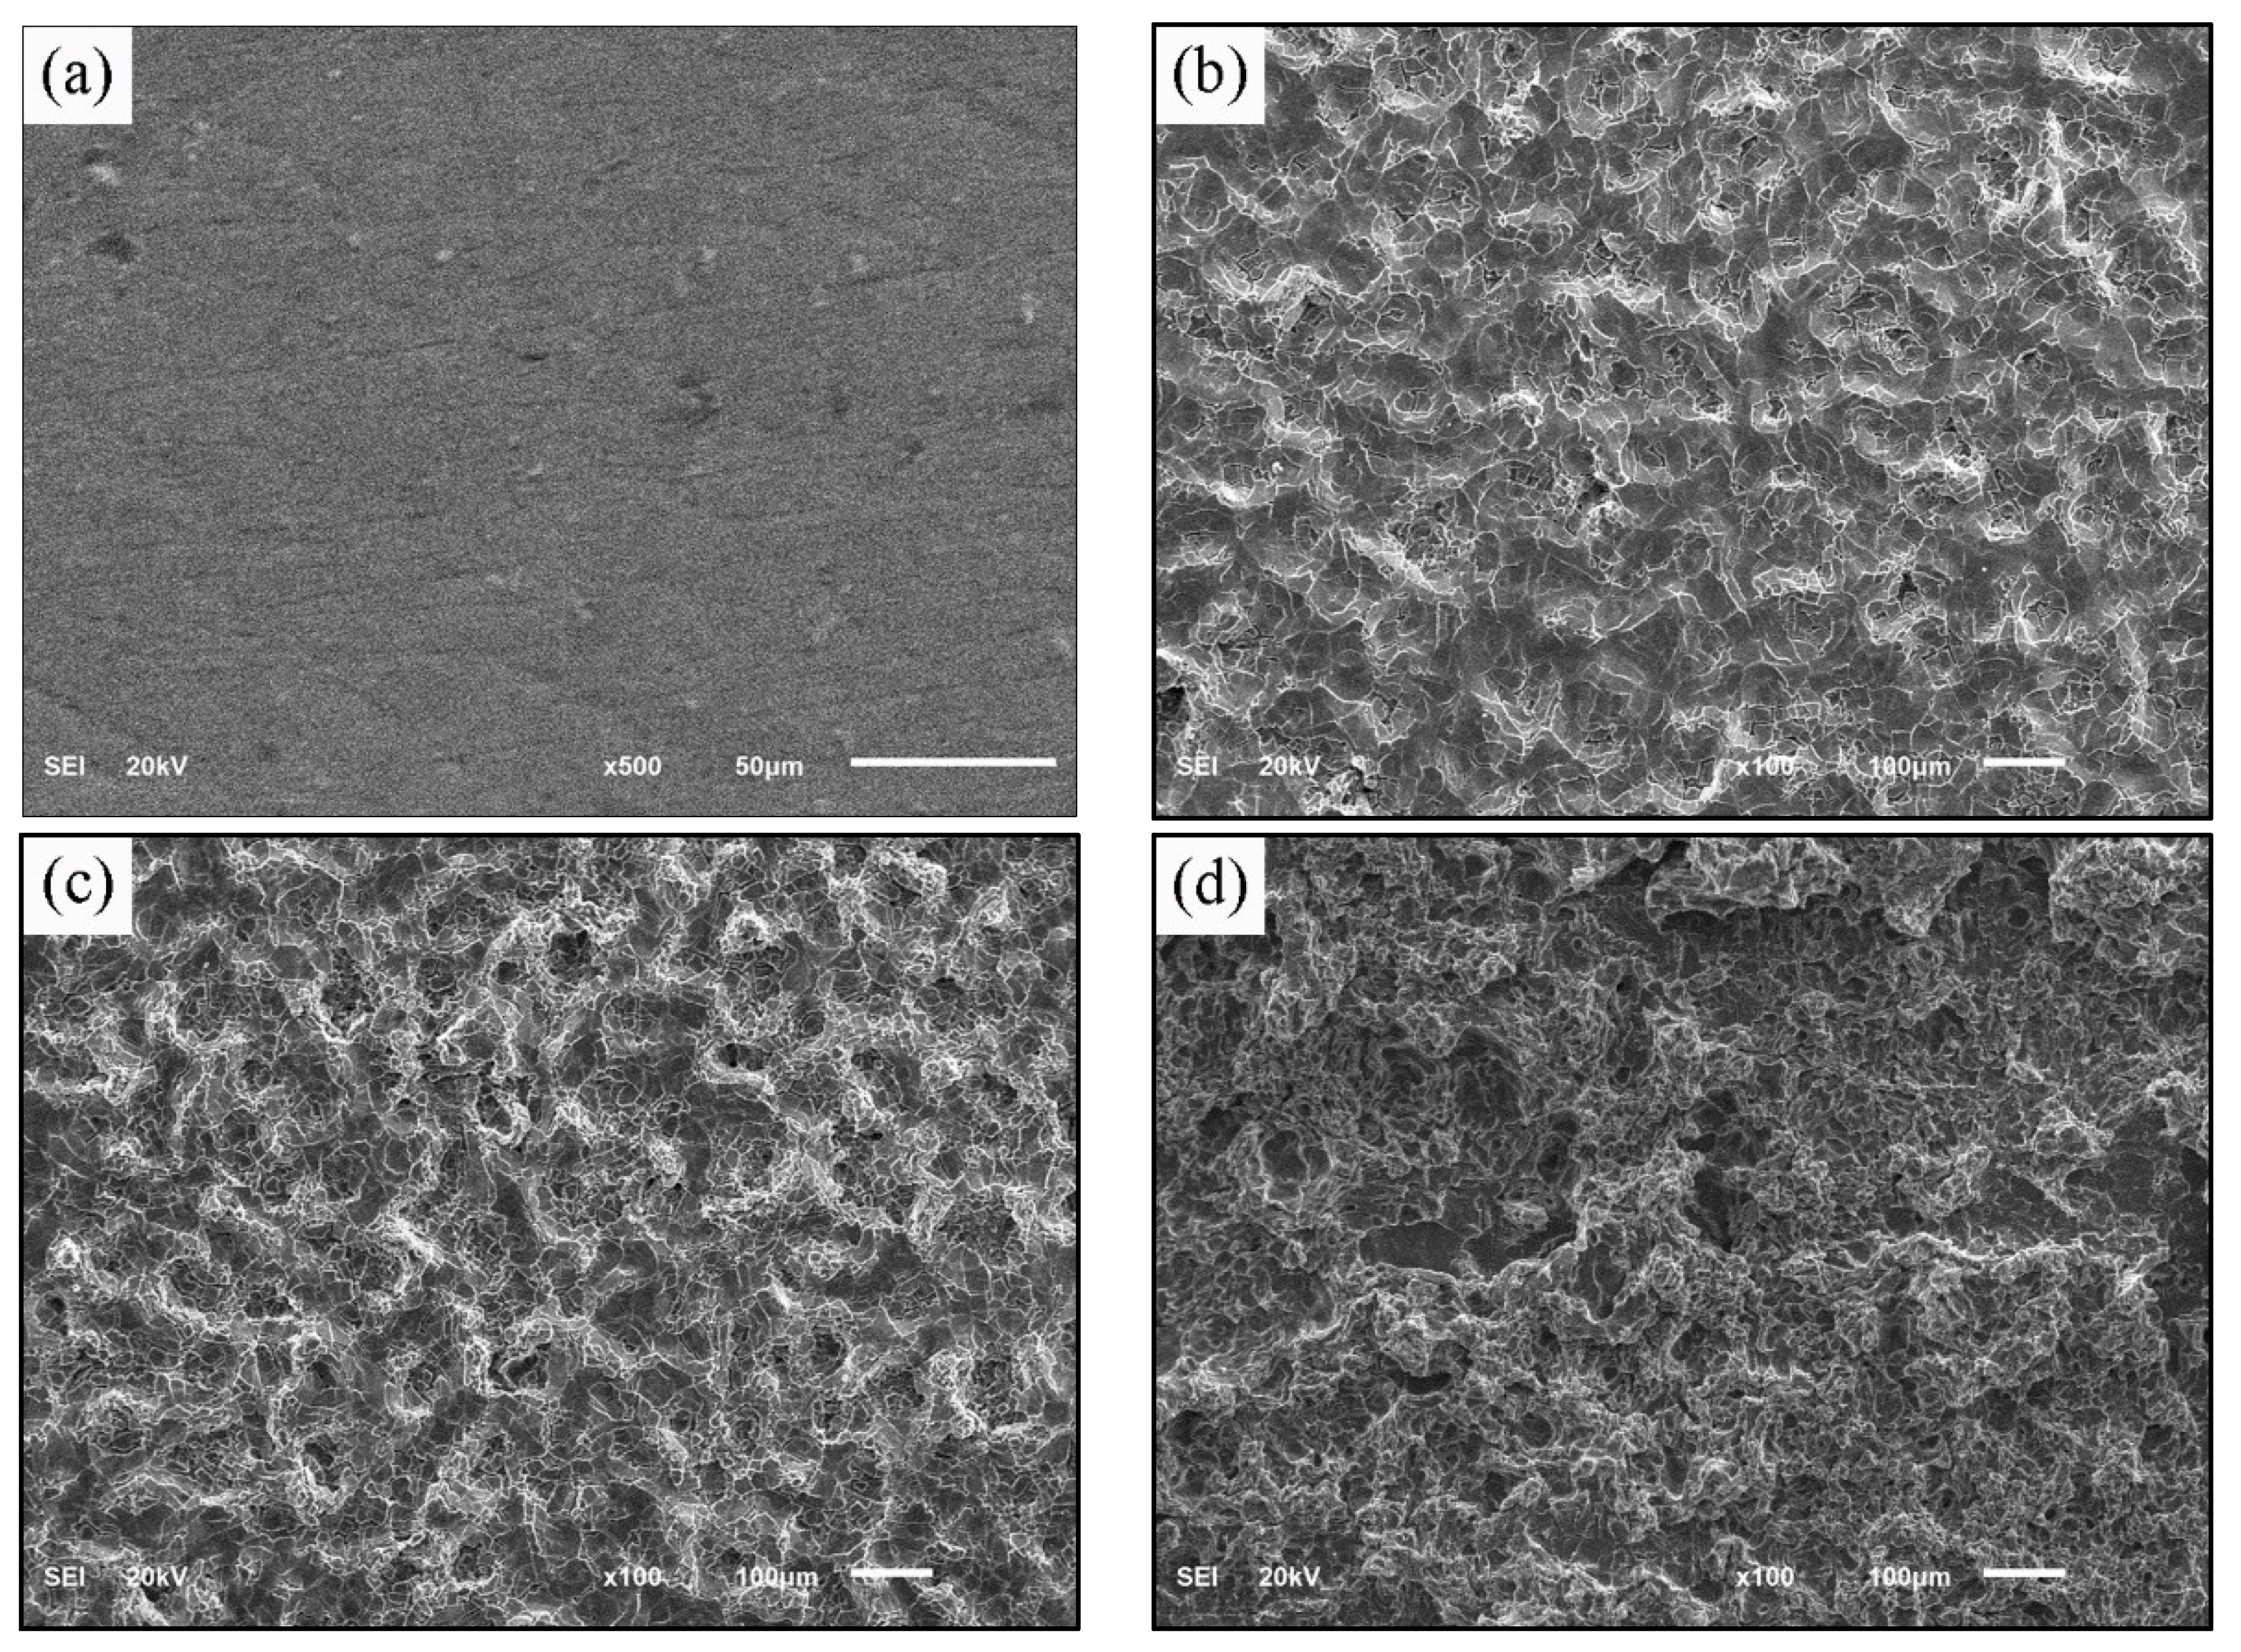
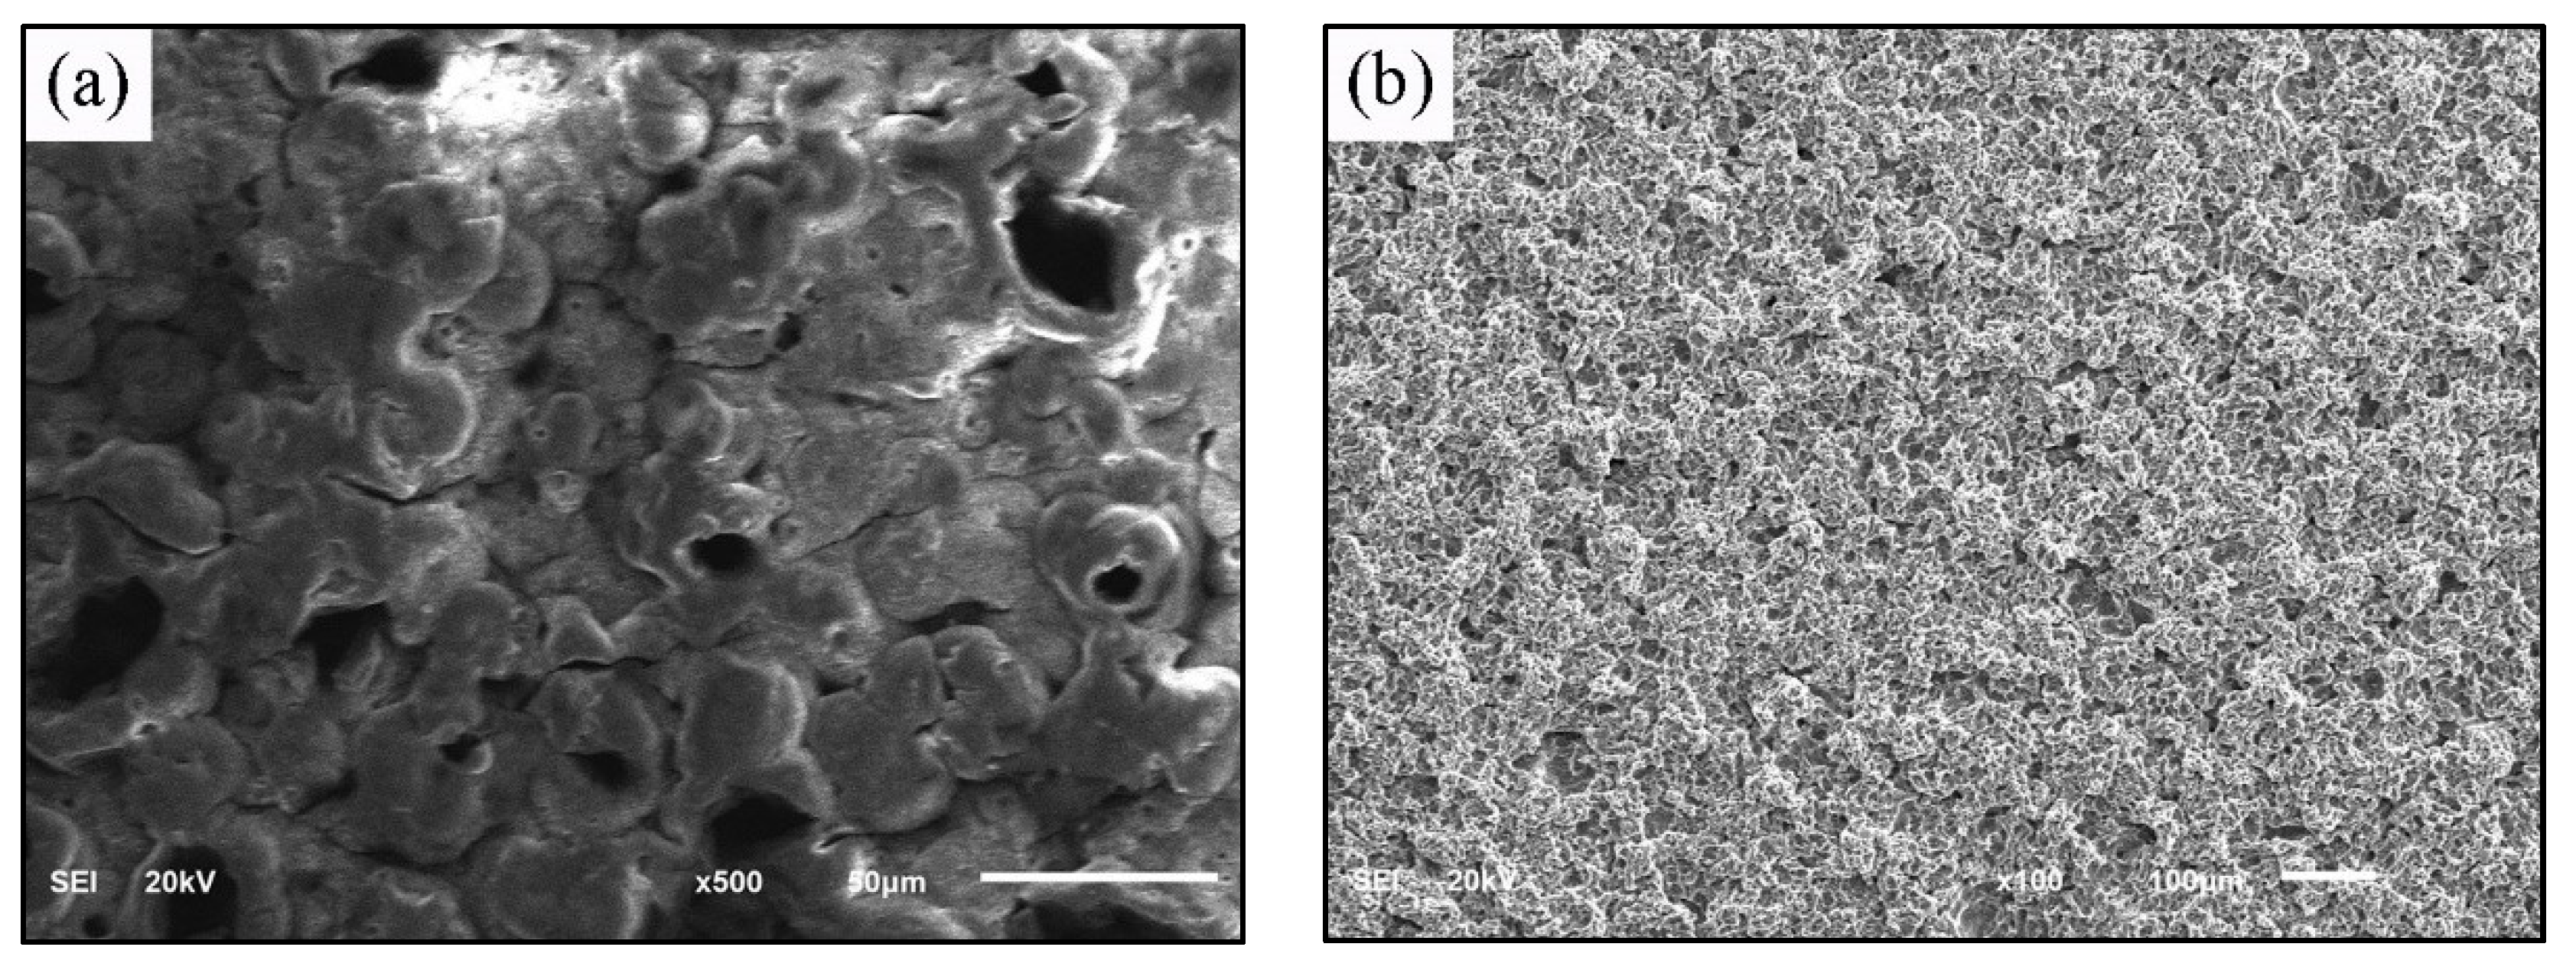
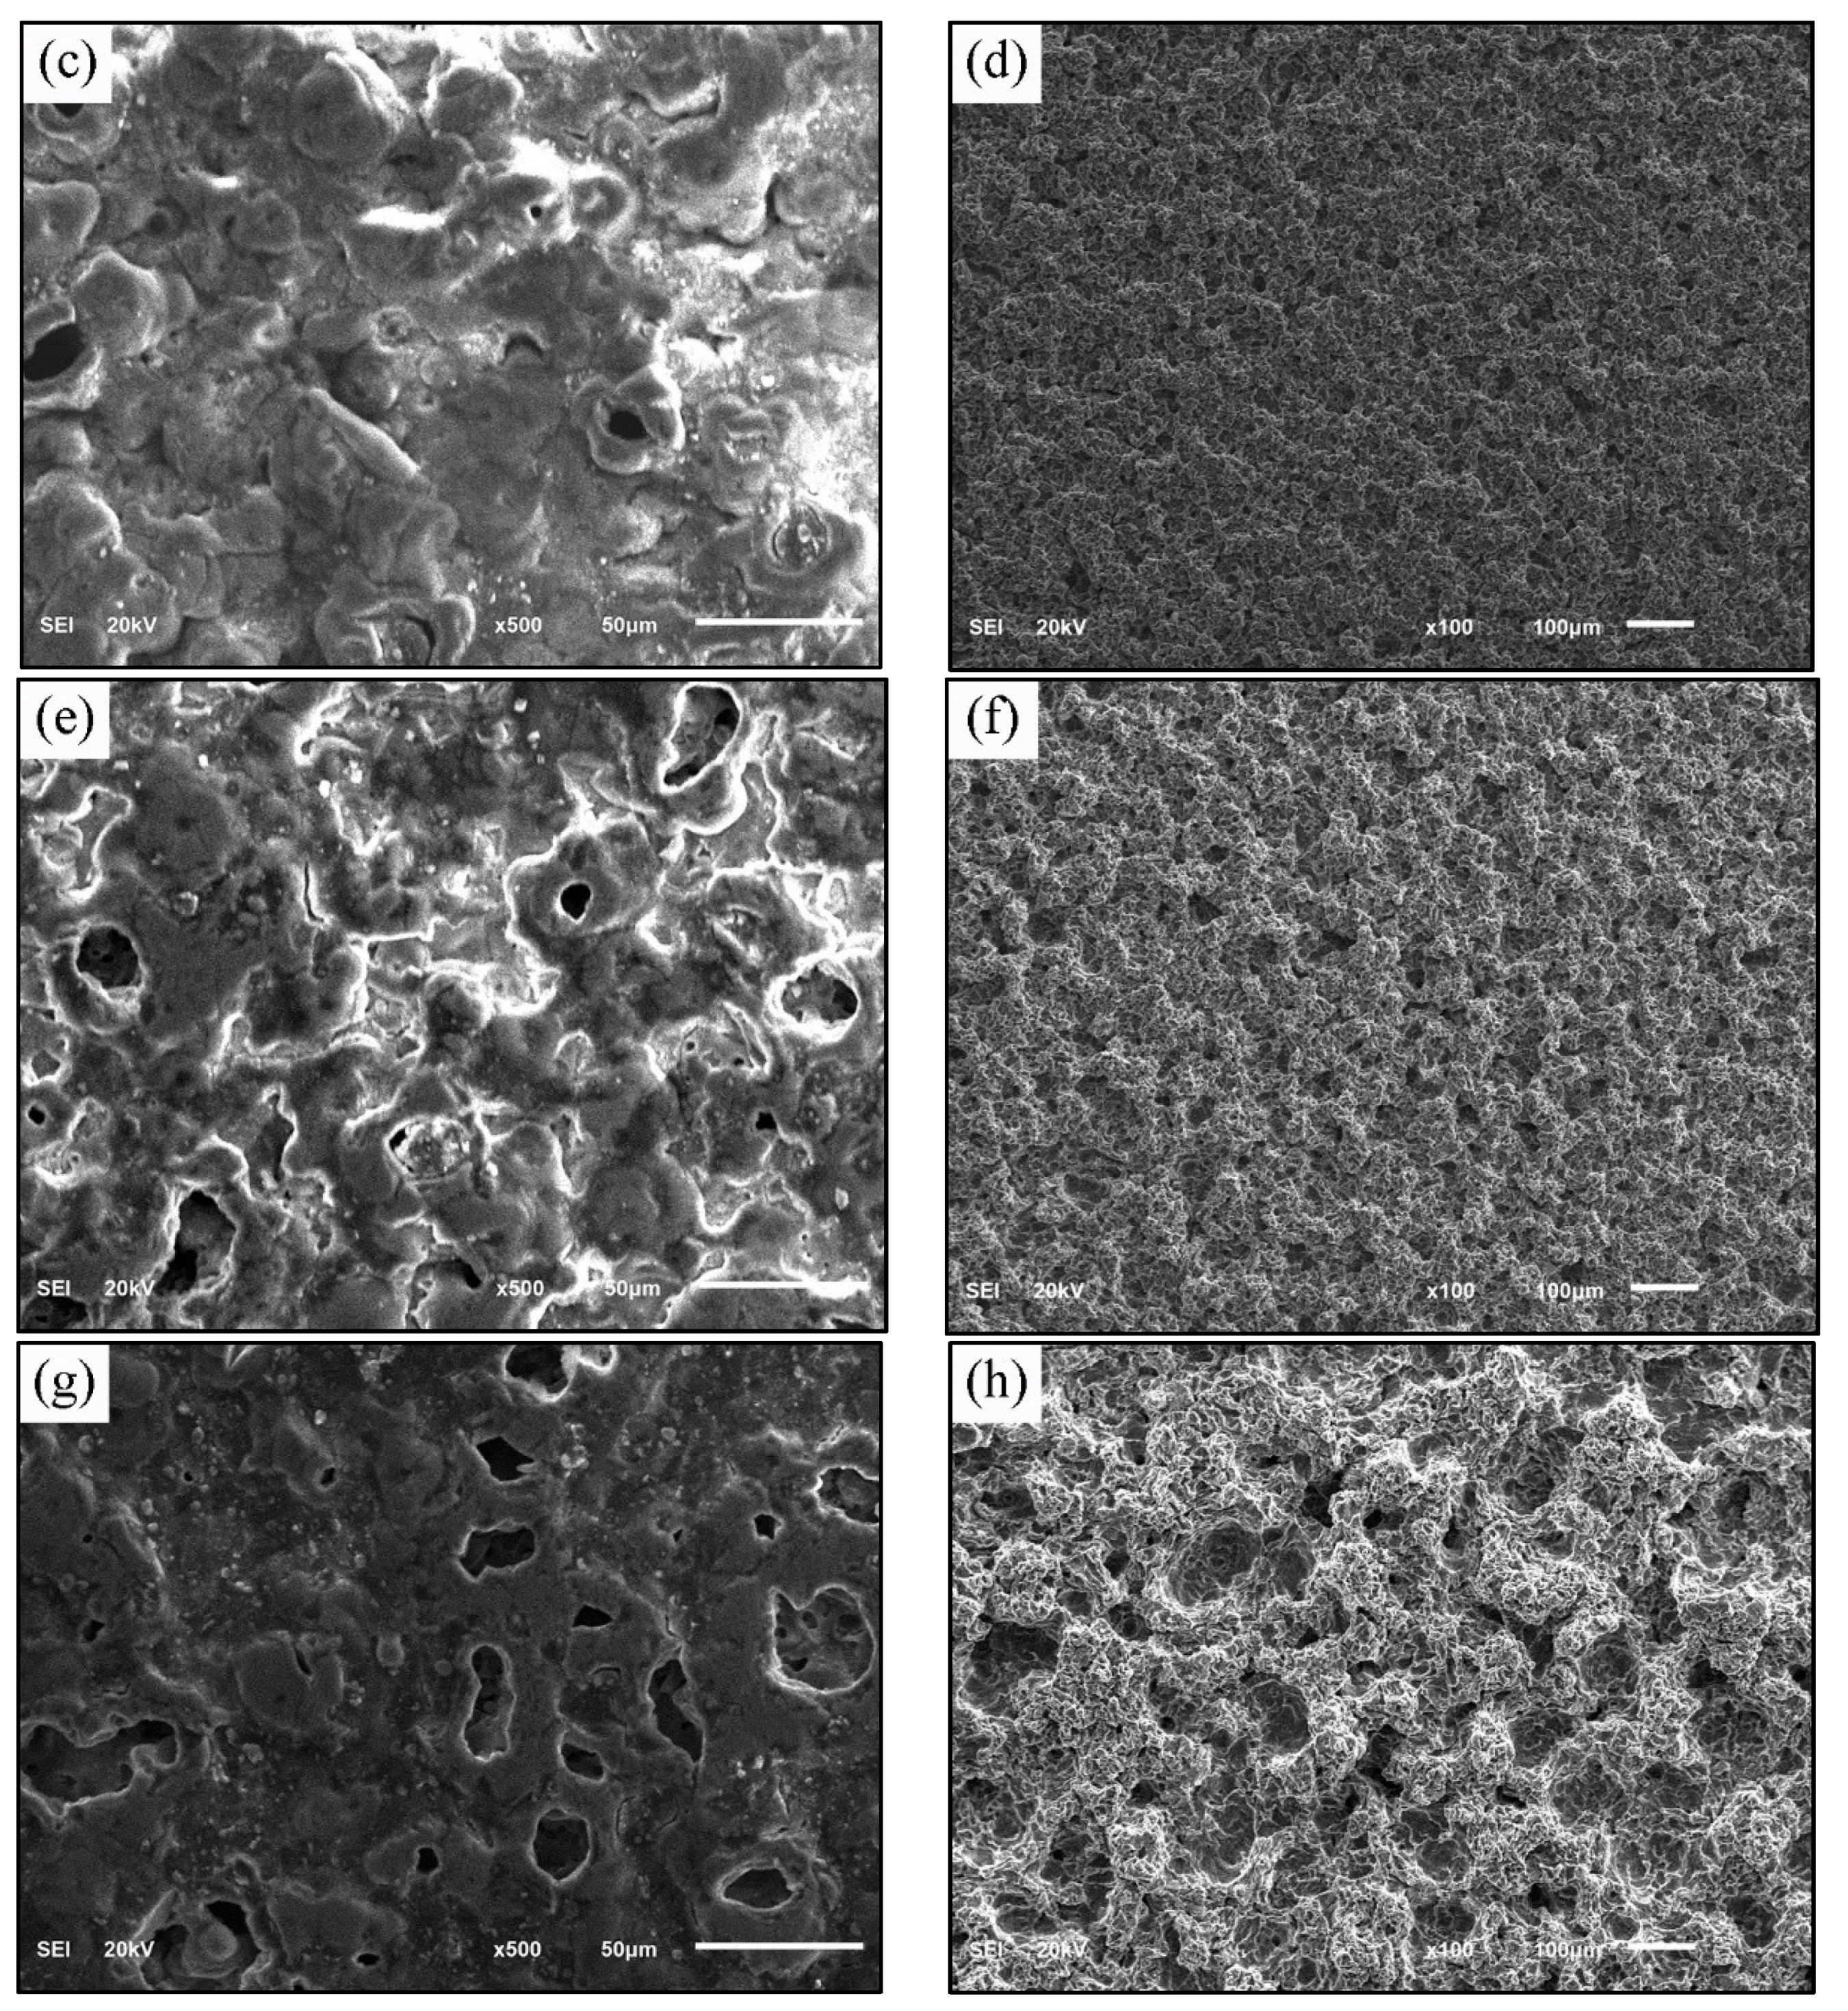
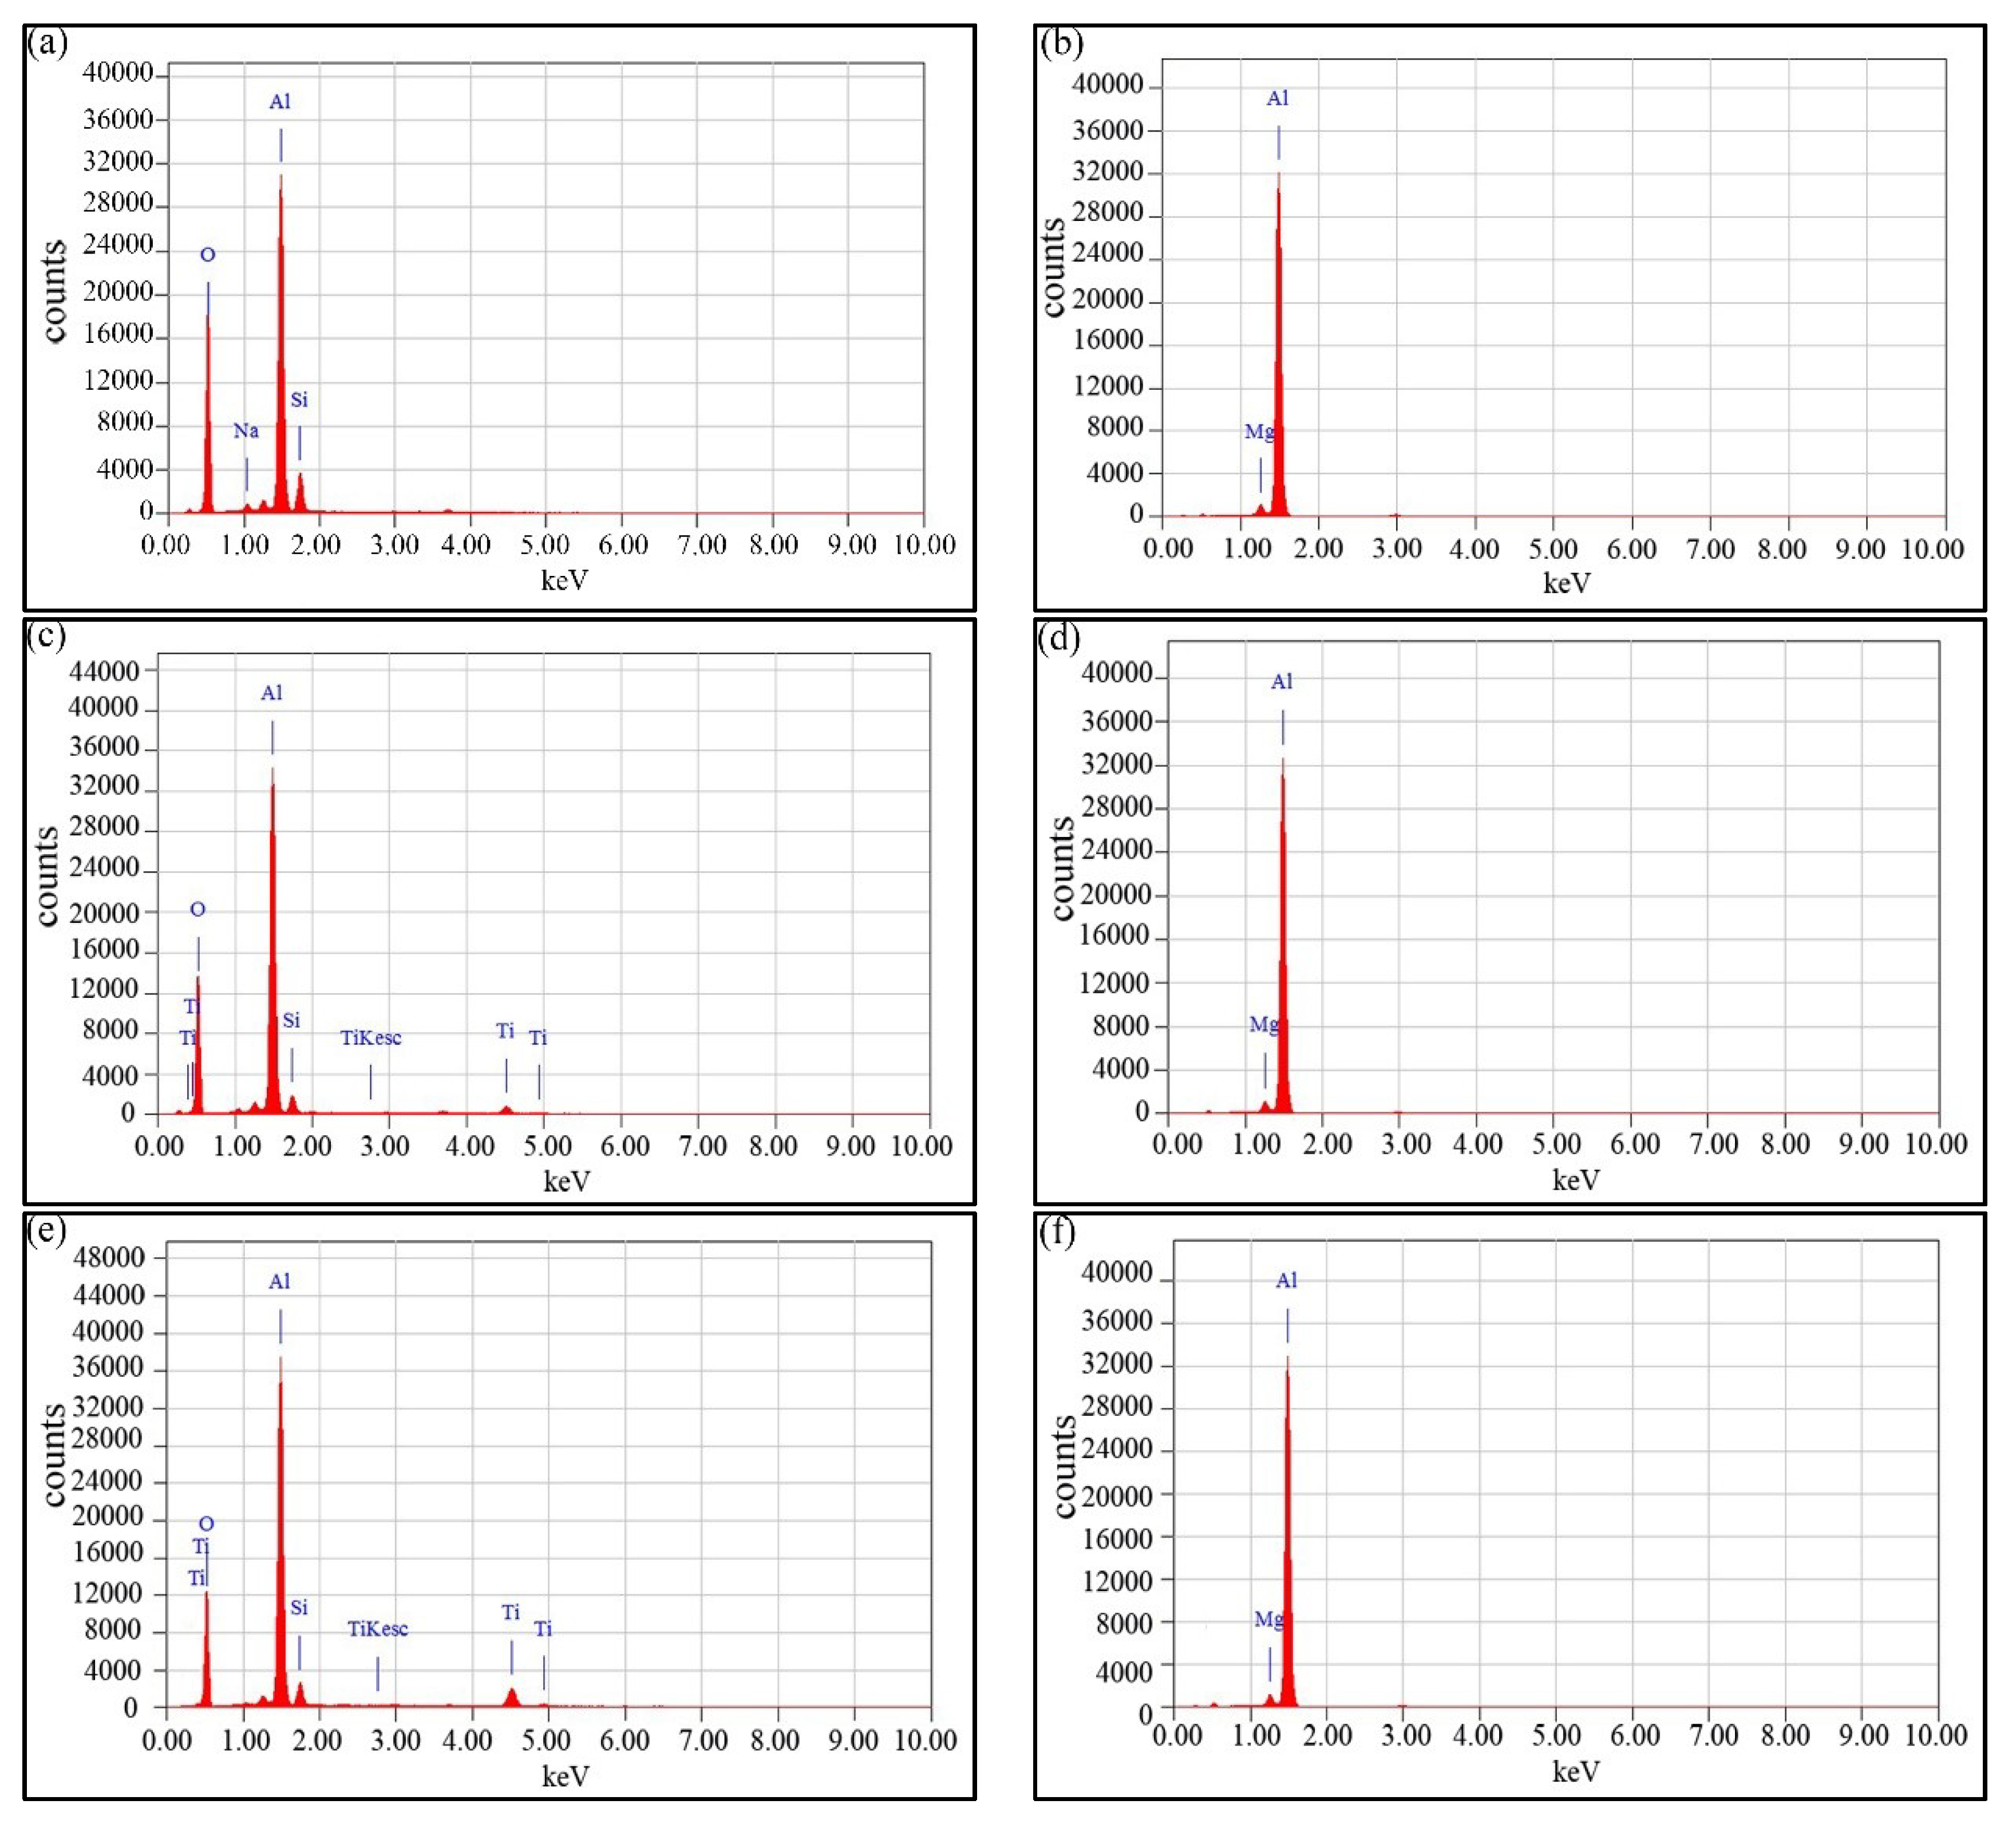
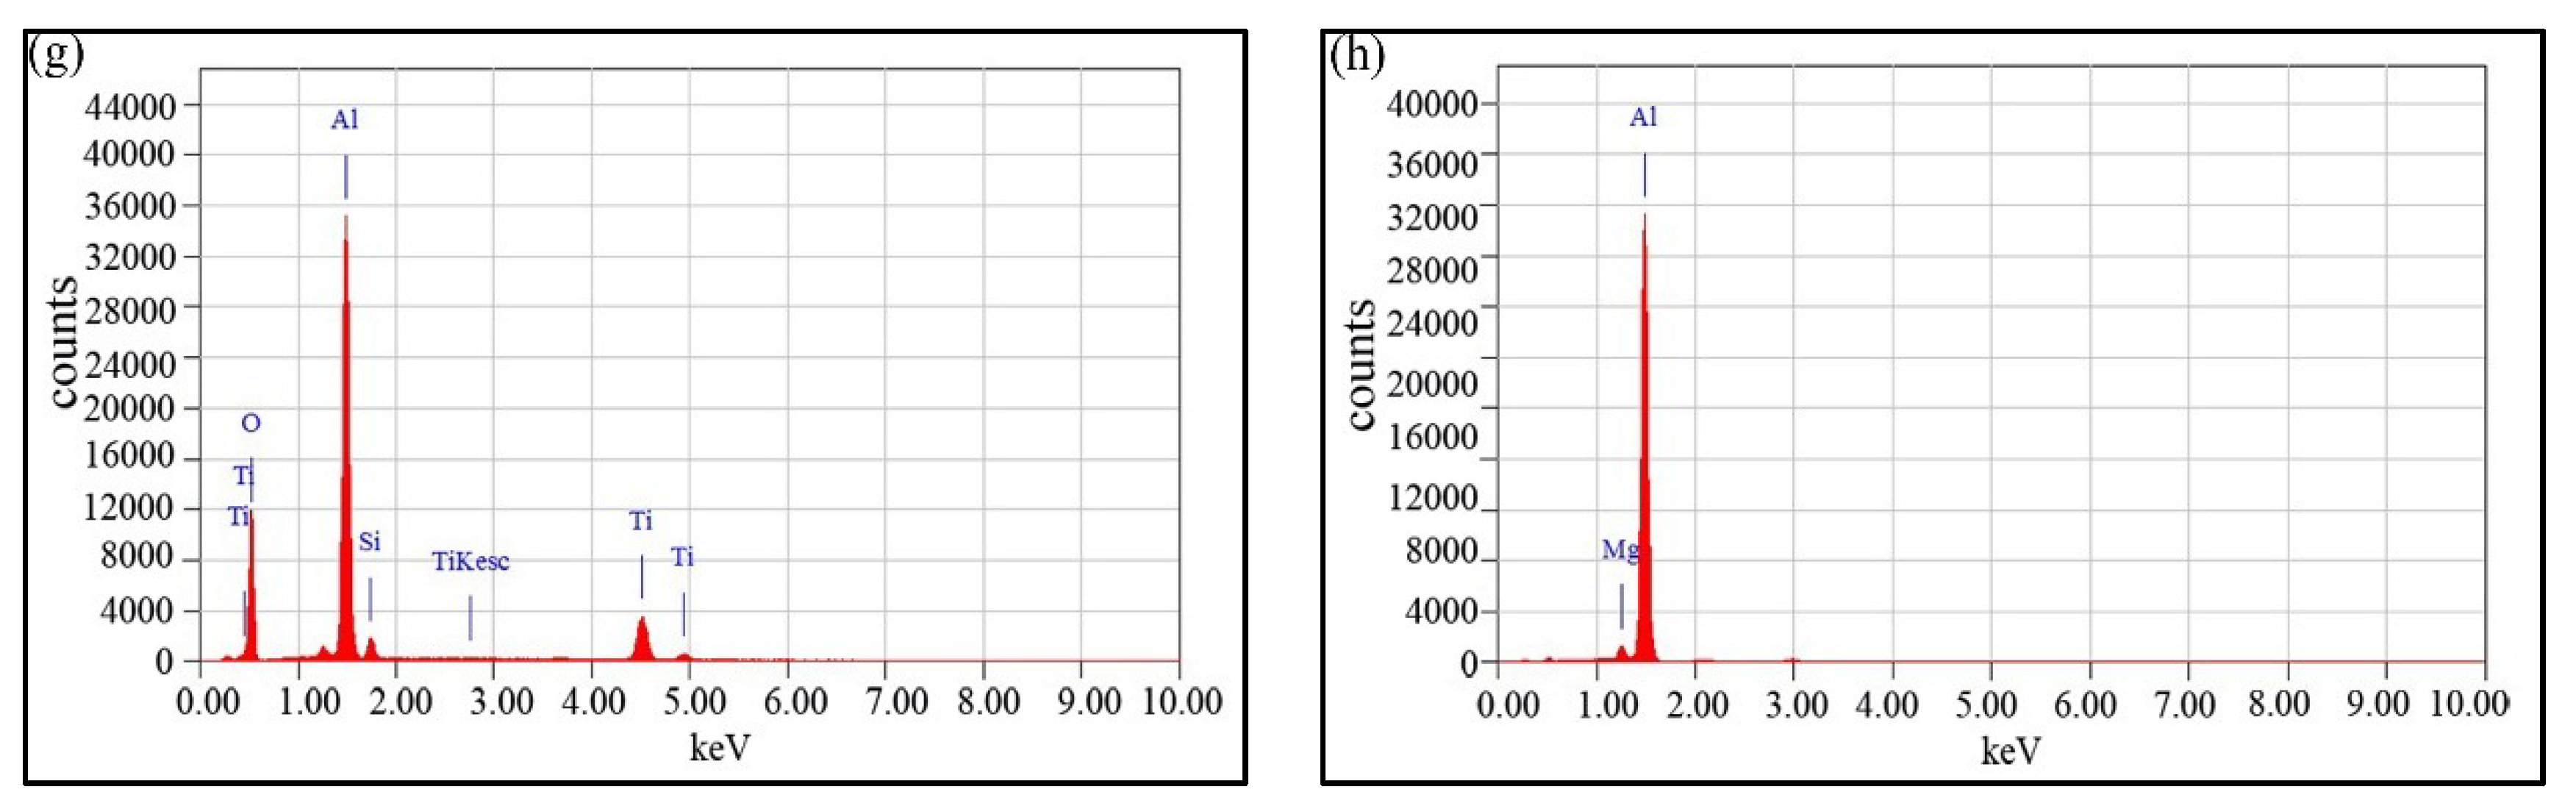
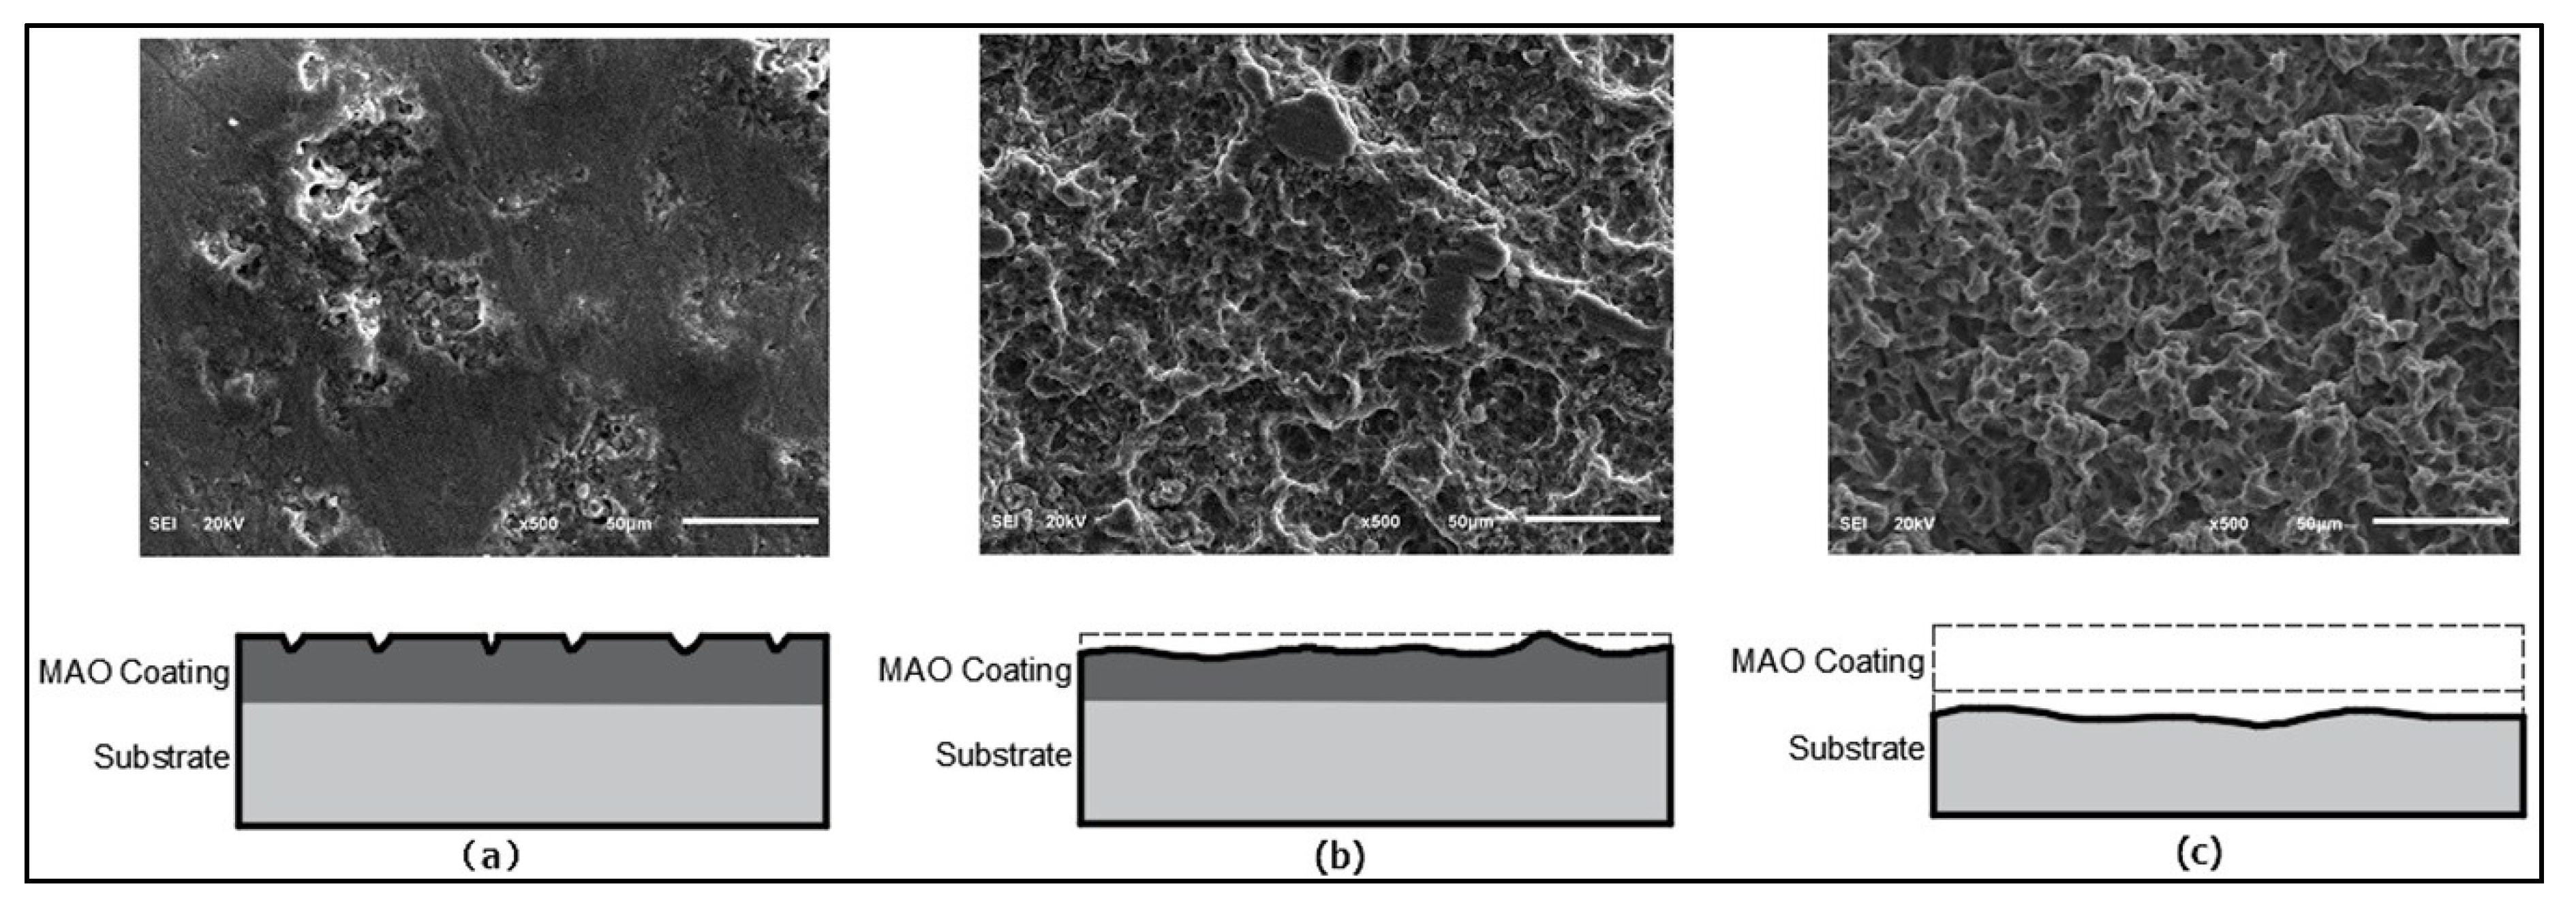
3.2. Surface Topography

Figure 3 gives the damaged area of the Al alloy specimen after a different test time. It is found that the original surface is smooth besides the polished lines in Figure 3a and craters formed (Figure 3b) after being exposed to cavitation erosion for 3 min. Since the 6061 alloy is much softer than the ceramic coatings, work hardening and fracturing occurred in the substrate preferentially after 3 min in Figure 3b. With the continuation of the damage for 6 min, it can be seen that the adjacent craters merged into a large defect and the surface roughness increased. Work hardening and fracturing as well as large craters in the substrate also increased (Figure 3c). As is shown in Figure 3d, after the 10 min test, the Al alloy surface layer was damaged by ductile fracture, and then completely removed. Meanwhile, chippings may be seen on the new surface layers, and are very rough.
Figure 4 shows the SEM images of the typical damaged area of the four specimens before and after 10 min test. It can be seen from Figure 4a,c,e,g that, some micropores which are the spark discharge channels [18] in the micro-arc oxidation process are distributed on the initial surface of the four specimens. The diameter of these pores is in a range of 1–40 μm. When content of TiO2 increases from 3 to 9 g/L, the amount of micropores increases in the MAO coating surface. As shown in Figure 4b,d,f,h, the specimen surfaces are totally eroded after test, and the worn surfaces are characterized as intergranular cracking and detachment of grains owing to fatigue processes initiated by imploding clouds of cavitation bubbles. These worn surfaces show a combination of intergranular and transgranular cracking which resulted in detachment of material from the loaded surface due to fatigue processes. When content of TiO2 is less than 3 g/L, the size of the erosion pits decreases with the increase of content of TiO2. But when content of TiO2 is more than 3 g/L, the size of the erosion pits increases with the increase of TiO2 content. Some continuous large crater characteristics of the MAO coating with 9 g/L TiO2 are apparently different from those of 6 g/L TiO2, 3 g/L TiO2, and 0 g/L TiO2. These erosion pits with the diameters of more than 100 μm are formed on the eroded surfaces (Figure 4h). However, the MAO coating with 3 g/L TiO2 is only fine-scale damaged in form of rough surfaces (Figure 4d), which led to less mass loss than the other MAO coatings, observed in Figure 2a.

3.3. Discussion

The main goal of the study is to investigate the effects of TiO2 additives on cavitation erosion resistance of Al-Mg alloy micro-arc oxidation coatings. To explore this, typical areas in Figure 4a–h are selected and analyzed by EDS. The EDS spectra of the four MAO coating surfaces are shown in Figure 5a–h, and the resulting data are listed in Table 3. It is found in Figure 5a,c,e,g that Al, Si, and O are the main components of the sample, while a small quantity of Ti, Mg, and Na are also detected. These EDS spectra indicate that the Al2O3 phases are the main oxides existing on four MAO coatings before testing. These enhance in hardness with the addition of the reinforcing phase (Table 2). Meanwhile, when the concentration of the additive TiO2 increases from 0 to 9 g/L, the weight concentration of Ti in the MAO coating also increases from 0 to 4.17%. However, when the TiO2 concentration is 3 g/L, the hardness of the MAO-2 coating reaches a higher value of 1000 HV than the other three MAO coatings (see Table 2) due to a lower amount of micropores and higher coating compactness. Consequently, the hardness can have an effect on the cavitation erosion resistance of the MAO coating. Thus, our experimental results in Figure 2b are also verified: At the 5 min cavitation tests in Figure 2, the lower MDER value of the MAO-2 coating is only 1.05 μm/min due to higher hardness of 1000 HV, whereas the higher MDER value of 2.77 μm/min occurred in the MAO-4 coating, whose hardness was only 700 HV. In addition, it can also be seen from Figure 5b,d,f,h that Al and Mg became the main components in the cavitation area of the specimen, and O, Ti, Si, and Na disappeared after the 10 min cavitation test. It can be seen from Table 3 that the weight concentration of Al in the substrate increased after the 10 min cavitation test. A possible reason is that the dealloying of Al in the MAO coating might occur in the cavitation test, leading to the increasing Al content in the substrate. Figure 6 shows the typical progress of erosion with SEM micrographs of the MAO-2 sample after various test time. After the 2.5 min test, some erosion pits (Figure 6a) have formed on the MAO surface, and the weight loss is less than 2 mg. With the increase of the number of pits, removal of the MAO surface gradually extended to almost the whole coating surface (Figure 6b) at the 5 min test. After the 10 min test, the MAO coatings were completely detached and the erosion continued into the 6061 alloy substrate, accelerating cavitation erosion (Figure 6c). Thus, MAO coating detachment is a problem limiting application at this point.

4. Conclusions

  • MAO coatings are fabricated on 6061 aluminum alloy substrates with the micro-arc oxidation technique in silicate electrolytes with different TiO2 nano-additive concentrations. The hardness of MAO coatings range from about 4.7 to 6.7 times higher than that of the substrate.
  • In contrast to aluminum alloy, MAO coatings by adjusting TiO2 nano-additive concentration can decrease the MDER due to the cavitation damage in a short period of time. However, after a certain period of cavitation erosion, MAO coating detachment is still a problem limiting application at this point.
  • Since the hardness of TiO2 is lower than that of ceramic Al2O3, with the increase of TiO2 nano-additive concentration, the compactness and the surface hardness of MAO coatings are decreasing, which can easily lead to larger erosion pits.

Author Contributions

Conceptualization, H.J. and F.C.; Formal Analysis, H.J. and F.C.; Investigation, H.J., F.C. and D.F.; Writing—Original Draft Preparation, H.J. and F.C.; Writing—Review and Editing, H.J. and D.F.

Funding

The authors gratefully acknowledge the support of China Postdoctoral Science Foundation Funded Project through grant No. 2018M630514.

Acknowledgments

The authors would like to express their sincere thanks to Renguo Song from Changzhou University for his assistance in MAO coatings preparation.

Conflicts of Interest

The authors declare no conflict of interest.

References

  1. Feng, D.; Zhang, X.; Liu, S.; Han, N. Effect of grain size on hot deformation behavior of a new high strength aluminum alloy. Rare Met. Mater. Eng. 2016, 45, 2104–2110. (In Chinese) [Google Scholar]
  2. Qiao, Y.; Zhou, Y.; Chen, S.; Song, Q. Effect of bobbin tool friction stir welding on microstructure and corrosion behavior of 6061-T6 aluminum alloy joint in 3.5% NaCl solution. Acta Metall. Sin. 2016, 52, 1395–1402. [Google Scholar] [CrossRef]
  3. Chang, J.T.; Yeh, C.H.; He, J.L.; Chen, K.C. Cavitation erosion and corrosion behavior of Ni–Al intermetallic coatings. Wear 2003, 255, 162–169. [Google Scholar] [CrossRef]
  4. Brennen, C.E. Fundamentals of Multiphase Flows; Cambridge University Press: Cambridge, UK, 2005. [Google Scholar]
  5. Ryl, J.; Wysocka, J.; Slepski, P.; Darowicki, K. Instantaneous impedance monitoring of synergistic effect between cavitation erosion and corrosion processes. Electrochim. Acta 2016, 203, 388–395. [Google Scholar] [CrossRef]
  6. Chen, J.; Wang, Z.; Lu, S. Effects of electric parameters on microstructure and properties of MAO coating fabricated on ZK60 Mg alloy in dual electrolyte. Rare Met. 2012, 31, 172–177. [Google Scholar] [CrossRef]
  7. Wang, S.Y.; Xia, Y.P. Microarc oxidation coating fabricated on AZ91D Mg alloy in an optimized dual electrolyte. Trans. Nonferrous Met. Soc. China 2013, 23, 412–419. [Google Scholar] [CrossRef]
  8. Wang, Z.X.; Lv, W.G.; Chen, J.; Lu, S. Characterization of ceramic coating on ZK60 magnesium alloy prepared in a dual electrolyte system by micro-arc oxidation. Rare Met. 2013, 32, 459–464. [Google Scholar] [CrossRef]
  9. Gnedenkov, S.V.; Khrisanfova, O.A.; Zavidnaya, A.G.; Sinebrukhov, S.L.; Kovryanov, A.N.; Scorobogatova, T.M.; Gordienko, P.S. Production of hard and heat-resistant coatings on aluminium using a plasma micro-discharge. Surf. Coat. Technol. 2000, 123, 24–28. [Google Scholar] [CrossRef]
  10. Xue, W.; Wang, C.; Li, Y.; Deng, Z.; Chen, R.; Zhang, T. Effect of microarc discharge surface treatment on the tensile properties of Al–Cu–Mg alloy. Mater. Lett. 2002, 56, 737–743. [Google Scholar] [CrossRef]
  11. Wang, Z.; Wu, L.; Cai, W.; Shan, A.; Jiang, Z. Effects of fluoride on the structure and properties of microarc oxidation coating on aluminium alloy. J. Alloy. Compd. 2010, 505, 188–193. [Google Scholar] [CrossRef]
  12. Wen, L.; Wang, Y.M.; Zhou, Y.; Guo, L.X.; Ouyang, J.H. Microstructure and corrosion resistance of modified 2024 Al alloy using surface mechanical attrition treatment combined with microarc oxidation process. Corros. Sci. 2011, 53, 473–480. [Google Scholar] [CrossRef]
  13. Cheng, F.; Jiang, S.; Liang, J. Cavitation erosion resistance of microarc oxidation coating on aluminium alloy. Appl. Surf. Sci. 2013, 280, 287–296. [Google Scholar] [CrossRef]
  14. Lu, X.; Blawert, C.; Huang, Y.; Ovri, H.; Zheludkevich, M.L.; Kainer, K.U. Plasma electrolytic oxidation coatings on Mg alloy with addition of SiO2 particles. Electrochim. Acta 2016, 187, 20–33. [Google Scholar] [CrossRef]
  15. Ge, X.; Xia, Y.; Cao, Z. Tribological properties and insulation effect of nanometer TiO2 and nanometer SiO2 as additives in grease Tribology International. Tribol. Int. 2015, 92, 454–461. [Google Scholar] [CrossRef]
  16. Li, H.; Song, R.; Ji, Z. Effects of nano-additive TiO2 on performance of micro-arc oxidation coatings formed on 6063 aluminum alloy. Trans. Nonferrous Met. Soc. China 2013, 23, 406–411. [Google Scholar] [CrossRef]
  17. ASTM G32-06 Standard Test Method for Cavitation Erosion Using Vibratory Apparatus; ASTM: West Conshohocken, PA, USA, 2009.
  18. Liu, W.; Liu, W.; Bao, A. Structure and properties of ceramic coatings formed on 7N01 alloys by microarc oxidation. Procedia Eng. 2012, 27, 828–832. [Google Scholar] [CrossRef]
Figure 1. Schematic of vibratory cavitation test rig.
Coatings 09 00521 g001
Figure 2. The test curves of the five samples. (a) Mass loss, (b) mean depth of erosion (MDER).
Coatings 09 00521 g002
Figure 3. The damaged area of the Al alloy specimen after different test times. (a) before test; (b) after 3 min test; (c) after 6 min test; (d) after 10 min test.
Coatings 09 00521 g003
Figure 4. The SEM images of the typical damaged area of the four specimens before and after 10 min test. (a) micro-arc oxidation (MAO)-1 before test; (b) MAO-1 after test; (c) MAO-2 before test; (d) MAO-2 after test; (e) MAO-3 before test; (f) MAO-3 after test; (g) MAO-4 before test; (h) MAO-4 after test.
Coatings 09 00521 g004aCoatings 09 00521 g004b
Figure 5. The energy dispersive spectroscopy (EDS) analysis of MAO coating surfaces before and after test. (a) Figure 4a; (b) Figure 4b; (c) Figure 4c; (d) Figure 4d; (e) Figure 4e; (f) Figure 4f; (g) Figure 4g; (h) Figure 4h.
Coatings 09 00521 g005aCoatings 09 00521 g005b
Figure 6. The typical progress of erosion with SEM micrographs of the MAO-2 sample after various test times. (a) 2.5 min; (b) 5 min; (c) 10 min.
Coatings 09 00521 g006
Table 1. Chemical composition of the 6061 alloy (wt.%).
AlCuMnMgZnCrTiSiFe
96.75%0.2%0.15%1.0%0.25%0.2%0.15%0.6%0.7%
Table 2. The process parameters employed in this study.
No.Concentration of TiO2
(g/L)
Constant Current
(A/dm2)
Pulse Width
(ms)
Time
(min)
Coating Thickness
(μm)
Roughness
(μm)
Hardness
(HV)
MAO-105.02.550100.2800
MAO-235.02.550100.21000
MAO-365.02.550100.2900
MAO-495.02.550100.2700
6061polished using grade 5000 emery papers0.2150
Table 3. Weight concentration (wt.%) of MAO coating surfaces before and after test.
SpecimenAlMgSiNaOTi
MAO-1 (Figure 4a)34.175.350.7959.69
MAO-1 (Figure 4b)98.811.19
MAO-2 (Figure 4c)40.032.4955.442.03
MAO-2 (Figure 4d)99.10.9-
MAO-3 (Figure 4e)41.411.7953.683.13
MAO-3 (Figure 4f)98.851.15-
MAO-4 (Figure 4g)38.841.5650.434.17
MAO-5 (Figure 4h)98.751.25

